Analysis of the Genetic Relationship and Inbreeding Coefficient of the Hetian Qing Donkey through a Simplified Genome Sequencing Technology
Abstract
:1. Introduction
2. Materials and Methods
2.1. Test Animals
2.2. GBS Test Flow Method
2.2.1. DNA Extraction
2.2.2. Construction of the GBS Library
2.3. Data Statistics and Analysis
2.3.1. Sequencing Data Quality Control
2.3.2. SNP Detection and Quality Control
2.3.3. Genetic Diversity Analysis
2.3.4. Inbreeding Coefficient Analysis Based on Long Homozygous Fragments
2.3.5. Genetic Relationship Analysis of Population Genome
2.3.6. Cluster Analysis to Construct the Hetian Qing Donkey Family
3. Results
3.1. Genomic DNA Detection
3.2. Sequencing Data Output and Quality Control
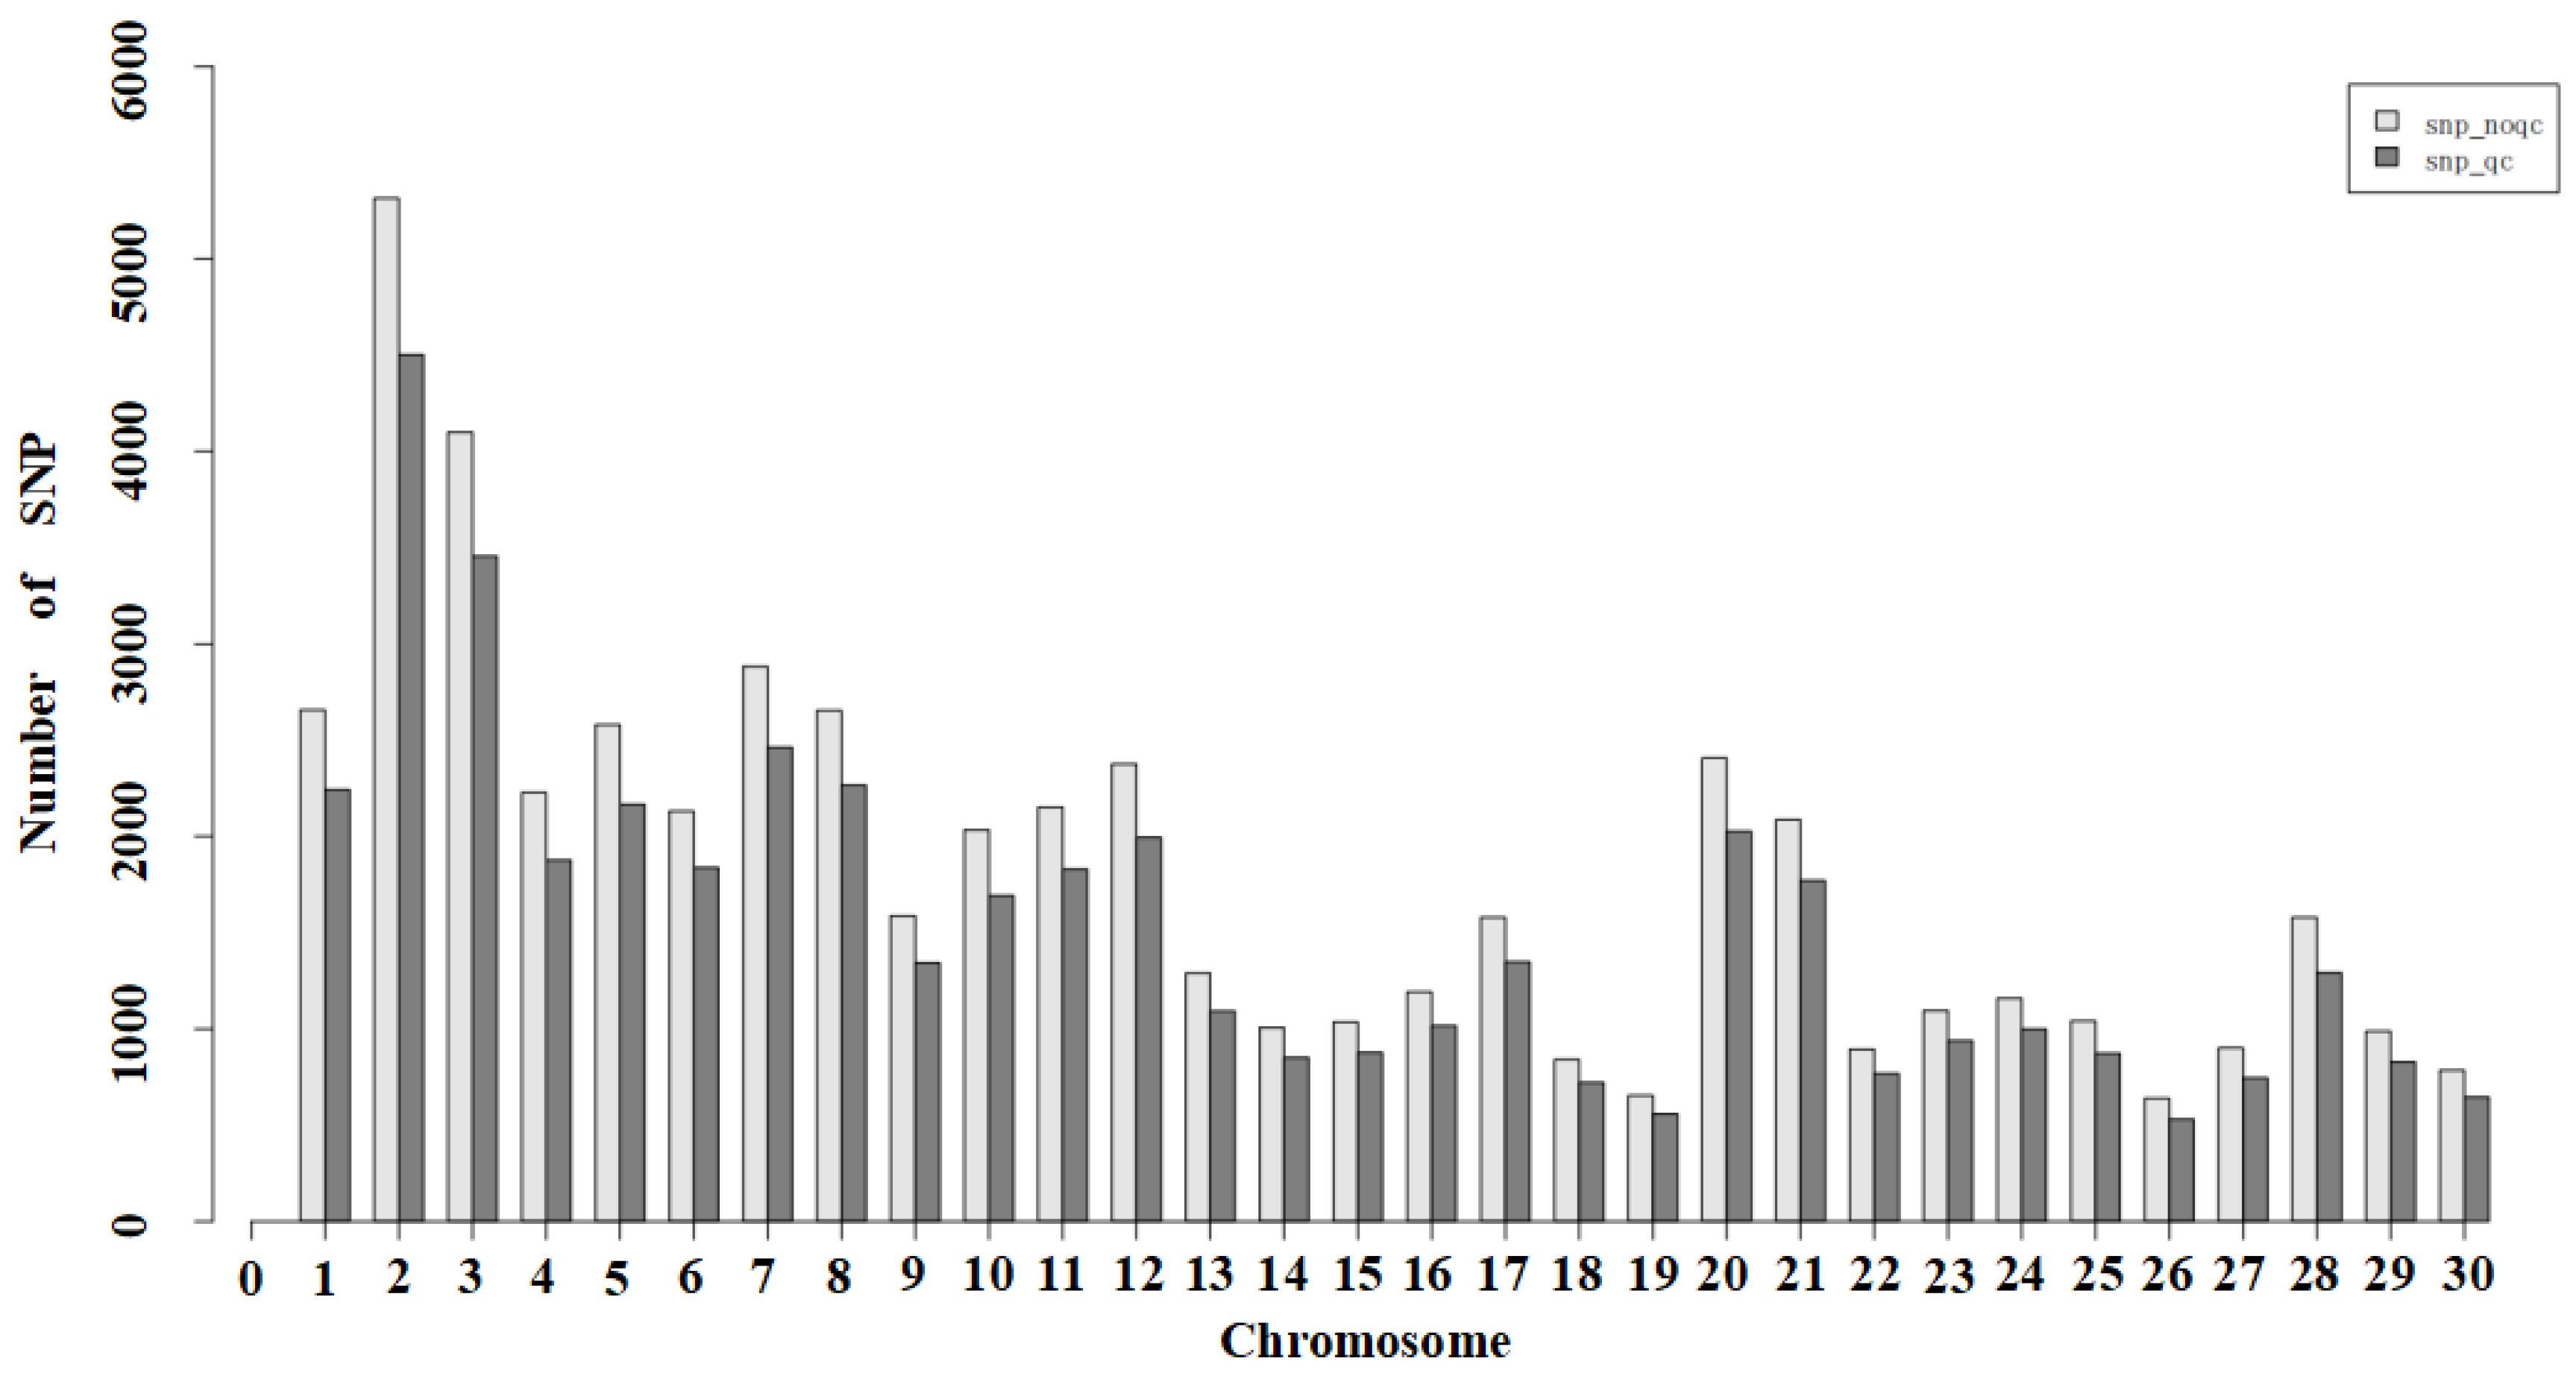
3.3. SNP Locus Quality Control
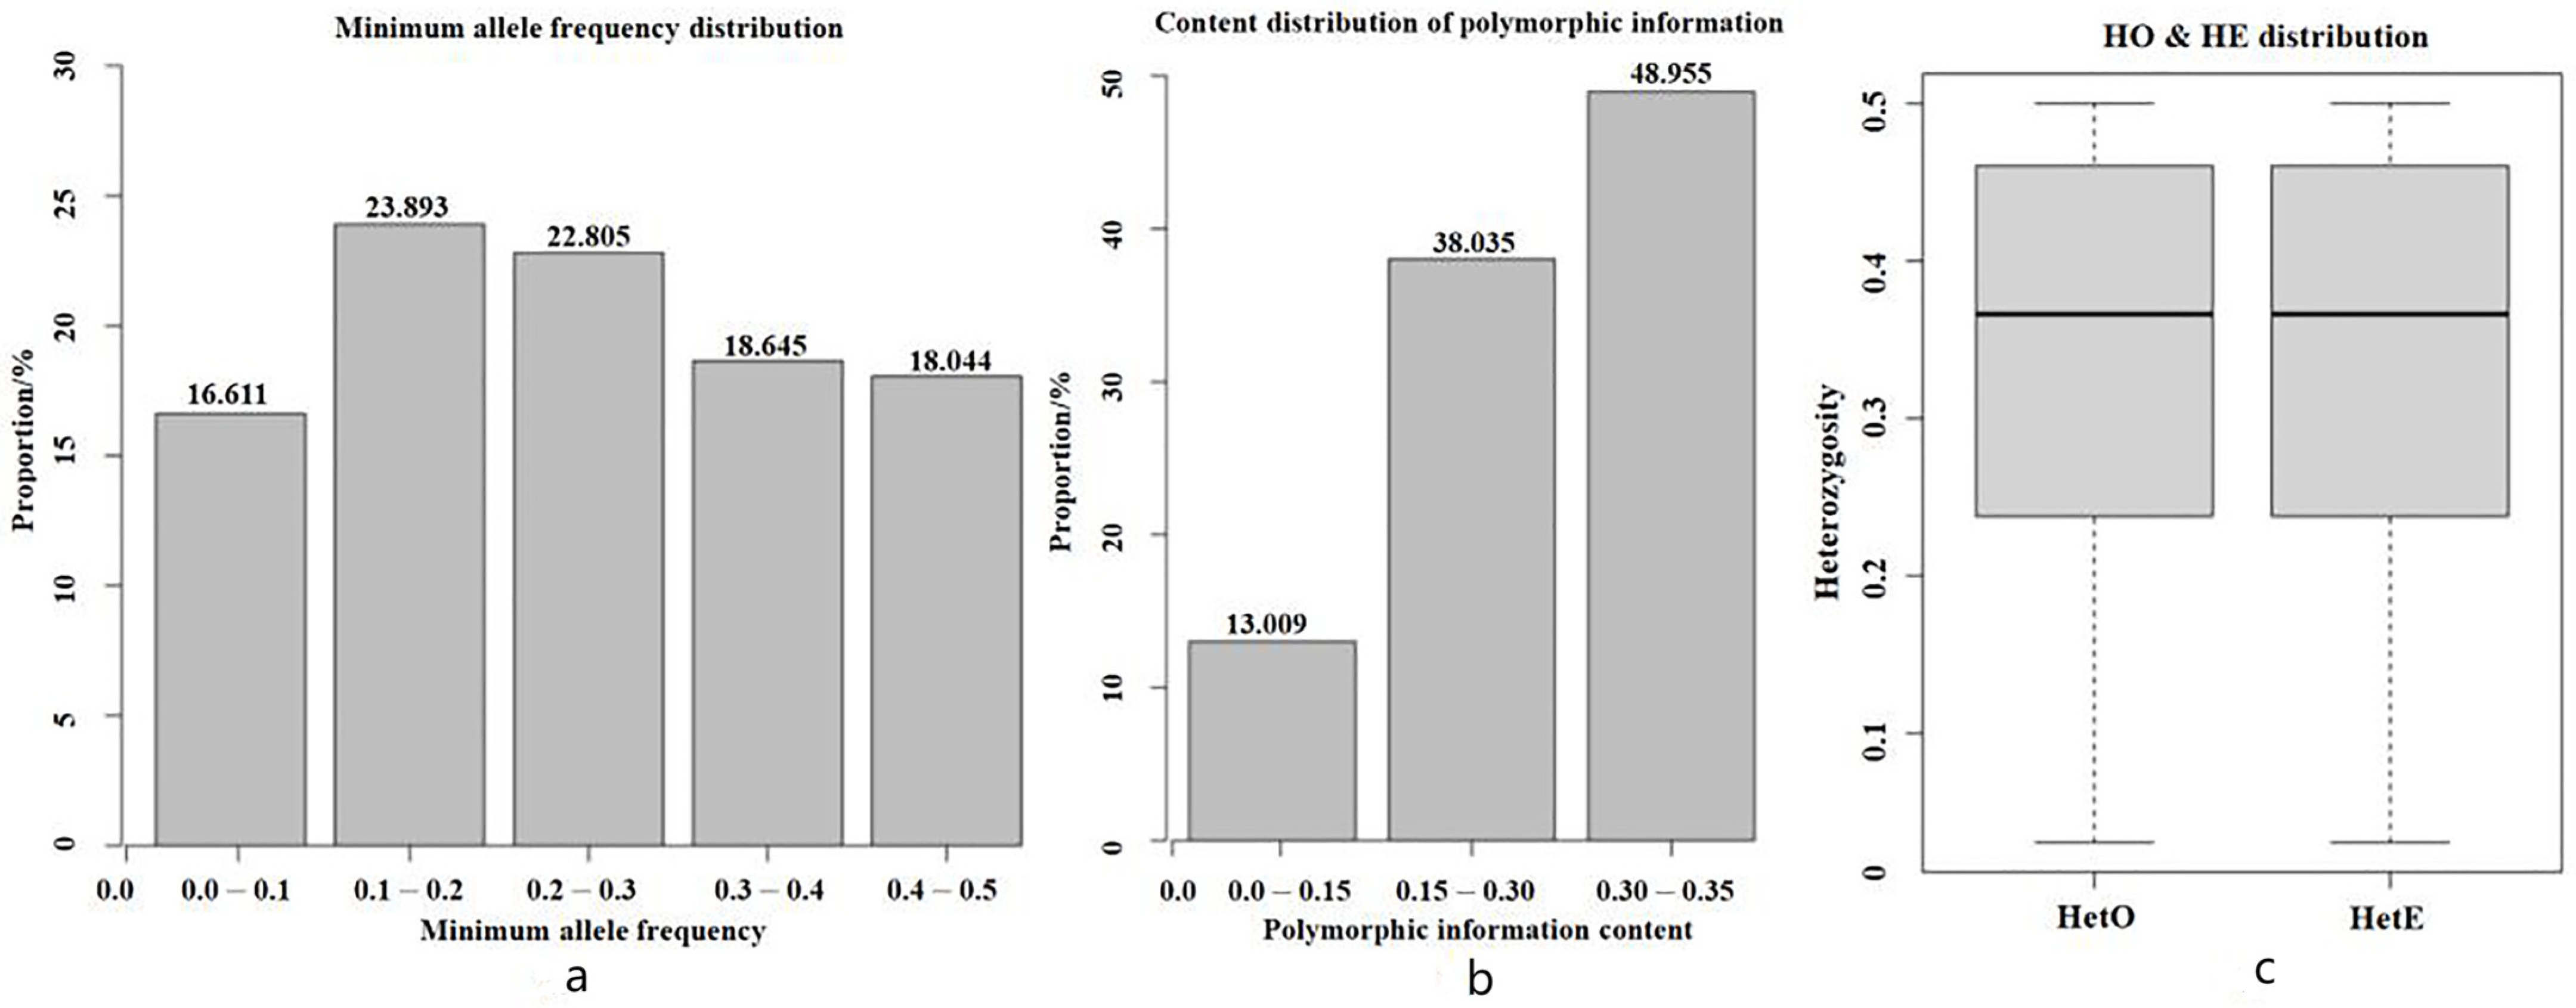
3.4. Genetic Diversity and Population Structure Analysis
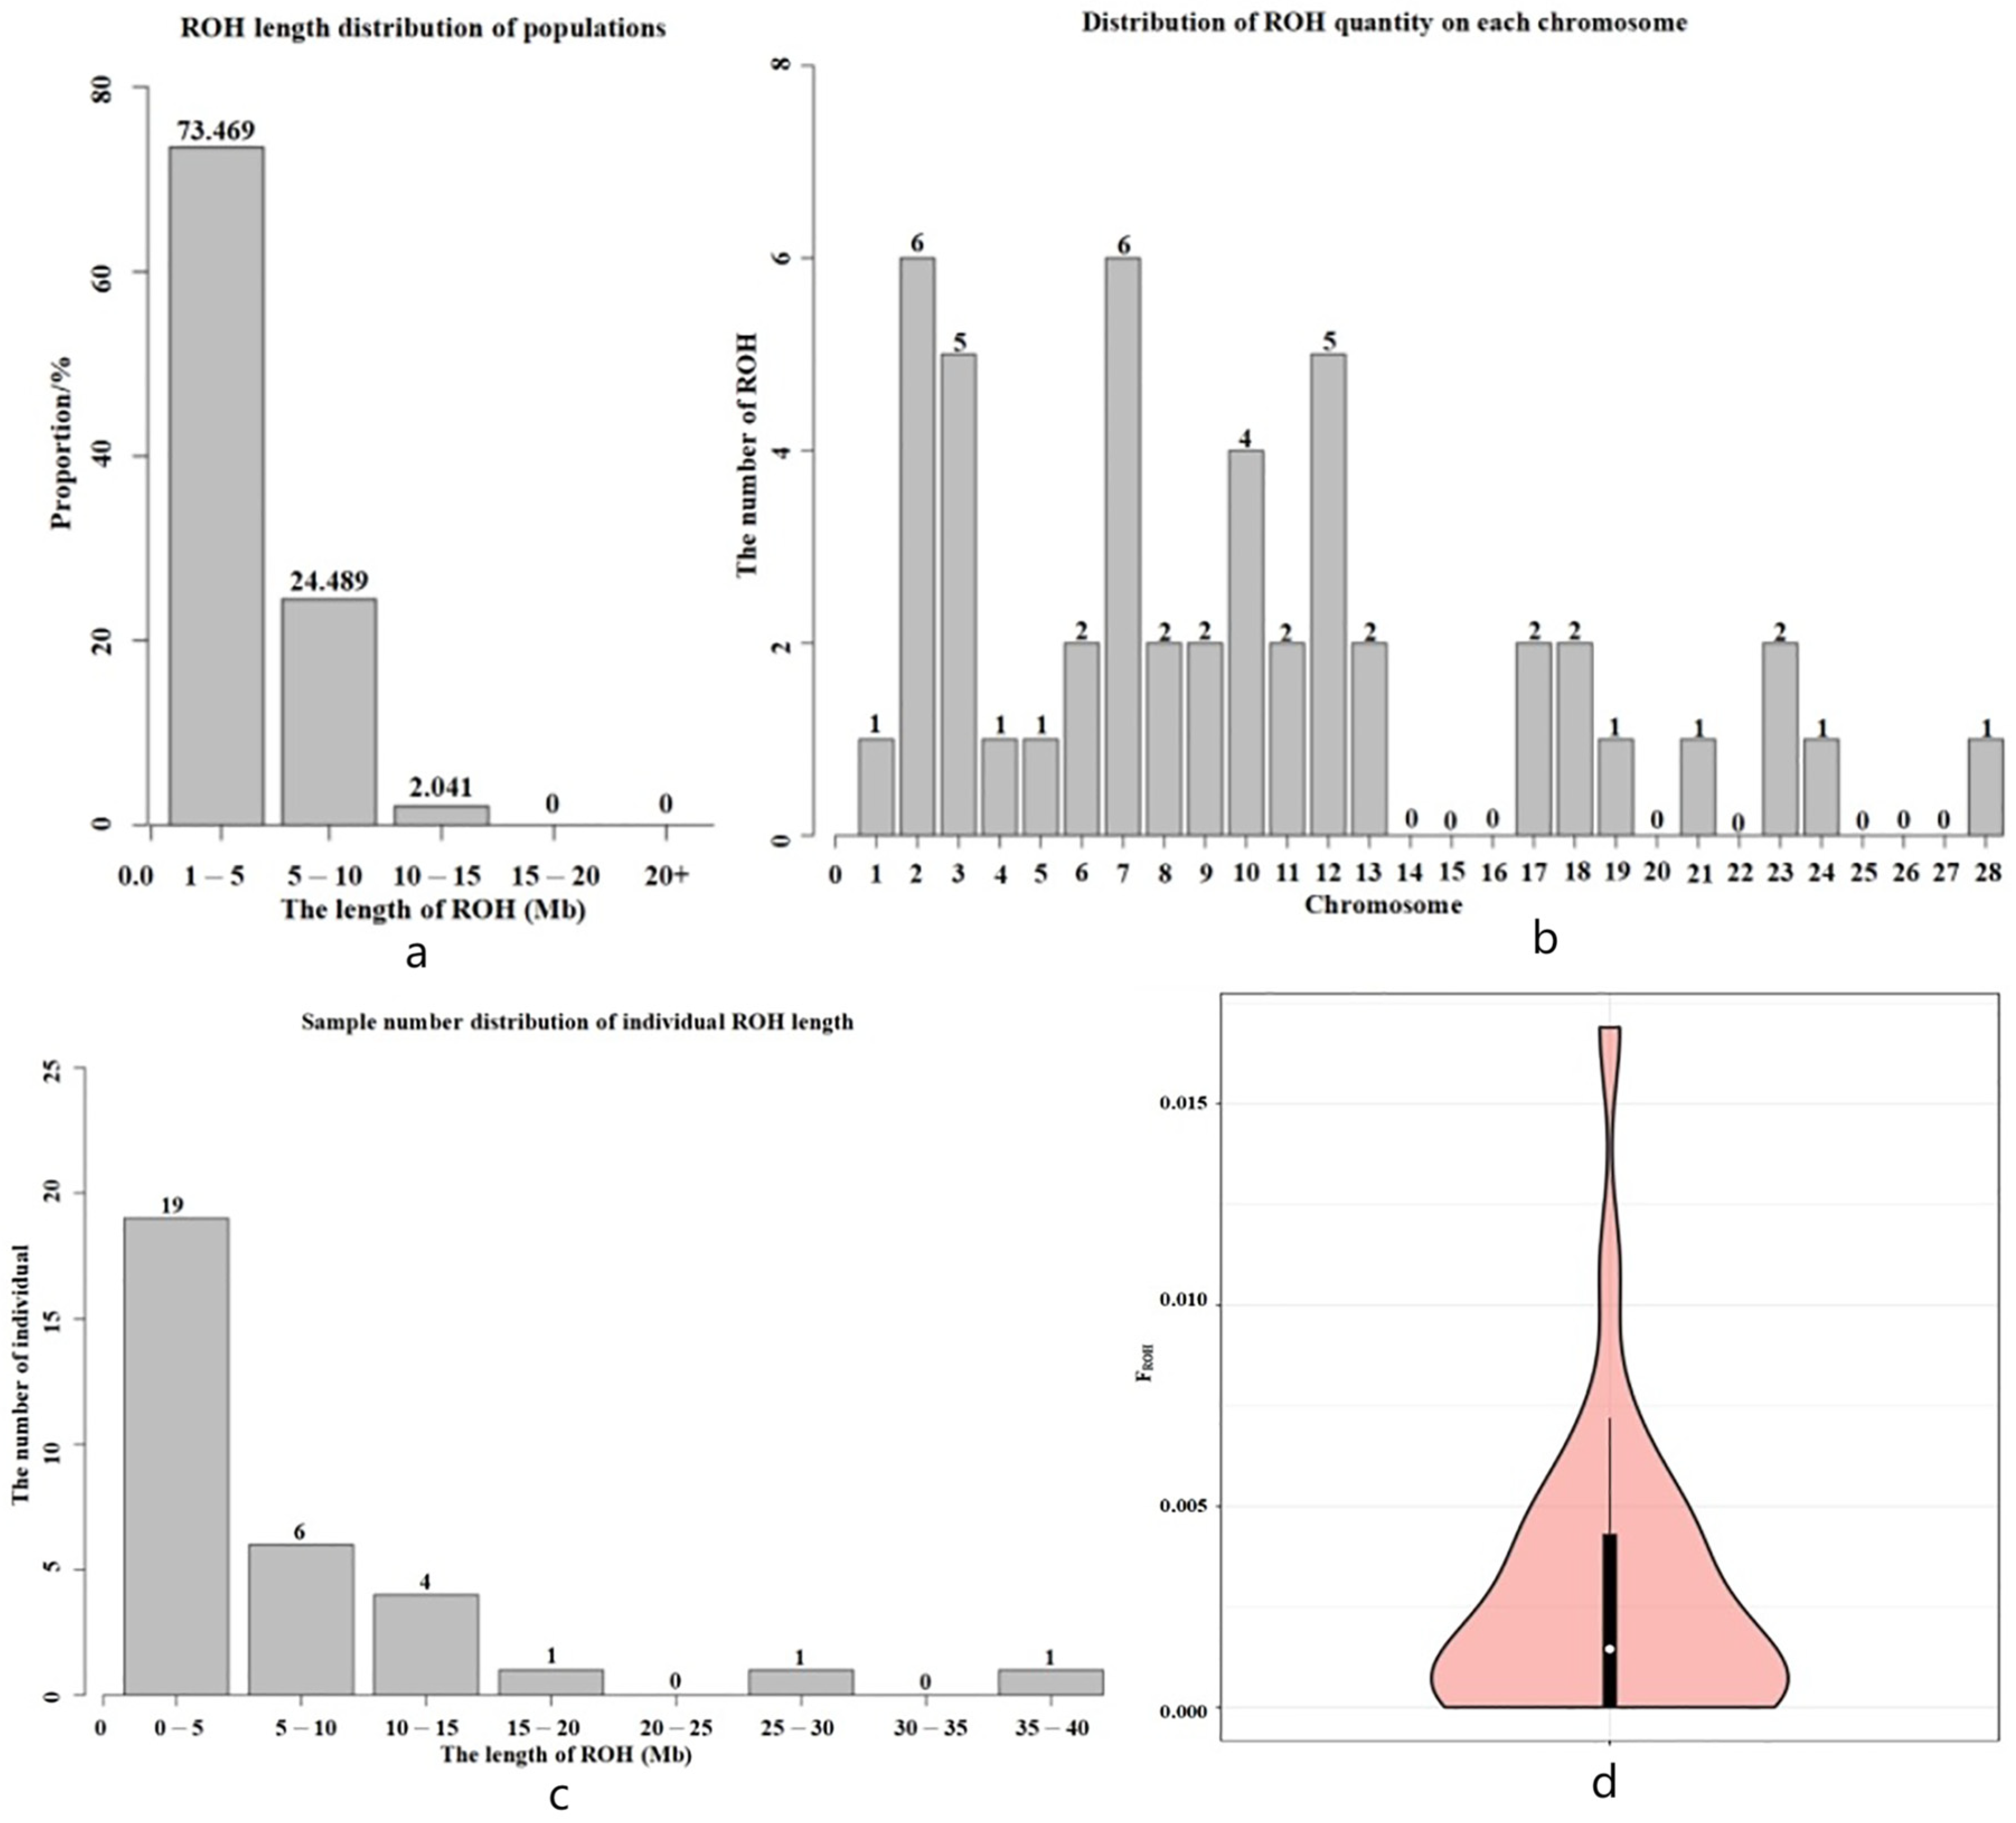
3.5. Inbreeding Coefficient Analysis Based on Long Homozygous Segments
3.6. Analysis of Genetic Relationship of Population Genome
Kinship Analysis Based on G Matrix
3.7. Cluster Analysis to Construct the Families in the Hetian Qing Donkey Population
Cluster Analysis
3.8. Family Structure Analysis of Hetian Qing Donkey Population
4. Discussion
4.1. Genetic Diversity Analysis
4.2. Analysis of Inbreeding Degree
4.3. Analysis of Genetic Relationship and Genetic Structure
5. Conclusions
Author Contributions
Funding
Institutional Review Board Statement
Informed Consent Statement
Data Availability Statement
Conflicts of Interest
References
- Xiao, H.; Parehatijiang, W.; Yushanjiang; Nurguli Talifu, K.; Wang, Y.; Tohuti, A. Analysis of the correlation between body size and body weight of the Hetian Qing donkey by using R language. In Proceedings of the High-level Forum of the First (2015) China Donkey Industry Development Conference, Liaocheng, China, 22 November 2015; p. 11. [Google Scholar]
- Wei, H.; Yang, F.; Li, P. A Brief Discussion on the Current Situation and Countermeasures of Conservation of Hetian Green Donkey Germplasm Resources. Xinjiang Anim. Husb. 2011, 1, 53–54. [Google Scholar]
- Xiao, H.; Ajide, T.; Shi, G.; Yushanjiang; Re, X.; Shi, P. R-language analysis of the correlation between body weight and body size of Hotan Qinglu. J. Jiangxi Agric. Univ. 2012, 34, 762–768. [Google Scholar]
- Mamutijiang Kerim, M.; Li, X. Performance analysis and discussion of Xinjiang Hotan green donkey. Xinjiang Livest. Ind. 2012, 3, 37–38. [Google Scholar]
- Min, F.; Xu, F.; Huang, S.; Wu, R.; Zhang, L.; Wang, J. Genetic diversity of Chinese laboratory macaques based on 2b-RAD simplified genome sequencing. J. Med. Primatol. 2022, 51, 101–107. [Google Scholar] [CrossRef] [PubMed]
- Miller, M.R.; Dunham, J.P.; Amores, A.; Cresko, W.A.; Johnson, E.A. Rapid and cost-effective polymorphism identification and genotyping using restriction site associated DNA (RAD) markers. Genome Res. 2007, 17, 240–248. [Google Scholar] [CrossRef] [PubMed]
- Wallace, J.G.; Mitchell, S.E. Genotyping-by-Sequencing. Curr. Protoc. Plant Biol. 2017, 2, 64–77. [Google Scholar] [CrossRef] [PubMed]
- Andrews, K.R.; Good, J.M.; Miller, M.R.; Luikart, G.; Hohenlohe, P.A. Harnessing the power of RADseq for ecological and evolutionary genomics. Nat. Rev. Genet. 2016, 17, 81–92. [Google Scholar] [CrossRef] [PubMed]
- Maruki, T.; Ye, Z.; Lynch, M. Evolutionary Genomics of a Subdivided Species. Mol. Biol. Evol. 2022, 39, msac152. [Google Scholar] [CrossRef]
- Sonah, H.; Bastien, M.; Iquira, E.; Tardivel, A.; Légaré, G.; Boyle, B.; Normandeau, É.; Laroche, J.; Larose, S.; Jean, M.; et al. An Improved Genotyping by Sequencing (GBS) Approach Offering Increased Versatility and Efficiency of SNP Discovery and Genotyping. PLoS ONE 2013, 8, e54603. [Google Scholar] [CrossRef]
- Abeyrama, D.K.; Boyle, B.; Burg, T.M. Comparison of genotyping by sequencing procedures to determine population genetic structure. Funct. Integr. Genom. 2022, 23, 9. [Google Scholar] [CrossRef]
- Wang, H.; Jin, J.; Wu, J.; Qu, H.; Wu, S.; Bao, W. Transcriptome and chromatin accessibility in porcine intestinal epithelial cells upon Zearalenone exposure. Sci. Data 2019, 6, 298. [Google Scholar] [CrossRef]
- Han, X.; Gao, C.; Liu, L.; Zhang, Y.; Jin, Y.; Yan, Q.; Yang, L.; Li, F.; Yang, Z. Integration of eQTL Analysis and GWAS Highlights Regulation Networks in Cotton under Stress Condition. Int. J. Mol. Sci. 2022, 23, 7564. [Google Scholar] [CrossRef] [PubMed]
- Li, H.; Durbin, R. Fast and accurate long-read alignment with Burrows-Wheeler transform. Bioinformatics 2010, 26, 589–595. [Google Scholar] [CrossRef] [PubMed]
- Li, H.; Handsaker, B.; Wysoker, A.; Fennell, T.; Ruan, J.; Homer, N.; Marth, G.; Abecasis, G.; Durbin, R.; 1000 Genome Project Data Processing Subgroup. The Sequence Alignment/Map format and SAMtools. Bioinformatics 2009, 25, 2078–2079. [Google Scholar] [CrossRef] [PubMed]
- McKenna, A.; Hanna, M.; Banks, E.; Sivachenko, A.; Cibulskis, K.; Kernytsky, A.; Garimella, K.; Altshuler, D.; Gabriel, S.; Daly, M.; et al. The Genome Analysis Toolkit: A MapReduce framework for analyzing next-generation DNA sequencing data. Genome Res. 2010, 20, 1297–1303. [Google Scholar] [CrossRef] [PubMed]
- Dang, H.; Zhang, T.; Li, Y.; Li, G.; Zhuang, L.; Pu, X. Population Evolution, Genetic Diversity and Structure of the Medicinal Legume, Glycyrrhiza uralensis and the Effects of Geographical Distribution on Leaves Nutrient Elements and Photosynthesis. Front. Plant Sci. 2021, 12, 708709. [Google Scholar] [CrossRef] [PubMed]
- Barbato, M.; Orozco-terWengel, P.; Tapio, M.; Bruford, M.W. SNeP: A tool to estimate trends in recent effective population size trajectories using genome-wide SNP data. Front. Genet. 2015, 6, 109. [Google Scholar] [CrossRef]
- Purcell, S.; Neale, B.; Todd-Brown, K.; Thomas, L.; Ferreira, M.A.; Bender, D.; Maller, J.; Sklar, P.; De Bakker, P.I.; Daly, M.J.; et al. PLINK: A tool set for whole-genome association and population-based linkage analyses. Am. J. Hum. Genet. 2007, 81, 559–575. [Google Scholar] [CrossRef]
- Botstein, D.; White, R.L.; Skolnick, M.; Davis, R.W. Construction of a genetic-linkage map in man using restriction fragment length polymorphisms. Am. J. Hum. Genet. 1980, 32, 314–331. [Google Scholar]
- Silió, L.; Rodríguez, M.C.; Fernández, A.; Barragán, C.; Benítez, R.; Óvilo, C.; Fernández, A.I. Measuring inbreeding and inbreeding depression on pig growth from pedigree or SNP-derived metrics. J. Anim. Breed. Genet. 2013, 130, 349–360. [Google Scholar] [CrossRef]
- VanRaden, P.M. Efficient methods to compute genomic predictions. J. Dairy Sci. 2008, 91, 4414–4423. [Google Scholar] [CrossRef] [PubMed]
- Kumar, S.; Stecher, G.; Li, M.; Knyaz, C.; Tamura, K. MEGA X: Molecular Evolutionary Genetics Analysis across Computing Platforms. Mol. Biol. Evol. 2018, 35, 1547–1549. [Google Scholar] [CrossRef]
- Zhang, C.; Jia, C.; Liu, X.; Zhao, H.; Hou, L.; Li, M.; Cui, B.; Li, Y. Genetic Diversity Study on Geographical Populations of the Multipurpose Species Elsholtzia stauntonii Using Transferable Microsatellite Markers. Front. Plant Sci. 2022, 13, 903674. [Google Scholar] [CrossRef] [PubMed]
- Zhang, Z.; Todhunter, R.J.; Buckler, E.S.; Van Vleck, L.D. Technical note: Use of marker-based relationships with multiple-trait derivative-free restricted maximal likelihood. J. Anim. Sci. 2007, 85, 881–885. [Google Scholar] [CrossRef] [PubMed]
- Estoup, A.; Guillemaud, T. Reconstructing routes of invasion using genetic data: Why, how and so what? Mol. Ecol. 2010, 19, 4113–4130. [Google Scholar] [CrossRef] [PubMed]
- Dong, S.; Wang, T.; Liu, H.; Wang, L.; Tang, L.; Xing, X. Analysis of genomic SNP characteristics of sika deer, red deer and their hybrids based on GBS technology. J. Anim. Husb. Vet. Med. 2019, 50, 2422–2430. [Google Scholar]
- Zhu, W.; Zhang, M.; Ge, M.; Guan, X.; Su, Y.; Jiang, Y.; Zhang, G.; Guo, C. Microsatellite analysis of genetic diversity and phylogenetic relationship of eight local donkey breeds in China. Chin. Agric. Sci. 2006, 2, 398–405. [Google Scholar]
- Yang, H.; Aji; Wang, J.; Liu, M.; Re, X. Microsatellite genetic analysis of three local donkey breeds in Xinjiang. Chin. J. Anim. Husb. 2008, 1, 8–10. [Google Scholar]
- Zhang, R.F.; Xie, W.M.; Zhang, T.; Lei, C.Z. High polymorphism at microsatellite loci in the Chinese donkey. Genet. Mol. Res. 2016, 15, gmr-15028291. [Google Scholar] [CrossRef]
- Zeng, L.; Dang, R.; Dong, H.; Li, F.; Chen, H.; Lei, C. Genetic diversity and relationships of Chinese donkeys using microsatellite markers. Arch. Anim. Breed. 2019, 62, 181–187. [Google Scholar] [CrossRef]
- Baumung, R.; Sölkner, J. Pedigree and marker information requirements to monitor genetic variability. Genet. Sel. Evol. 2003, 35, 369–383. [Google Scholar] [CrossRef] [PubMed]
- Bertolini, F.; Cardoso, T.F.; Marras, G.; Nicolazzi, E.L.; Rothschild, M.F.; Amills, M.; AdaptMap Consortium. Genome-wide patterns of homozygosity provide clues about the population history and adaptation of goats. Genet. Sel. Evol. GSE 2018, 50, 59. [Google Scholar] [CrossRef] [PubMed]
- Wang, G. Analysis of Genetic Structure and Body Size Selection Signals of Chinese Domestic Donkey Population Based on Whole-Genome Sequencing; Northwest Agricultural and Forestry University: Xianyang, China, 2022; p. 72. [Google Scholar]


| Sample | Raw Reads | Bases | GC (%) | Q20 | Q30 | Avg. Quality |
|---|---|---|---|---|---|---|
| HTQL.1 | 3,422,462 | 0.493 | 40.550 | 96.750 | 90.710 | 35.430 |
| HTQL.2 | 2,777,844 | 0.400 | 40.515 | 97.010 | 91.405 | 35.550 |
| HTQL.3 | 3,600,942 | 0.519 | 41.420 | 96.995 | 91.505 | 35.560 |
| HTQL.4 | 3,260,564 | 0.470 | 41.700 | 96.720 | 90.800 | 35.435 |
| HTQL.5 | 3,222,100 | 0.464 | 40.960 | 97.200 | 91.890 | 35.635 |
| HTQL.6 | 3,848,468 | 0.554 | 41.705 | 97.085 | 91.610 | 35.585 |
| HTQL.7 | 3,809,612 | 0.549 | 42.090 | 96.885 | 91.170 | 35.505 |
| HTQL.8 | 3,619,272 | 0.521 | 40.420 | 96.795 | 90.895 | 35.460 |
| HTQL.9 | 3,789,832 | 0.546 | 42.050 | 96.090 | 89.175 | 35.155 |
| HTQL.10 | 3,234,164 | 0.466 | 42.210 | 97.565 | 92.875 | 35.805 |
| HTQL.11 | 3,845,054 | 0.554 | 41.370 | 97.020 | 91.505 | 35.565 |
| HTQL.12 | 4,469,164 | 0.644 | 41.740 | 97.345 | 92.375 | 35.715 |
| HTQL.13 | 4,455,246 | 0.642 | 41.955 | 97.200 | 92.005 | 35.645 |
| HTQL.14 | 4,765,914 | 0.686 | 40.885 | 96.940 | 91.175 | 35.510 |
| HTQL.15 | 3,337,238 | 0.481 | 41.090 | 96.370 | 89.835 | 35.270 |
| HTQL.16 | 3,814,590 | 0.549 | 41.725 | 96.300 | 89.730 | 35.250 |
| HTQL.17 | 3,771,948 | 0.543 | 41.920 | 96.250 | 89.585 | 35.225 |
| HTQL.18 | 3,236,658 | 0.466 | 41.120 | 96.160 | 89.365 | 35.185 |
| HTQL.19 | 3,959,474 | 0.570 | 41.800 | 97.370 | 92.450 | 35.725 |
| HTQL.20 | 3,445,792 | 0.496 | 41.320 | 97.055 | 91.530 | 35.570 |
| HTQL.21 | 4,765,826 | 0.686 | 41.810 | 96.995 | 91.440 | 35.550 |
| HTQL.22 | 4,100,654 | 0.590 | 41.680 | 97.590 | 92.980 | 35.820 |
| HTQL.23 | 3,854,112 | 0.555 | 42.180 | 97.200 | 91.995 | 35.645 |
| HTQL.24 | 3,630,974 | 0.523 | 41.470 | 95.805 | 88.520 | 35.035 |
| HTQL.25 | 4,728,044 | 0.681 | 41.710 | 97.200 | 91.980 | 35.645 |
| HTQL.26 | 4,159,726 | 0.599 | 42.155 | 96.475 | 90.220 | 35.335 |
| HTQL.27 | 3,898,920 | 0.561 | 41.670 | 96.890 | 91.250 | 35.515 |
| HTQL.28 | 3,856,794 | 0.555 | 41.740 | 95.720 | 88.340 | 35.000 |
| HTQL.29 | 4,043,730 | 0.582 | 41.905 | 97.300 | 92.325 | 35.705 |
| HTQL.30 | 3,609,010 | 0.520 | 41.720 | 97.610 | 93.070 | 35.830 |
| HTQL.31 | 3,580,730 | 0.516 | 41.330 | 96.970 | 91.455 | 35.550 |
| HTQL.32 | 3,724,332 | 0.536 | 41.690 | 95.845 | 88.640 | 35.055 |
| Sample | Clean Reads | Mapped (%) | Properly Mapped (%) | sites_covgMean | sites_numCovg1 |
|---|---|---|---|---|---|
| HTQL.1 | 551,791 | 541,941 (98.21%) | 425,834 (77.97%) | 0.03 | 2.84% |
| HTQL.2 | 467,850 | 459,993 (98.32%) | 387,516 (83.81%) | 0.03 | 2.47% |
| HTQL.3 | 600,936 | 590,498 (98.26%) | 436,264 (73.13%) | 0.03 | 3.07% |
| HTQL.4 | 582,825 | 573,456 (98.39%) | 429,726 (74.20%) | 0.03 | 2.96% |
| HTQL.5 | 551,144 | 542,081 (98.36%) | 418,744 (76.57%) | 0.03 | 2.85% |
| HTQL.6 | 673,348 | 665,310 (98.81%) | 456,548 (68.31%) | 0.04 | 3.40% |
| HTQL.7 | 704,081 | 693,711 (98.53%) | 471,428 (67.33%) | 0.04 | 3.49% |
| HTQL.8 | 568,191 | 557,549 (98.13%) | 433,046 (77.05%) | 0.03 | 2.92% |
| HTQL.9 | 656,737 | 646,596 (98.46%) | 463,620 (71.05%) | 0.04 | 3.25% |
| HTQL.10 | 703,473 | 694,872 (98.78%) | 468,196 (66.88%) | 0.04 | 3.52% |
| HTQL.11 | 606,125 | 595,465 (98.24%) | 446,142 (74.46%) | 0.03 | 3.06% |
| HTQL.12 | 678,126 | 665,467 (98.13%) | 475,464 (70.69%) | 0.04 | 3.38% |
| HTQL.13 | 739,489 | 727,028 (98.31%) | 498,570 (67.87%) | 0.04 | 3.62% |
| HTQL.14 | 643,864 | 630,377 (97.91%) | 464,144 (73.19%) | 0.04 | 3.25% |
| HTQL.15 | 564,200 | 554,598 (98.30%) | 423,004 (75.86%) | 0.03 | 2.89% |
| HTQL.16 | 607,283 | 596,625 (98.24%) | 448,570 (74.41%) | 0.03 | 3.07% |
| HTQL.17 | 644,551 | 634,387 (98.42%) | 455,880 (71.42%) | 0.04 | 3.20% |
| HTQL.18 | 561,027 | 552,047 (98.40%) | 427,840 (76.95%) | 0.03 | 2.89% |
| HTQL.19 | 665,494 | 653,913 (98.26%) | 465,114 (70.39%) | 0.04 | 3.33% |
| HTQL.20 | 555,928 | 546,186 (98.25%) | 426,748 (77.44%) | 0.03 | 2.87% |
| HTQL.21 | 721,117 | 707,761 (98.15%) | 495,622 (69.37%) | 0.04 | 3.51% |
| HTQL.22 | 696,444 | 684,859 (98.34%) | 483,484 (69.89%) | 0.04 | 3.43% |
| HTQL.23 | 708,215 | 697,463 (98.48%) | 474,366 (67.40%) | 0.04 | 3.50% |
| HTQL.24 | 538,091 | 528,300 (98.18%) | 429,102 (80.45%) | 0.03 | 2.77% |
| HTQL.25 | 730,915 | 717,497 (98.16%) | 502,852 (69.29%) | 0.04 | 3.59% |
| HTQL.26 | 697,874 | 686,292 (98.34%) | 481,554 (69.47%) | 0.04 | 3.45% |
| HTQL.27 | 632,039 | 620,958 (98.25%) | 450,908 (71.91%) | 0.04 | 3.18% |
| HTQL.28 | 580,896 | 570,451 (98.20%) | 441,650 (76.69%) | 0.03 | 2.95% |
| HTQL.29 | 721,030 | 709,702 (98.43%) | 482,280 (67.31%) | 0.04 | 3.55% |
| HTQL.30 | 627,885 | 618,003 (98.43%) | 445,624 (71.42%) | 0.04 | 3.21% |
| HTQL.31 | 557,792 | 547,754 (98.20%) | 437,112 (78.96%) | 0.03 | 2.90% |
| HTQL.32 | 645,267 | 634,799 (98.38%) | 467,584 (72.93%) | 0.04 | 3.21% |
| Quality Control Standard | Number of SNPs |
|---|---|
| Total number of SNPs | 55,399 |
| SNP with MAF < 0.01 | 3 |
| SNP no tin Hardy–Weinberg equilibrium (p < 10−6) | 318 |
| SNP with callrate < 0.90 | 7992 |
| SNPs on chromosome X | 1434 |
| SNPs on chromosome Y | 89 |
| SNPs used after quality control | 45,557 |
| Effective Population Size (Ne) | 4.10 |
| Proportion of Polymorphic Markers (PN) | 0.955 |
| Expected Heterozygosity (He) | 0.340 |
| Observed Heterozygosity (Ho) | 0.347 |
| Polymorphism Information Content (PIC) | 0.273 |
| Effective Numbers of Alleles | 1.536 |
| Minor Allele Frequency (MAF) | 0.250 |
| Family 1 Male | Family 1 Female | Family 2 Male | Family 2 Female | Family 3 Male | Family 3 Female | Miscellaneous |
|---|---|---|---|---|---|---|
| HTQL_8 | HTQL_25 | HTQL_32 | HTQL_6 | HTQL_9 | HTQL_30 | |
| HTQL_31 | HTQL_1 | HTQL_4 | ||||
| HTQL_28 | ||||||
| HTQL_26 | ||||||
| HTQL_16 | ||||||
| HTQL_11 | ||||||
| HTQL_15 | ||||||
| HTQL_12 | ||||||
| HTQL_22 | ||||||
| HTQL_5 | ||||||
| HTQL_3 | ||||||
| HTQL_20 | ||||||
| HTQL_29 | ||||||
| HTQL_19 | ||||||
| HTQL_24 | ||||||
| HTQL_27 | ||||||
| HTQL_2 | ||||||
| HTQL_13 | ||||||
| HTQL_21 | ||||||
| HTQL_23 | ||||||
| HTQL_17 | ||||||
| HTQL_14 | ||||||
| HTQL_10 | ||||||
| HTQL_7 | ||||||
| HTQL_18 |
Disclaimer/Publisher’s Note: The statements, opinions and data contained in all publications are solely those of the individual author(s) and contributor(s) and not of MDPI and/or the editor(s). MDPI and/or the editor(s) disclaim responsibility for any injury to people or property resulting from any ideas, methods, instructions or products referred to in the content. |
© 2024 by the authors. Licensee MDPI, Basel, Switzerland. This article is an open access article distributed under the terms and conditions of the Creative Commons Attribution (CC BY) license (https://creativecommons.org/licenses/by/4.0/).
Share and Cite
Liu, B.; Gong, S.; Tulafu, H.; Zhang, R.; Tao, W.; Adili, A.; Liu, L.; Wu, W.; Huang, J. Analysis of the Genetic Relationship and Inbreeding Coefficient of the Hetian Qing Donkey through a Simplified Genome Sequencing Technology. Genes 2024, 15, 570. https://doi.org/10.3390/genes15050570
Liu B, Gong S, Tulafu H, Zhang R, Tao W, Adili A, Liu L, Wu W, Huang J. Analysis of the Genetic Relationship and Inbreeding Coefficient of the Hetian Qing Donkey through a Simplified Genome Sequencing Technology. Genes. 2024; 15(5):570. https://doi.org/10.3390/genes15050570
Chicago/Turabian StyleLiu, Bo, Shujuan Gong, Hanikezi Tulafu, Rongyin Zhang, Weikun Tao, Abulikemu Adili, Li Liu, Weiwei Wu, and Juncheng Huang. 2024. "Analysis of the Genetic Relationship and Inbreeding Coefficient of the Hetian Qing Donkey through a Simplified Genome Sequencing Technology" Genes 15, no. 5: 570. https://doi.org/10.3390/genes15050570
APA StyleLiu, B., Gong, S., Tulafu, H., Zhang, R., Tao, W., Adili, A., Liu, L., Wu, W., & Huang, J. (2024). Analysis of the Genetic Relationship and Inbreeding Coefficient of the Hetian Qing Donkey through a Simplified Genome Sequencing Technology. Genes, 15(5), 570. https://doi.org/10.3390/genes15050570


