
Prognostic Role of Human Leukocyte Antigen Alleles and Cytokine Single-Nucleotide Polymorphisms in Patients with Chronic Myeloid Leukemia Treated with Tyrosine Kinase Inhibitor Drugs

 ,
,
Abstract
:
1. Introduction
2. Materials and Methods
2.1. Cohorts
2.2. DNA Preparation
2.3. Cytokine Genotyping
2.4. HLA High-Resolution Typing
2.5. Data Analysis and Interpretation
3. Results
3.1. Summary and Descriptive Statistics of the SNP vs. Clinical Outcomes
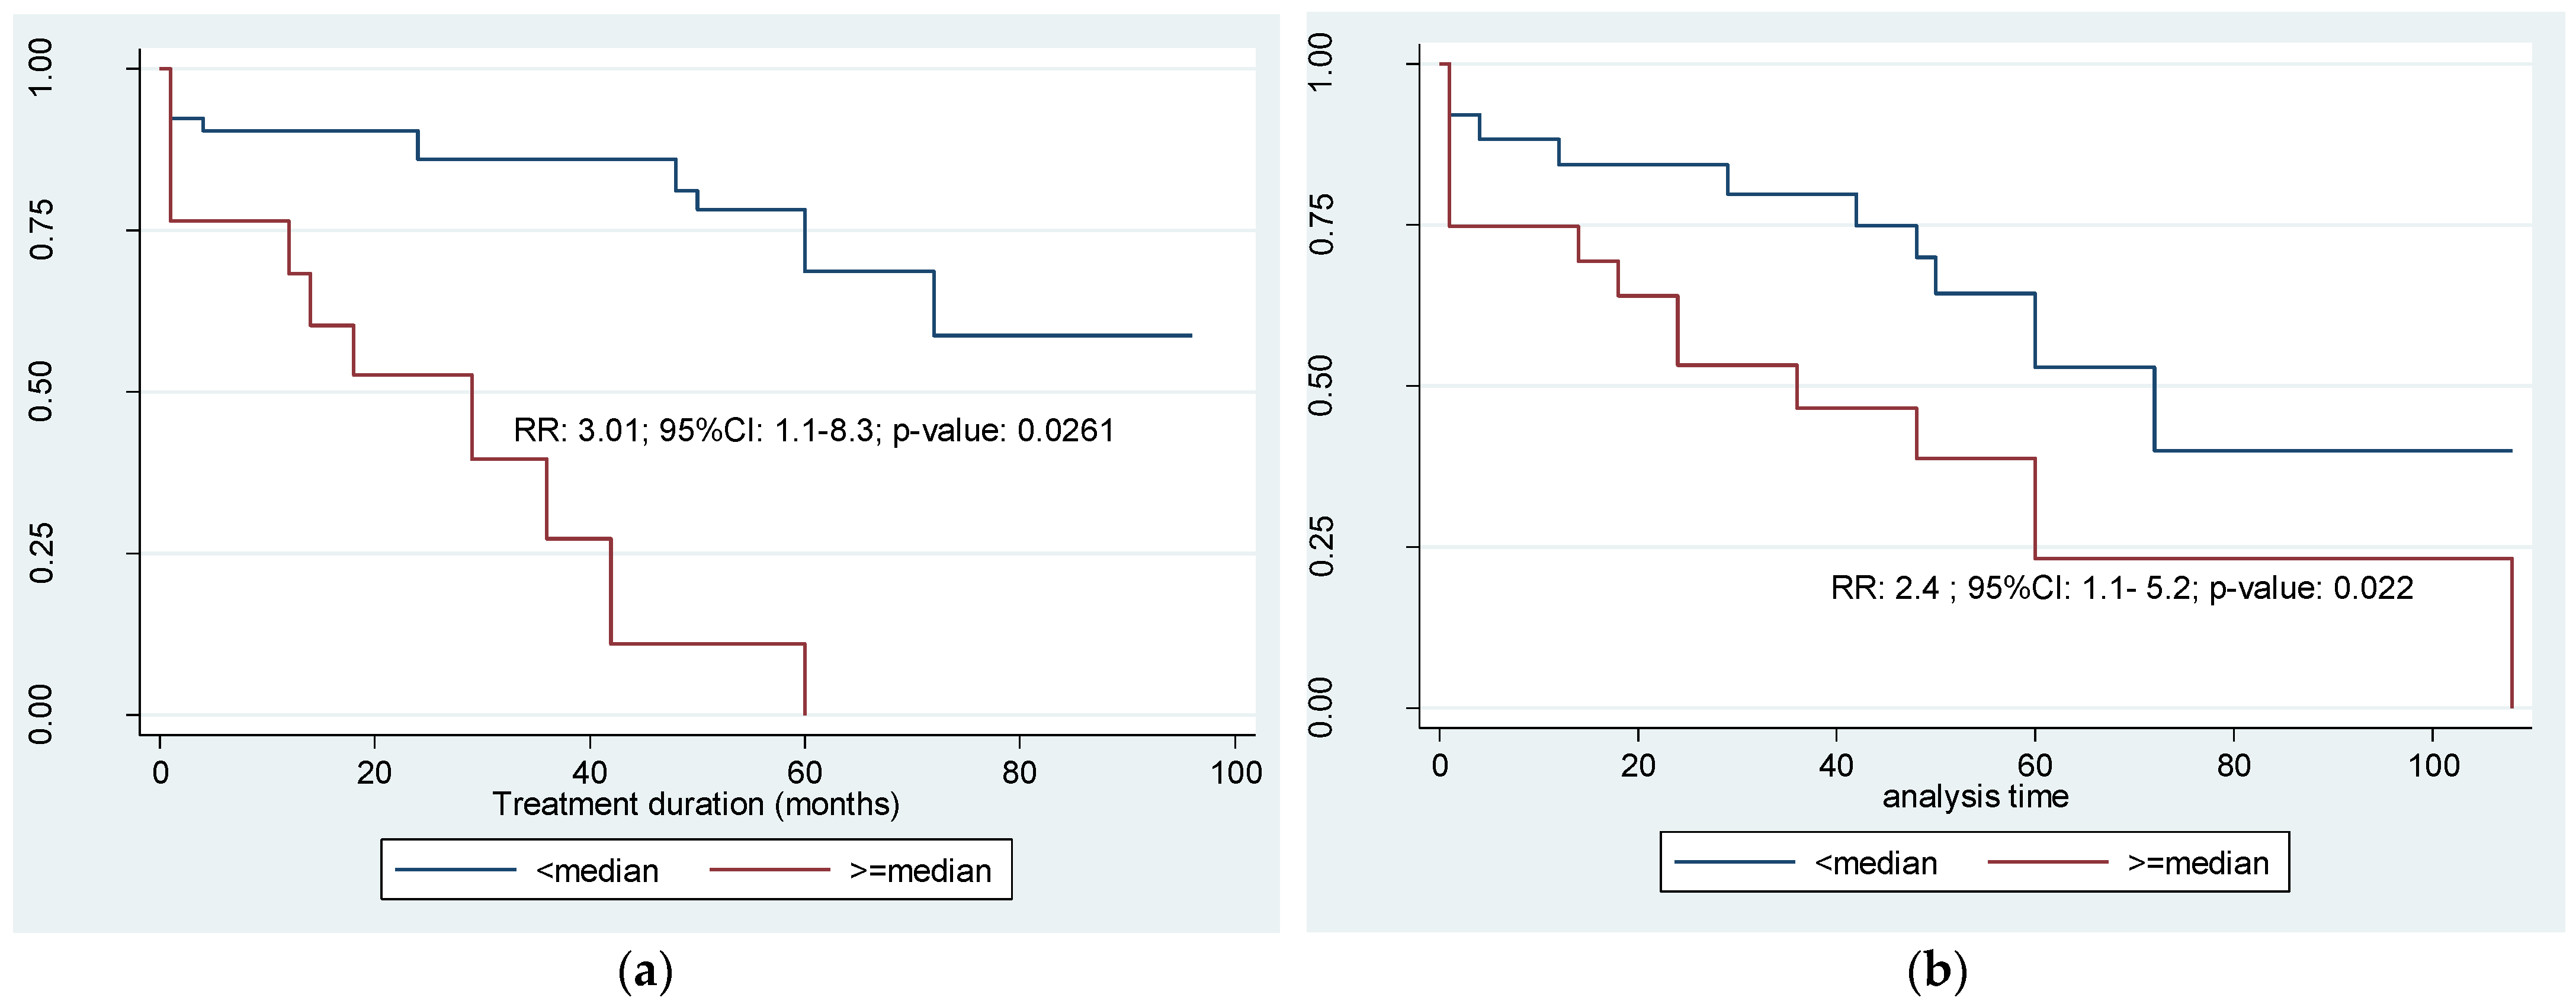
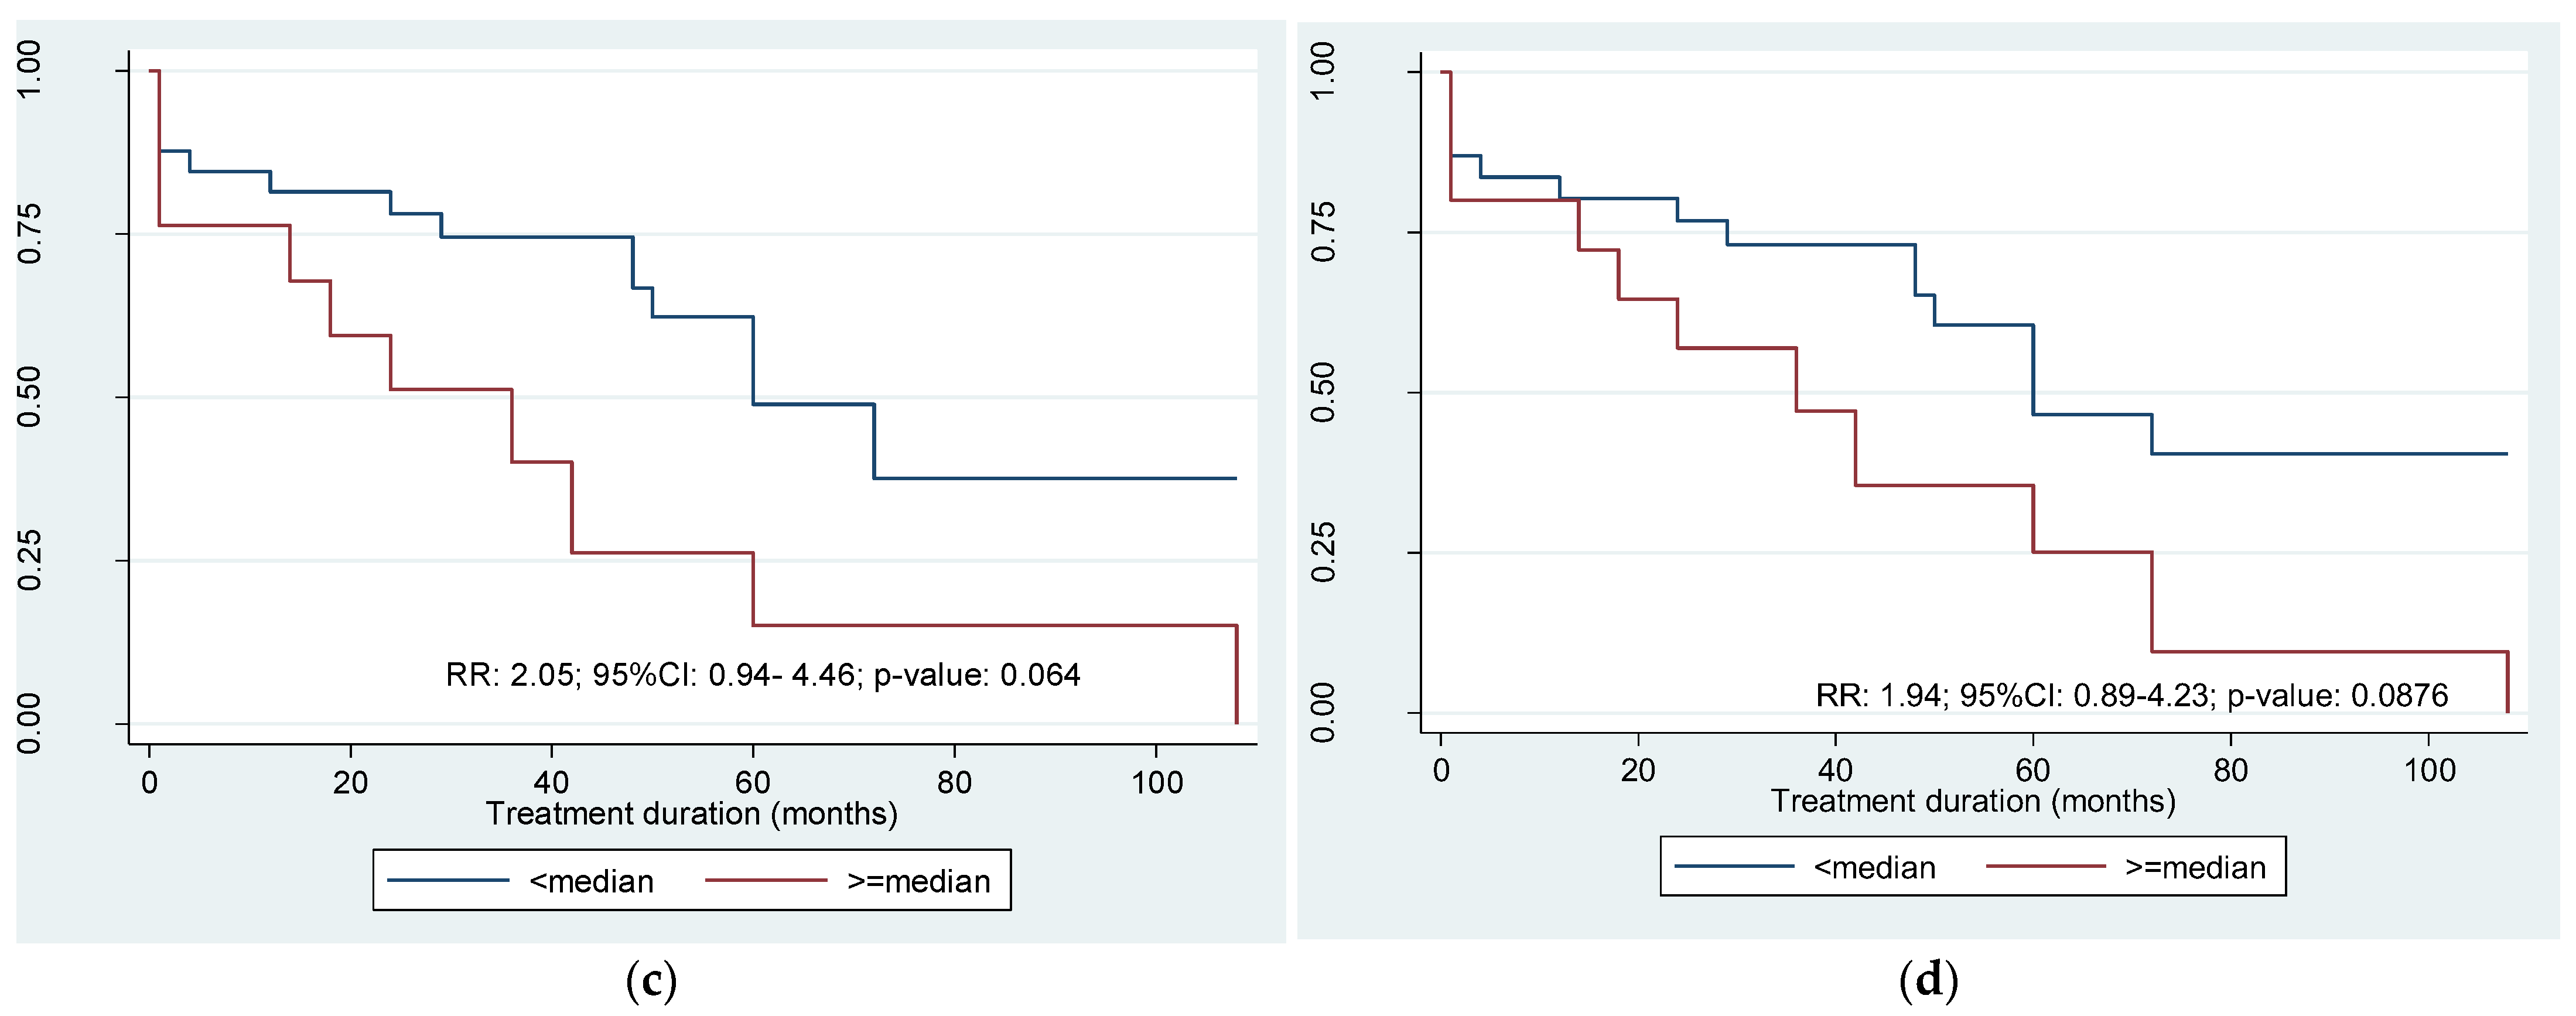
3.2. Estimates of the Probability of Relapse-Free Survival
3.3. HLA Polymorphism in the Cohort of Patients Treated for CML

| Population | Region | Most Common HLA Alleles | Remarks | References |
|---|---|---|---|---|
| Europe | Romania | A*02:01, A*03:01, A*01:01, A*24:02, A*26:01, B*51:01, B*08:01, B*35:01, B*14:02, B*07:02, DRB1*03:01, DRB1*16:01, DRB1*11:01, DRB1*07:01, DRB1*15:01 | donors | [46] |
| Germany | A*02:01, B*07:02, C*07:01, DRB1*15:01, DRB1*07:01, DQB1*03:01, DQB1*06:02 | healthy, ill people, COVID-19 infected | [47] | |
| Europe | A*01:01, A*24:02, A*33:01, A*68:01, B*08:01, B*44:01, B*57:01, C*12:02, DRB1*01:01, DRB1*01:02, DRB1*03:01, DRB1*04:01, DRB1*04:03, DRB1*07:01, DRB1*11:01, DRB1*11:04, DRB1*13:01, DRB1*13:02, DRB1*15:01, DQB1*02:01, DQB1*02:02, DQB1*03:01, DQB1*03:02, DQB1*04:02, DQB1*05:01, DQB1*05:02, DQB1*05:03, DQB1*06:01, DQB1*06:03, DQB1*06:04, DPB1*01:01, DPB1*02:01, DPB1*04:01, DPB1*04:02, DPB1*06:01, DPB1*11:01 | [48] | ||
| European descent group | A*02 (22.4%), A*03 (15.7%), A*24 (9.4%), B*07 (14.6%), B*44 (10,6%), B*51 (7.3%), C*07 (24.6%), C*03 (12.6%), C*06 (11.5%), DRB1*15 (15.2%), DRB1*04 (14.3%), DRB1*03 (11.5%) | all | [49] | |
| Africa | Sudan, Chad, Burkina-Faso | B*53 | no A*25, A*26, low A*11, no B*48, B*54, B*67 | [50] |
| Ethiopia | DR3, DR4 | low DR5, DR8, DR10 | [37] | |
| Kenya, Tanzania, Uganda | A*02:01:01 (10.90%), B*58:02 (8.79%), C*06:02:01 (16.98%), DPA1*01:03:01 (40.60%), DPB1*01:01:01 (23.45%), DQA1*01:02:01 (31.03%), DQB1*03:01:01 (21.79%), DRB1*11:01:02 (11.65%), DRB3*02:02:01 (31.65%), DRB4*01:01:01 (10.50%), DRB5*01:01:01 (10.50%) | higher homozygosity: HLA-B, DQA1, DQB1, DRB1 high frequency: DRB1*11 (21.51%) | [51] | |
| Gabonese, Liberians | DR15/16 DQB1*06:02 | Lebanese low DR11 | [38] | |
| African descent group | A*30 (13.1%), A*68 (12.8%), A*02 (12.3%), B*15 (12.6%), B*58 (11.7%), B*44 (9.9), C*07 (16.8%), C*06 (16.4%), C*04 (12.8%), DRB1*03 (17.2%), DRB1*13 (16.1%), DRB1*11 (16%) | all | [49] | |
| Asia | Republic of Korea | A*33:03:01-B*44:03:01-C*14:03-DRB1*13:02:01-DQB1*06:04:01-DPB1*04:01:01 (2.89%), A*33:03:01-B*44:03:01-C*14:03 (4.91%), DRB1*08:03:02-DQA1*01:03:01-DQB1*06:01:01-DPA1*02:02:02-DPB1*05:01:01 (5.41%), DRB1*04:05:01-DRB4*01:03:01 (12.72%), DQA1*01:03:01-DQB1*06:01:01 (13.01%), DPA1*02:02:02-DPB1*05:01:01 (30.83%) | adults from medical school | [52] |
| Arab Emirates | Saudi | A*02:01:01G (20.2%), A*24:02:01G (7.5%), B*51:01:01G (19.0%), B*50:01:01G (12.3%), C*06:02:01G (16.7%), C*07:02:01G (12.2%), DRB1*07:01:01 (15.7%), DRB1∗03:01:01G (13.3%); DQB1∗02:01:01G (29.9%), DQB1∗03:02:01G (13.2%); andDPB1∗04:01:01G (35.2%), DPB1∗02:01:02G (21.8%) | stem cell donors | [53] |
4. Discussion
4.1. Cytokine Polymorphism
4.2. HLA Polymorphism
Author Contributions
Funding
Institutional Review Board Statement
Informed Consent Statement
Data Availability Statement
Acknowledgments
Conflicts of Interest
References
- Deininger, M.W.; Goldman, J.M.; Melo, J.V. The molecular biology of chronic myeloid leukemia. Blood 2000, 96, 3343–3356. [Google Scholar] [CrossRef] [PubMed]
- Bedi, A.; Zehnbauer, B.A.; Barber, J.P.; Sharkis, S.J.; Jones, R.J. Inhibition of apoptosis by BCR-ABL in chronic myeloid leukemia. Blood 1994, 83, 2038–2044. [Google Scholar] [CrossRef]
- Bower, H.; Björkholm, M.; Dickman, P.W.; Höglund, M.; Lambert, P.C.; Andersson, T.M.-L. Life Expectancy of Patients With Chronic Myeloid Leukemia Approaches the Life Expectancy of the General Population. JCO J. Clin. Oncol. 2016, 34, 2851–2857. [Google Scholar] [CrossRef] [PubMed]
- Mahon, F.-X.; Réa, D.; Guilhot, J.; Guilhot, F.; Huguet, F.; Nicolini, F.; Legros, L.; Charbonnier, A.; Guerci, A.; Varet, B.; et al. Discontinuation of imatinib in patients with chronic myeloid leukaemia who have maintained complete molecular remission for at least 2 years: The prospective, multicentre Stop Imatinib (STIM) trial. Lancet Oncol. 2010, 11, 1029–1035. [Google Scholar] [CrossRef]
- Hasford, J.; Baccarani, M.; Hoffmann, V.; Guilhot, J.; Saussele, S.; Rosti, G.; Guilhot, F.; Porkka, K.; Ossenkoppele, G.; Lindoerfer, D.; et al. Predicting complete cytogenetic response and subsequent progression-free survival in 2060 patients with CML on imatinib treatment: The EUTOS score. Blood 2011, 118, 686–692. [Google Scholar] [CrossRef] [PubMed]
- Mahon, F.-X. Treatment-free remission in CML: Who, how, and why? Hematol. Am. Soc. Hematol. Educ. Program 2017, 2017, 102–109. [Google Scholar] [CrossRef]
- Schütz, C.; Inselmann, S.; Saussele, S.; Dietz, C.T.; Mu Ller, M.C.; Eigendorff, E.; Brendel, C.A.; Metzelder, S.K.; Bru Mmendorf, T.H.; Waller, C.; et al. Expression of the CTLA-4 ligand CD86 on plasmacytoid dendritic cells (pDC) predicts risk of disease recurrence after treatment discontinuation in CML. Leukemia 2017, 31, 829–836. [Google Scholar] [CrossRef] [PubMed]
- Hughes, A.; Clarson, J.; Tang, C.; Vidovic, L.; White, D.L.; Hughes, T.P.; Yong, A.S.M. CML patients with deep molecular responses to TKI have restored immune effectors and decreased PD-1 and immune suppressors. Blood 2017, 129, 1166–1176. [Google Scholar] [CrossRef]
- Ross, D.M.; Pagani, I.S.; Irani, Y.D.; Clarson, J.; Leclercq, T.; Dang, P.; McLean, J.; Saunders, V.A.; Carne, L.; Reynolds, J.; et al. Lenalidomide maintenance treatment after imatinib discontinuation: Results of a phase 1 clinical trial in chronic myeloid leukaemia. Br. J. Haematol. 2019, 186, e56–e60. [Google Scholar] [CrossRef]
- Zhang, X.; Tu, H.; Yang, Y.; Jiang, X.; Hu, X.; Luo, Q.; Li, J. Bone marrow-derived mesenchymal stromal cells promote resistance to tyrosine kinase inhibitors in chronic myeloid leukemia via the IL-7/JAK1/STAT5 pathway. J. Biol. Chem. 2019, 294, 12167–12179. [Google Scholar] [CrossRef]
- Clark, R.E.; Dodi, I.A.; Hill, S.C.; Lill, J.R.; Aubert, G.; Macintyre, A.R.; Rojas, J.; Bourdon, A.; Bonner, P.L.; Wang, L.; et al. Direct evidence that leukemic cells present HLA-associated immunogenic peptides derived from the BCR-ABL b3a2 fusion protein. Blood 2001, 98, 2887–2893. [Google Scholar] [CrossRef] [PubMed]
- Lim, S.H.; Coleman, S. Chronic myeloid leukemia as an immunological target. Am. J. Hematol. 1997, 54, 61–67. [Google Scholar] [CrossRef]
- Thorsby, E. A short history of HLA. Tissue Antigens 2009, 74, 101–116. [Google Scholar] [CrossRef] [PubMed]
- Zinkernagel, R.M.; Doherty, P.C. The discovery of MHC restriction. Immunol. Today 1997, 18, 14–17. [Google Scholar] [CrossRef] [PubMed]
- Bilich, T.; Nelde, A.; Bichmann, L.; Roerden, M.; Salih, H.R.; Kowalewski, D.J.; Schuster, H.; Tsou, C.-C.; Marcu, A.; Neidert, M.C.; et al. The HLA ligandome landscape of chronic myeloid leukemia delineates novel T-cell epitopes for immunotherapy. Blood 2019, 133, 550–565. [Google Scholar] [CrossRef] [PubMed]
- Ureshino, H.; Shindo, T.; Kojima, H.; Kusunoki, Y.; Miyazaki, Y.; Tanaka, H.; Saji, H.; Kawaguchi, A.; Kimura, S. Allelic Polymorphisms of KIRs and HLAs Predict Favorable Responses to Tyrosine Kinase Inhibitors in CML. Cancer Immunol. Res. 2018, 6, 745–754. [Google Scholar] [CrossRef] [PubMed]
- Posthuma, E.F.; Falkenburg, J.H.; Apperley, J.F.; Gratwohl, A.; Roosnek, E.; Hertenstein, B.; Schipper, R.F.; Schreuder, G.M.; D’Amaro, J.; Oudshoorn, M.; et al. HLA-B8 and HLA-A3 coexpressed with HLA-B8 are associated with a reduced risk of the development of chronic myeloid leukemia. The Chronic Leukemia Working Party of the EBMT. Blood 1999, 93, 3863–3865. [Google Scholar] [PubMed]
- Posthuma, E.F.; Falkenburg, J.H.; Apperley, J.F.; Gratwohl, A.; Hertenstein, B.; Schipper, R.F.; Oudshoorn, M.; Biezen, J.H.; Hermans, J.; Willemze, R.; et al. HLA-DR4 is associated with a diminished risk of the development of chronic myeloid leukemia (CML). Chronic Leukemia Working Party of the European Blood and Marrow Transplant Registry. Leukemia 2000, 14, 859–862. [Google Scholar] [CrossRef] [PubMed]
- Amirzargar, A.-A.; Khosravi, F.; Dianat, S.S.; Alimoghadam, K.; Ghavamzadeh, F.; Ansaripour, B.; Moradi, B.; Nikbin, B. Association of HLA class II allele and haplotype frequencies with chronic myelogenous leukemia and age-at-onset of the disease. Pathol. Oncol. Res. 2007, 13, 47–51. [Google Scholar] [CrossRef]
- Khosravi, F.; Amirzargar, A.; Sarafnejad, A.; Nicknam, M.H.; Alimoghadam, K.; Dianat, S.; Solgi, G.; Nikbin, B. HLA class II allele and haplotype frequencies in Iranian patients with leukemia. Iran. J. Allergy Asthma Immunol. 2007, 6, 137–142. [Google Scholar]
- Oguz, F.S.; Kalayoglu, S.; Diler, A.S.; Tozkir, H.; Sargin, D.; Carin, M.; Dorak, M.T. HLA system affects the age-at-onset in chronic myeloid leukemia. Am. J. Hematol. 2003, 73, 256–262. [Google Scholar] [CrossRef] [PubMed]
- Pehlivan, M.; Sahin, H.H.; Pehlivan, S.; Ozdilli, K.; Kaynar, L.; Oguz, F.S.; Sever, T.; Yilmaz, M.; Eser, B.; Ogret, Y.D.; et al. Prognostic importance of single-nucleotide polymorphisms in IL-6, IL-10, TGF-β1, IFN-γ, and TNF-α genes in chronic phase chronic myeloid leukemia. Genet. Test. Mol. Biomark. 2014, 18, 403–409. [Google Scholar] [CrossRef] [PubMed]
- Holweg, C.T.; Baan, C.C.; Balk, A.H.; Niesters, H.G.; Maat, A.P.; Mulder, P.M.; Weimar, W. The transforming growth factor-beta1 codon 10 gene polymorphism and accelerated graft vascular disease after clinical heart transplantation. Transplantation 2001, 71, 1463–1467. [Google Scholar] [CrossRef] [PubMed]
- Ishimura, T.; Fujisawa, M.; Isotani, S.; Higuchi, A.; Iijima, K.; Arakawa, S.; Hohenfellner, K.; Flanders, K.C.; Yoshikawa, N.; Kamidono, S. Transforming growth factor-beta1 expression in early biopsy specimen predicts long-term graft function following pediatric renal transplantation. Clin. Transplant. 2001, 15, 185–191. [Google Scholar] [CrossRef] [PubMed]
- Sarpatwari, A.; Bussel, J.B.; Ahmed, M.; Erqou, S.; Semple, J.W.; Newland, A.C.; Bennett, D.; Pharoah, P.; Provan, D. Single nucleotide polymorphism (SNP) analysis demonstrates a significant association of tumour necrosis factor-alpha (TNFA) with primary immune thrombocytopenia among Caucasian adults. Hematology 2011, 16, 243–248. [Google Scholar] [CrossRef] [PubMed]
- Gao, S.; Tang, K.; Chen, J.; Wang, J. The single nucleotide polymorphisms of interleukin-10 are associated with the risk of leukaemia: Evidence from 18 case-control studies. Medicine 2020, 99, e23006. [Google Scholar] [CrossRef] [PubMed]
- Zaninoni, A.; Fattizzo, B.; Giannotta, J.A.; Fermo, E.; Cecchi, N.; Bianchi, P.; Barcellini, W. Single Nucleotide Polymorphisms of Cytokine Genes in Warm Autoimmune Hemolytic Anemias: Relationship with Clinical and Hematological Parameters. Blood 2021, 138, 4142. [Google Scholar] [CrossRef]
- Al-Khatib, S.M.; Abdo, N.; Al-Eitan, L.N.; Al-Mistarehi, A.-H.; Zahran, D.J.; Kewan, T.Z. The Impact of IL-6 and IL-10 Gene Polymorphisms in Diffuse Large B-Cell Lymphoma Risk and Overall Survival in an Arab Population: A Case-Control Study. Cancers 2020, 12, 382. [Google Scholar] [CrossRef]
- Awad, M.R.; El-Gamel, A.; Hasleton, P.; Turner, D.M.; Sinnott, P.J.; Hutchinson, I.V. Genotypic variation in the transforming growth factor-beta1 gene: Association with transforming growth factor-beta1 production, fibrotic lung disease, and graft fibrosis after lung transplantation. Transplantation 1998, 66, 1014–1020. [Google Scholar] [CrossRef]
- Turner, D.M.; Williams, D.M.; Sankaran, D.; Lazarus, M.; Sinnott, P.J.; Hutchinson, I.V. An investigation of polymorphism in the interleukin-10 gene promoter. Eur. J. Immunogenet. 1997, 24, 1–8. [Google Scholar] [CrossRef]
- Dennis, K.L.; Blatner, N.R.; Gounari, F.; Khazaie, K. Current status of interleukin-10 and regulatory T-cells in cancer. Curr. Opin. Oncol. 2013, 25, 637–645. [Google Scholar] [CrossRef]
- Huang, Y.; Yang, H.; Borg, B.B.; Su, X.; Rhodes, S.L.; Yang, K.; Tong, X.; Tang, G.; Howell, C.D.; Rosen, H.R.; et al. A functional SNP of interferon-gamma gene is important for interferon-alpha-induced and spontaneous recovery from hepatitis C virus infection. Proc. Natl. Acad. Sci. USA 2007, 104, 985–990. [Google Scholar] [CrossRef]
- Wungu, C.D.K.; Ariyanto, F.C.; Prabowo, G.I.; Soetjipto; Handajani, R. Association between five types of Tumor Necrosis Factor-α gene polymorphism and hepatocellular carcinoma risk: A meta-analysis. BMC Cancer 2020, 20, 1134. [Google Scholar] [CrossRef]
- Du, G.-H.; Wang, J.-K.; Richards, J.R.; Wang, J.-J. Genetic polymorphisms in tumor necrosis factor alpha and interleukin-10 are associated with an increased risk of cervical cancer. Int. Immunopharmacol. 2019, 66, 154–161. [Google Scholar] [CrossRef] [PubMed]
- Amirzargar, A.A.; Bagheri, M.; Ghavamzadeh, A.; Alimoghadam, K.; Khosravi, F.; Rezaei, N.; Moheydin, M.; Ansaripour, B.; Moradi, B.; Nikbin, B. Cytokine gene polymorphism in Iranian patients with chronic myelogenous leukaemia. Int. J. Immunogenet. 2005, 32, 167–171. [Google Scholar] [CrossRef] [PubMed]
- Abdulkadir, J.; Worku, Y.; Schreuder, G.M.; D’Amaro, J.; de Vries, R.R.; Ottenhoff, T.H. HLA-DR and -DQ antigens in malnutrition-related diabetes mellitus in Ethiopians: A clue to its etiology? Tissue Antigens 1989, 34, 284–289. [Google Scholar] [CrossRef]
- Ottenhoff, T.H.; Mengistu, M.; Tadesse, G.; de Vries, R.R.; Converse, P.J. HLA-DR and DQ antigens in insulin-dependent diabetics in Ethiopia. Tissue Antigens 1987, 30, 193–197. [Google Scholar] [CrossRef] [PubMed]
- Schnittger, L.; May, J.; Loeliger, C.C.; Gallin, M.Y.; Erttmann, K.D.; Bienzle, U.; Kremsner, P.G.; Meyer, C.G. HLA DRB1-DQA1-DQB1 haplotype diversity in two African populations. Tissue Antigens 1997, 50, 546–551. [Google Scholar] [CrossRef]
- Ali, A.A.; Aalto, M.; Jonasson, J.; Osman, A. Genome-wide analyses disclose the distinctive HLA architecture and the pharmacogenetic landscape of the Somali population. Sci. Rep. 2020, 10, 5652. [Google Scholar] [CrossRef]
- NCCN. Recently Updated Guidelines. Available online: https://www.nccn.org/guidelines/recently-published-guidelines (accessed on 30 May 2023).
- Sokal, J.E.; Baccarani, M.; Russo, D.; Tura, S. Staging and prognosis in chronic myelogenous leukemia. Semin. Hematol. 1988, 25, 49–61. [Google Scholar]
- HLA Nomenclature. Available online: https://hla.alleles.org/nomenclature/committee.html (accessed on 29 May 2023).
- The Allele Frequency Net Database [Search HLA Allele Frequencies]. Available online: http://www.allelefrequencies.net/hla6006a.asp (accessed on 30 May 2023).
- Schell, A.; Leisenbach, R.; Coman, C.; Parissiadis, A.; Tourne, S. A new HLA-B*15 allele, B*15:220, found in three individuals sharing the HLA-A*66:01, HLA-C*12:03 and HLADRB1*07:01 alleles. Tissue Antigens 2011, 78, 287–288. [Google Scholar] [CrossRef] [PubMed]
- Lehmann, C.; University Hospital Leipzig, Leipzig, Germany. Personal communication, 2021.
- Constantinescu, I.; Boșcaiu, V.; Cianga, P.; Dinu, A.-A.; Gai, E.; Melinte, M.; Moise, A. The frequency of HLA alleles in the Romanian population. Immunogenetics 2016, 68, 167–178. [Google Scholar] [CrossRef] [PubMed]
- Lehmann, C.; Loeffler-Wirth, H.; Balz, V.; Enczmann, J.; Landgraf, R.; Lakowa, N.; Gruenewald, T.; Fischer, J.C.; Doxiadis, I. Immunogenetic Predisposition to SARS-CoV-2 Infection. Biology 2022, 12, 37. [Google Scholar] [CrossRef] [PubMed]
- Sanchez-Mazas, A.; Nunes, J.M.; Middleton, D.; Sauter, J.; Buhler, S.; McCabe, A.; Hofmann, J.; Baier, D.M.; Schmidt, A.H.; Nicoloso, G.; et al. Common and well-documented HLA alleles over all of Europe and within European sub-regions: A catalogue from the European Federation for Immunogenetics. HLA 2017, 89, 104–113. [Google Scholar] [CrossRef] [PubMed]
- van Janse Rensburg, W.J.; de Kock, A.; Bester, C.; Kloppers, J.F. HLA major allele group frequencies in a diverse population of the Free State Province, South Africa. Heliyon 2021, 7, e06850. [Google Scholar] [CrossRef]
- Sanchez-Mazas, A.; Černý, V.; Di, D.; Buhler, S.; Podgorná, E.; Chevallier, E.; Brunet, L.; Weber, S.; Kervaire, B.; Testi, M.; et al. The HLA-B landscape of Africa: Signatures of pathogen-driven selection and molecular identification of candidate alleles to malaria protection. Mol. Ecol. 2017, 26, 6238–6252. [Google Scholar] [CrossRef] [PubMed]
- Peterson, T.A.; Bielawny, T.; Lacap, P.; Hardie, R.-A.; Daniuk, C.; Mendoza, L.; Thavaneswaran, S.; Kariri, T.; Kimani, J.; Wachihi, C.; et al. Diversity and Frequencies of HLA Class I and Class II Genes of an East African Population. Open J. Genet. 2014, 4, 99–124. [Google Scholar] [CrossRef]
- Baek, I.-C.; Choi, E.-J.; Shin, D.-H.; Kim, H.-J.; Choi, H.; Kim, T.-G. Allele and haplotype frequencies of human leukocyte antigen-A, -B, -C, -DRB1, -DRB3/4/5, -DQA1, -DQB1, -DPA1, and -DPB1 by next generation sequencing-based typing in Koreans in South Korea. PLoS ONE 2021, 16, e0253619. [Google Scholar] [CrossRef]
- Jawdat, D.; Uyar, F.A.; Alaskar, A.; Müller, C.R.; Hajeer, A. HLA-A, -B, -C, -DRB1, -DQB1, and -DPB1 Allele and Haplotype Frequencies of 28,927 Saudi Stem Cell Donors Typed by Next-Generation Sequencing. Front. Immunol. 2020, 11, 544768. [Google Scholar] [CrossRef]
- Climent, N.; Plana, M. Immunomodulatory Activity of Tyrosine Kinase Inhibitors to Elicit Cytotoxicity Against Cancer and Viral Infection. Front. Pharmacol. 2019, 10, 1232. [Google Scholar] [CrossRef]
- Harada, I.; Sasaki, H.; Murakami, K.; Nishiyama, A.; Nakabayashi, J.; Ichino, M.; Miyazaki, T.; Kumagai, K.; Matsumoto, K.; Hagihara, M.; et al. Compromised anti-tumor-immune features of myeloid cell components in chronic myeloid leukemia patients. Sci. Rep. 2021, 11, 18046. [Google Scholar] [CrossRef] [PubMed]
- Hunter, C.A.; Jones, S.A. IL-6 as a keystone cytokine in health and disease. Nat. Immunol. 2015, 16, 448–457, Erratum in Nat. Immunol. 2017, 18, 1271. [Google Scholar] [CrossRef]
- National Institute of Environmental Health Sciences. SNPinfo Web Server. Available online: https://snpinfo.niehs.nih.gov/cgi-bin/snpinfo/snpfunc.cgi (accessed on 30 December 2023).
- Hochhaus, A.; Baccarani, M.; Silver, R.T.; Schiffer, C.; Apperley, J.F.; Cervantes, F.; Clark, R.E.; Cortes, J.E.; Deininger, M.W.; Guilhot, F.; et al. European LeukemiaNet 2020 recommendations for treating chronic myeloid leukemia. Leukemia 2020, 34, 966–984. [Google Scholar] [CrossRef]
- Li, N.; Wang, J.-X.; Huo, T.-T.; Zhao, J.-R.; Wang, T.-J. Associations of IL-1β and IL-6 gene polymorphisms with Parkinson’s disease. Eur. Rev. Med. Pharmacol. Sci. 2021, 25, 890–897. [Google Scholar] [CrossRef] [PubMed]
- Snoussi, K.; Strosberg, A.D.; Bouaouina, N.; Ben Ahmed, S.; Chouchane, L. Genetic variation in pro-inflammatory cytokines (interleukin-1beta, interleukin-1alpha and interleukin-6) associated with the aggressive forms, survival, and relapse prediction of breast carcinoma. Eur. Cytokine Netw. 2005, 16, 253–260. [Google Scholar] [PubMed]
- Park, S.-J.; Nakagawa, T.; Kitamura, H.; Atsumi, T.; Kamon, H.; Sawa, S.-I.; Kamimura, D.; Ueda, N.; Iwakura, Y.; Ishihara, K.; et al. IL-6 regulates in vivo dendritic cell differentiation through STAT3 activation. J. Immunol. 2004, 173, 3844–3854. [Google Scholar] [CrossRef] [PubMed]
- Anand, M.; Chodda, S.K.; Parikh, P.M.; Nadkarni, J.S. Abnormal levels of proinflammatory cytokines in serum and monocyte cultures from patients with chronic myeloid leukemia in different stages, and their role in prognosis. Hematol. Oncol. 1998, 16, 143–154. [Google Scholar] [CrossRef]
- Soma, K.; Nanami, G.; Kasamatsu, T.; Murakami, Y.; Ishihara, R.; Awata, M.; Yamane, E.; Sunaga, M.; Asao, Y.; Hashimoto, N.; et al. Th1 Cytokine Polymorphism Gene: TNF-alpha -857C/T Affects the Pathogenesis and Progression of Acute Myeloid Leukemia. Blood 2019, 134, 1431. [Google Scholar] [CrossRef]
- Abdalhabib, E.K.; Algarni, A.; Saboor, M.; Alanazi, F.; Ibrahim, I.K.; Alfeel, A.H.; Alanazi, A.M.; Alanazi, A.M.; Alruwaili, A.M.; Alanazi, M.H.; et al. Association of TNF-α rs1800629 with Adult Acute B-Cell Lymphoblastic Leukemia. Genes 2022, 13, 1237. [Google Scholar] [CrossRef]
- Chen, L.; Huang, Z.; Liao, Y.; Yang, B.; Zhang, J. Association between tumor necrosis factor polymorphisms and rheumatoid arthritis as well as systemic lupus erythematosus: A meta-analysis. Braz. J. Med. Biol. Res. 2019, 52, e7927. [Google Scholar] [CrossRef]
- Bănescu, C.; Tripon, F.; Trifa, A.P.; Crauciuc, A.G.; Moldovan, V.G.; Bogliş, A.; Benedek, I.; Dima, D.; Cândea, M.; Duicu, C.; et al. Cytokine rs361525, rs1800750, rs1800629, rs1800896, rs1800872, rs1800795, rs1800470, and rs2430561 SNPs in relation with prognostic factors in acute myeloid leukemia. Cancer Med. 2019, 8, 5492–5506. [Google Scholar] [CrossRef] [PubMed]
- Stark, G.R.; Kerr, I.M.; Williams, B.R.; Silverman, R.H.; Schreiber, R.D. How cells respond to interferons. Annu. Rev. Biochem. 1998, 67, 227–264. [Google Scholar] [CrossRef] [PubMed]
- Rossouw, M.; Nel, H.J.; Cooke, G.S.; van Helden, P.D.; Hoal, E.G. Association between tuberculosis and a polymorphic NFkappaB binding site in the interferon gamma gene. Lancet 2003, 361, 1871–1872. [Google Scholar] [CrossRef] [PubMed]
- Wu, Z.; Sun, Y.; Zhu, S.; Tang, S.; Liu, C.; Qin, W. Association of Interferon gamma +874T/A Polymorphism and Leukemia Risk: A Meta-Analysis. Medicine 2016, 95, e3129. [Google Scholar] [CrossRef] [PubMed]
- Tarafdar, A.; Hopcroft, L.E.M.; Gallipoli, P.; Pellicano, F.; Cassels, J.; Hair, A.; Korfi, K.; Jørgensen, H.G.; Vetrie, D.; Holyoake, T.L.; et al. CML cells actively evade host immune surveillance through cytokine-mediated downregulation of MHC-II expression. Blood 2017, 129, 199–208. [Google Scholar] [CrossRef] [PubMed]
- Johnson-Ansah, H.A.; Briant, A.; Charbonnier, A.; Cambier, N.; Damaj, G.L.; Lenain, P.; Henry, A.; Parienti, J.-J.; Guenet, D.; GAC Besnard, A.-C.; et al. Interleukin 10 (IL10) and IL15 Significantly Decreased in Chronic Myeloid Leukemia Patients Presenting with Tyrosine Kinase Inhibitor (TKI) Withdrawal Syndrome (TWS). Results from the Prospective, Explorative and Multicenter «Kiwis» Study Designed for TWS. Clinicaltrial.Gov ID:NCT03996096; Study Number: 18-206. Blood 2023, 142, 6335. [Google Scholar] [CrossRef]
- Naka, K.; Hoshii, T.; Muraguchi, T.; Tadokoro, Y.; Ooshio, T.; Kondo, Y.; Nakao, S.; Motoyama, N.; Hirao, A. TGF-beta-FOXO signalling maintains leukaemia-initiating cells in chronic myeloid leukaemia. Nature 2010, 463, 676–680. [Google Scholar] [CrossRef] [PubMed]
- Giustacchini, A.; Thongjuea, S.; Barkas, N.; Woll, P.S.; Povinelli, B.J.; Booth, C.A.G.; Sopp, P.; Norfo, R.; Rodriguez-Meira, A.; Ashley, N.; et al. Single-cell transcriptomics uncovers distinct molecular signatures of stem cells in chronic myeloid leukemia. Nat. Med. 2017, 23, 692–702. [Google Scholar] [CrossRef] [PubMed]
- Kumar, A.; Anand, T.; Bhattacharyya, J.; Sharma, A.; Jaganathan, B.G. K562 chronic myeloid leukemia cells modify osteogenic differentiation and gene expression of bone marrow stromal cells. J. Cell Commun. Signal. 2018, 12, 441–450. [Google Scholar] [CrossRef]
- Fort, M.; de Stefano, G.F.; Cambon-Thomsen, A.; Giraldo-Alvarez, P.; Dugoujon, J.M.; Ohayon, E.; Scano, G.; Abbal, M. HLA class II allele and haplotype frequencies in Ethiopian Amhara and Oromo populations. Tissue Antigens 1998, 51, 327–336. [Google Scholar] [CrossRef]
| Clinical Feature of Total CML Cohort | n | % |
|---|---|---|
| Number of patients | 63 | |
| Male-to-female ratio | 2 | 58.7:41.3 |
| Stage of disease at diagnosis | ||
| CP | 59 | 93.7 |
| AP | 2 | 3.2 |
| BP | 2 | 3.2 |
| Splenomegaly at diagnosis | 62 | 98 |
| Hemoglobin at diagnosis | ||
| </=8 g/dL * | 10 | 15.9 |
| <12 g/dL | 35 | 55.5 |
| >/=12 g/dL | 18 | 28.6 |
| Sokal risk score at diagnosis | ||
| Low | 3 | 4.8 |
| Intermediate | 16 | 25.4 |
| High | 44 | 69.8 |
| WBC < 100,000/µL at diagnosis | 15 | 23.8 |
| Platelet > 450,000/µL at diagnosis | 17 | 26.9 |
| Median age at diagnosis in years (range) | 37(19–69) | |
| Median treatment duration, months (range) | 48 (1–144) | |
| Current BCR-ABL 1% (IS); median (95% CI) | 33.8 (3.4–38.0) |
| Post-Treatment Clinical Features (n = 51 *) | Clinical Outcome, Median (Range) ** | |
|---|---|---|
| Favorable (n = 22) | Unfavorable (n = 29) | |
| Treatment duration, months | 60 (9–144) | 36 (1–144) |
| WBC × 103/µL | 6.05 (3.4–10.7) | 19.1 (2.8–180) |
| Platelets t × 103/µL | 225.5 (74–390) | 182 (24–1314) |
| Hemoglobin, g/dL | 14,2 (13–17) | 12 (7.6–16.9) |
| BCR::ABL1 (IS) | 0.02 (0.0001–0.25) | 42.2 (2.02–78.22) |
| Cytokine | Genotype | All Patients with CML (n = 63) | Only TKI Treated Patients with CML (n = 51) ** | p-Value * | ||||
|---|---|---|---|---|---|---|---|---|
| Favorable Group (n = 22) | Unfavorable Group (n = 29) | |||||||
| n | % | n | % | n | % | |||
| TNF-α (promoter −308G, −308A) | G/G low | 60 | 95.2 | 21 | 95.5 | 27 | 93.1 | 1.000 |
| G/A high | 2 | 3.2 | 1 | 4.5 | 1 | 3.4 | 1.000 | |
| A/A high | 1 | 1.2 | 0 | 0.0 | 1 | 3.4 | 1.000 | |
| IL-6 (promoter −174C, −174G) | C/C low | 3 | 4.8 | 0 | 0.0 | 1 | 3.4 | 1.000 |
| G/G high | 48 | 76.2 | 19 | 86.4 | 20 | 69.0 | 0.193 | |
| G/C high | 12 | 19.0 | 3 | 13.6 | 8 | 27.6 | 0.312 | |
| IFN-γ (intron +874T, +874A) | A/A low | 31 | 49.2 | 9 | 40.9 | 18 | 62.1 | 0.164 |
| T/A intermediate | 25 | 39.7 | 11 | 50.0 | 9 | 31.0 | 0.248 | |
| T/T high | 7 | 11.1 | 2 | 9.1 | 2 | 6.9 | 1.000 | |
| TGF-β (codon 10T, 10C, 25C, 25G) | C/C G/C low | 2 | 3.2 | 2 | 9.1 | 0 | 0.0 | 0.181 |
| C/C C/C low | 1 | 1.6 | 0 | 0.0 | 1 | 3.4 | 1.000 | |
| T/T C/C low | 0 | 0.0 | 0 | 0.0 | 0 | 0.0 | na | |
| T/C C/C low | 0 | 0.0 | 0 | 0.0 | 0 | 0.0 | na | |
| T/C G/C intermediate | 6 | 9.5 | 1 | 4.5 | 4 | 13.8 | 0.375 | |
| C/C G/G intermediate | 9 | 14.3 | 3 | 13.6 | 5 | 17.2 | 1.000 | |
| T/T G/C intermediate | 0 | 0.0 | 0 | 0.0 | 0 | 0.0 | 1.000 | |
| T/T G/G high | 22 | 34.9 | 7 | 31.8 | 11 | 37.9 | 0.770 | |
| T/C G/G high | 23 | 36.5 | 9 | 40.9 | 8 | 27.6 | 0.377 | |
| IL-10 (promoter −1082A, −1082G, −819T, −819C, −592A, −592C) | ACC/ACC low | 1 | 1.6 | 0 | 0.0 | 0 | 0.0 | na |
| ACC/ATA low | 11 | 17.5 | 5 | 22.7 | 6 | 20.7 | 1.000 | |
| ATA/ATA low | 3 | 4.8 | 1 | 4.5 | 2 | 6.9 | 1.000 | |
| GCC/ACC intermediate | 18 | 28.6 | 3 | 13.6 | 9 | 31.0 | 0.193 | |
| GCC/ATA intermediate | 16 | 25.4 | 5 | 22.7 | 6 | 20.7 | 1.000 | |
| GCC/GCC high | 14 | 22.2 | 8 | 36.4 | 6 | 20.7 | 0.342 | |
| Locus | Favorable Group | Unfavorable Group | |||||||
| HLA-A | Phenotype Count (n = 162) | Allele Count (2n = 324) | Phenotype Frequency (%) | Frequency (%) | Allele Count (2n = 96) | Allele Frequency (%) | Allele Count (2n = 206) | Allele Frequency (%) | Fisher Exact (p-Value) |
| A*01:01:01 | 22.0 | 23.0 | 0.2 | 7.1 | 10 | 10.4 | 13 | 6.3 | ns |
| A*01:02:01 | 1.0 | 1.0 | 0.0 | 0.3 | 1 | 1.0 | 0 | 0 | ns |
| A*01:03:01 | 21.0 | 21.0 | 0.2 | 6.5 | 7 | 7.3 | 12 | 5.8 | ns |
| A*02:01:01 | 50.0 | 52.0 | 0.4 | 16.0 | 13 | 13.5 | 37 | 18.0 | ns |
| A*02:02:01 | 26.0 | 26.0 | 0.2 | 8.0 | 13 | 13.5 | 12 | 5.8 | ns |
| A*02:05:01 | 12.0 | 12.0 | 0.1 | 3.7 | 5 | 5.2 | 7 | 3.4 | ns |
| A*02:05:02 | 1.0 | 1.0 | 0.0 | 0.3 | 0 | 0 | 1 | 0.5 | ns |
| A*02:06:01 | 1.0 | 1.0 | 0.0 | 0.3 | 0 | 0 | 1 | 0.5 | ns |
| A*02:104 | 1.0 | 1.0 | 0.0 | 0.3 | 1 | 1.0 | 0 | 0 | ns |
| A*02:14 | 1.0 | 1.0 | 0.0 | 0.3 | 0 | 0 | 1 | 0.5 | ns |
| A*02:22:01 | 4.0 | 4.0 | 0.0 | 1.2 | 1 | 1.0 | 2 | 1.0 | ns |
| A*03:01:01 | 28.0 | 29.0 | 0.2 | 9.0 | 5 | 5.2 | 23 | 11.2 | 0.0347 * |
| A*03:02:01 | 2.0 | 2.0 | 0.0 | 0.6 | 0 | 0 | 2 | 1.0 | |
| A*11:01:01 | 3.0 | 3.0 | 0.0 | 0.9 | 2 | 2.1 | 1 | 0.5 | ns |
| A*23:01:01 | 5.0 | 5.0 | 0.0 | 1.5 | 1 | 1.0 | 4 | 1.9 | ns |
| A*23:17:01 | 10.0 | 10.0 | 0.1 | 3.1 | 0 | 0 | 9 | 4.4 | 0.0285 ** |
| A*24:02:01 | 5.0 | 5.0 | 0.0 | 1.5 | 1 | 1.0 | 4 | 1.9 | ns |
| A*26:01:01 | 1.0 | 1.0 | 0.0 | 0.3 | 0 | 0 | 0 | 0 | ns |
| A*29:02:01 | 1.0 | 1.0 | 0.0 | 0.3 | 0 | 0 | 1 | 0.5 | ns |
| A*30:01:01 | 19.0 | 19.0 | 0.2 | 5.9 | 2 | 2.1 | 14 | 6.8 | ns |
| A*30:02:01 | 19.0 | 19.0 | 0.2 | 5.9 | 5 | 5.2 | 11 | 5.3 | ns |
| A*30:04:01 | 7.0 | 7.0 | 0.1 | 2.2 | 2 | 2.1 | 5 | 2.4 | ns |
| A*30:10 | 5.0 | 6.0 | 0.0 | 1.9 | 2 | 2.1 | 3 | 1.5 | ns |
| A*31:04 | 1.0 | 1.0 | 0.0 | 0.3 | 0 | 0 | 1 | 0.5 | ns |
| A*32:01:01 | 10.0 | 10.0 | 0.1 | 3.1 | 3 | 3.1 | 7 | 3.4 | ns |
| A*33:03:01 | 4.0 | 4.0 | 0.0 | 1.2 | 0 | 0 | 4 | 1.9 | ns |
| A*33:123N | 2.0 | 2.0 | 0.0 | 0.6 | 0 | 0 | 2 | 1.0 | ns |
| A*66:01:01 | 10.0 | 10.0 | 0.1 | 3.1 | 4 | 4.2 | 5 | 2.4 | ns |
| A*66:03:01 | 3.0 | 3.0 | 0.0 | 0.9 | 0 | 0 | 3 | 1.5 | ns |
| A*68:01:01 | 10.0 | 10.0 | 0.1 | 3.1 | 4 | 4.2 | 6 | 2.9 | ns |
| A*68:02:01 | 26.0 | 27.0 | 0.2 | 8.3 | 8 | 8.3 | 14 | 6.8 | ns |
| A*74:01:01 | 3.0 | 3.0 | 0.0 | 0.9 | 3 | 3.1 | 0 | 0 | ns |
| A*74:03 | 4.0 | 4.0 | 0.0 | 1.2 | 3 | 3.1 | 1 | 0.5 | ns |
| Locus | Favorable group | Unfavorable group | |||||||
| HLA-B | phenotype count (n = 162) | allele count (2n = 324) | phenotype frequency (%) | frequency (%) | allele count (2n = 96) | allele frequency (%) | allele count (2n = 206) | allele frequency (%) | Fisher exact (p-value) |
| B*07:02:01 | 31.0 | 31.0 | 0.2 | 9.6 | 12 | 12.5 | 17 | 8.3 | ns |
| B*07:05:01 | 15.0 | 16.0 | 0.1 | 4.9 | 3 | 3.1 | 10 | 4.9 | ns |
| B*07:06:01 | 1.0 | 1.0 | 0.0 | 0.3 | 0 | 0 | 1 | 0.5 | ns |
| B*08:01:01 | 6.0 | 6.0 | 0.0 | 1.9 | 2 | 2.1 | 4 | 1.9 | ns |
| B*13:02:01 | 16.0 | 17.0 | 0.1 | 5.2 | 6 | 6.3 | 11 | 5.3 | ns |
| B*14:01:01 | 2.0 | 2.0 | 0.0 | 0.6 | 1 | 1 | 1 | 0.5 | ns |
| B*14:02:01 | 13.0 | 13.0 | 0.1 | 4.0 | 3 | 3.1 | 10 | 4.9 | ns |
| B*15:10:01 | 5.0 | 5.0 | 0.0 | 1.5 | 1 | 1 | 3 | 1.5 | ns |
| B*15:16:01 | 1.0 | 1.0 | 0.0 | 0.3 | 0 | 0 | 1 | 0.5 | ns |
| B*15:17:01 | 4.0 | 4.0 | 0.0 | 1.2 | 1 | 1 | 3 | 1.5 | ns |
| B*15:18:01 | 2.0 | 2.0 | 0.0 | 0.6 | 0 | 0 | 2 | 1 | ns |
| B*15:220:01 | 24.0 | 25.0 | 0.2 | 7.7 | 7 | 7.3 | 17 | 8.3 | ns |
| B*18:01:01 | 7.0 | 7.0 | 0.1 | 2.2 | 3 | 3.1 | 4 | 1.9 | ns |
| B*27:03 | 6.0 | 6.0 | 0.0 | 1.9 | 2 | 2.1 | 4 | 1.9 | ns |
| B*27:05:02 | 1.0 | 1.0 | 0.0 | 0.3 | 0 | 0 | 1 | 0.5 | ns |
| B*27:26 | 1.0 | 1.0 | 0.0 | 0.3 | 0 | 0 | 1 | 0.5 | ns |
| B*35:01:01 | 5.0 | 5.0 | 0.0 | 1.5 | 1 | 1 | 4 | 1.9 | ns |
| B*35:03:01 | 1.0 | 1.0 | 0.0 | 0.3 | 0 | 0 | 1 | 0.5 | ns |
| B*35:08:01 | 3.0 | 3.0 | 0.0 | 0.9 | 0 | 0 | 3 | 1.5 | ns |
| B*37:01:01 | 1.0 | 1.0 | 0.0 | 0.3 | 1 | 1 | 0 | 0 | ns |
| B*39:10:01 | 10.0 | 10.0 | 0.1 | 3.1 | 3 | 3.1 | 5 | 2.4 | ns |
| B*39:24:01 | 4.0 | 5.0 | 0.0 | 1.5 | 2 | 2.1 | 3 | 1.5 | ns |
| B*40:01:02 | 3.0 | 3.0 | 0.0 | 0.9 | 1 | 1 | 2 | 1 | ns |
| B*40:02:01 | 1.0 | 1.0 | 0.0 | 0.3 | 0 | 0 | 1 | 0.5 | ns |
| B*41:01:01 | 16.0 | 16.0 | 0.1 | 4.9 | 5 | 5.2 | 7 | 3.4 | ns |
| B*41:02:01 | 6.0 | 6.0 | 0.0 | 1.9 | 3 | 3.1 | 2 | 1 | ns |
| B*44:03:01 | 16.0 | 18.0 | 0.1 | 5.6 | 4 | 4.2 | 14 | 6.8 | ns |
| B*44:03:02 | 1.0 | 1.0 | 0.0 | 0.3 | 0 | 0 | 1 | 0.5 | ns |
| B*47:01:01 | 5.0 | 6.0 | 0.0 | 1.9 | 1 | 1 | 5 | 2.4 | ns |
| B*49:01:01 | 25.0 | 25.0 | 0.2 | 7.7 | 3 | 3.1 | 19 | 9.2 | ns |
| B*50:01:01 | 4.0 | 4.0 | 0.0 | 1.2 | 3 | 3.1 | 1 | 0.5 | ns |
| B*51:01:01 | 12.0 | 13.0 | 0.1 | 4.0 | 3 | 3.1 | 9 | 4.4 | ns |
| B*51:08:01 | 2.0 | 2.0 | 0.0 | 0.6 | 1 | 1 | 1 | 0.5 | ns |
| B*53:01:01 | 24.0 | 24.0 | 0.2 | 7.4 | 8 | 8.3 | 15 | 7.3 | ns |
| B*55:01:01 | 1.0 | 1.0 | 0.0 | 0.3 | 0 | 0 | 0 | 0 | ns |
| B*57:01:01 | 3.0 | 3.0 | 0.0 | 0.9 | 1 | 1 | 2 | 1 | 0.037 * |
| B*57:02:01 | 5.0 | 5.0 | 0.0 | 1.5 | 2 | 2.1 | 2 | 1 | |
| B*57:03:01 | 12.0 | 12.0 | 0.1 | 3.7 | 7 | 7.3 | 5 | 2.4 | 0.0451 ** |
| B*58:01:01 | 18.0 | 18.0 | 0.1 | 5.6 | 5 | 5.2 | 12 | 5.8 | ns |
| B*73:01 | 2.0 | 2.0 | 0.0 | 0.6 | 1 | 1 | 1 | 0.5 | ns |
| B*81:02:02 | 1.0 | 1.0 | 0.0 | 0.3 | 0 | 0 | 1 | 0.5 | ns |
| Locus | Favorable group | Unfavorable group | |||||||
| HLA-C | phenotype count (n = 162) | allele count (2n = 324) | phenotype frequency (%) | frequency (%) | allele count (2n = 96) | allele frequency (%) | allele count (2n = 206) | allele frequency (%) | Fisher exact (p-value) |
| C*02:02:02 | 9.0 | 9.0 | 0.1 | 2.8 | 2 | 2.1 | 7 | 3.4 | ns |
| C*03:02:01 | 1.0 | 1.0 | 0.0 | 0.3 | 1 | 1 | 0 | 0 | ns |
| C*03:02:02 | 10.0 | 10.0 | 0.1 | 3.1 | 2 | 2.1 | 7 | 3.4 | ns |
| C*03:04:01 | 2.0 | 2.0 | 0.0 | 0.6 | 0 | 0 | 2 | 1 | ns |
| C*03:04:02 | 5.0 | 5.0 | 0.0 | 1.5 | 1 | 1 | 3 | 1.5 | ns |
| C*04:01:01 | 43.0 | 46.0 | 0.3 | 14.2 | 12 | 12.5 | 31 | 15 | ns |
| C*04:07:01 | 2.0 | 2.0 | 0.0 | 0.6 | 2 | 2.1 | 0 | 0 | ns |
| C*06:02:01 | 40.0 | 43.0 | 0.3 | 13.3 | 17 | 17.7 | 26 | 12.6 | ns |
| C*07:01:01 | 43.0 | 44.0 | 0.3 | 13.6 | 9 | 9.4 | 32 | 15.5 | ns |
| C*07:01:02 | 10.0 | 10.0 | 0.1 | 3.1 | 5 | 5.2 | 5 | 2.4 | ns |
| C*07:02:01 | 33.0 | 33.0 | 0.3 | 10.2 | 11 | 11.5 | 20 | 9.7 | ns |
| C*07:04:01 | 8.0 | 8.0 | 0.1 | 2.5 | 4 | 4.2 | 4 | 1.9 | ns |
| C*07:06:01 | 1.0 | 1.0 | 0.0 | 0.3 | 0 | 0 | 1 | 0.5 | ns |
| C*07:18:01 | 7.0 | 7.0 | 0.1 | 2.2 | 2 | 2.1 | 5 | 2.4 | ns |
| C*07:623 | 1.0 | 1.0 | 0.0 | 0.3 | 0 | 0 | 1 | 0.5 | ns |
| C*08:02:01 | 13.0 | 13.0 | 0.1 | 4.0 | 3 | 3.1 | 10 | 4.9 | ns |
| C*08:183 | 1.0 | 1.0 | 0.0 | 0.3 | 0 | 0 | 1 | 0.5 | ns |
| C*08:28 | 1.0 | 1.0 | 0.0 | 0.3 | 1 | 1 | 0 | 0 | ns |
| C*12:03:01 | 9.0 | 9.0 | 0.1 | 2.8 | 3 | 3.1 | 4 | 1.9 | ns |
| C*12:167 | 1.0 | 1.0 | 0.0 | 0.3 | 0 | 0 | 1 | 0.5 | ns |
| C*14:02:01 | 2.0 | 2.0 | 0.0 | 0.6 | 1 | 1 | 1 | 0.5 | ns |
| C*14:03:01 | 2.0 | 2.0 | 0.0 | 0.6 | 0 | 0 | 2 | 1 | ns |
| C*15:02:01 | 2.0 | 2.0 | 0.0 | 0.6 | 0 | 0 | 1 | 0.5 | ns |
| C*15:05:01 | 5.0 | 5.0 | 0.0 | 1.5 | 2 | 2.1 | 3 | 1.5 | ns |
| C*15:05:02 | 16.0 | 17.0 | 0.1 | 5.2 | 3 | 3.1 | 11 | 5.3 | ns |
| C*16:01:01 | 5.0 | 5.0 | 0.0 | 1.5 | 3 | 3.1 | 2 | 1 | ns |
| C*16:02:01 | 6.0 | 6.0 | 0.0 | 1.9 | 1 | 1 | 5 | 2.4 | ns |
| C*16:04:01 | 6.0 | 6.0 | 0.0 | 1.9 | 1 | 1 | 5 | 2.4 | ns |
| C*17:01:01 | 19.0 | 19.0 | 0.2 | 5.9 | 6 | 6.3 | 8 | 3.9 | ns |
| C*17:03:01 | 4.0 | 4.0 | 0.0 | 1.2 | 2 | 2.1 | 2 | 1 | ns |
| C*18:01:01 | 1.0 | 1.0 | 0.0 | 0.3 | 1 | 1 | 0 | 0 | ns |
| C*18:02:01 | 8.0 | 8.0 | 0.1 | 2.5 | 1 | 1 | 6 | 2.9 | ns |
| Locus | Favorable group | Unfavorable group | |||||||
| HLA-DRB1 | phenotype count (n = 162) | allele count (2n = 324) | phenotype frequency (%) | frequency (%) | allele count (2n = 96) | allele frequency (%) | allele count (2n = 206) | allele frequency (%) | Fisher exact (p-value) |
| DRB1*01:02:01 | 36 | 40 | 0.2 | 12.3 | 9 | 9.4 | 26 | 12.6 | ns |
| DRB1*03:01:01 | 30 | 30 | 0.2 | 9.3 | 11 | 11.5 | 17 | 8.3 | ns |
| DRB1*03:144 | 3 | 3 | 0.0 | 0.9 | 0 | 0.0 | 3 | 1.5 | ns |
| DRB1*04:01:01 | 7 | 7 | 0.0 | 2.2 | 3 | 3.1 | 4 | 1.9 | ns |
| DRB1*04:03:01 | 9 | 9 | 0.1 | 2.8 | 1 | 1.0 | 7 | 3.4 | ns |
| DRB1*04:04:01 | 10 | 10 | 0.1 | 3.1 | 5 | 5.2 | 4 | 1.9 | ns |
| DRB1*04:05:01 | 8 | 8 | 0.0 | 2.5 | 4 | 4.2 | 4 | 1.9 | ns |
| DRB1*04:06:01 | 1 | 1 | 0.0 | 0.3 | 1 | 1.0 | 0 | 0.0 | ns |
| DRB1*04:06:02 | 2 | 2 | 0.0 | 0.6 | 0 | 0.0 | 2 | 1.0 | ns |
| DRB1*04:08:01 | 1 | 1 | 0.0 | 0.3 | 0 | 0.0 | 1 | 0.5 | ns |
| DRB1*04:201 | 1 | 1 | 0.0 | 0.3 | 0 | 0.0 | 1 | 0.5 | ns |
| DRB1*07:01:01 | 57 | 64 | 0.4 | 19.8 | 17 | 17.7 | 40 | 19.4 | ns |
| DRB1*08:04:01 | 16 | 16 | 0.1 | 4.9 | 4 | 4.2 | 10 | 4.9 | ns |
| DRB1*08:08 | 4 | 4 | 0.0 | 1.2 | 1 | 1.0 | 3 | 1.5 | ns |
| DRB1*10:01:01 | 8 | 8 | 0.0 | 2.5 | 2 | 2.1 | 6 | 2.9 | ns |
| DRB1*11:01:01 | 5 | 5 | 0.0 | 1.5 | 0 | 0.0 | 4 | 1.9 | ns |
| DRB1*11:01:02 | 1 | 1 | 0.0 | 0.3 | 0 | 0.0 | 1 | 0.5 | ns |
| DRB1*13:01:01 | 6 | 6 | 0.0 | 1.9 | 2 | 2.1 | 4 | 1.9 | ns |
| DRB1*13:02:01 | 56 | 63 | 0.3 | 19.4 | 20 | 20.8 | 43 | 20.9 | ns |
| DRB1*13:03:01 | 11 | 12 | 0.1 | 3.7 | 5 | 5.2 | 7 | 3.4 | ns |
| DRB1*14:01:01 | 1 | 1 | 0.0 | 0.3 | 0 | 0.0 | 1 | 0.5 | ns |
| DRB1*14:54:01 | 5 | 5 | 0.0 | 1.5 | 3 | 3.1 | 1 | 0.5 | ns |
| DRB1*15:01:01 | 3 | 3 | 0.0 | 0.9 | 1 | 1.0 | 2 | 1.0 | ns |
| DRB1*15:03:01 | 24 | 24 | 0.1 | 7.4 | 7 | 7.3 | 15 | 7.3 | ns |
| HLA-DRB345 | phenotype count (n = 162) | allele count (2n = 324) | phenotype frequency (%) | frequency (%) | allele count (2n = 96) | allele frequency (%) | allele count (2n = 206) | allele frequency (%) | Fisher exact (p-value) |
| DRB3*01:01:02 | 18 | 21 | 0.1 | 6.5 | 5 | 5.2 | 15 | 7.3 | ns |
| DRB3*02:02:01 | 47 | 53 | 0.3 | 16.4 | 18 | 18.8 | 30 | 14.6 | ns |
| DRB3*03:01:01 | 54 | 70 | 0.3 | 21.6 | 19 | 19.8 | 51 | 24.8 | ns |
| DRB3*03:15 | 1 | 1 | 0.0 | 0.3 | 1 | 1.0 | 0 | 0.0 | ns |
| DRB4*01:01:01 | 13 | 21 | 0.1 | 6.5 | 2 | 2.1 | 19 | 9.2 | 0.0127 |
| DRB4*01:03:01 | 69 | 77 | 0.4 | 23.8 | 28 | 29.2 | 36 | 17.5 | 0.0058 |
| DRB4*01:03:01:02N | 15 | 16 | 0.1 | 4.9 | 4 | 4.2 | 12 | 5.8 | ns |
| DRB4*01:03:03 | 6 | 6 | 0.0 | 1.9 | 2 | 2.1 | 4 | 1.9 | ns |
| DRB5*01:01:01 | 30 | 31 | 0.2 | 9.6 | 9 | 9.4 | 20 | 9.7 | ns |
| non # | 28 | 28 | 0.2 | 8.6 | 8 | 8.3 | 19 | 9.2 | ns |
| Locus | Favorable group | Unfavorable group | |||||||
| HLA-DQA1 | phenotype count (n = 162) | allele count (2n = 324) | phenotype frequency (%) | frequency (%) | allele count (2n = 96) | allele frequency (%) | allele count (2n = 206) | allele frequency (%) | Fisher exact (p-value) |
| DQA1*01:01:02 | 36 | 40 | 0.2 | 12.3 | 9 | 9.4 | 26 | 12.6 | ns |
| DQA1*01:02:01 | 75 | 82 | 0.5 | 25.3 | 26 | 27.1 | 55 | 26.7 | ns |
| DQA1*01:02:02 | 8 | 8 | 0.0 | 2.5 | 4 | 4.2 | 3 | 1.5 | ns |
| DQA1*01:03:01 | 6 | 6 | 0.0 | 1.9 | 2 | 2.1 | 4 | 1.9 | ns |
| DQA1*01:04:01 | 3 | 3 | 0.0 | 0.9 | 2 | 2.1 | 0 | 0.0 | ns |
| DQA1*01:05:01 | 8 | 8 | 0.0 | 2.5 | 2 | 2.1 | 6 | 2.9 | ns |
| DQA1*01:05:02 | 3 | 3 | 0.0 | 0.9 | 1 | 1.0 | 2 | 1.0 | ns |
| DQA1*02:01:01 | 57 | 64 | 0.4 | 19.8 | 15 | 15.6 | 42 | 20.4 | ns |
| DQA1*03:01:01 | 14 | 14 | 0.1 | 4.3 | 3 | 3.1 | 10 | 4.9 | ns |
| DQA1*03:03:01 | 25 | 25 | 0.2 | 7.7 | 11 | 11.5 | 13 | 6.3 | ns |
| DQA1*04:01:01 | 4 | 4 | 0.0 | 1.2 | 1 | 1.0 | 3 | 1.5 | ns |
| DQA1*04:01:02 | 4 | 4 | 0.0 | 1.2 | 2 | 2.1 | 2 | 1.0 | ns |
| DQA1*05:01:01 | 32 | 33 | 0.2 | 10.2 | 11 | 11.5 | 20 | 9.7 | ns |
| DQA1*05:05:01 | 30 | 30 | 0.2 | 9.3 | 7 | 7.3 | 20 | 9.7 | ns |
| HLA-DQB1 | phenotype count (n = 162) | allele count (2n = 324) | phenotype frequency (%) | frequency (%) | allele count (2n = 96) | allele frequency (%) | allele count (2n = 206) | allele frequency (%) | Fisher exact (p-value) |
| DQB1*02:01:01 | 31 | 33 | 0.2 | 10.2 | 12 | 12.5 | 19 | 9.2 | ns |
| DQB1*02:02:01 | 56 | 64 | 0.3 | 19.8 | 16 | 16.7 | 41 | 19.9 | ns |
| DQB1*03:01:01 | 32 | 33 | 0.2 | 10.2 | 9 | 9.4 | 22 | 10.7 | ns |
| DQB1*03:01:04 | 3 | 3 | 0.0 | 0.9 | 0 | 0.0 | 2 | 1.0 | ns |
| DQB1*03:02:01 | 16 | 16 | 0.1 | 4.9 | 5 | 5.2 | 11 | 5.3 | ns |
| DQB1*03:03:02 | 7 | 7 | 0.0 | 2.2 | 3 | 3.1 | 4 | 1.9 | ns |
| DQB1*04:02:01 | 10 | 10 | 0.1 | 3.1 | 5 | 5.2 | 4 | 1.9 | ns |
| DQB1*04:02:13 | 2 | 2 | 0.0 | 0.6 | 1 | 1.0 | 1 | 0.5 | ns |
| DQB1*04:87 | 4 | 4 | 0.0 | 1.2 | 1 | 1.0 | 3 | 1.5 | ns |
| DQB1*05:01:01 | 44 | 49 | 0.3 | 15.1 | 11 | 11.5 | 32 | 15.5 | ns |
| DQB1*05:03:01 | 3 | 3 | 0.0 | 0.9 | 2 | 2.1 | 0 | 0.0 | ns |
| DQB1*06:02:01 | 23 | 23 | 0.1 | 7.1 | 5 | 5.2 | 17 | 8.3 | ns |
| DQB1*06:03:01 | 11 | 11 | 0.1 | 3.4 | 4 | 4.2 | 6 | 2.9 | ns |
| DQB1*06:04:01 | 41 | 45 | 0.3 | 13.9 | 16 | 16.7 | 29 | 14.1 | ns |
| DQB1*06:09:01 | 20 | 20 | 0.1 | 6.2 | 5 | 5.2 | 15 | 7.3 | ns |
| DQB1*06:27:01 | 1 | 1 | 0.0 | 0.3 | 1 | 1.0 | 0 | 0.0 | ns |
| Locus | Favorable group | Unfavorable group | |||||||
| HLA-DPA1 | phenotype count (n = 162) | allele count (2n = 324) | phenotype frequency (%) | frequency (%) | allele count (2n = 96) | allele frequency (%) | allele count (2n = 206) | allele frequency (%) | Fisher exact (p-value) |
| DPA1*01:03:01 | 163.0 | 184.0 | 1.0 | 56.8 | 55 | 57.3 | 118 | 57.3 | ns |
| DPA1*01:04 | 6.0 | 6.0 | 0.0 | 1.9 | 2 | 2.1 | 4 | 1.9 | ns |
| DPA1*01:04:01 | 18.0 | 20.0 | 0.1 | 6.2 | 4 | 4.2 | 15 | 7.3 | ns |
| DPA1*01:05 | 1.0 | 1.0 | 0.0 | 0.3 | 0 | 0.0 | 1 | 0.5 | ns |
| DPA1*01:30 | 5.0 | 5.0 | 0.0 | 1.5 | 1 | 1.0 | 4 | 1.9 | ns |
| DPA1*01:58 | 5.0 | 5.0 | 0.0 | 1.5 | 2 | 2.1 | 3 | 1.5 | ns |
| DPA1*01:58:01 | 1.0 | 1.0 | 0.0 | 0.3 | 0 | 0.0 | 1 | 0.5 | ns |
| DPA1*02:01:01 | 73.0 | 79.0 | 0.5 | 24.4 | 23 | 24.0 | 48 | 23.3 | ns |
| DPA1*02:01:07 | 4.0 | 4.0 | 0.0 | 1.2 | 1 | 1.0 | 2 | 1.0 | ns |
| DPA1*02:02:02 | 5.0 | 5.0 | 0.0 | 1.5 | 4 | 4.2 | 1 | 0.5 | ns |
| DPA1*02:09 | 4.0 | 4.0 | 0.0 | 1.2 | 1 | 1.0 | 2 | 1.0 | ns |
| DPA1*03:01:01 | 8.0 | 8.0 | 0.0 | 2.5 | 2 | 2.1 | 6 | 2.9 | ns |
| DPA1*03:01:02 | 1.0 | 1.0 | 0.0 | 0.3 | 0 | 0.0 | 1 | 0.5 | ns |
| DPA1*04:02 | 1.0 | 1.0 | 0.0 | 0.3 | 1 | 1.0 | 0 | 0.0 | ns |
| HLA-DPB1 | phenotype count (n = 162) | allele count (2n = 324) | phenotype frequency (%) | frequency (%) | allele count (2n = 96) | allele frequency (%) | allele count (2n = 206) | allele frequency (%) | Fisher exact (p-value) |
| DPB1*01:01:01 | 2.0 | 2.0 | 0.0 | 0.6 | 3 | 3.1 | 1 | 0.5 | ns |
| DPB1*01:01:02 | 5.0 | 5.0 | 0.0 | 1.5 | 0 | 0.0 | 2 | 1.0 | ns |
| DPB1*02:01:02 | 71.0 | 76.0 | 0.4 | 23.5 | 23 | 24.0 | 50 | 24.3 | ns |
| DPB1*02:01:18 | 1.0 | 1.0 | 0.0 | 0.3 | 0 | 0.0 | 1 | 0.5 | ns |
| DPB1*03:01:01 | 12.0 | 12.0 | 0.1 | 3.7 | 2 | 2.1 | 9 | 4.4 | ns |
| DPB1*04:01:01 | 63.0 | 65.0 | 0.4 | 20.1 | 19 | 19.8 | 43 | 20.9 | ns |
| DPB1*04:02:01 | 5.0 | 5.0 | 0.0 | 1.5 | 1 | 1.0 | 3 | 1.5 | ns |
| DPB1*05:01:01 | 1.0 | 1.0 | 0.0 | 0.3 | 1 | 1.0 | 0 | 0.0 | ns |
| DPB1*09:01:01 | 6.0 | 6.0 | 0.0 | 1.9 | 0 | 0.0 | 6 | 2.9 | ns |
| DPB1*104:01:01 | 15.0 | 16.0 | 0.1 | 4.9 | 7 | 7.3 | 7 | 3.4 | ns |
| DPB1*105:01:01 | 2.0 | 2.0 | 0.0 | 0.6 | 0 | 0.0 | 2 | 1.0 | ns |
| DPB1*105:02:01 | 1.0 | 1.0 | 0.0 | 0.3 | 0 | 0.0 | 1 | 0.5 | ns |
| DPB1*11:01:01 | 17.0 | 18.0 | 0.1 | 5.6 | 6 | 6.3 | 8 | 3.9 | ns |
| DPB1*124:01:01 | 3.0 | 3.0 | 0.0 | 0.9 | 1 | 1.0 | 2 | 1.0 | ns |
| DPB1*13:01:01 | 12.0 | 13.0 | 0.1 | 4.0 | 4 | 4.2 | 6 | 2.9 | ns |
| DPB1*133:01 | 1.0 | 1.0 | 0.0 | 0.3 | 0 | 0.0 | 1 | 0.5 | ns |
| DPB1*135:01:01 | 1.0 | 1.0 | 0.0 | 0.3 | 1 | 1.0 | 0 | 0.0 | ns |
| DPB1*14:01:01 | 6.0 | 6.0 | 0.0 | 1.9 | 3 | 3.1 | 3 | 1.5 | ns |
| DPB1*15:01:01 | 27.0 | 29.0 | 0.2 | 9.0 | 8 | 8.3 | 19 | 9.2 | ns |
| DPB1*17:01:01 | 33.0 | 34.0 | 0.2 | 10.5 | 8 | 8.3 | 24 | 11.7 | ns |
| DPB1*290:01 | 1.0 | 1.0 | 0.0 | 0.3 | 0 | 0.0 | 1 | 0.5 | ns |
| DPB1*30:01:01 | 7.0 | 7.0 | 0.0 | 2.2 | 2 | 2.1 | 5 | 2.4 | ns |
| DPB1*34:01:01 | 4.0 | 4.0 | 0.0 | 1.2 | 2 | 2.1 | 2 | 1.0 | ns |
| DPB1*39:01:01 | 4.0 | 4.0 | 0.0 | 1.2 | 0 | 0.0 | 4 | 1.9 | ns |
| DPB1*47:01:01 | 2.0 | 2.0 | 0.0 | 0.6 | 1 | 1.0 | 1 | 0.5 | ns |
| DPB1*49:01:01 | 1.0 | 1.0 | 0.0 | 0.3 | 0 | 0.0 | 1 | 0.5 | ns |
| DPB1*54:01 | 2.0 | 2.0 | 0.0 | 0.6 | 0 | 0.0 | 2 | 1.0 | ns |
| DPB1*55:01:01 | 4.0 | 4.0 | 0.0 | 1.2 | 2 | 2.1 | 2 | 1.0 | ns |
| DPB1*665:01:01 | 1.0 | 1.0 | 0.0 | 0.3 | 1 | 1.0 | 0 | 0.0 | ns |
| DPB1*702:01 | 1.0 | 1.0 | 0.0 | 0.3 | 1 | 1.0 | 0 | 0.0 | ns |
Disclaimer/Publisher’s Note: The statements, opinions and data contained in all publications are solely those of the individual author(s) and contributor(s) and not of MDPI and/or the editor(s). MDPI and/or the editor(s) disclaim responsibility for any injury to people or property resulting from any ideas, methods, instructions or products referred to in the content. |
© 2024 by the authors. Licensee MDPI, Basel, Switzerland. This article is an open access article distributed under the terms and conditions of the Creative Commons Attribution (CC BY) license (https://creativecommons.org/licenses/by/4.0/).
Share and Cite
Birru, S.K.; Doxiadis, I.; Howe, R.; Kelemu, T.; Chala, S.H.; Sherif, A.; Tadesse, F.; Tsegaye, A.; Gebremedhin, A.; Lehmann, C. Prognostic Role of Human Leukocyte Antigen Alleles and Cytokine Single-Nucleotide Polymorphisms in Patients with Chronic Myeloid Leukemia Treated with Tyrosine Kinase Inhibitor Drugs. Genes 2024, 15, 732. https://doi.org/10.3390/genes15060732
Birru SK, Doxiadis I, Howe R, Kelemu T, Chala SH, Sherif A, Tadesse F, Tsegaye A, Gebremedhin A, Lehmann C. Prognostic Role of Human Leukocyte Antigen Alleles and Cytokine Single-Nucleotide Polymorphisms in Patients with Chronic Myeloid Leukemia Treated with Tyrosine Kinase Inhibitor Drugs. Genes. 2024; 15(6):732. https://doi.org/10.3390/genes15060732
Chicago/Turabian StyleBirru, Samuel Kinde, Ilias Doxiadis, Rawleigh Howe, Tsehayneh Kelemu, Saifu Hailu Chala, Abdulaziz Sherif, Fisihatsion Tadesse, Aster Tsegaye, Amha Gebremedhin, and Claudia Lehmann. 2024. "Prognostic Role of Human Leukocyte Antigen Alleles and Cytokine Single-Nucleotide Polymorphisms in Patients with Chronic Myeloid Leukemia Treated with Tyrosine Kinase Inhibitor Drugs" Genes 15, no. 6: 732. https://doi.org/10.3390/genes15060732