Article

Genetic Differentiation of Reed Canarygrass (Phalaris arundinacea L.) within Eastern Europe and Eurasia

by
Neil O. Anderson
1,*,
Edvina Krokaitė-Kudakienė
2,
Lina Jocienė
2,
Tomas Rekašius
3,4,
Olga A. Chernyagina
5,
Algimantas Paulauskas
2 and
Eugenija Kupčinskienė
2
1
Department of Horticultural Science, University of Minnesota, 1970 Folwell Ave., St. Paul, MN 55108, USA
2
Department of Biology, Faculty of Natural Sciences, Vytautas Magnus University, K. Donelaičio Str. 58, 44248 Kaunas, Lithuania
3
Department of Mathematics and Statistics, Faculty of Informatics, Vytautas Magnus University, K. Donelaičio Str. 58, 44248 Kaunas, Lithuania
4
Department of Mathematical Statistics, Faculty of Fundamental Sciences, Vilnius Gediminas Technical University, Saulėtekio Ave. 11, 10223 Vilnius, Lithuania
5
Kamchatka Branch of the Pacific Institute of Geography of the Far Eastern Branch of the Russian Academy of Sciences, Partizanskaya Str. 6, 683001 Petropavlovsk-Kamchatskyii, Russia
*
Author to whom correspondence should be addressed.
Genes 2024, 15(6), 734; https://doi.org/10.3390/genes15060734
Submission received: 20 April 2024 / Revised: 23 May 2024 / Accepted: 31 May 2024 / Published: 3 June 2024
(This article belongs to the Section Genes & Environments)

Abstract

:
Worldwide molecular research of economically important Phalaris arundinacea (Poaceae) is mainly focused on the invasions of this species from Europe to North America. Until the present study, the genetic diversity of the P. arundinacea had not been studied across the Baltic countries. The objective of this research is to evaluate the diversity of Lithuanian populations of P. arundinacea at simple sequence repeat (SSR) loci comparatively among populations of the Baltic countries, Luxembourg, and the Russian Far East (Eurasian), evaluating differentiation between Lithuanian populations and ornamental accessions, and relating these with environmental features. For six selected Lithuanian river basin populations, GBS low density SNPs were used to determine genetic diversity. Bayesian analysis showed that Eurasian populations of Phalaris arundinacea consist of two gene clusters. Statistically significant genetic differentiation among European and Eurasian populations was documented. Lithuanian genotypes growing naturally along rivers are genetically distinct from cultivated ornamentals. GBS-SNPs divided the six selected Nemunas river basins into three distinct groups with one, two, or three rivers in separate groupings for genetic diversity. Genetic diversity is primarily within, rather than among, Lithuanian, eastern European, and Eurasian populations of P. arundinacea across the continent. Thus, restoration efforts would benefit from local population seed origination.

1. Introduction

Sustainable development of agriculture requires the preservation and ecological balance in the use of natural resources. Riparian plant species play a key role in aquatic ecosystems, and data on their status, habitats, and spatial and temporal changes are of particular importance [1]. In recent decades, the United Nations has paid exceptional attention to wetland ecosystems, which are very rich in biodiversity. Under the Ramsar Convention, countries around the world have committed to protecting wetlands as important habitats for animals and plants [1]. The fourth plan of the Ramsar Convention was drawn up for the period of 2016–2024 [2]. The European ecological network (Natura 2000) has also been established for similar purposes [3].
All soil and climate changes are significantly affecting the condition of groundwater and water bodies [4]. Due to the world’s human population growth, demand for quantity of freshwater is increasing. In the Fifth International Meeting of Heads of Ecology, anthropogenic impacts on biodiversity, biological invasions, ecosystem welfare, and river basin management have been identified as significant drivers in, or the products of, climate change [5]. In the temperate climate zones, one of the most common macrophyte wetland species is reed canarygrass (Phalaris arundinacea L.).
Reed canarygrass is a perennial geophyte, representative of Cyperales order, Poaceae family, Pooideae subfamily, Poodae supertribe, Poeae tribe, Phalaridinae subtribe, and one of 22 species in genus Phalaris [6,7,8]. It grows up to 2.2 m in height, flowering in June–July [9,10,11], reproducing by rhizomes, shoots, and seeds [12,13,14,15], and is a cross-pollinated, anemophilous species [16]. Together with many other forms, a striped form of Phalaris arundinacea var. picta (with the white or yellow stripes on the leaves), is worldwide in distribution [17]. Phalaris arundinacea is a temperate climate plant occupying open areas [18], tolerant of a wide range of precipitation [19,20] and temperatures [20,21,22,23], and grows in humid soils [24] rich in inorganic forms of nitrogen [16,18,25] with acidity ranging from moderately acidic to slightly alkaline [24]. It is classified as moderately tolerant to salt [18]. The plant forms large and lush meadows on the banks of rivers, ditches, or lakes [9,26], growing as deep as 30 cm in open water.
It is spread in the northern hemisphere [27], naturally growing in Europe, Asia, Africa, and North America. The natural distribution of Phalaris arundinacea in N. America has been controversial, with populations on that continent originally purported to be hybrids of local accessions and imported cultivars from Europe [28]. More recent studies in the midwestern U.S. have found all riparian populations and those along highway corridors to be native to N. America [29]. As an invasive species in U.S. wetlands, it outcompetes aggressively with native species [25,30,31,32,33,34].
It is an economically important species in Europe and the U.S., used for forage (low alkali types) [27,35,36,37,38,39,40], as protection against soil erosion [41], for ornamental purposes [42,43,44,45,46], phytoremediation [47,48,49], and biofuel production [50,51]. While there are very few, if any, active reed canarygrass breeding programs, selection of productive cultivars would require molecular research to supply data on genetic diversity within and among populations [52,53]. This species has been examined by many molecular markers including allozymes [33], inter simple sequence repeats (ISSRs), [12,17,53,54], amplified fragment length polymorphism (AFLP) [52], simple sequence repeats (SSRs) [55,56,57,58,59,60], internal transcribed spacers (ITSs) [61], chloroplast DNA (cpDNA) markers [52,55,56,60,62], and single nucleotide polymorphisms (SNPs) from DNA sequencing [29].
Former investigations of P. arundinacea have been primarily focused on genomic comparisons of populations among the two continents, either N. America and Europe, or N. America and Western Asia [12,29,52,53,54,55,56,57,58,60]. Most European continent studies included several populations of the countries: Norway [12,59,62], Sweden [12,55,56,59,60,62], Finland [59,60,62], Denmark [59,62], Germany [12,56,59,62], Poland [55,56,59,62], Hungary [56], the Czech Republic [54,60], Montenegro [12,59,62], Ireland [59,62], Great Britain [12,59,62], the Netherlands, Portugal [60], Switzerland [12,56,60], and the western Russian Federation [56]. In Europe, few investigations have been devoted to examining a wider range of populations within specific countries, with the exception of the Czech Republic [53] or Romanian assessments [17]. Such genomic analyses have found that even though sampling widespread areas within continents and countries, significantly greater genetic variation occurred within rather than among populations [12,29,52,53,54,55,56,57,58,60,61,62,63]. However, genomic markers have also been useful in distinguishing among populations from different geographic locations (such as individual rivers within a country [29]) or on a larger scale, e.g., among continents. Such genomic analyses led to the seminal paper [29] reporting that all riparian populations in the state of Minnesota, U.S.A., were genetically distinct from central Europe and native to N. America [29]. This was in opposition to previous theories, based on early molecular marker techniques [64], that all N. American populations were European “exotics” [28].
Extensive genomic surveys across geographic areas of P. arundinacea and many other native or invasive species’ ranges have importance beyond assessing genetic variability within and among populations, river basins and/or countries. The discovery that all riparian populations in Minnesota were native [29] required philosophical, managerial, and legislative changes in perception by land managers, regulators, legislators, and research from its misconceived perception as an “exotic” to a “native” despite its continuing spread as an invasive species, a difficult challenge due to the economic costs of considerable scale spent on mitigation [37,65]. Implications from the use of genomics in shifting perceptual views of native, invasive species may have value in the commencement of a similar continental-scale study of native P. arundinacea across Eurasia.
We have documented the genetic diversity of native P. arundinacea in our pilot study of Lithuanian populations of the Merkys basin [64], which has overtaken the Baltic countries as an invasive. Phalaris arundinacea grows naturally and is widespread in Lithuania [11,26,65,66,67]. Further selection process is ongoing with the purpose to create varieties for production of raw material relevant for biofuel [68,69]. In the present study, focusing on reed canarygrass genetic diversity across eastern Europe, we hypothesize that Lithuanian Phalaris arundinacea, as a part of populations within the natural distribution range of the species, might differ in genetic diversity, in relation to environmental factors. The aim of the research is to evaluate the diversity in microsatellite markers (SSR loci) or GBS-SNPs (select populations) of Lithuanian populations of P. arundinacea by (a) comparing it to populations from the other Baltic countries, Luxembourg, and the Russian Far East, (b) incorporating Lithuanian genotypes cultivated for ornamental purposes, and (c) relating the genetic parameters of the riparian plant in river basins varying in river size, river pollution by nitrogen, and land cover and use class in the present state of rivers and riverbed origin.

2. Results

2.1. Genetic Diversity of Populations of P. arundinacea

For all populations, the total number of alleles per separate SSR marker ranged from 3 to 13 (Table 1). The selected markers generated 95 alleles, ranging in size from 90 to 163 bp. For all investigated populations of P. arundinacea of Lithuania and other countries, the average number of alleles per marker ranged from 1.2 to 6.4. For Lithuanian populations, all alleles were polymorphic.
Among all the studied Eurasian populations of P. arundinacea, the Lok1 (Nemunas basin) population had the lowest (18.1%) polymorphism while the Jie1 (Nemunas basin) population had the highest (40.4%) (Table S1).
Some populations of the Nemunas basin (Mer3, Nem2) and the Russian Far East (Kir1) were characterized by unique alleles. The average polymorphism among the studied population groups separated into countries was as follows: Russian Far East (25.0%) < Lithuania (29.5%), Baltic countries (30.1%), Luxembourg (33.0%; Table 2). For all European populations, the mean polymorphism (30.0%) was not significantly higher in Eurasian populations (25%) or populations of the Baltic States (30.1%) (Table 2).

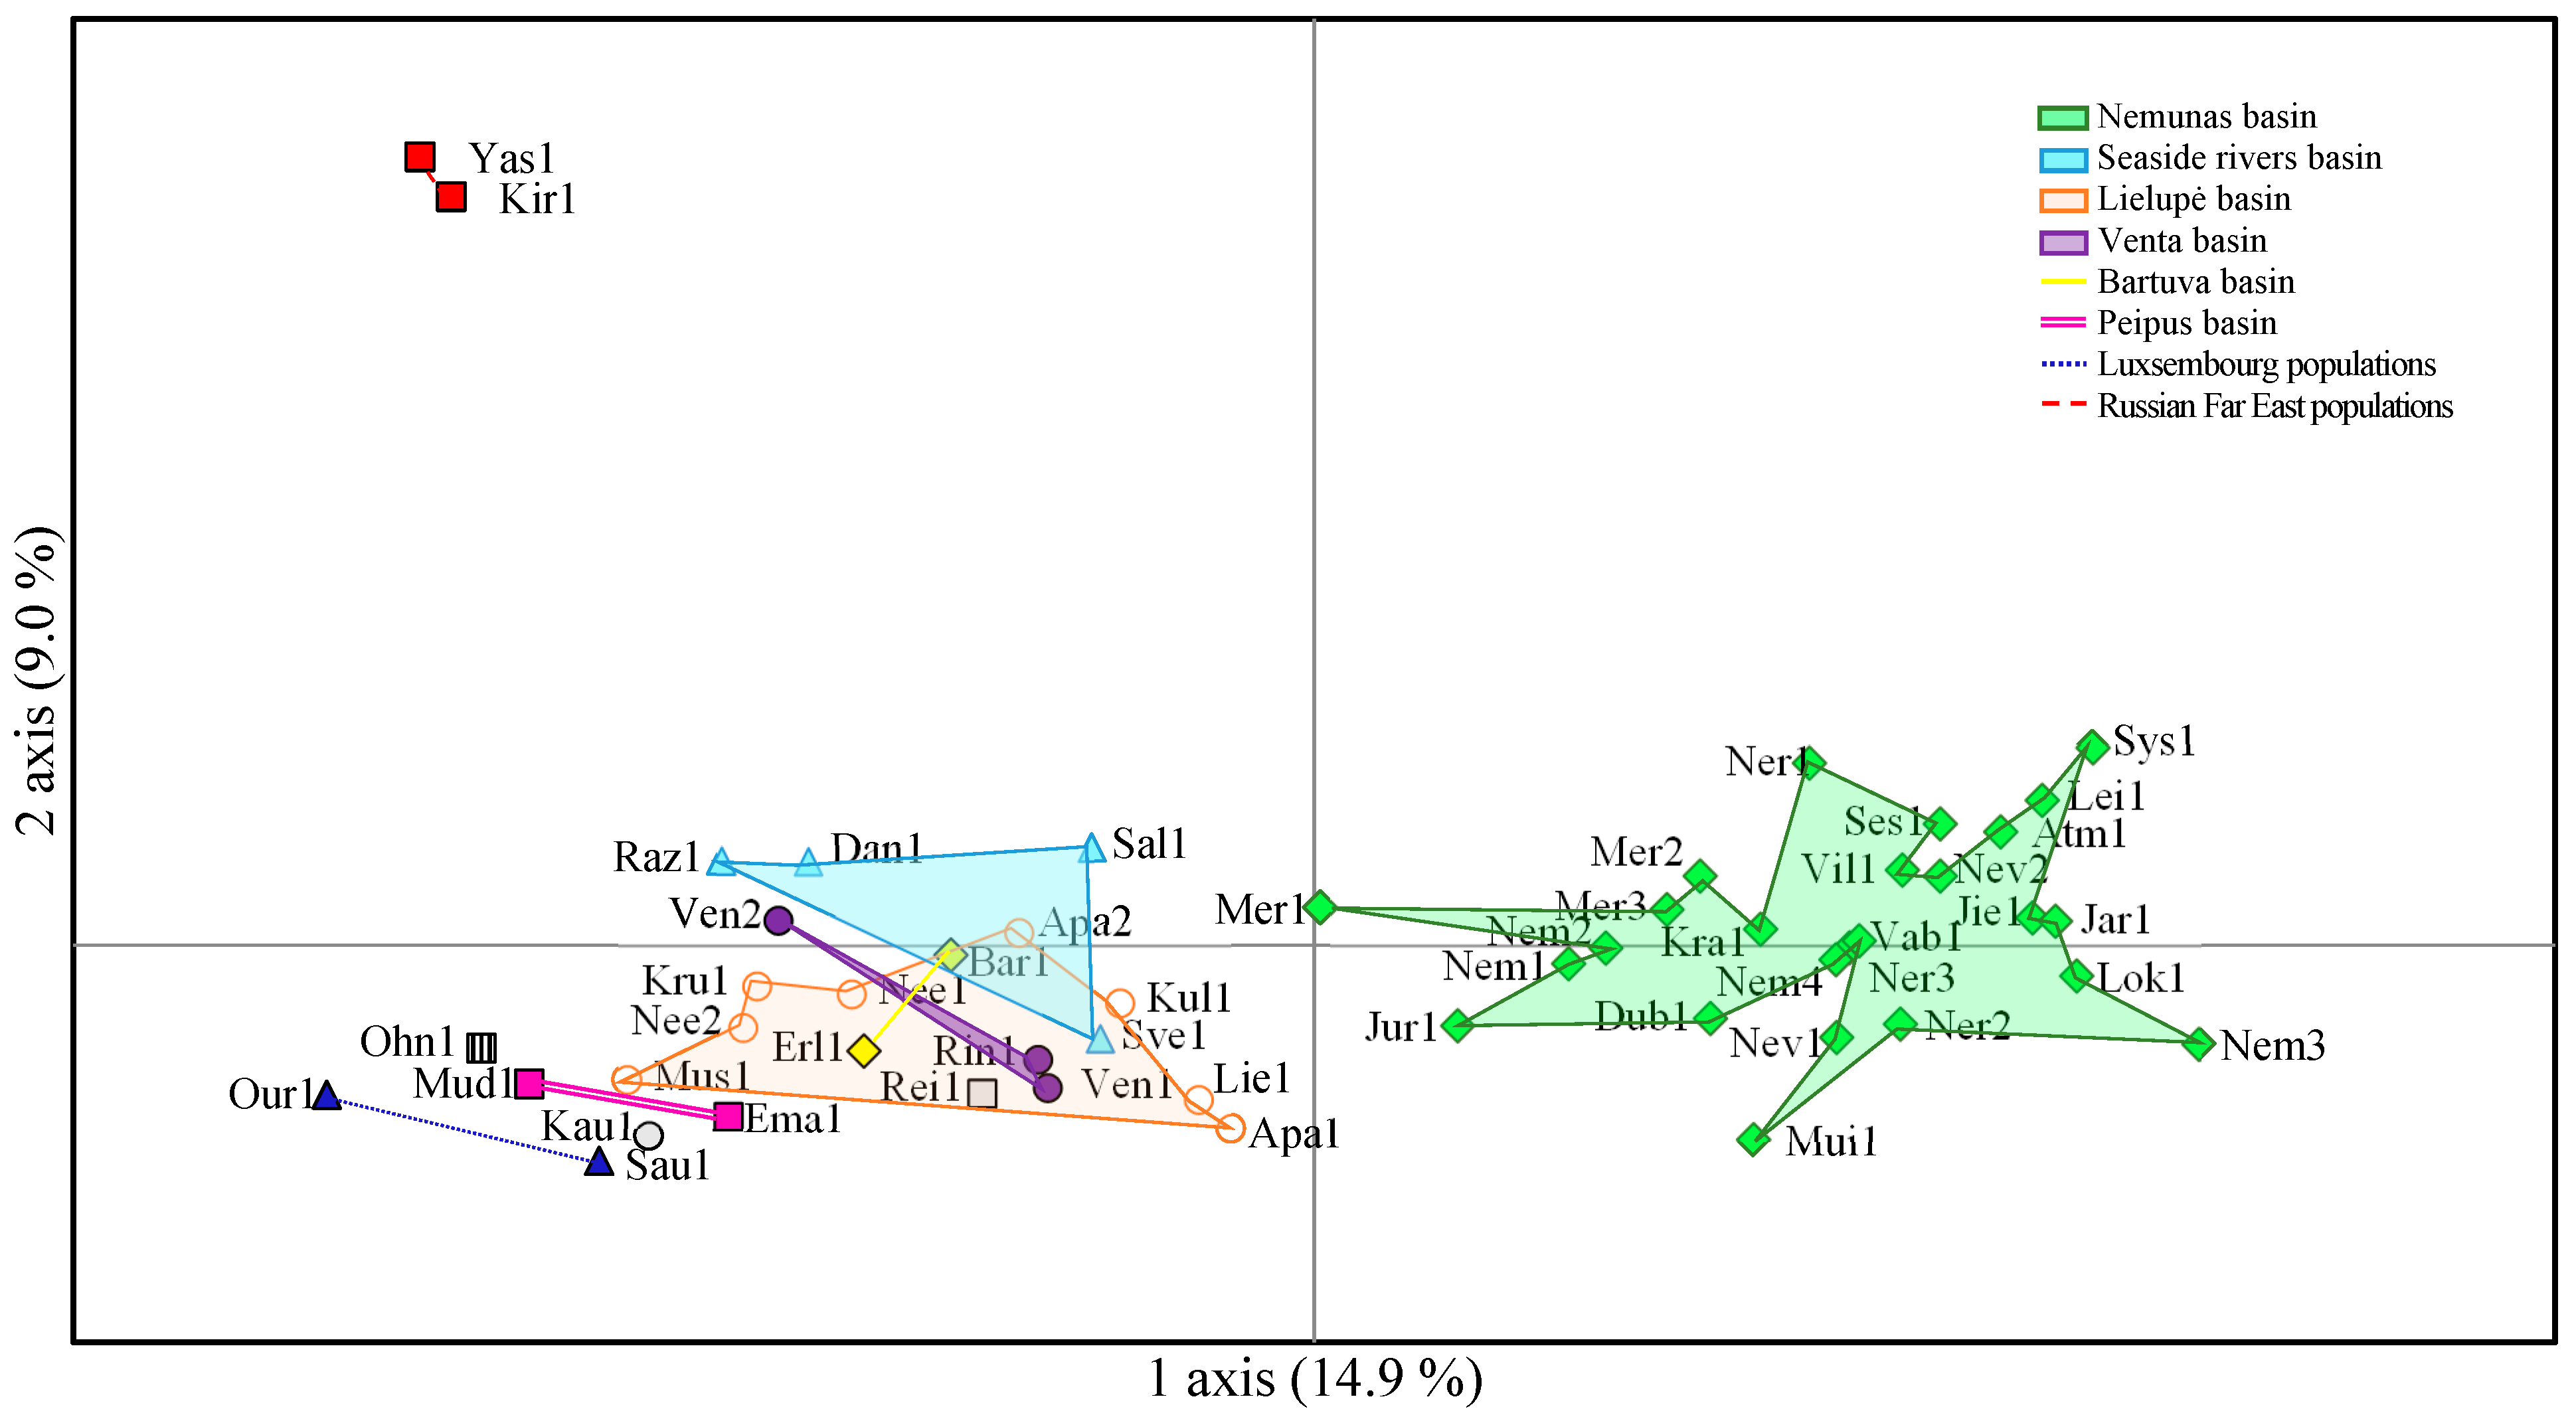
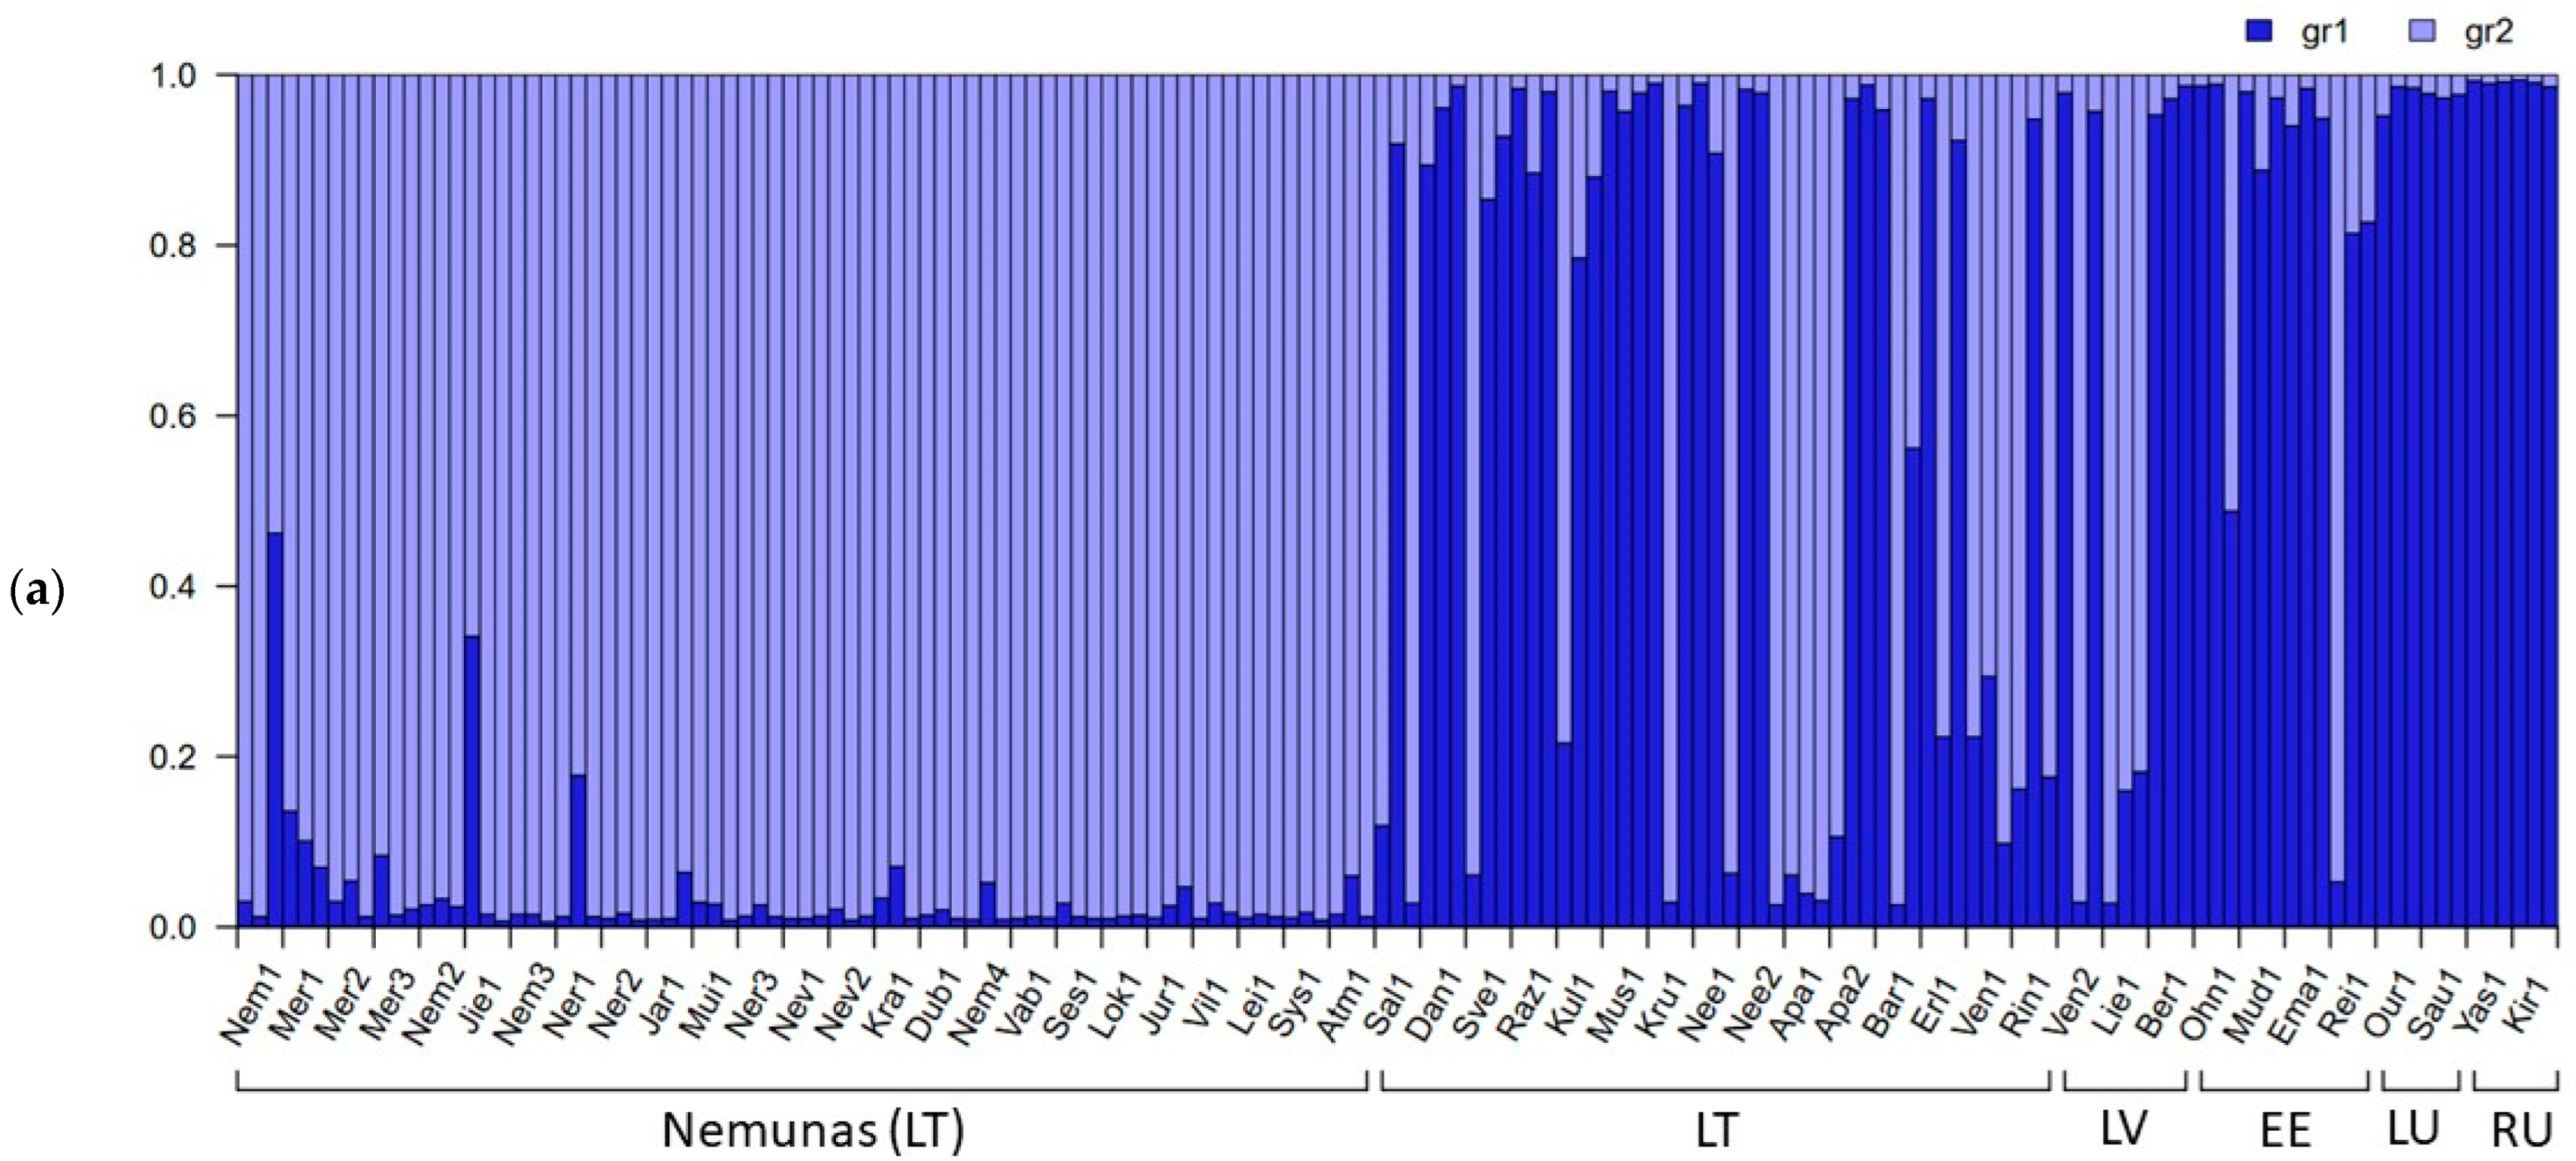
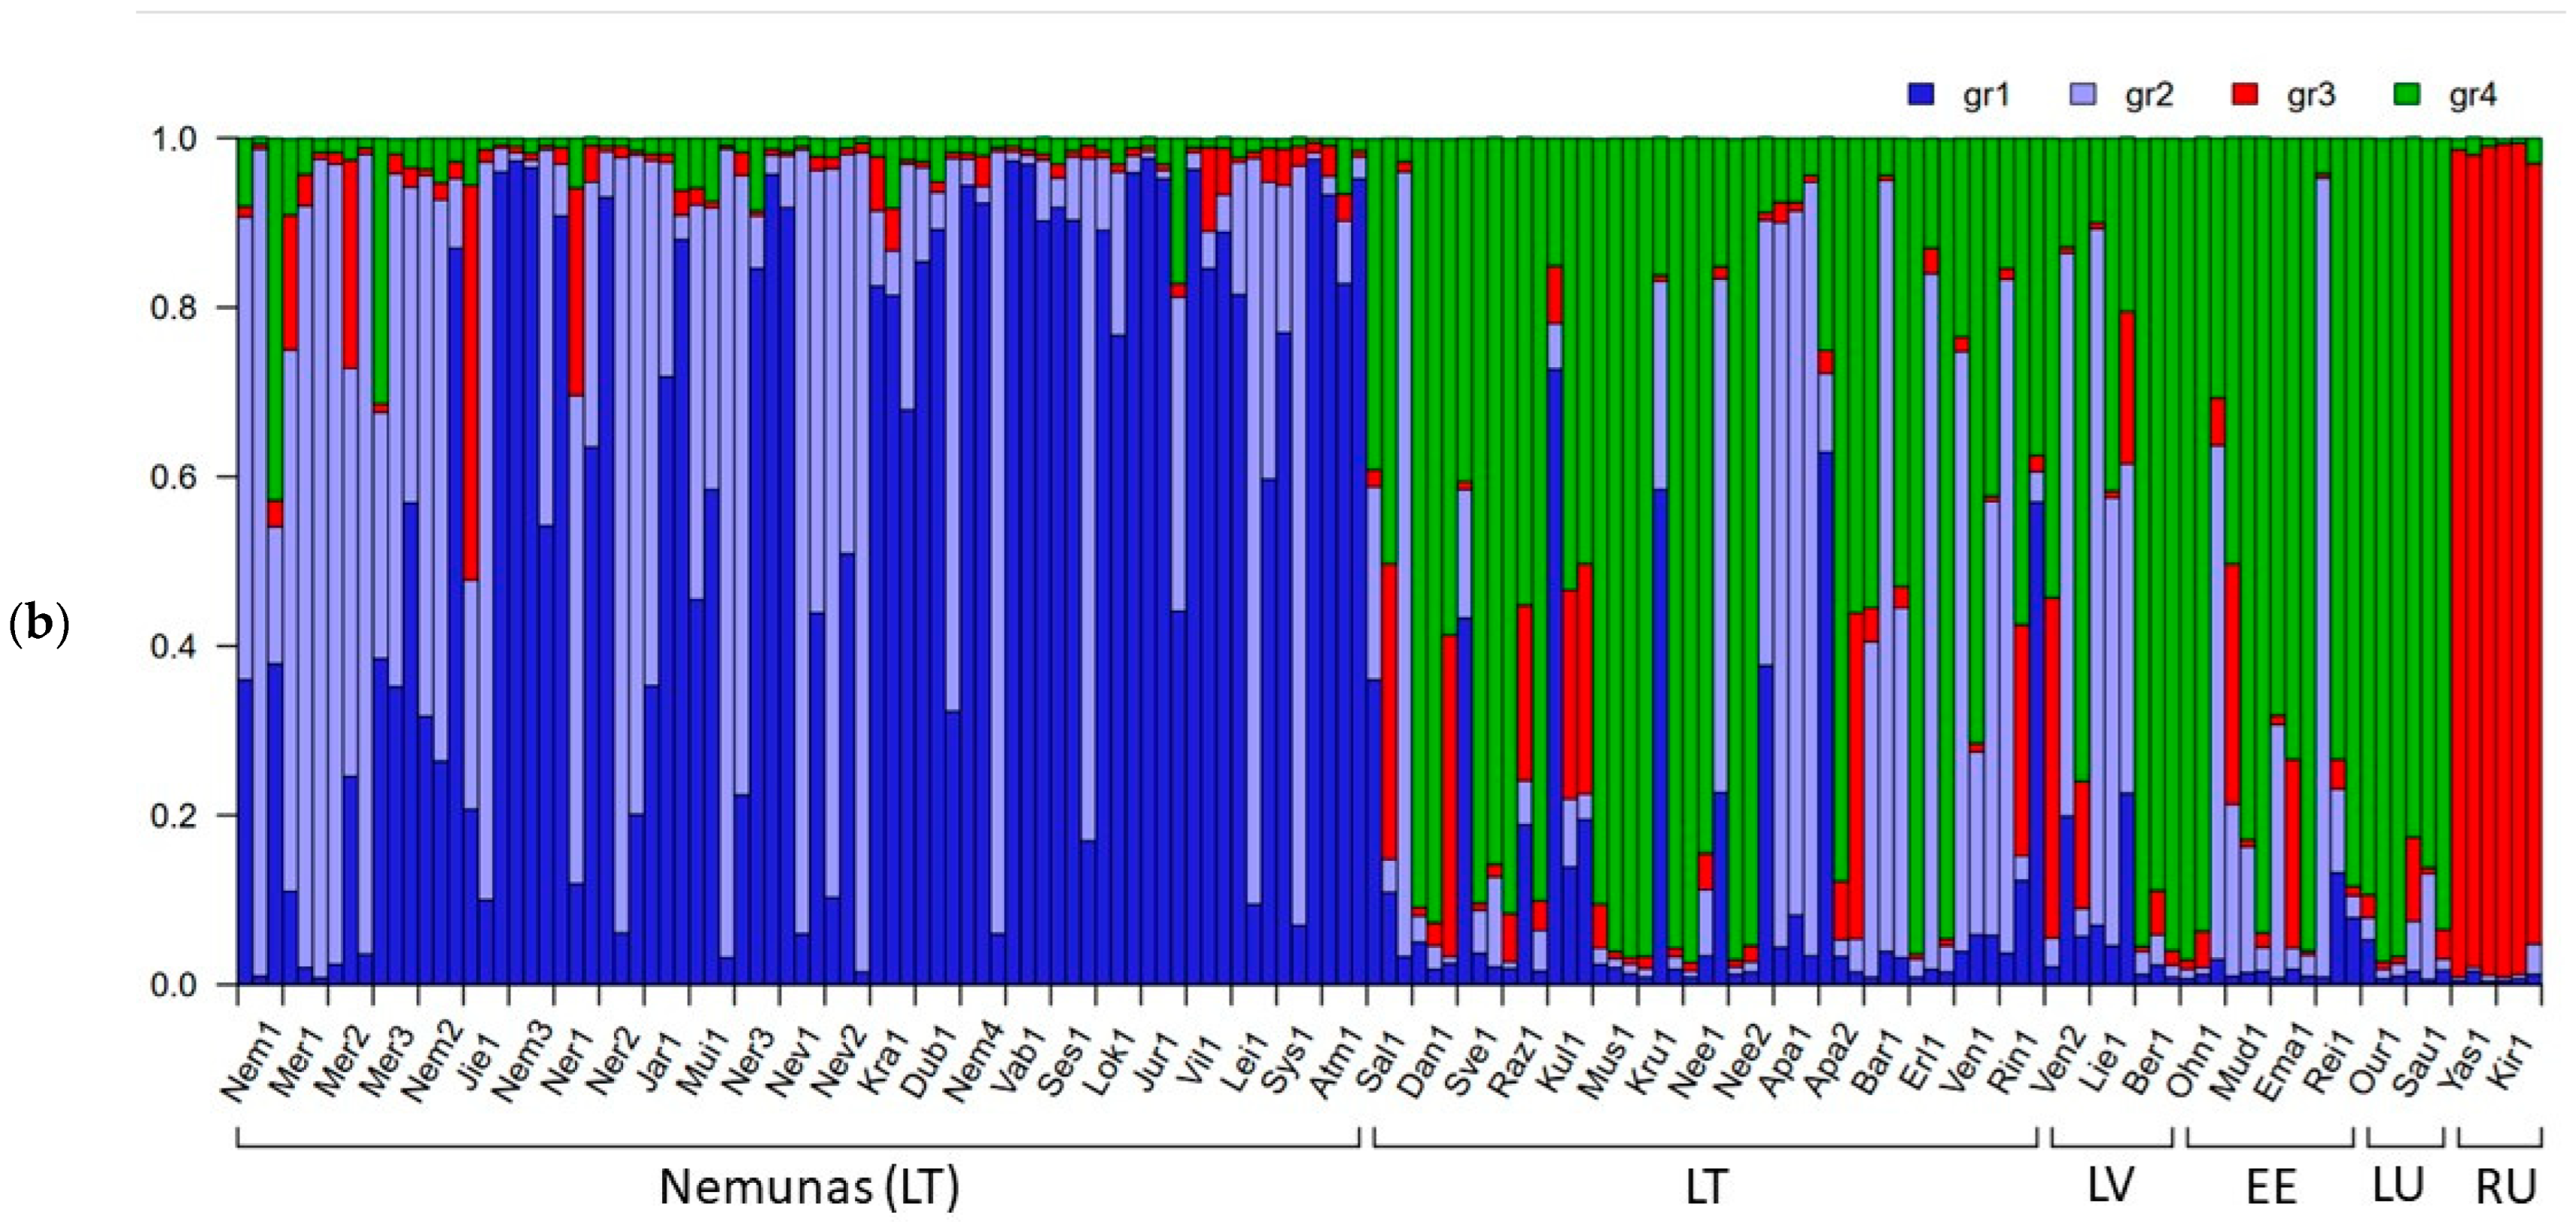
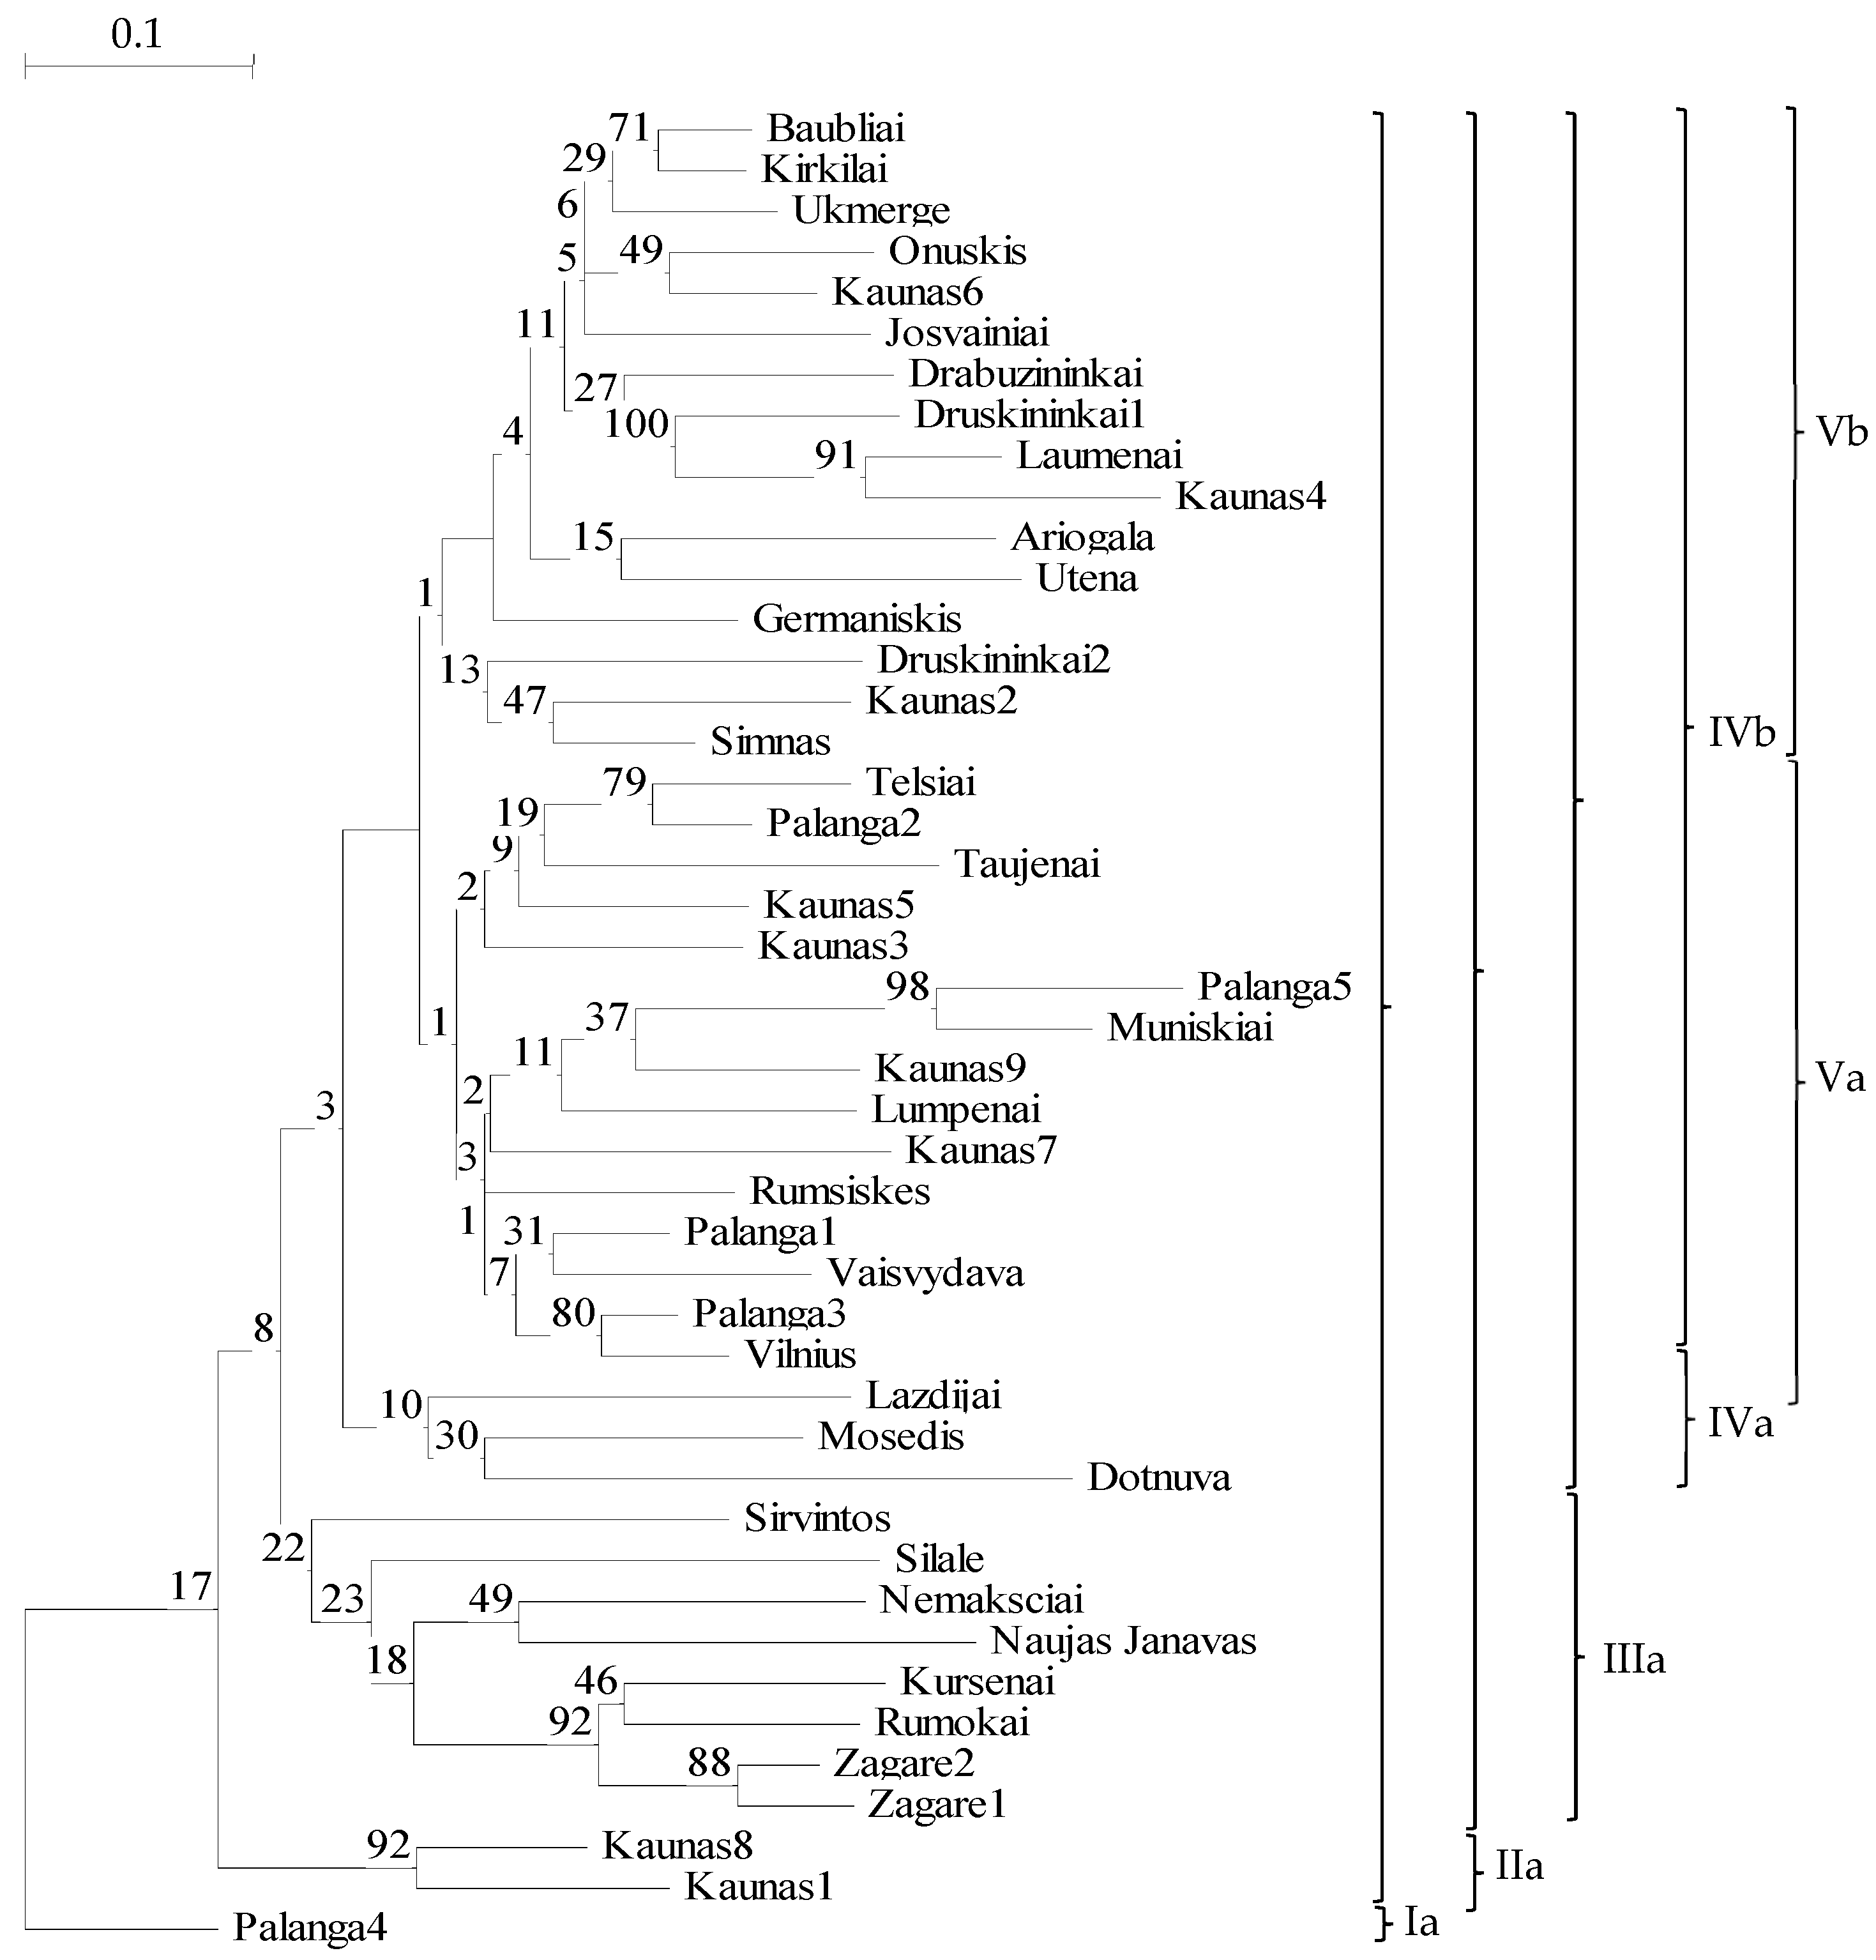
2.2. Genetic Differentiation of Populations of P. arundinacea

Among all of the studied Eurasian populations of P. arundinacea, the largest Nei’s genetic distance (0.320) was found between Nem3 (Lithuania) and Kir1 (Russian Far East) (Table S2; Figure 1). The Nei’s genetic distances among Lithuanian populations of P. arundinacea ranged from 0.041 to 0.224: among all the populations, both genetically the closest (Nem4 and Ses1) and the most distant (Mer2 and Mus1) (Table S2). Mantel tests showed statistically significant relations between geographic and genetic distances of the Eurasian populations of P. arundinacea (r = 0.743, p < 0.01).
Based on the principal coordinate analysis (PCA) which accounts for 23.9% of the genetic variation, the populations were divided geographically (Figure 2). The most distinguished were Russian Far Eastern populations (red color; Figure 2) and Nemunas. The 1st principal coordinate explains 14.9% of the total diversity, separating the populations of Nemunas basin from all other populations. The 2nd principal coordinate explains 9.0% of the diversity, separating the populations of the Russian Far East from all other populations of Europe. The remaining populations across the European continent were closer to each other, but slightly separated by river basins. In the principal coordinate analysis plot, the populations of the Coastal rivers basin and the populations of Luxembourg were more separate from the other populations; the populations of the Venta basin were allocated together with the populations of the Bartuva and Lielupe basins (Figure 2).
Very highly statistically significant genetic differentiation by hierarchical AMOVAs was revealed among population groups (ΦCT) of the Nemunas and all other Lithuanian river basins (Lielupe, Bartuva, Venta) tested as well as among populations within groups (ΦSC), and within populations (ΦST; Table 3). The populations of Nemunas and Bartuva river basins were the most differentiated, and the populations of the Nemunas and Venta river basin were the least. Within populations, differentiation (ΦSC) was the highest and ranged from 0.176 to 0.236.
Genetic differentiation by hierarchical AMOVA among population groups of P. arundinacea (ΦSC) according to land cover and use type was small, ranging from ΦSC = 0.169 to ΦSC = 0.80, but were all statistically significant (Table 4). The division of populations into groups by present river status also revealed significant genetic differentiation. Within population groups (ΦST), based on regions of nitrogen pollution of the rivers in year 1992–1996, had statistically significant genetic differentiation. The division of populations into groups depending on whether they are beside different land cover types, river states, rivers sizes, and riverbed origins (ΦCT) also had significant levels of genetic differentiation among and within Lithuanian populations; within population differences were the highest at 82% (Table 4).
Grouping of Eurasian populations of P. arundinacea by continents (Europe and Asia) showed very highly statistically significant genetic differentiation (Table 5). The division of European populations into groups of the Baltic region (Lithuania, Latvia, and Estonia) and Luxembourg populations also revealed statistically significant genetic differentiation (ΦCT = 0.247), but to a smaller extent. Genetic differentiation of similar value was found among the populations of the Baltic region (ΦSC = 0.183), divided into separate river basins within populations (ΦST = 0.385). In all sectors grouped by distances, the genetic diversity within populations was highest.
Bayesian analysis showed that individuals of the 51 Eurasian populations of P. arundinacea consist of a mixture of primarily two (according to the largest ΔK) or four (a ΔK shoulder; Figure 3) clusters. In the case of ΔK = 2 clusters, the light blue gene cluster formed a similar part as the dark blue gene cluster among the European populations, other than the Nemunas basin (Figure 4a). Populations of the Russian Far East were distinguished by the presence of dark blue gene cluster (Figure 4a). In the case of ΔK = 4 clusters, the prevailing dark blue gene cluster separated the populations of the Nemunas basin, the red for the populations of Russian Far East, and the green for all remaining populations (Figure 4b).

2.3. Genetic Diversity of P. arundinacea var. picta Grown in Lithuania

Forty-five individuals of the ornamental form of P. arundinacea var. picta grown in Lithuania were analyzed by 14 microsatellite markers. The total number of alleles was n = 95. In the UPGMA dendrogram, the most distinct individuals of ornamental genotypes of P. arundinacea var. picta plants in Palanga4 (separated by the 1st order clade; Figure 5Ia), followed those in the Kaunas1 and Kaunas8 sites (separated by the 2nd order clade; Figure 5IIa).
There was no statistically significant relationship among the geographic distances (km) and Nei’s genetic distances (R2 = 0.0122) of 45 ornamental P. arundinacea var. picta genotypes growing in various parts of Lithuania (Figure 6). Linear regression formed a nearly level line, y = −0.0002x + 0.3261.
Comparison of 45 genotypes of ornamental P. arundinacea var. picta, grown in Lithuania, and 120 genotypes of 40 riparian P. arundinacea populations of Lithuania revealed that genotypes of the ornamental forms and populations formed two separate clades in the UPGMA dendrogram (Figure 7).
Genetic differentiation between the groups of cultivated individuals and individuals of populations was very high (31%), although lower than within groups of natural and cultivated individuals (69%; Table 6).
Only 80% of the samples passed the filtration steps with high enough quality/quantity of DNA to produce enough GBS-SNPs. Thus, we have SNP analyses of 37/45 samples from the six river Lithuanian basin populations. The first two coordinates (PCA1, PCA2) of the principal component analysis (PCA) of single nucleotide polymorphisms (SNPs) accounted for a total of 12.8% of the genetic variation (Figure 8). There were ΔK = 3 clusters from the STRUCTURE analyses, grouping LT1 and LT2 groups together, along with LT5 as a separate group whereas LT3–LT6 populations were within the third, larger group (Figure 8). River basin populations LT1 (Ber) and LT2 (Mer4) [63] are genetically distinct from the remaining populations but are both grouped together.
The LT5 population (Ner2) is genetically distinct as well, as a separate group, whereas population LT3 (Nem1) overlaps slightly (is more genetically similar) with populations LT4 (Nem3) and LT6 (Atm1), both of which overlap (share SNPs in common with each other as well) (Figure 8). The river basin UPGMA dendrogram of SNPs fanned out in the same configuration as found with the ΔK = 3 clusters from the STRUCTURE analysis (Figure 9). The two most diverse genotypes in the SSR analysis (Table 2) were in two distinct but closely related clusters: highly polymorphic Jie1 (LT2) versus lowest polymorphic Lok1 (LT5) (Figure 9).

3. Discussion

3.1. Genetic Diversity of Populations

Rivers and riparian ecosystems play important ecological and economical roles in the Baltic States. Similar to previous studies on Lithuanian macrophytes [67], our sampling procedures have shown that P. arundinacea is widespread in all river basins of Lithuania [65,69]. Before our investigations, there were no genetic studies of P. arundinacea populations in the Baltic States. In parallel to our studies of populations of P. arundinacea, the genetic diversity parameters of some other common aquatic plant species naturally growing in Lithuania were assessed by molecular methods: Nuphar lutea [71], Lythrum salicaria [72], or Phragmites australis [73].
Molecular research of P. arundinacea is mainly focused on the invasion process of this species in N. America [12,29,33,52,57,58]. In Europe, few investigations have been devoted to examining large numbers of populations of the separate countries [17,53]. For populations of this species, a variety of molecular diversity indices have been applied: intrapopulation indicators such as percentage of polymorphic loci (PLP) [12], polymorphism information content (PIC) [55], heterozygosity [12,52] and interpopulation indicators such as phylogenetic trees [12,17,52,54], Mantel test [56,58], analysis of simple and hierarchic molecular variance [12,17,29,52,53,54,55,56,60], analysis of principal coordinates [29,52,53,55,56,57,60], as well as Bayesian structure analysis of populations [12,29,53,54,55,56,57,58,60,62]. In total, we studied 153 individuals of Phalaris arundinacea, while in the above-mentioned assessments of this species, the number of genotypes ranged from 30 to 900. In terms of the number of genotypes per population, studies of P. arundinacea ranged from 1 [60] up to 30 individuals [62]. Our study is distinguished by a very small area of examination: 120 genotypes out of 153 were sampled in Lithuania (geographic area of 65,300 km2).
Among microsatellite markers used in our investigation, 11 out of 15 were developed for Phalaris canariensis [74] and 4 markers were developed for Zea mays [75], while 12 out of 15 were applied for analysis of the Columbia and Missouri River Basin populations of P. arundinacea [60]. After our studies commenced, eight new microsatellite markers were created for P. arundinacea [59] and applied in the other regional investigations [29]. Future research incorporating these new markers may provide additional insights into genetic variability of P. arundinacea.
In this study, the total number of alleles of populations per primer ranged from 3 to 11 (in total, 95 alleles), with an average of 6.7 alleles per primer. These numbers of alleles were similar to microsatellite data of Phalaris canariensis (2–9 alleles, in total, 137 alleles) [75] and different from numbers of alleles obtained by Jakubowski et al. [58] in their investigation of P. arundinacea. The lower number of alleles in our study could be explained by the “bottle neck” effect, which might be due to the smaller number of plants collected, and/or a small geographic study area (since the main analyses were concentrated in Lithuania).
In our study, all microsatellite loci were polymorphic, as in our former investigation of the Merkys river basin [63] or in other countries [56]. In the Eurasian P. arundinacea, the percentage of polymorphic microsatellite loci ranged between 18.1 and 40.4% (average = 29.9%) (Table 2). The analysis of some other world regions (European and N. American populations) revealed a wider range (48–100%) of polymorphism with the microsatellite loci [56]. The greatest contrast in our study of population polymorphisms by country was between Luxembourg (33.0%) and Russian Far East (25.0%) (Table 2).
In comparable investigations of other invasive wetland species, the percentage of polymorphic AFLP loci for Lithuanian populations of Lythrum salicaria averaged 57.2% [72] and for Lithuanian populations of Echinocystis lobata was, on average, 52%, and very similarly at the regional scale in Romanian, Baltic State, and Central Russian populations averaging 51% [76]. A wider range of ISSR loci polymorphism was documented for three Impatiens species (13.3–67.8%) sampled in the Czech Republic and Lithuania [77].

3.2. Interpopulation Variability

In the present study, statistically significant relations (Mantel tests) were found among geographic and genetic distances up to 8416 km of Eurasian populations (Figure 1), similar to Jakubowski et al.’s [56] assessments of Eurasian populations within a distance up to 1000 km and European populations within distances to 250 km [58]. Mantel tests revealed a significant correlation among genetic and geographic distances of Lithuanian populations of naturally growing Lythrum salicaria [73] or invasive Echinocystis lobata [77], both supporting the theory that this exotic species is currently naturally spreading along the riverbanks.
The genetic diversity of Lithuanian populations within our study was higher within (82%) rather than among (17–18%) populations (Table 4), regardless of land cover types (2%), differing river status (1%), nitrogen concentrations (2%), river size (0%), and riverbed origins (0%). Different studies of P. arundinacea revealed that the intrapopulation diversity ranging within interval 62–85% [12,52,53,55,56]. High intrapopulation diversity might be explained by the high gene flow, characteristic for wind pollinated (anemophilous) species such as Phalaris [52]. In our Lithuanian investigation, the extent of the diversity within populations (62%) of P. arundinacea was intermediate compared to populations of the other Lithuanian macrophytes for microsatellite loci: diversity within populations of Nuphar lutea was 80% [69] and within populations of Phragmites australis was 46% [74]. In our Eurasian investigation, the extent of the intrapopulation diversity within Phalaris arundinacea populations (62%) was similar to Lithuanian populations.
Analyses of molecular variance (AMOVAs) showed Lithuanian populations of P. arundinacea to be significantly differentiated in respect to river basins with molecular diversity ranging from 6 to 11% of the total genetic variability (Table 3). This supports the data on Lithuanian populations of other species: Nuphar lutea (7% at SSR loci) [69], Echinocystis lobata (6–9% at AFLP loci) [76], Lythrum salicaria (5% at AFLP loci) [73]. Statistically significant low extent of differentiation (2% of the total genetic variability) among Lithuanian population groups of Phalaris arundinacea, with respect to different land cover and use class [78,79], river status (1% of the total genetic variability) [80,81], and former (1991–1996) nitrogen pollution by agriculture [82] was obtained (Table S5). Different land cover and use class were also significant at a similar extent (1% of the total genetic variability) for genetic differentiation of Lythrum salicaria population in Lithuania [73]. Our present study shows that land cover and use type, river status, and former nitrogen pollution in Lithuania have affected the genetic structure of populations. It may explain the above-mentioned fact that in our study, the polymorphism of populations of P. arundinacea was lower (29.9% on average) compared to the data (49.3% on average) of the former implemented investigation of this species in Merkys basin rivers and rivers located in protected area [63], which experienced much lower degrees of disturbance.
For P. arundinacea, no significant genetic differentiation was registered among groups of populations located near distinct river sizes [80] or riverbed origins [4] (Table 4). Examination of leaf nitrogen concentrations among populations of riparian species in Lithuania also did not show differences among P. arundinacea populations with respect to river size. Thus, this parameter was important for only one species (Echinocystis lobata) out of the seven analyzed [71]. Riverbed straightening was mainly carried out for smaller rivers and rivulets in Lithuania [4]. Our present assessment of Phalaris arundinacea in most cases encompassed populations beside larger rivers (Figure 10, Table S3).
The number of polymorphic SSR loci was larger for populations of P. arundinacea on the riversides of the intact fragments of the Merkys river than for those in the regulated fragments of the riverbed [63]. Riverbed straightening has significant effects on differentiation of Lythrum salicaria populations among which there were more sites beside smaller rivers [73]. Statistically significant differentiation (at microsatellite loci) was not found between groups of Lithuanian population of Phragmites australis in relation to riverbed origin [74].
In parallel to our assessment of P. arundinacea relationships between genetic differentiation and different environmental variables such as temperature, humidity, nitrogen content, and riverbed origin, were documented in the USA [60]. Genetic differentiation was significant (25% of the total genetic variability, Table 5) among the populations of Romania, the Baltic States, and the Russian Far East. A similar situation was observed for Echinocystis lobata where differentiation was significant (12.5% of the total genetic variability at AFLP loci) among the populations of Romania, the Baltic States, and Central Russia [77]. Eurasian data for differentiation of Phalaris arundinacea was supported in the PCA, where populations of the Russian Far East and those of the Nemunas river basins were clearly separated from the other investigated populations (Figure 2).
In our study, the Eurasian populations consisted of two Bayesian gene clusters (Figure 3 and Figure 4). In global studies of populations, cultivars, and herbarium specimens of P. arundinacea, two gene pools were most often documented between the European and North American continents [12,29,54,57,60]. In other investigations within continents, three [29,57,58], four [62], six [53,57] or eight [56] gene clusters were documented. Lithuanian populations of Lythrum salicaria are admixtures of two gene pools of [73], and larger numbers of genetic clusters have been characteristic for populations of invasive species: three gene clusters for Echinocystis lobata populations [77] and Impatiens glandulifera [83] and multiple gene clusters for Impatiens parviflora for AFLP loci [73].
Similarities in the genetic makeup of the Eurasian populations of P. arundinacea, studied herein, with those of extensively researched N. American populations is useful for patterning future genomic and evolutionary studies of a native, yet potentially invasive, plant species. While intrapopulation genetic variation remained high for populations in both continents (82% for Eurasia, 62–85% in N. America [12,52,53,55,56]), the significant correlation of geographic and genetic distances over the 8416 km area indicates distinct origin(s) or evolved genetic makeup of the species on the local (e.g., two gene pools within Lithuania) and continental scales. This, along with the Mantel tests’ support of the theory of spread in other invasive species [73,77], evoke questions on whether differences in spread as a potentially native, invasive species are occurring. If they existed, they could vary widely among countries over the extensive geographic distances. Further research into the extent of P. arundinacea spread as a native yet potentially invasive Eurasian species and whether control measures are warranted in managed areas would yield intriguing comparisons with the N. American continent evoking all of the dilemmas now facing those areas [66,67].

3.3. Genetic Features of Ornamental GenotypesAccessions of Lithuanian P. arundinacea

Mantel tests did not show correlations for Lithuanian ornamental accessions of Phalaris arundinacea (Figure 6). None of the five ornamental genotypes from different private gardens in Palanga, nor nine other ornamental genotypes from different parts of Kaunas, grouped into the same clade of the phylogenetic tree (Figure 5). This may serve as evidence that in some towns and cities ornamental cultivar(s) of P. arundinacea were introduced from several distinct sources (differing genetic makeup) over time. Similar findings were reported with ornamental cultivars in the Czech Republic that differed genetically among genotypes within the population as well as within cultivars [53]. In the phylogenetic tree of all examined Lithuanian genotypes, the ornamental genotypes of P. arundinacea were distinct from those of wild, riparian populations (Figure 7). Again, similar data distinctions among groups of naturally growing and ornamental genotypes of P. arundinacea were found in the Czech Republic [53]. In the current study, the differences among ornamental, cultivated, and riparian plants were consistent with Jakubowski et al. [55] findings of differences among cultivars and natural European genotypes, although contradicted by some other analyzes [12], where no differences in the genetic diversity between cultivars and natural populations were documented. These discrepancies could be due to use of different molecular marker systems, the genetic makeup of the test populations, or a smaller cultivar set used by Nelson et al. [12]. In our study, ornamental genotypes were more similar to each other than those from riparian populations, presumably due to breeding and selection effects in the creation of ornamental cultivars, differing genetic backgrounds of the cultivars in comparison with wild Lithuanian populations and maintaining clonal integrity in ornamental genotype propagules.

3.4. River Basin Population Genetic Variation (SSRs, SNPs)

In the 1950s–1960s, many smaller rivers in Lithuania were regulated [63]. The Merkys river basin, the largest protected area of Lithuania, underwent severe anthropogenic modifications [53]. Thus, it is not surprising that the mean number of polymorphic SSR loci was lower for populations from regulated parts of the river basin compared with natural ones. Two selected populations from this basin were the Ber river fragment (regulated) and Mer4 (natural) [53]. Regulated Ber appeared to be the most distinct population in comparison to the Nemunas basin populations. The SNP data found three distinct genetic groups which consisted of river basin populations regulated LT1 (Ber), natural river fragment population LT2 (Mer4), the LT5 (Ner2) population whilst populations LT3 (Nem1), LT4 (Nem3) and LT6 (Atm1) were genetically similar (Figure 8 and Figure 9).
This research is the first regional assessment of the genetic diversity of P. arundinacea populations depending on environmental factors. Prior to our research, there were no publications on the impact of different classes of land cover or riverbed origin on the genetic diversity of P. arundinacea populations, although many studies were conducted with populations along multiple rivers in both Europe and North America [29,53]. This knowledge on the genetic diversity of P. arundinacea in N. America and Western and Central Europe is supplemented by our study with data from the Baltic States. For the first time, the ornamental cultivars and genotypes of P. arundinacea cultivated in the private gardens of Lithuanian cities and settlements were evaluated by molecular markers. The work is new in a versatile study of P. arundinacea, whereby different genetic, physiological, and ecological characteristics of the same populations are linked.
In our study, the genetically diverse DNA bank of Lithuanian populations of P. arundinacea that has been collected could be used in the future selection process to develop new productive cultivars that might be used for fodder or raw material for biofuel production. Despite the small size of the country of Lithuania, it would be expedient to use the seeds originating from local populations for the restoration of degraded lands. Our data complement the global knowledge of the genetic structure of the P. arundinacea within its European native range to enhance future studies of the mechanisms of species invasion.

4. Materials and Methods

4.1. Sites and Sample Collection

Research was performed in five Lithuanian river basins (Nemunas, Coastal rivers, Lielupe, Venta, Bartuva). Collection sites were located within 54°01′12.5″–56°23′51.5″ (N) and 21°03′56.4″–25°19′16.1″ (E) (Figure 10). Specific locations of populations collected within the river basins are delineated in Table S3.
Additionally, seven populations from the other Baltic countries (Latvia and Estonia), two from Luxembourg, and two from the Russian Far East were included (Figure 10). A total of 51 populations were sampled, including 40 populations from Lithuania and 11 populations from other countries (Table S3). The distance between the Lithuanian and Luxembourg populations varied between 1179 and 1441 km; the distance between the two Luxembourg populations (Our1 and Sau1) was 8 km; the distance between the Lithuanian and Russian Far Eastern populations (Yas1, Kir1), was between 7002 and 7277 km; the distance between the two Russian Far Eastern populations (Yas1 and Kir1) was 2274 km; and the distance between Luxembourg and Russian Far Eastern populations varied between 8134 and 8416 km (Table 4). From each population, three genotypes (individuals) were collected according Jakubowski et al. [12,84] resulting in a total of 153 genotypes, all of which were growing > 20 m distance apart to minimize sampling the same clones [85]: 120 from Lithuania and 33 from the other countries. Plant populations were named after river names and their abbreviations with numbers denoting each population (Table S3).
For genetic analysis of ornamental genotypes, P. arundinacea cultivars were collected from 45 private homesteads of settlements and cities of Lithuania (Figure 11).
For GBS-SNP analysis using DArTSeq (https://www.diversityarrays.com/services/dartseq/, 15 May 2023), six populations of the Nemunas basin were selected: the upper part of the Nemunas River (Lithuanian part, LT3), the middle part of the Nemunas River (LT4), and the Atmata branch of the Nemunas Delta (LT6), as well as the population from the largest tributary of the Nemunas–Neris (LT5), and two populations from the rivers of the Nemunas tributary and the Merkys river basin (LT1 and LT2), previously studied by microsatellites [63]. Among the GBS-SNPs selected for analysis, all populations were near natural riverbeds, except for the LT1 population (regulated riverbed; Table S3).
Ornamental genotypes of P. arundinacea were coded after the site names and with sequential, numerical coding (Table S4). One plant (genotype) was taken from each homestead, as usually only one dense stand was grown in each landscape for a total of 45 samples collected. Plant population names, with numbers denoting each population, are delineated along with their geographic locations of latitude and longitude coordinates as well as altitudes (Table S4). The ancestral origin of each ornamental type was unknown regarding whether it was from an ornamental breeding program or a selection from the wild. Healthy, recently expanded leaves were collected, as described in Anderson et al. [63]. This maximized DNA quantity during extraction.

4.2. Environmental Variables

Disclosing possible effects of the river and its environment on nutritional state of the plant, Lithuanian populations of P. arundinacea were grouped in several ways: (1) three groups, according to the type of land cover and use class: artificial surfaces (ART), agricultural areas (AGR), forest, and semi-natural areas (FOR) [79]; (2) five groups, according to the present river state: high (H), good (G), moderate (MO), poor (P), bad (B) [78,79]; (3) three groups: populations of North-West (NW), Central (C) and South-East (SE) of Lithuania, based on N concentrations in the rivers neighboring agricultural areas during 1991–1996 [82]; (4) four groups, based on the river size: small (S, <100 km2), medium sized (M, 100–1000 km2), large (L, 1000–10,000 km2), and extra-large (XL, >10,000 km2) rivers (EU, 2000); and (5) two groups, based on riverbed origin: natural and regulated [12] (Table S5).

4.3. Molecular Analysis

Total genomic DNA of P. arundinacea was isolated using the modified CTAB method [73,86,87], with details described by Štorchová et al. [88] and some further updates [63,89]. Agarose gel (1%) electrophoresis and UV spectrophotometry (BioSpec-Nano, Shimadzu, Carlsbad, CA, USA) were used to assess DNA quality and quantity.
For molecular analysis of P. arundinacea, simple sequence repeat (SSR) markers or microsatellites were selected following Lawrence et al. [76], Li et al. [75], and Jakubowski et al. [56]. For the SSRs assessment, 14 primer pairs were selected for the population analyses of P. arundinacea, as in previous research [63]. For microsatellite analysis, amplification products were mixed with Hi-Di Formamide and GeneScanTM 500 LIZ size standard (Applied Biosystems, Warrington, UK) and denaturated at 95 °C for 3 min. Capillary gel electrophoresis was performed on an ABI Prism 3130xl Genetic Sequencer (Genetic analyzer 3130; Applied Biosystems, Darmstadt, Germany). Data were analyzed by GeneMapper v. 4.0 (Applied Biosystems, Darmstadt, Germany).
For genotype by sequencing (GBS) to generate low density single nucleotide polymorphisms (SNPs), leaf samples were dried in Lithuania and shipped to the University of Minnesota for processing, i.e., samples were ground in a Geno/Grinder® Tissue Homogenizer, SPEX SamplePrep (Avantor, VWR), and ground leaf powder samples (10–20 mg/genotype) were sent to DArTSeq for DNA extraction, GBS, and SNP generation.

4.4. Statistical Analysis

DNA fragments, obtained for each SSR loci, were scored for presence or absence [76]. Due to possible differences in ploidy and allele abundance, the data of capillary electrophoresis were evaluated as dominant (not as codominant) following Jakubowski et al. [55] and Ketternring et al.’s [60] investigations of P. arundinacea.
Analysis of hierarchical molecular variance (AMOVA) among populations and within populations, along with the Mantel test for relations between genetic and geographical distances of populations and principal coordinate analysis were performed using GenAlEx v. 6.5 [90]; polymorphism of DNA, Nei’s [91] genetic diversity, Shannon’s information index [92], and Nei’s [93] genetic distances (by UPGMA) were calculated by POPGENE 1.32 [70]; Nei and Li [94]-based genetic distances for individuals by UPGMA were analyzed by TreeCon 1.3 [95]; Bayesian clustering analysis was conducted using STRUCTURE 3.2.4 [96,97]; comparison of nitrogen concentrations was completed by R 3.4.4 [98]; comparison of population groups depending on environment was performed by R package PMCMR [99] and CompareGroups [100]; and multiple correspondence analysis between groups of populations of different plant species, formed depending on certain factors, was conducted using FactoMineR [101] and FactoExtra [101].
To analyze SNP data from DArTseqLD™ genotyping for river basin populations LT1–LT6, the package dartR in R Studio was used [102]. Running gl.report.callrate, the call rates were analyzed for histograms, loci and genotypes, and selecting a call rate which maintained the highest number of genotypes while maintaining high-quality loci. SNP data were analyzed with R Studio (Version 4.2.3) was used to determine genetic diversity (principal coordinate analysis, PCA), genetic STRUCTURE (Version 1.2.5033) and STRUCTURE Harvester, and GenAlEx 6.5 [90] using Microsoft Excel.

5. Conclusions

This analysis of P. arundinacea populations across European and Eurasian countries provides evidence that the species is widespread across the continent in its native riparian habitat. Genetic variation, based on 14 tested P. canariensis microsatellites, demonstrated the highest variability was within (82%) populations, rather than among (18%), which matches previous extensive studies in N. American populations. This variation occurred regardless of land cover types (2%), differing river status (1%), nitrogen concentrations (2%), river size (0%), or riverbed origin (0%). Genetic differentiation was significant (25% of the total genetic variability) among the populations of Romania, the Baltic States, and the Russian Far East. In Eurasia, intrapopulation diversity within P. arundinacea populations (62%) was similar to Lithuanian populations. Such high intrapopulation diversity may be due to high gene exchange, characteristic for wind pollinated species such as Phalaris.
Allelic numbers among populations totaled 95 alleles, averaging 6.7 alleles/primer, and were slightly lower than previous findings. We theorize this reduction to be due to “bottle neck” effects.
All microsatellite loci were polymorphic, e.g., the Eurasian percentage of polymorphic microsatellite loci averaged 29.9%, significantly less than other European and N. American populations. The greatest difference polymorphisms per country was between the Russian Far East (25.0%) and Luxembourg (33.0%).
Statistically significant correlations among genetic and geographic distances up to 8416 km of Eurasian populations were similar to previous findings for other populations, supporting the theory that this species, while native to Europe and Eurasia, continues natural spreading along riverbanks as a potentially invasive–yet native–species. Implications of this research will be widespread in applicability to future genomic-based evolutionary biology studies.
Lithuanian populations are differentiated among river basins (6–11% of total genetic variability). Land cover and use type, river status, and former nitrogen pollution in Lithuania affected the genetic structure of populations.
Ornamental genotypes (cultivars) were more similar to each other than those from riparian populations, potentially due to breeding and selection effects. Maintaining clonal integrity in ornamental cultivars would maintain this genetic differentiation from wild native, riparian populations.

Supplementary Materials

The following supporting information can be downloaded at https://www.mdpi.com/article/10.3390/genes15060734/s1: Table S1. Fourteen microsatellite (SSR) loci-based indices of genetic diversity of Eurasian populations of Phalaris arundinacea, separated by country of origin (LT = Lithuania; EE = eastern Europe, Baltic countries; LU = Luxembourg; RU = Russian Far East), river basin, population, the number of unique alleles (Np), the total number of alleles (Nt), the number of polymorphic alleles (N), percentage of polymorphic DNA loci (%P), Shannon‘s information index (I) and index of Nei‘s gene diversity (h); Table S2. Geographical (km) and genetic (Nei, 1978) distances between 51 Eurasian populations of Phalaris arundinacea based on 14 microsatellite markers; Table S3. Geographical locations of Eurasian Phalaris arundinacea populations used for genetic analysis: population code, DNA marker type, river name, river basin name, site name, country of origin, and geographical location specifics (latitude, longitude, altitude); Table S4. Site information (population numerical codes, geographic locations of latitude and longitude, and altitude) of 45 Lithuanian genotype accessions of ornamental Phalaris arundinacea var. picta or P. arundinacea; Table S5. Characteristics of the environment factors for Lithuanian Phalaris arundinacea populations used for genetical analysis: population, land cover type, river state, geographical areas based on N concentration in years 1992–1996, river size, and riverbed origin.

Author Contributions

Conceptualization, E.K.; methodology, E.K.-K., L.J. and O.A.C.; software, E.K.-K. and T.R.; investigation, E.K., E.K.-K. and L.J.; writing—original draft preparation, E.K., E.K.-K. and N.O.A.; writing—review and editing, E.K., N.O.A., E.K.-K., L.J., A.P. and O.A.C.; visualization, E.K.-K., T.R. and N.O.A.; supervision, E.K. and A.P.; project administration, E.K., L.J. and E.K.-K. All authors have read and agreed to the published version of the manuscript.

Funding

This study was funded by the Research Council of Lithuania, Grant No. SIT-02/2015.

Institutional Review Board Statement

Not applicable.

Informed Consent Statement

Not applicable.

Data Availability Statement

The data presented in this study are available on request from the corresponding author due to privacy.

Acknowledgments

Jūratė Šikšnianienė for technical assistance in capillary electrophoresis.

Conflicts of Interest

The authors declare no conflicts of interest.

References

  1. International Union for Conservation of Nature. The Ramsar Convention: A Legal Review. In The 5th Conference on the Convention of Wetlands for International Importance Especially as Waterfowl Habitat; International Union for Conservation of Nature and Natural Resources: Gland, Switzerland; Caliari, Italy, 1980; pp. 24–29. [Google Scholar]
  2. Ramsar Convention Secretariat. The Fourth Ramsar Strategic Plan 2016–2024. Ramsar Handbooks for the Wise Use of Wetlands, 5th ed.; Ramsar Convention Secretariat: Caliari, Italy; Gland, Switzerland, 2016. [Google Scholar]
  3. Douglas, E. Building the European Union‘s Natura 2000 network. Nat. Conserv. 2012, 12, 11–26. [Google Scholar]
  4. Gailiušis, B.; Jablonskis, J.; Kovalenkovienė, M. Lithuanian Rivers: Hydrography and Runoff (Lietuvos upės: Hidrografija ir Nuotėkis); Lietuvos Energetikos Institutas: Kaunas, Lithuania, 2001. [Google Scholar]
  5. Noticias del mundo ecológico. Ecological Sustainability: Engineering Change. In The 5th International EcoSummit Congress; EcoSummit: Montpellier, France, 2016; Available online: http://www.ecosummit2016.org/ (accessed on 16 December 2023).
  6. Mathews, S.; Tsai, R.C.; Kellogg, E.A. Phylogenetic structure in the grass family (Poaceae): Evidence from the nuclear gene phytochrome B. Am. J. Bot. 2000, 87, 96–107. [Google Scholar] [CrossRef] [PubMed]
  7. Bouchenak-Khelladi, Y.; Salamin, N.; Savolainen, V.; Forest, F.; van der Bank, M.; Chase, M.W.; Hodkinson, T.R. Large multi-gene phylogenetic trees of the grasses (Poaceae): Progress towards complete tribal and generic level sampling. Mol. Phylogenet. Evol. 2008, 47, 488–505. [Google Scholar] [CrossRef] [PubMed]
  8. Soreng, R.J.; Peterson, P.M.; Romaschenko, K.; Davidse, G.; Teisher, J.K.; Clark, L.G.; Barbera, P.; Gillespie, L.J.; Zuloaga, F.O. A worldwide phylogenetic classification of the Poaceae (Gramineae) II: An update and a comparison of two 2015 classifications. J. Syst. Evol. 2017, 55, 259–290. [Google Scholar] [CrossRef]
  9. Centre for Agriculture and Biosciences International [CABI]. Phalaris arundinacea. In Invasive Species Compendium; The Centre for Agriculture and Bioscience International: Wallingford, UK, 2021; Available online: www.cabi.org/isc (accessed on 11 December 2023).
  10. Weinmann, F.; Boule, M.; Brunner, K.; Yoshino, V. Wetland Plants of the Pacific Northwest; U.S. Army Corps of Engineers: Seattle, WA, USA, 1984. [Google Scholar]
  11. Snarskis, P. An Identification Guide to the Plants of Lithuania SSR (Vadovas Lietuvos TSR Augalams Pažinti); Valstybinė politinės ir mokslinės literatūros leidykla: Vilnius, Lithuania, 1954. [Google Scholar]
  12. Nelson, F.M.; Anderson, N.O.; Casler, D.M.; Jakubowski, R.A. Population genetic structure of N. American and European Phalaris arundinacea L. as inferred from inter-simple sequence repeat markers. Biol. Inv. 2014, 16, 353–363. [Google Scholar] [CrossRef]
  13. Voshell, S.M.; Hilu, W.H. Canary grasses (Phalaris, Poaceae): Biogeography, molecular dating and the role of floret structure in dispersal. Mol. Ecol. 2014, 23, 212–224. [Google Scholar] [CrossRef] [PubMed]
  14. Gifford, A.L.; Ferdy, J.B.; Molofsky, J. Genetic composition and morphological variation among populations of the invasive grass, Phalaris arundinacea. Can. J. Bot. 2002, 80, 779–785. [Google Scholar] [CrossRef]
  15. Ito, M.; Sato, E.; Goto, H.; Hattori, Y. Growth morphology of reed canarygrass (Phalaris arundinacea L.) tillers under sward conditions. Nippon Sochi Gakkaishi 1990, 36, 254–262. [Google Scholar]
  16. Grime, R.J.; Hodgson, G.J.; Hunt, R. Comparative Plant Ecology: A Functional Approach to Common British Species, 2nd ed.; MacMillan Publishers (Castlepoint Press): Colvend, UK, 2007. [Google Scholar]
  17. Bloju, O.; Boldura, O.M.; Samfira, I.; Popescu, S. Evaluation of genetic diversity of some Phalaris sp. using microsatellites. J. Hortic. For. Biotechnol. 2014, 18, 135–140. [Google Scholar]
  18. Ellenberg, H.; Weber, H.E.; Düll, R.; Wirth, V.; Werner, W.; Paulißen, D. Indicator values of plants in Central Europe. Scripta Geobotanica 1992, 18, 77–153. [Google Scholar]
  19. Valk, A.V.D.; Bliss, L.C. Hydrarch succession and net primary production of oxbow lakes in central Alberta. Can. J. Bot. 1971, 49, 1177–1199. [Google Scholar] [CrossRef]
  20. Long, C.J.; Whitlock, C. Fire and vegetation history from the coastal rain forest of the western Oregon Coast Range. Quat. Res. 2002, 58, 215–225. [Google Scholar] [CrossRef]
  21. Morin, E.; Bouchard, A.; Jutras, P. Ecological analysis of disturbed riverbanks in the Montreal area of Quebec. Environ. Manag. 1989, 13, 215–225. [Google Scholar] [CrossRef]
  22. Foster, R.D.; Wetzel, P.R. Invading monotypic stands of Phalaris arundinacea: A test of fire, herbicide, and woody and herbaceous native plant groups. Restor. Ecol. 2005, 13, 318–324. [Google Scholar] [CrossRef]
  23. Brooks, M.L. Effects of fire suppression and postfire management activities on plant invasions. In Wildland Fire in Ecosystems: Fire and Nonnative Invasive Plants; General Technical Report; Zouhar, K., Smith, J.K., Sutherland, S.M., Brooks, L., Eds.; Department of Agriculture, Forest Service, Rocky Mountain Research Station: Ogden, UT, USA, 2008; pp. 269–280. [Google Scholar]
  24. Hansen, P.L.; Pfister, R.D.; Boggs, K.C.; Bradley, J.; Joy, J.; Hinckley, D.K. Classification and management of Montana’s riparian and wetland sites. In Miscellaneous Publication, No. 54; Montana Forest and Conservation Experiment Station: Missoula, MT, USA, 1995. [Google Scholar]
  25. Green, E.K.; Galatowitsch, S.M. Effects of Phalaris arundinacea and nitrate-N addition on the establishment of wetland plant communities. J. Appl. Ecol. 2002, 39, 134–144. [Google Scholar] [CrossRef]
  26. Natkevičiūtė-Ivanauskienė, M. Varpiniai—Gramineae. In Lietuvos TSR Flora; Minkevičius, A., Jankevičius, K., Brunza, K., Dagys, J., Lekavičius, A., Pipinys, J., Eds.; Valstybinė politinės ir mokslinės literatūros leidykla: Vilnius, Lithuania, 1963; Volume 2. [Google Scholar]
  27. Larson, G.E. Aquatic and Wetland Vascular Plants of the Northern Great Plains; Gen. Tech. Rep., RM 238; U.S. Department of Agriculture, Forest Service, Rocky Mountain Forest and Range Experiment Station: Fort Collins, CO, USA, 1993. [Google Scholar]
  28. Merigliano, M.F.; Lesica, P. The native status of reed canarygrass (Phalaris arundinacea L.) in the inland northwest, USA. Nat. Areas J. 1998, 18, 223–230. [Google Scholar]
  29. Noyszewski, A.K.; Anderson, N.O.; Smith, A.G.; Kilian, A.; Dalbotten, D.; Ito, E.; Timm, A.; Pellerin, H.; Kubatova, B.; Januš, V.; et al. Riparian populations of Minnesota reed canarygrass (Phalaris arundinacea) are most likely native, based on SNPs (DArTseqLD). Wetl. Ecol. Manag. 2021, 29, 467–494. [Google Scholar] [CrossRef]
  30. Harrison, R.D.; Chatterton, N.J.; Page, R.J.; Curto, M.; Asay, K.H.; Jensen, K.B.; Horton, W.H. Effects of nine introduced grasses on ecological biodiversity in the Columbia basin. In Rangelands in a Sustainable Biosphere, Proceedings of the Fifth International Rangeland Congress, Salt Lake City, UT, USA, 23–28 July 1995; Society for Range Management: Salt Lake City, UT, USA, 1996; pp. 211–212. [Google Scholar]
  31. Lesica, P. Spread of Phalaris arundinacea adversely impacts the endangered plant Howellia aquatilis. Great Basin Nat. 1997, 57, 366–368. [Google Scholar]
  32. Swearingen, J.; Bargeron, C. Invasive Plant Atlas of the United States; Center for Invasive Species and Ecosystem Health, University of Georgia: Athens, GA, USA, 2016; Available online: http://www.invasiveplantatlas.org/ (accessed on 16 December 2023).
  33. Lavergne, S.; Molofsky, J. Increased genetic variation and evolutionary potential drive the success of an invasive grass. Proc. Nat. Acad. Sci. USA 2007, 104, 3883–3888. [Google Scholar] [CrossRef]
  34. Jakubowski, A.R.; Casler, M.D.; Jackson, R.D. Landscape context predicts reed canarygrass invasion: Implications for management. Wetlands 2010, 30, 685–692. [Google Scholar] [CrossRef]
  35. Hitchcock, C.L.; Cronquist, A.; Ownbey, M. Vascular Plants of the Pacific Northwest. Part 1: Vascular Cryptogams, Gymnosperms, and Monocotyledons; University of Washington Press: Seattle, WA, USA, 1969. [Google Scholar]
  36. Kline, P.; Broersma, K. The yield, nitrogen and nitrate content of reed canarygrass, meadow foxtail and timothy fertilized with nitrogen. Can. J. Plant Sci. 1983, 63, 943–950. [Google Scholar] [CrossRef]
  37. Galatowitsch, S.M.; Anderson, N.O.; Ascher, P. Invasiveness in wetland plants in temperate north America. Wetlands 1999, 19, 733–755. [Google Scholar] [CrossRef]
  38. Tasi, J.; Barcsak, Z. Relationship between the phenological phase of grass and the quality of fodder. Novenytermeles 2001, 50, 31–42. [Google Scholar]
  39. Struzhkina, T.M. Phalaris arundinacea, a valuable fodder crop for the Kamchatka region, Russia. Kormoproizvodstvo 2002, 8, 11–15. [Google Scholar]
  40. Casler, M.D. Genetics, breeding, and ecology of reed canarygrass. Int. J. Plant Breed. 2010, 4, 30–36. [Google Scholar]
  41. Lefor, M.W. Phalaris arundinacea L. (reed canary grass—Gramineae) as a hydrophyte in Essex, Connecticut, USA. Environ. Manag. 1987, 11, 771–773. [Google Scholar] [CrossRef]
  42. Essl, F.; Rabitsch, W.; Breuss, O. Neobiota in Österreich; Umweltbundesamt: Wien, Germany, 2002. [Google Scholar]
  43. Verloove, F. Catalogue of neophytes in Belgium (1800–2005). Scr. Bot. Belg. 2006, 39, 1–89. [Google Scholar]
  44. Medvecká, J.; Kliment, J.; Májeková, J.; Halada, Ľ.; Zaliberová, M.; Gojdičová, E.; Feráková, V.; Jarolímek, I. Inventory of the alien flora of Slovakia. Preslia 2012, 84, 257–309. [Google Scholar]
  45. Pyšek, P.; Danihelka, J.; Sádlo, J.; Chrtek, J., Jr.; Chytrý, M.; Jarošík, V.; Kaplan, Z.; Krahulec, F.; Moravcová, L.; Pergl, J.; et al. Catalogue of alien plants of the Czech Republic: Checklist update, taxonomic diversity and invasion patterns, 2nd ed. Preslia 2012, 84, 155–255. [Google Scholar]
  46. Petrova, A.; Vladimirov, V. Reports of some ornamental plants as aliens for the Bulgarian flora. Phytol. Balc. 2019, 25, 387–394. [Google Scholar]
  47. Hübner, T.M.; Tischer, S.; Tanneberg, H.; Kuschk, P. Influence of phenol and phenanthrene on the growth of Phalaris arundinacea and Phragmites australis. Int. J. Phytoremediation 2000, 2, 331–342. [Google Scholar] [CrossRef]
  48. Polechońska, L.; Klink, A. Trace metal bioindication and phytoremediation potentialities of Phalaris arundinacea L. (reed canary grass). J. Geochem. Explor. 2014, 146, 27–33. [Google Scholar] [CrossRef]
  49. Dzantor, E.K.; Chekol, T.; Vough, L.R. Feasibility of using forage grasses and legumes for phytoremediation of organic pollutants. J. Environ. Sci. Health A 2000, 35, 1645–1661. [Google Scholar] [CrossRef]
  50. Wrobel, C.; Coulman, E.B.; Smith, L.D. The potential use of reed canarygrass (Phalaris arundinacea L.) as a biofuel crop. Acta Agric. Scand. 2009, 59, 1–18. [Google Scholar]
  51. Ustak, S.; Šinko, J.; Munoz, J. Reed canary grass (Phalaris arundinacea L.) as a promising energy crop. J. Cent. Eur. Agric. 2019, 20, 1143–1168. [Google Scholar] [CrossRef]
  52. Casler, M.D.; Phillips, M.M.; Krohn, A.L. DNA polymorphisms reveal geographic races of reed canary grass. Crop Sci. 2009, 49, 2139–2148. [Google Scholar] [CrossRef]
  53. Anderson, N.O.; Kavova, T.; Bastlova, D.; Čurn, V.; Kubatova, B.; Edwards, K.R.; Vojtech, J.; Kvet, J. Phenotypic and genotypic variation in Czech forage, ornamental and wild populations of reed canarygrass. Crop Sci. 2016, 56, 2421–2435. [Google Scholar] [CrossRef]
  54. Kávová, T.; Kubátová, B.; Curn, V.; Anderson, N.O. Genetic variability of US and Czech Phalaris arundinacea L. wild and cultivated populations. In New Perspective in Forage Crops; Evan, R.L., Bezerra, L.R., Eds.; Intech: London, UK, 2018; pp. 169–186. [Google Scholar] [CrossRef]
  55. Jakubowski, A.R.; Casler, M.D.; Jackson, R.D. Has selection for improved agronomic traits made reed canarygrass invasive? PLoS ONE 2011, 6, e25757. [Google Scholar] [CrossRef]
  56. Jakubowski, A.R.; Jackson, R.D.; Johnson, R.C.; Hu, J.; Casler, M.D. Genetic diversity and population structure of Eurasian populations of reed canarygrass: Cytotypes, cultivars, and interspecific hybrids. Crop Pasture Sci. 2011, 62, 982–991. [Google Scholar] [CrossRef]
  57. Jakubowski, A.R.; Casler, M.D.; Jackson, R.D. Genetic evidence suggests a widespread distribution of native North American populations of reed canarygrass. Biol. Inv. 2012, 15, 261–268. [Google Scholar] [CrossRef]
  58. Jakubowski, A.R.; Jackson, R.D.; Casler, M.D. The history of reed canarygrass in North America: Persistence of natives among invading Eurasian populations. Crop Sci. 2013, 54, 210–219. [Google Scholar] [CrossRef]
  59. Barth, S.; Jankowska, M.J.; Hodkinson, T.R.; Vellani, T.; Klaas, M. Variation in sequences containing microsatellite motifs in the perennial biomass and forage grass, Phalaris arundinacea (Poaceae). BMC Res. Notes 2016, 9, 184–188. [Google Scholar] [CrossRef] [PubMed]
  60. Kettenring, K.M.; Menuz, D.R.; Mock, K.E. The nativity and distribution of the cryptic invader Phalaris arundinacea (reed canarygrass) in riparian areas of the Columbia and Missouri River Basins. Wetlands 2019, 39, 55–66. [Google Scholar] [CrossRef]
  61. Graper, A.; Noyszewski, A.; Anderson, N.; Smith, A. Variability in ITS1 and ITS2 sequences of historic (herbaria) and extant (fresh) Phalaris species. BMC Plant Biol. 2021, 21, 515. [Google Scholar] [CrossRef] [PubMed]
  62. Perdereau, A.; Klaas, M.; Barth, S.; Hodkinson, T.R. Plastid genome sequencing reveals biogeographical structure and extensive population genetic variation in wild populations of Phalaris arundinacea L. in north-western Europe. Glob. Chang. Biol. Bioenergy 2017, 9, 46–56. [Google Scholar] [CrossRef]
  63. Anderson, N.O.; Jocienė, L.; Krokaitė, E.; Rekašius, T.; Paulauskas, A.; Kupčinskienė, E. Genetic diversity of Phalaris arundinacea populations in relation to river regulation in the Merkys basin, Lithuania. River Res. Appl. 2018, 34, 300–309. [Google Scholar] [CrossRef]
  64. Anderson, N.O. Throwing out the bathwater but keeping the baby: Lessons learned from purple loosestrife and reed canarygrass. HortTechnology 2019, 29, 539–548. [Google Scholar] [CrossRef]
  65. Anderson, N.O.; Smith, A.G.; Noyszewski, A.K.; Ito, E.; Dalbotten, D.; Pellerin, H. Management and control issues for native, invasive species (reed canarygrass): Evaluating philosophical, management, and legislative Issues. HortTechnology 2021, 31, 354–366. [Google Scholar] [CrossRef]
  66. Lekavičius, A. A Plant Guide (Vadovas augalams Pažinti); Mokslas: Vilnius, Lithuania, 1989. [Google Scholar]
  67. Zviedre, E.; Vītola, I.; Vizule-Kahovska, L.; Upena, I. Evaluation of Phytobenthos and Macrophytes of the Inland Surface Waters and Ecological Status Defined by Macrophyte Reference Index. Report, Part II, Rivers; Latvian Environment, Geology and Meteorology Center: Ryga, Latvia, 2015. [Google Scholar]
  68. Pocienė, L.; Šarūnaitė, L.; Tilvikienė, V.; Šlepetys, J.; Kadžiulienė, Ž. The yield and composition of reed canary grass biomass as raw material for combustion. Biologija 2013, 59, 195–200. [Google Scholar] [CrossRef]
  69. Amaleviciute-Volunge, K.; Slepetiene, A.; Butkute, B. The suitability of perennial grasses for combustion as influenced by chemical composition and plant growth stage. Zemdirbyste 2020, 107, 317–322. [Google Scholar] [CrossRef]
  70. Nei, M.; Li, W.H. Mathematical model for studying genetic variation in terms of restriction endonucleases. Proc. Nat. Acad. Sci. USA 1979, 76, 5269–5273. [Google Scholar] [CrossRef] [PubMed]
  71. Krokaitė, E.; Shakeneva, D.; Juškaitytė, E.; Tomas, R.; Nemaniūtė-Gužienė, J.; Butkuvienė, J.; Patamsytė, J.; Rančelienė, V.; Vyšniauskienė, R.; Duchovskienė, L.; et al. Nitrogen concentration of the aquatic plant species in relation to land cover type and other variables of the environment. Zemdirbyste 2019, 106, 203–212. [Google Scholar] [CrossRef]
  72. Vyšniauskienė, R.; Rančelienė, V.; Naugžemys, D.; Rudaitytė-Lukošienė, E.; Patamsytė, J.; Butkauskas, D.; Kupčinskienė, E.; Žvingila, D. Genetic diversity of Nuphar lutea in Lithuanian river populations. Aquat. Bot. 2020, 161, 103–173. [Google Scholar] [CrossRef]
  73. Jocienė, L.; Krokaitė, E.; Shakeneva, D.; Rekašius, T.; Stanys, V.; Šikšnianienė, J.B.; Žvingila, D.; Paulauskas, A.; Kupčinskienė, E. Relationship between genetic and environmental characteristics of Lithuanian populations of purple loosestrife (Lythrum salicaria). J. Environ. Eng. Landsc. Manag. 2022, 30, 81–93. [Google Scholar] [CrossRef]
  74. Li, J.; Baga, M.; Hucl, P.; Chibbar, N.R. Developement of microsatellite markers in canary seed (Phalaris canariensis L.). Mol. Breed. 2011, 28, 611–621. [Google Scholar] [CrossRef]
  75. Lawrence, C.J.; Dong, Q.; Polacco, M.L.; Seigfried, T.E.; Brendel, V. MaizeGDB, the community database for maize genetics and genomics. Nucleic Acids Res. 2004, 32, D393–D397. [Google Scholar] [CrossRef] [PubMed]
  76. Jocienė, L.; Krokaitė, E.; Rekašius, T.; Juškaitytė, E.; Ielciu, I.; Galanina, O.; Kupčinskienė, E. The molecular evidence for invasive climber Echinocystis lobata (Michx.) Torr. & A. Gray in eastern and central Europe. Diversity 2023, 15, 1084. [Google Scholar] [CrossRef]
  77. Kupcinskiene, E.; Zybartaite, L.; Paulauskas, A. Comparison of molecular diversity of three Impatiens species from Central Europe and Baltic region. Zemdirbyste-Agriculture 2015, 102, 87–94. [Google Scholar] [CrossRef]
  78. CORINE Land Cover. CORINE Land Cover Nomenclature Conversion to Land Cover Classification System; European Environment Agency: Vienna, Austria, 2012; Available online: http://www.igeo.pt/gdr/pdf/CLC2012_nomenclature_addendum.pdf (accessed on 8 December 2023).
  79. European Union. 2000/60/EC of the European Parliament and of the Council of 23 October 2000 Establishing a Framework for Community Action in the Field of Water Policy; European Parliament, Council of the European Union: Brussels, Belgium, 2000; Volume 327, pp. 1–73. [Google Scholar]
  80. Aplinkos Apsaugos Agentura. Agriculture and Lithuanian Waters. Impact of Agricultural Activities on the State of Lithuanian Rivers and Pollution Loads to the Baltic Sea (Žemės ūkis ir Lietuvos Vandenys. Žemės ūkio Veiklos Poveikis Lietuvos upių Būklei ir Taršos Apkrovoms į Baltijos Jūrą); Aplinkos Apsaugos Agentura: Vilnius, Lithuania, 2018; Available online: https://vanduo.old.gamta.lt/files/%C5%BDem%C4%97s_%C5%ABkio_poveikio_ataskaita1539180129871.pdf (accessed on 2 December 2023).
  81. Tumas, R. Regularities of river water quality under the interactions of physical geography factors and farming intensity. In Proceedings of the ÕÕ Nordic Hydrological Conference, Helsinki, Finland, 10–13 August 1998; pp. 100–108. [Google Scholar]
  82. Jociene, L.; Stravinskaite, K.; Krokaite, E.; Janulioniene, R.; Rekašius, T.; Paulauskas, A.; Marozas, V.; Kupcinskiene, E. AFLP-based genetic structure of Lithuanian populations of small balsam (Impatiens parviflora DC.) in relation to habitat characteristics. Forests 2022, 13, 1228. [Google Scholar] [CrossRef]
  83. Nelson, M.F.; Anderson, N.O. How many marker loci are necessary? Analysis of dominant marker data sets using two popular population genetic algorithms. Ecol. Evol. 2013, 3, 3455–3470. [Google Scholar] [CrossRef]
  84. Guo, W.; Wang, R.; Zhou, S.; Zhang, S.; Zhang, Z. Genetic diversity and clonal structure of Phragmites australis in the Yellow river delta of China. Biochem. Syst. Ecol. 2003, 31, 1093–1109. [Google Scholar] [CrossRef]
  85. Doyle, J.J.; Doyle, J.L. Isolation of plant DNA from fresh tissue. Focus 1990, 12, 3–15. [Google Scholar]
  86. Kupcinskiene, E.; Zybartaite, L.; Janulioniene, R.; Zukauskiene, J.; Paulauskas, A. Molecular diversity of small balsam populations in relation to site characteristics. Cent. Eur. J. Biol. 2013, 8, 1048–1061. [Google Scholar] [CrossRef]
  87. Štorchová, H.; Hrdličková, R.; Chrtek, J., Jr.; Tetera, M.; Fitze, D.; Fehrer, J. An improved method of DNA isolation from plants collected in the field and conserved in saturated NaCl/CTAB solution. Taxon 2000, 49, 79–84. [Google Scholar] [CrossRef]
  88. Juškaitytė, E.; Krokaitė, E.; Jocienė, L.; Paulauskas, A.; Kupčinskienė, E. Methodical search for molecular studies of some riparian species of herbaceous plants. In Human and Nature Safety, Proceedings of the 22nd International Scientific-Practice Conference, Kaunas, Lithuania, 4–6 May 2016, ; Academy, LUA: Kaunas, Lithuania, 2016; Volume 22, pp. 186–189. [Google Scholar]
  89. Peakall, R.; Smouse, P.E. GenAlEx 6.5: Genetic analysis in Excel. Population genetic software for teaching and research—An update. Bioinformatics 2012, 28, 2537–2539. [Google Scholar] [CrossRef] [PubMed]
  90. Nei, M. Analysis of gene diversity in subdivided populations. Proc. Nat. Acad. Sci. USA 1973, 70, 3321–3323. [Google Scholar] [CrossRef]
  91. Shannon, C.E. A mathematical theory of communication. Bell Syst. Tech. J. 2001, 27, 379–423. [Google Scholar] [CrossRef]
  92. Nei, M. Estimation of average heterozygosity and genetic distance from a small number of individuals. Genetics 1978, 89, 583–590. [Google Scholar] [CrossRef]
  93. Yeh, F.C.; Yang, R.C.; Boyle, T. POPGENE Version 1.32: Microsoft Windows-Based Freeware for Population Genetic Analysis, Quick User Guide; Center for International Forestry Research: Edmonton, AB, Canada, 1999. [Google Scholar]
  94. Van de Peer, Y.; De Wachter, R. Construction of evolutionary distance trees with TREECON for Windows: Accounting for variation in nucleotide substitution rate among sites. Bioinformatics 1997, 13, 227–230. [Google Scholar] [CrossRef]
  95. Pritchard, J.K.; Stephens, M.; Donnelly, P. Inference of population structure using multilocus genotype data. Genetics 2000, 155, 945–959. [Google Scholar] [CrossRef]
  96. Falush, D.; Stephens, M.; Pritchard, J.K. Inference of population structure using multilocus genotype data: Linked loci and correlated allele frequencies. Genetics 2003, 164, 1567–1587. [Google Scholar] [CrossRef] [PubMed]
  97. R Core Team. R: A Language and Environment for Statistical Computing; R Foundation for Statistical Computing: Vienna, Austria, 2018. [Google Scholar]
  98. Pohlert, T. The pairwise multiple comparison of mean ranks package (PMCMR). R Package 2014, 27, 9. [Google Scholar]
  99. Subirana, I.; Sanz, H.; Vila, J. Building bivariate tables: The compare groups package for R. J. Stat. Softw. 2014, 57, 1–16. [Google Scholar] [CrossRef]
  100. Lê, S.; Josse, J.; Husson, F. FactoMineR: An R package for multivariate analysis. J. Stat. Softw. 2008, 25, 1–18. [Google Scholar] [CrossRef]
  101. Kassambara, A.; Mundt, F. Factoextra: Extract and visualize the results of multivariate data analyses. R Package Ver. 2017, 1, 337–354. [Google Scholar]
  102. Gruber, B.; Unmack, P.J.; Berry, O.F.; Georges, A. DArTR: An R package to facilitate analysis of SNP data generated from reduced representation genome sequencing. Mol. Ecol. Resour. 2018, 18, 691–699. [Google Scholar] [CrossRef]
Figure 1. Mantel test defined for 51 Eurasian populations of Phalaris arundinacea among geographic distances (km) and Nei’s genetic distances at 14 microsatellite loci. The linear regression equation is y = 2 × 10⁻⁵x + 0.1116; R2 = 0.5526.
Genes 15 00734 g001
Figure 2. Principal coordinate analysis (1st and 2nd axis) based on microsatellite markers of Phalaris arundinacea, for of 51 populations: the Lithuanian basin populations (green diamonds), Eurasian (blue triangles, orange circles, fuchsia squares and purple circles) and the Russian Federation (red squares).
Genes 15 00734 g002
Figure 3. Number of Bayesian clusters of Eurasian populations of Phalaris arundinacea (largest ΔK = 2, second largest ΔK = 4, for selected K values from 1 to 51).
Genes 15 00734 g003
Figure 4. Bayesian (GBS-SNP) STRUCTURE of Lithuanian, other Baltic countries (LV, EE), Luxembourg (LU) and the Russian Far East (RU) Phalaris arundinacea genotypes and populations by clusters: (a) case of ΔK = 2 clusters, (b) case of ΔK = 4 clusters (columns indicate populations and columns separated by black lines indicate individuals; dark blue and light blue columns denote two (a) and red, green, dark blue, and light blue denote four (b) clusters).
Genes 15 00734 g004aGenes 15 00734 g004b
Figure 5. Dendrogram of genetic relationships based on 14 microsatellite markers among 45 Lithuanian ornamental form individuals of Phalaris arundinacea var. picta using the UPGMA method and Nei and Li’s [70] genetic distances with bootstrap support values (1000 replications).
Genes 15 00734 g005
Figure 6. Relationship among geographical (km) and Nei’s genetic distances [70] for 14 microsatellite loci for ornamental accessions of Lithuanian Phalaris arundinacea var. picta.
Genes 15 00734 g006
Figure 7. UPGMA dendrogram of genetic relatedness of genotypes of Lithuanian Phalaris arundinacea var. picta grown for ornamental purposes and naturally growing P. arundinacea riparian plants, constructed using Nei and Li’s [70] genetic distances according to 14 microsatellite markers (cf. Tables S3 and S4 for genotype descriptions). Solid green line indicates naturally growing riparian individuals; dotted line indicates cultivated ornamental genotypes). Note: due to the length of the figure, the base of the left-hand figure portion continues on the top of the right-hand figure portion.
Genes 15 00734 g007
Figure 8. Genetic diversity plot of single nucleotide polymorphisms (SNPs) using principal component analysis, PCA (a type of principal coordinate analyses, PCoA, that uses Euclidean distance), for the first two coordinates (PCA 1, PCA 2) of clusters LT1 to LT6 populations (see text), based on single nucleotide polymorphisms (SNPs) of Lithuanian wild, riparian Phalaris arundinacea and cultivated P. a. var. picta. In the figure LT sites (LT 1-6) correspond to the sites of the Table S3, LT1-Ber, LT2-Mer4, LT5-Ner2, LT3-Nem1, LT4-Nem3 and LT6-Atm1.
Genes 15 00734 g008
Figure 9. A UPGMA fan of Phalaris arundinacea genetic relatedness for 37 wild, extant genotypes (LT1 to LT6 populations; see text) growing in Nemunas river basin of Lithuania, constructed using Nei and Li’s genetic distance [70] from single nucleotide polymorphism (SNP) data. In the figure LT sites (LT 1–6) correspond to the sites of the Table S3, Figure 10: LT1—Ber, LT2—Mer4, LT5—Ner2, LT3—Nem1, LT4—Nem3 and LT6—Atm1.
Genes 15 00734 g009
Figure 10. Geographical position of populations of Phalaris arundinacea from Lithuania (five river basins), other Baltic countries, Luxembourg, and the Russian Far East. Map source (https://vemaps.com/, accessed on 1 August 2023, https://www.freeworldmaps.net/, accessed on 1 August 2023).
Genes 15 00734 g010
Figure 11. Collection sites of ornamental cultivars (genotypes) of Phalaris arundinacea, P. a. var. picta in Lithuania. Map source (https://vemaps.com/, accessed on 15 May 2023, https://www.freeworldmaps.net/, accessed on 15 May 2023).
Genes 15 00734 g011
Table 1. SSR markers used for analysis of populations of Phalaris arundinacea, the number of alleles generated by each microsatellite primer pair, and allele size range.
PrimerNumber of AllelesRange of Allele Size (bp)
csm045990–106
csm0493144–160
csm0715126–160
csm0745115–151
csm07511133–161
csm090497–105
csm1015113–149
csm1044104–110
csm10613131–163
csm1115107–138
csm1225121–149
phi07110126–154
umc218510104–155
umc27796121–147
Total95
Table 2. Microsatellite loci-based genetic diversity of Phalaris arundinacea populations of the river basins of Lithuania, other Baltic States, Luxembourg, and Russian Far East: % P (percentage of polymorphic DNA loci), I—Shannon’s information index, and h—index of Nei’s gene diversity.
Populations% P Ih
Mean ± SEMean ± SE
Europe30.00.166±0.0270.112±0.018
Russian Far East25.00.139±0.0250.093±0.017
Baltic countries30.10.169±0.0270.114±0.019
Lithuanian29.50.166±0.0270.112±0.018
Nemunas basin (LT)29.50.166±0.0270.122±0.019
Seaside river basin (LT)32.20.176±0.0270.117±0.018
Lielupė basin (LT-LV)28.60.163±0.0270.110±0.019
Venta basin (LV)33.00.199±0.0290.135±0.020
Bartuva (LT)22.90.130±0.0250.088±0.018
Peipus (EE)33.50.182±0.0270.121±0.018
Rein (LU)33.00.182±0.0280.122±0.019
Average29.90.168±0.0040.113±0.003
Table 3. Microsatellite loci-based hierarchical analysis of molecular variance (AMOVA): among populations from the Nemunas and other Lithuanian river basins, among populations within basins, and within populations of Phalaris arundinacea.
SourcedfSSEst. Var.%Φ
1.
Among groups of populations of Nemunas and Lielupė basins 1490.978ΦCT = 0.083 ***
Among populations within groups314291.5613ΦSC = 0.145 ***
Within populations666059.1678ΦST = 0.216 ***
Total98108211.69100
2.
Among groups of populations of Nemunas and Seaside basins 1351.039ΦCT = 0.088 ***
Among populations withing groups273601.3311ΦSC = 0.125 ***
Within populations585429.3580ΦST = 0.201 ***
Total8693711.70100
3.
Among groups of populations of Nemunas and Venta basin1250.706ΦCT = 0.061 ***
Among populations within groups263481.3212ΦSC = 0.123 ***
Within populations565279.4282ΦST = 0.176 ***
Total8390011.44100
4.
Among groups of populations of Nemunas and Bartuva basins1281.3511ΦCT = 0.113 ***
Among populations within groups253361.4512ΦSC = 0.138 ***
Within populations544909.0776ΦST = 0.236 ***
Total8085411.87100
5.
Among groups of populations of different Baltic States river basins (Nemunas, Seaside rivers, Lielupė, Bartuva, Venta, Dauguva, Vorstjarv, Peipus, Pernu)81850.797ΦCT = 0.068 ***
Among populations within groups385231.4612ΦSC = 0.134 ***
Within populations948849.4081ΦST = 0.193 ***
Total140159211.65100
df—degrees of freedom; SS—sum of squares; Est. Var.—estimated variability; %—percentage of variation; Φ—pairwise population genetic distances: proportion of variance among the river basins (ΦST), among populations (ΦSC) and within populations (ΦCT), *** p ≤ 0.001; Lielupė and Venta river basin populations had one population from Latvia.
Table 4. Microsatellite loci-based hierarchical analysis of molecular variance (AMOVA) of Lithuanian populations of Phalaris arundinacea: within populations, among populations, and among various groups of populations depending on habitat features.
SourcedfSSMSEst. Var.%Φ
1.
Among groups of populations beside different land cover types 24321.70.1972ΦCT = 0.017 ***
Among populations 3755014.91.88217ΦSC = 0.169 ***
Within populations807389.29.22582ΦST = 0.184 ***
Total1191332 11.304100
2.
Among groups of populations beside different river state35417.80.1061ΦCT = 0.009 *
Among populations 3654015.01.92517ΦSC = 0.173 ***
Within populations807389.29.22582ΦST = 0.180 ***
Total1191332 11.256100
3.
Among groups of populations from different areas based on N concentrations within 1991–199624522.30.1972ΦCT = 0.017 ***
Among populations 3754914.81.87017ΦSC = 0.169 ***
Within populations807389.29.22582ΦST = 0.183 ***
Total1191332 11.192100
4.
Among groups of populations beside different size rivers34715.60.0140ΦCT = 0.001 NS
Among populations 3654715.21.98918ΦSC = 0.177 ***
Within populations807389.29.22582ΦST = 0.178 ***
Total1191332 11.228100
5.
Among groups of populations beside different riverbed origins11312.50.0000ΦCT = −0.006 NS
Among populations 3858115.32.02218ΦSC = 0.180 ***
Within populations807389.29.22582ΦST = 0.175 ***
Total1191332 11.247100
df—degrees of freedom; SS—sum of squares; MS—mean squares; Est. Var.—estimated variability; %—percentage of variation; Φ—pairwise population genetic distances: proportion of variance among the river basins (ΦST), among populations (ΦSC) and within populations (ΦCT). 1. Land cover types: (ART)—artificial surfaces, (AGR)—agricultural areas, (FOR)—forest and semi-natural areas; 2. River state: (H)—high, (G)—good, (MO)—moderate, (P)—poor, (B)—bad; 3. Geographic area based on N concentrations: 1—North-West of Lithuania, 2—central Lithuania, 3—South-East of Lithuania; 4. River size: small (S, <100 km2), medium (M, 100–1000 km2), large (L, 1000–10,000 km2), and extra-large (XL, >10,000 km2); 5. Riverbed origin: (N)—natural, (R)—regulated. * p ≤ 0.05, *** p ≤ 0.001; NS—statistically non-significant.
Table 5. Microsatellite loci-based hierarchic AMOVA (analysis of molecular variance) of Eurasian populations of Phalaris arundinacea between the European and Asian continents, and between Europe and the Baltic region, in four groups based on distances apart (>1000 km, >7000 km, >8000 km transects) among groups of populations, among populations, and within populations.
SourcedfSSEst. Var.%Φ
1. >8000 km transect
Among groups of populations of Europe and Asia continents (49 + 2)1593.7725ΦCT = 0.247 ***
Among populations within Europe and Asia population groups497692.1014ΦSC = 0.183 ***
Within populations1029579.3862ΦST = 0.385 ***
Total152178415.25100
2. >8000 km transect
Among groups of populations of Luxembourg and Russian Far East (2 + 2)1393.5823ΦCT = 0.230 *
Among populations within LU and Russian Far East population groups2362.9219ΦSC = 0.243 *
Within populations8739.0858ΦST = 0.417 ***
Total1114815.58100
3. >7000 km transect
Among groups of populations of Nemunas and Russian Far East (25 + 2) 1664.6630ΦCT = 0.303 ***
Among populations within Nemunas and Far East population groups253481.6010ΦSC = 0.149 ***
Within populations544939.1259ΦST = 0.407 ***
Total8090615.38100
4. >1000 km transect
Among groups of populations of Baltic region and Luxembourg (47 + 2) 1250.817ΦCT = 0.066 *
Among populations within Baltic countries and LU population groups477191.9516ΦSC = 0.171 ***
Within populations989259.4477ΦST = 0.226 ***
Total146166912.20100
df—degrees of freedom; SS—sum of squares; Est. Var.—estimated variability; %—percentage of variation; Φ—pairwise population genetic distances: proportion of variance among regions (ΦST), among populations (ΦSC) and within populations (ΦCT), * p ≤ 0.05, *** p ≤ 0.001.
Table 6. Microsatellite loci-based molecular variance of Lithuanian ornamental individual genotypes grown and naturally growing individuals of Phalaris arundinacea.
SourcedfSSEst. Var.%Φ
Among groups of grown and naturally growing individuals1349348.6310.306 ***
Within populations163190211.769
Total1642251 100
df—degrees of freedom; SS—sum of squares; Est. Var.—estimated variability; %—percentage of variation; Φ—pairwise population genetic distances, *** p ≤ 0.001.
Disclaimer/Publisher’s Note: The statements, opinions and data contained in all publications are solely those of the individual author(s) and contributor(s) and not of MDPI and/or the editor(s). MDPI and/or the editor(s) disclaim responsibility for any injury to people or property resulting from any ideas, methods, instructions or products referred to in the content.

