Article

Genome-Wide Identification of the Whirly Gene Family and Its Potential Function in Low Phosphate Stress in Soybean (Glycine max)

1
Collaborative Innovation Center of Henan Grain Crops, College of Agronomy, Henan Agricultural University, Zhengzhou 450046, China
2
College of Information and Management Science, Henan Agricultural University, Zhengzhou 450046, China
*
Author to whom correspondence should be addressed.
Genes 2024, 15(7), 833; https://doi.org/10.3390/genes15070833
Submission received: 1 May 2024 / Revised: 21 June 2024 / Accepted: 21 June 2024 / Published: 25 June 2024
(This article belongs to the Section Plant Genetics and Genomics)

Abstract

:
The Whirly (WHY) gene family, functioning as transcription factors, plays an essential role in the regulation of plant metabolic responses, which has been demonstrated across multiple species. However, the WHY gene family and its functions in soybean remains unclear. In this paper, we conducted genome-wide screening and identification to characterize the WHY gene family. Seven WHY members were identified and randomly distributed across six chromosomes. The phylogenetic evolutionary tree of WHY genes in soybean and other species was divided into five clades. An in-depth analysis revealed that segmental duplications significantly contributed to the expansion of GmWHYs, and the GmWHY gene members may have experienced evolutionary pressure for purifying selection in soybeans. The analysis of promoter Cis-elements in GmWHYs suggested their potential significance in addressing diverse stress conditions. The expression patterns of GmWHYs exhibited tissue-specific variations throughout the different stages of soybean development. Additionally, six GmWHY genes exhibited different responses to low phosphate stress. These findings will provide a theoretical basis and valuable reference for the future exploration of WHY gene function.

1. Introduction

Whirlies (WHYs) are a group of plant-specific proteins that can be found in various organisms and are mainly present in organelles and nuclei [1]. WHY proteins are a type of DNA/RNA-binding protein that can be found in many areas of the plant cell and play crucial roles in plant nuclei and organelles [2]. They exhibit a remarkably conserved WHY DNA-binding domain and possess a shared KGKAAL motif within this domain that enhances their affinity for single-stranded DNA [3]. WHY-like proteins without the KGKAAL motif can also be observed in green algae species, like Ostreococcus tauri [4]. While the presence of a single WHY-like protein is observed in algae, higher plant species exhibit a minimum of two WHY proteins. Both possess a peptide that guides them to either mitochondria, plastids, or both organelles [5].
In plants, WHY1 was initially recognized as the subunit of a 24 kDa protein that binds to the promoter region of the PR-10a gene in potato [6]. Crystal analysis results showed that WHY1 consists of a spiral structure formed by the interaction of four p24 molecules, which are connected through a motif characterized by a helix–loop–helix pattern [7]. A comparative analysis of WHY proteins from potato and Arabidopsis thaliana demonstrated the existence of a conserved arrangement of distinct amino acids, which serves as a foundation for the non-sequence-specific binding of single-stranded DNA [8]. There are two types of WHY proteins in most higher plants, but A. thaliana and other Brassicaceae family members exhibit three distinct WHIRLIES. Among these, WHY1 is specifically directed towards chloroplasts, while WHY2 targets mitochondria and WHY3 demonstrates a dual targeting ability for both organelles [3,5].
The role of WHYs is essential in the control of gene expression as they act as transcription factors [9]. They can bind to specific DNA sequences and exert regulatory control over the activation or suppression of target genes. This regulatory function enables plants to modulate their patterns of gene expression in response to various environmental stimuli, including light, temperature fluctuations, and stress signals [3,10]. In recent decades, WHYs have been studied and their functions have been found to be diverse and essential for the growth, development, and survival [9,11,12]. Leaf variegation was found in the progeny of a why1/why3 double knock out mutant, indicating interference in chloroplast development in A. thaliana [13]. In maize, ZmWHY1 transposon mutants may have ivory or albino leaves due to the lack of plastid ribosomes, ultimately leading to their demise once they reach the stage of developing three or four leaves [12]. The hybrid between Zmwhy1 and Zmemb16 showed impaired embryonic development and albino seedlings [14]. A barley variety with reduced levels of WHY1 exhibited a slower rate of ribosome formation and chloroplast maturation [15].
WHYs are not only involved in chloroplast development, but also in the regulation of organ senescence. The why1 mutant exhibited premature aging characteristics in A. thaliana. AtWHY1, an upstream modulator of the senescence-inducing transcription factor WRKY53, has the ability to bind to the WRKY53 promoter, inhibit the expression of WRKY53, and postpone leaf senescence [16]. Having received growing interest in recent years, the involvement of WHY proteins that are specific to plants has been increasingly recognized in both developmental processes and the enhancement of stress tolerance. However, there are few reports about the systematic studies and function of WHY proteins in soybeans.
Soybean (Glycine max), as a crucial economic and oil crop, holds immense significance in various aspects of human life, which is not only be used for direct consumption but also serves as a fundamental protein source for both humans and animals [17,18]. However, the growth and development process of soybeans can be greatly affected by various abiotic stresses, leading to a significant impact on their overall yield. These abiotic stresses include salinity and phosphate (Pi) deficiency, etc. [19,20]. Therefore, it is essential to systematically identify and examine the Whirly gene family to understand and explore its biological functions in soybean.
In this research, the soybean Whirly gene family (GmWHYs) was identified, and a bioinformatics analysis as well as expression analysis were conducted to gain systematic insights into their composition, classification, and expression characteristics. Subsequently, we investigated the alterations of GmWHY member expression levels under low Pi stress. Our findings could provide a foundation for further understanding the biological functions of GmWHYs in soybean’s reaction to low Pi stress.

2. Materials and Methods

2.1. Identification of Putative GmWHY Genes in Soybean

The WHY gene sequences in A. thaliana were obtained from the TAIR database (https://www.arabidopsis.org/ (accessed on 20 December 2023)) and utilized for conducting a basic local alignment search (BLAST) within the soybean genome database (https://phytozome-next.jgi.doe.gov/info/Gmax_Wm82_a2_v1 (accessed on 20 December 2023)). The HMM profiles of the Whirly family (PF08536) was acquired from the Pfam database, accessible at http://pfam.xfam.org/ (accessed on 20 December 2023). The hmmSearch tools 3.0 provided by the HMMER server were utilized in this study [21] under default parameters to identify soybean WHY proteins. All potential WHY protein sequences underwent additional analysis using two online tools, namely the conserved domain database (CDD) available at https://www.ncbi.nlm.nih.gov/Structure/cdd/wrpsb.cgi (accessed on 20 December 2023) and the Simple Modular Architecture Research Tool (SMART) accessible via http://smart.embl-heidelberg.de (accessed on 20 December 2023). The soybean WHY proteins’ physical and chemical characteristics were determined by employing the ProtParam tool available on the ExPASY Bioinformatics Resource Portal (https://web.expasy.org/protparam/, accessed on 25 December 2023) [22]. The spatial distribution of WHY genes on the soybean chromosomes and the organization of WHY genes were visualized using TBtools (version 2.003) [23]. The subcellular localization of GmWHY proteins was predicted using the online tool CellPLoc 2.0, available at http://www.csbio.sjtu.edu.cn/bioinf/Cell-PLoc-2/ (accessed on 25 December 2023) [24].

2.2. Analysis of the Genomic Position, Arrangement, and Distribution of Conserved Domains in GmWHYs

The exon/intron location information of GmWHY genes was obtained from the annotation file of the soybean genome (version Gmax_Wm82_a2_v1). Protein domains and conserved motifs analysis were conducted using NCBI [25], MEME [26], and the websites as used in Krupinska et al. [1]. The TBtools software (version 2.003) [23] was utilized to generate graphical representations of chromosomal location, structure, conserved domains, and motifs. I-TASSER [27] was employed for predicting the protein structures of GmWHYs, which were then visualized with iCn3D (https://structure.ncbi.nlm.nih.gov/Structure/icn3d/ (accessed on 29 December 2023)).

2.3. Phylogenetic Investigations and Categorizations of the GmWHY Proteins

The muscle method of the MEGA_X_10.1.7 program with the default settings was used to perform multiple alignments of WHY protein sequences from Arabidopsis and soybean. A neighbor-joining (NJ) phylogenetic tree was constructed using MEGA_X_10.1.7 with 1000 bootstrap replicates and depicted by iTOL (https://itol.embl.de/ (accessed on 27 January 2024)). To classify the identified GmWHY proteins, we referred to records of AtWHY subfamily members in the TAIR database (https://www.arabidopsis.org/ (accessed on 27 January 2024)) and grouped them accordingly into different subfamilies.

2.4. Analysis of cis-Regulatory Elements in GmWHYs for Promoter Identification

The promoter regions of each GmWHY gene were obtained by extracting the genome sequence located 2 kb upstream. The cis-regulatory elements within these promoters were analyzed using PlantCARE (http://bioinformatics.psb.ugent.be/webtools/plantcare/html/, accessed on 30 December 2023) [28] and visualized using the TBtools software (version 2.003) [23].

2.5. Expression Analysis of GmWHYs in Tissues and under Low Phosphate Stress

The expression levels of the GmWHY genes in different tissues were obtained from the dataset published by Severin et al. This dataset provided comprehensive gene expression data for a wide range of fourteen tissues, including nodule, root, leaf, flower, pod, and pod shell at 10 and 14 DAFs (days after flowering), as well as seed at 10, 14, 21, 25, 28, 35, and 42 DAFs throughout the growth cycle of soybean [29]. The tissue expression heatmap was generated using the TBtools software (version 2.003) [23].
For the low Pi stress experiment, we followed the established procedure [30]. Williams 82 plants were cultivated in a controlled environment chamber with artificial climate conditions (28–33 °C/20–25 °C day/night temperature and 14 h light/10 h dark photoperiod). We used a half-strength Hoagland solution [2.5 mM Ca(NO3)2, 2.5 mM KNO3, 1.0 mM MgSO4, 0.5 mM KH2PO4, 10 μM EDTA Na2, 10 μM FeSO4, 23 μM H3BO3, 4.5 μM MnCl2, 0.15 μM CuSO4, 0.4 μM ZnSO4, and 0.05 μM Na2MoO4] as the normal Pi (NP) nutrient solution, and the low Pi (LP) nutrient solution was the same as the NP nutrient solution but with only 0.005 mM KH2PO4; the lack of KH2PO4 was replaced by an equal concentration of KCl. After hydroponic cultivation for a period of fifteen days under these conditions, leaf and root samples were collected from each plant replicate (three biological replicates in total). All samples were quick-frozen with liquid nitrogen and then stored at −80 °C for RNA isolation.

2.6. RNA Isolation and Reverse Transcription Quantitative PCR (RT-qPCR) Analysis

The SPARKeasy Plant RNA Extract Kit (SparkJade, Qingdao, China) was used to extract RNA according to the provided instructions. Subsequently, 1 µg RNA was reverse-transcribed using a SPARKscript II RT Plus Kit (With gDNA Eraser) (SparkJade, Qingdao, China). The expression levels of GmWHY1GmWHY7 were determined through RT-qPCR with Tubulin (GenBank accession number: AY907703) serving as a quantitative control. The specific primers can be found in Table S1. RT-qPCR analysis was conducted using 2 × SYBR Green qPCR Mix kit (SparkJade, Qingdao, China) on the CFX96 Touch system (Bio-Rad Laboratories, Hercules, CA, USA). The relative expression was calculated following the established methods [31].

2.7. Haplotype Analysis of WHYs

We conducted an in-depth investigation of the genomic region spanning the promoter and coding regions of seven WHY genes among 559 soybean accessions, which included 121 wild, 207 landrace, and 231 cultivated soybean accessions; their sequencing data and markers were obtained from Lu et al. [32]. We identified seven, five, fifteen, six, nine, five, and nineteen SNPs in GmWHY1 to GmWHY7. The haplotypes of seven genes were analyzed with the Haploview4.1 software (https://sourceforge.net/projects/haploview/files/haploview-source/4.1/ (accessed on 29 February 2024)).

3. Results

3.1. Identification of WHY Gene Family in Soybean

To identify the WHY gene, we conducted a Hidden Markov Model (HMM) search on the soybean Wm82.a2.v1 genome using the conserved domain WHY (PF08536). A total of seven WHY genes were identified in soybean. Based on their chromosomal locations and names, these seven GmWHY genes were named GmWHY1~GmWHY7 (Table S2). The GmWHY family members were further characterized, encompassing the examination of the length of the coding DNA sequence (CDS), size of protein, molecular weight (MW) of protein, isoelectric point (pI), and anticipation of the subcellular localization. The lengths of the CDS for the GmWHY genes were between 381 bp and 810 bp, and GmWHY2 and GmWHY4 contained only one CDS, but GmWHY1, GmWHY3, GmWHY5, GmWHY6, and GmWHY7 contained two, five, four, three, and two CDSs, respectively (Table S3). Most of the GmWHYs had a similar polypeptide, varying from 127 (GmWHY3) to 270 (GmWHY5) amino acid residues, corresponding to an MW between 14.61 kDa (GmWHY3) and 29.95 kDa (GmWHY5). The putative theoretical pI varied from 5.54 (GmWHY3) to 9.71 (GmWHY2). The online subcellular localization prediction showed that these GmWHYs were mainly distributed on the cell membrane, chloroplast, cytoplasm, nucleus, cell wall, and vacuole. All the data suggest that the GmWHY genes exhibit significant variability and fulfill distinct roles within various cellular compartments in soybean.

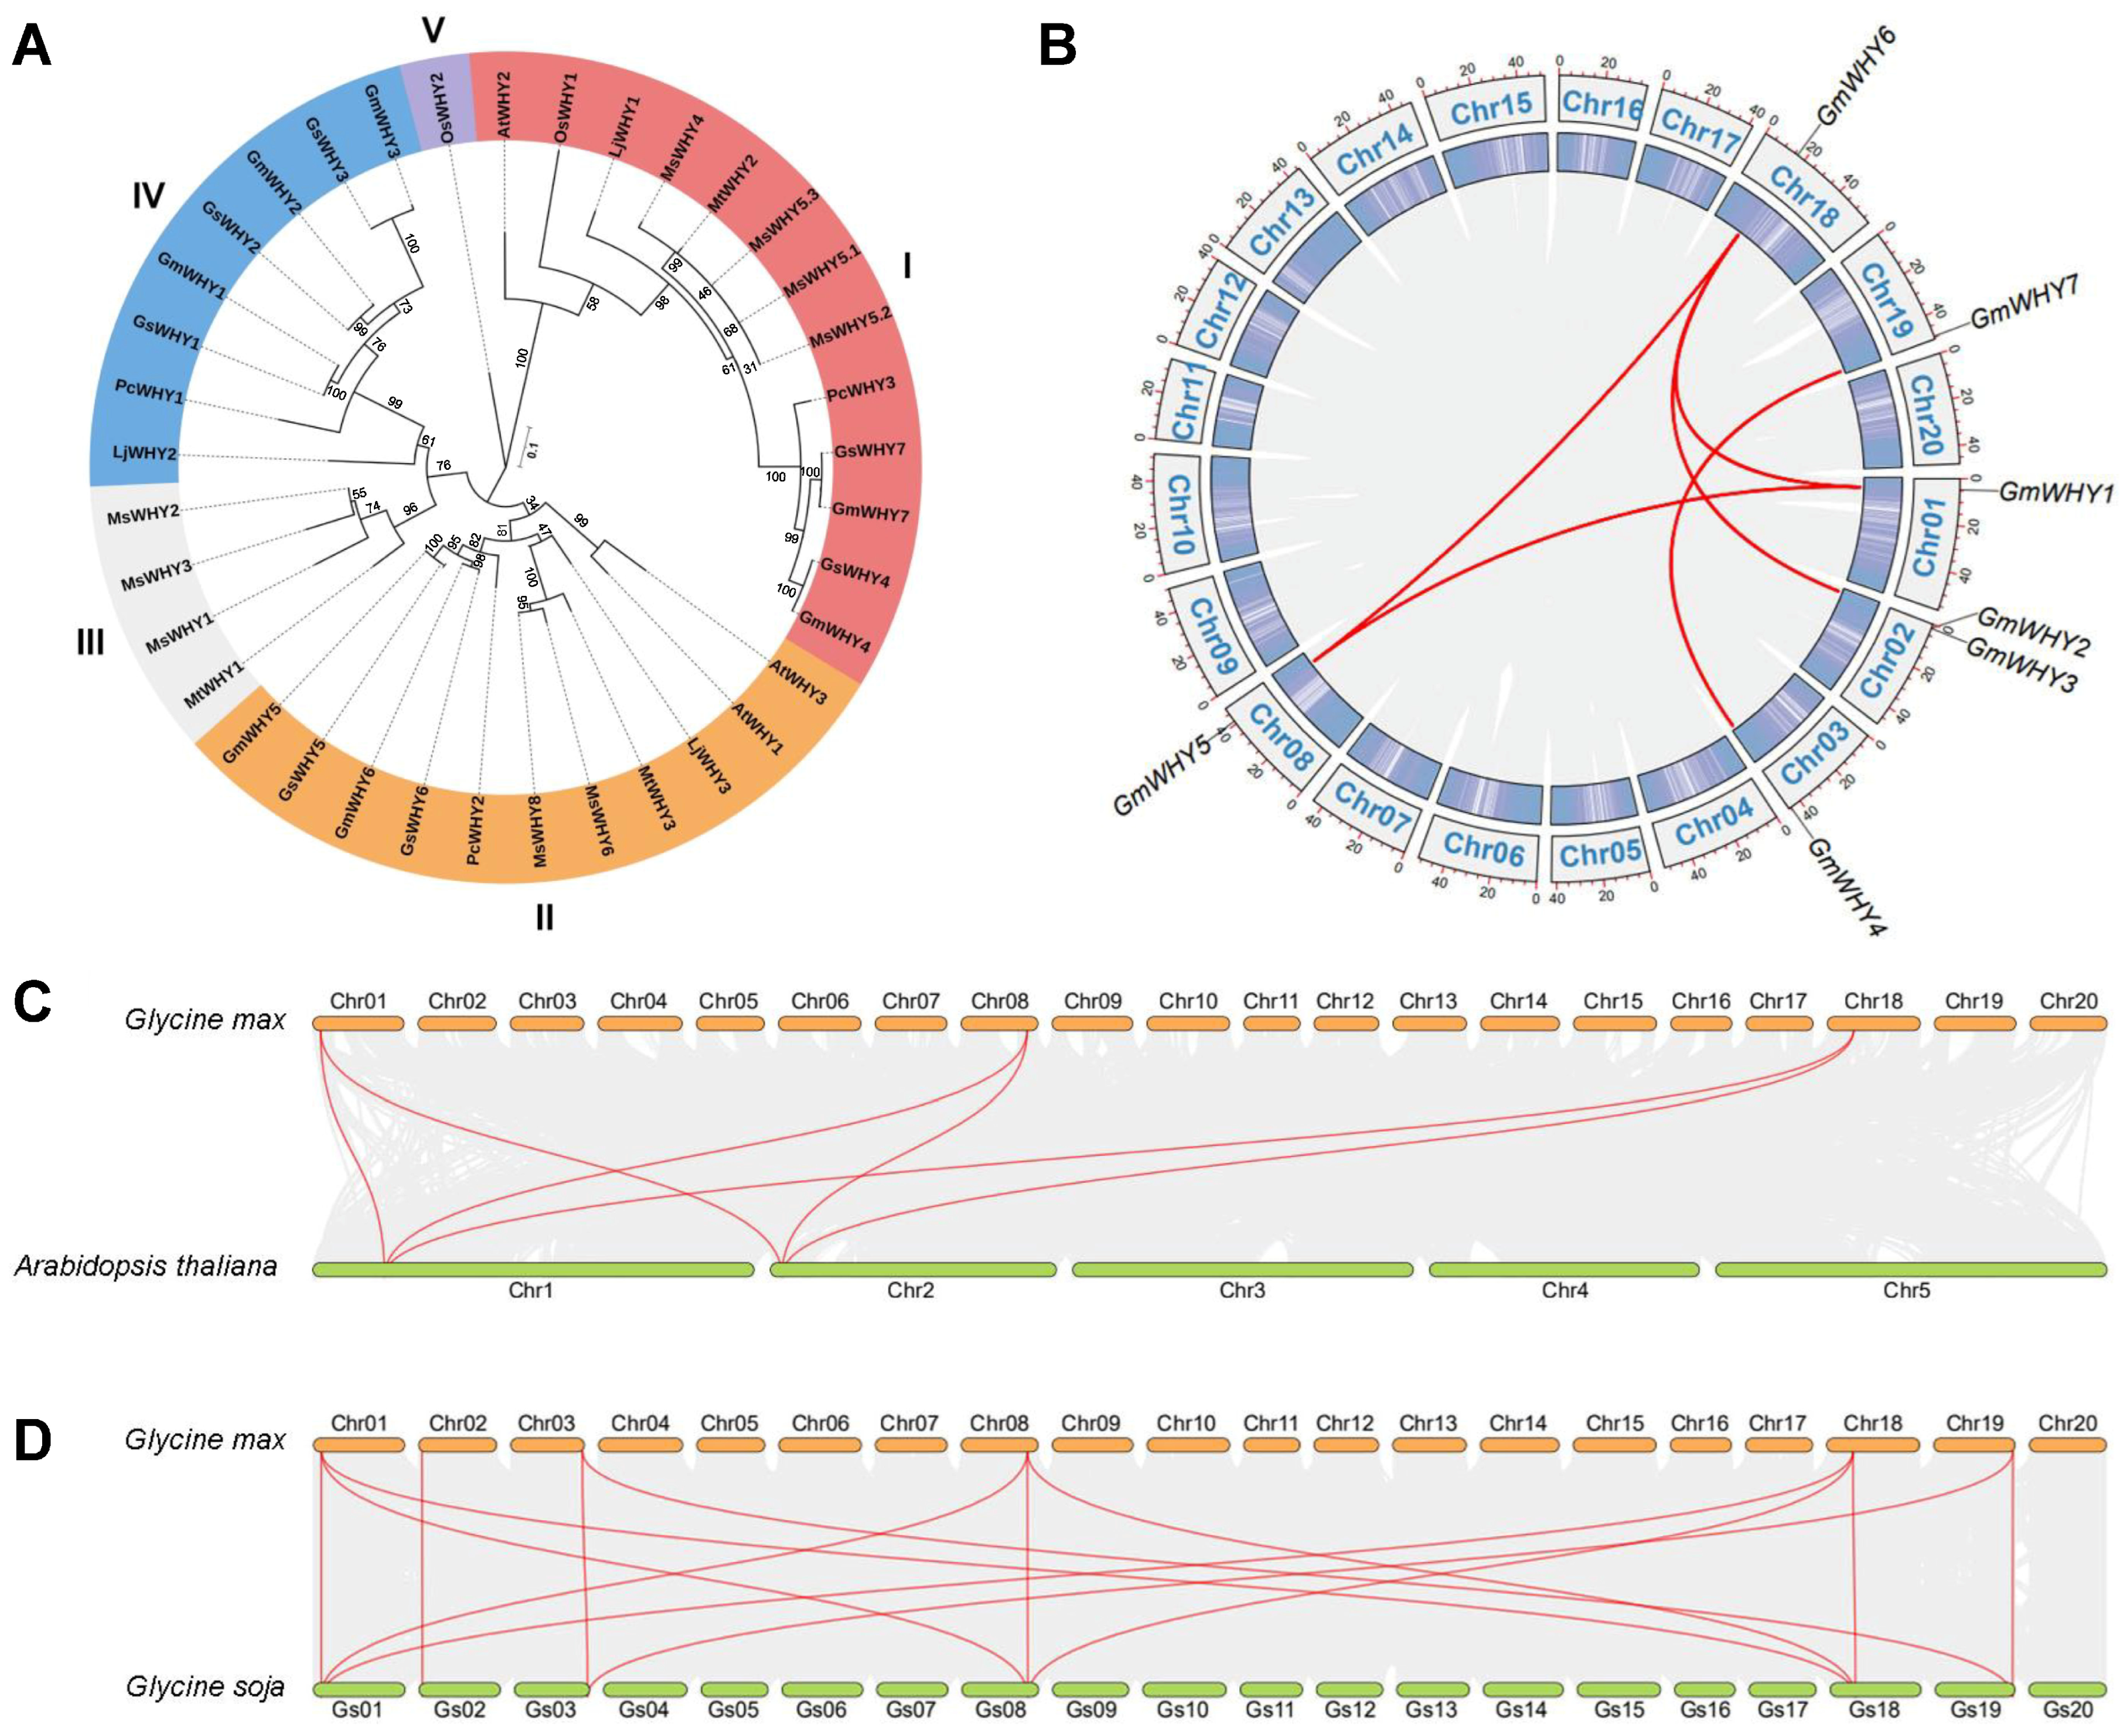
3.2. Phylogenetic Analyses of GmWHYs

The WHY gene family contained seven members in soybean, seven members in Glycine soja, three members in Phaseolus coccineus, ten members in Medicago sativa, three members in Medicago truncatula, three members in A. thaliana, three members in Lotus japonicas, and two members in Oryza sativa (Table S4). In order to evaluate the evolutionary relationships among monocotyledonous and dicotyledonous plants, we selected the WHY amino acid sequences of the above eight plants for phylogenetic analysis. As shown in Figure 1A, these proteins were divided into five clades. Among these subfamilies, clade Ⅰ exhibited the highest membership count with a total of thirteen members, while the clade Ⅴ had the fewest, with one member. Clade Ⅳ was found exclusively in dicotyledonous plants among the seven species; clades Ⅰ, Ⅱ, and Ⅲ were shared by both monocotyledonous and dicotyledonous plants; clade Ⅴ was solely present in O. sativa. Among the seven GmWHYs, two, two, and three GmWHYs were clustered into clades Ⅰ, Ⅱ, and Ⅳ, respectively. This result suggests that WHY genes in monocotyledonous plants and dicotyledonous plants have both commonalities and characteristics, and the WHY gene families of monocotyledonous plants and dicotyledonous plants are ongoing evolutionary process.

3.3. Chromosome Localization and Collinear Relationship Analysis of GmWHY Genes

The seven GmWHY genes exhibited uneven distribution across all 20 chromosomes (Figure 1B). Chromosomes 1, 3, 8, 18, and 19 harbored GmWHY1, GmWHY4, GmWHY5, GmWHY6, and GmWHY7, respectively; chromosome 2 harbored GmWHY2 and GmWHY3. The distribution among the gene subfamilies is relatively scattered, indicating a complex evolutionary history, and different genes may have undergone distinct evolutionary trajectories.
To explore the factors responsible for the increase in GmWHY gene members, an analysis of collinearity was conducted on the soybean genome. Our investigation into gene family duplication revealed the presence of five pairs of duplicated GmWHY genes within the soybean genome (Figure 1B). The GmWHY genes that were duplicated all belonged to segmental duplication events (Table S5). In addition, a comprehensive analysis was conducted on the WHYs in soybean and compared to those found in A. thaliana and G. soja. A total of 20 gene pairs that were orthologous were identified between soybean and the two other species (Figure 1C,D; Tables S6 and S7). The highest number of orthologous WHY gene pairs (including 14 pairs) was observed between soybean and G. soja, followed by 6 orthologous WHY gene pairs between soybean and A. thaliana.
Subsequently, we conducted estimations on the Ka, Ks, and Ka/Ks values of the WHY gene pairs (Tables S6 and S7), revealing that the most Ka/Ks ratios of the WHY homologous pairs were below one in A. thaliana and soybean, as well as in soybean and wild soybean (G. soja). These findings suggest that GmWHYs may have undergone significant purifying selective pressures during evolution, particularly between soybean and Arabidopsis as well as wild soybean and soybean, which likely played a crucial role in the survival and adaptation of soybean.

3.4. The Structure, Conserved Domain, and Motif Analyses of the GmWHYs

To understand the structure of GmWHYs, members of GmWHY were acquired through an exploration of genomic DNA sequences from soybeans. GmWHY contained three or eight exons, with most of them having more than six exons (Figure 2A, Table S2). All GmWHY proteins contained the WHY domain, and ten conserved motifs (motifs 1–10) were analyzed in detail using the MEME online website (Figure 2A and Figure S1; Table S8). Additionally, all seven GmWHY protein contained the WHIRLY domain, GmWHY5/6 contained the DNA-binding motif (DBM, KGKAAL), GmWHY4/7 contained the cysteine domain (C), GmWHY2/5/6 contained the putative nuclear localization motif (pNLS), GmWHY4/7 contained the putative copper-binding motif (pCBM), and GmWHY1 to GmWHY5 and GmWHY7 contained the putative transactivation domain (pAD) (Table S9, Figure S1). Generally, the individual branches of the GmWHY gene exhibited similar structures in terms of genes, conserved domains, and motifs, but the different number of domains and motifs resulted in differently predicted protein structures (Figure 2B). These findings underscore its significance in biological processes across various organisms.

3.5. Analysis of cis-Regulatory Elements in GmWHYs

To gain in-depth insights into the attributes of the GmWHY gene family, we performed an extensive investigation by acquiring and visually illustrating the 2000 bp sequences upstream of the start codon (ATG) for all GmWHYs in order to detect their cis-regulatory elements. Nineteen elements were identified in the promoter regions of the GmWHY genes (Figure 3, Table S10). These cis-regulatory elements mainly include four categories: elements associated with hormones (such as auxin, gibberellin, abscisic acid, methyl jasmonate, salicylic acid, etc.), elements responsive to light stimuli, elements related to stress responses (low temperature, wounds, oxygen deficit, etc.), and elements related to growth regulation (cell cycle regulation, endosperm expression, circadian control, etc.). For example, AUXIN RESPONSE FACTORs (ARFs) bind to the aux-response elements (AuxREs) in the promoter region of early auxin response genes and activate or repress their transcription, as reviewed by Guilfoyle and Hagen [33]; ARF7 and ARF19 regulate the lateral root formation via the direct activation of the LBD/ASL gene by binding the AuxRE of LBD/ASL in Arabidosis [34]; and LBD-mediated root development has been proved to be involved in the response to Pi deficiency in maize and white lupin [35,36]. These findings highlight the potential importance of GmWHYs in regulating various aspects of soybean growth and development.

3.6. The Genetic Diversity of GmWHY Genes among Soybean Accessions

To understand the diversity of GmWHYs in nature soybean population, we analyzed the genetic variations of GmWHYs in 559 soybean accessions, which including 121 wild soybeans, 207 landraces, and 231 cultivated accessions [33]. The 7, 5, 14, 6, 9, 5, and 19 linked SNPs of GmWHY1 to GmWHY7 were divided into five, three, four, three, five, nine, and five haplotype groups, respectively (Figure 4). GmWHY7 and GmWHY3 contained the most genetic variations, but GmWHY6 contained the most haplotypes. For GmWHY2, GmWHY4, GmWHY5, and GmWHY7, their SNPs were mostly located in exon regions, while for GmWHY1, GmWHY3, and GmWHY6, their SNPs were mostly located in intron regions.

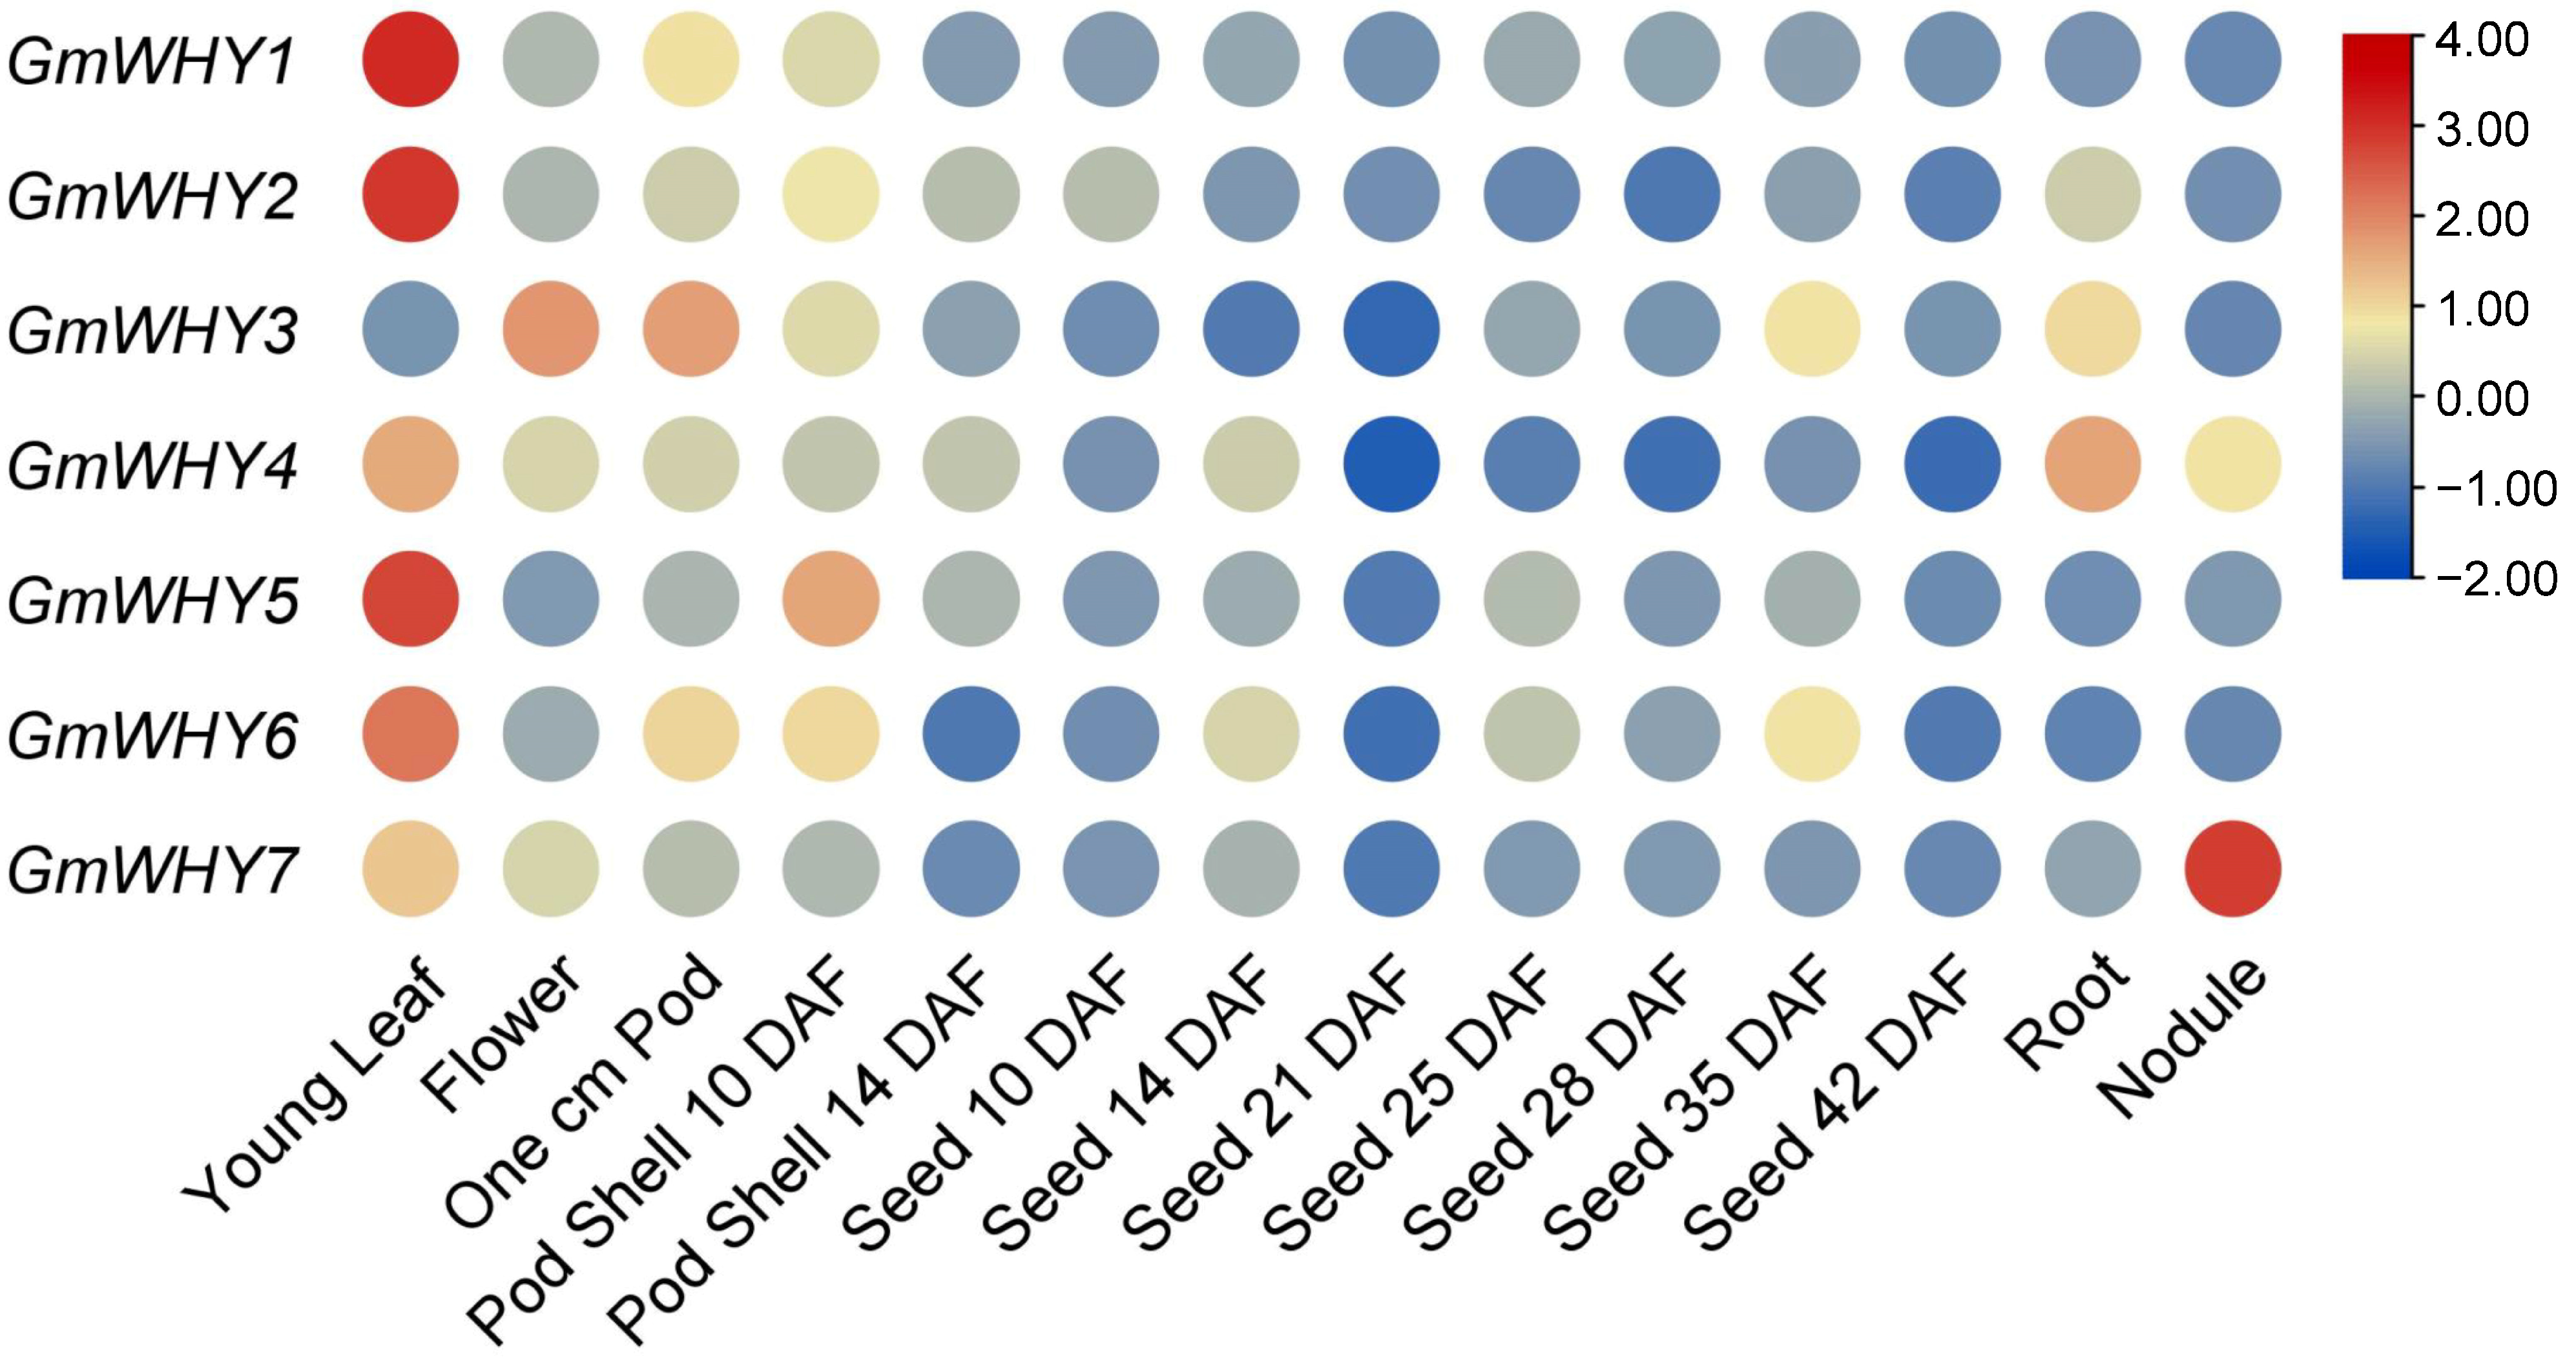
3.7. Tissue Expression Pattern Analysis of GmWHY Genes

To understand the expression of GmWHYs in the different tissues of soybean, we extracted the expression of GmWHYs from the transcriptome data in the soybean genome database and analyzed the expressions in different tissues. The expression levels of GmWHY5 and GmWHY6 were relatively high in various tissues, including leaves, pods, and seeds (Figure 5 and Table S11); other members exhibited high expression specifically in certain tissues, like leaves for GmWHY1 and GmWHY2, flowers and pods for GmWHY3, leaves and roots for GmWHY4, and nodules for GmWHY7. Therefore, the diverse expression patterns observed in GmWHYs imply a non-specific role that is dependent on the tissue.

3.8. Expression Profiles of GmWHY Genes under Low Phosphate Stress

Studies have shown that low Pi stress is one of the important factors limiting the growth and development of soybean [20,37]. In order to investigate whether GmWHY genes are involved in response to low Pi stress, the expression of GmWHY genes was detected in the leaves and roots of Williams 82 soybean accession using RT-qPCR under normal Pi (NP) and low Pi (LP) conditions. Five and four GmWHYs showed significant differences in the leaves and roots between NP and LP concentrations, respectively (Figure 6). In addition, GmWHY1, GmWHY2, and GmWHY6 showed significant differences between NP and LP concentrations both in roots and leaves. The expression of some GmWHYs showed opposite trends after the LP treatment. These findings indicate that the involvement of GmWHY gene family members in addressing low Pi stress may be controlled by diverse molecular mechanisms.

4. Discussion

The WHY protein family is widely distributed in plants, and it serves various crucial functions in plant growth and resilience to environmental pressures [38]. WHY1 plays a crucial role in controlling the expression of genes responsible for encoding various essential proteins required for normal cellular functions and also regulates plant growth and development in response to both biological and environmental stresses [1]. It functions as a nuclear transcription factor, controlling the synthesis of hormones like ABA and SA [1,39]. Several studies have indicated that modifications in the abundance of WHYs in plants are linked to variations in the levels of reactive oxygen species (ROS) within organelles, thereby influencing their resistance towards abiotic stress. Under high light intensity, the RNAi-mediated knockdown of the WHY1 gene can increase the levels of ROS in the chloroplasts of barley plants. The deficiency of WHY1 in barley resulted in a delay in chloroplast development, leading to delayed greening and photosynthesis. This highlights the crucial role of WHY1 in chloroplast biogenesis [15,40]. In addition, the older leaves of why1 mutants also showed higher ROS levels in A. thaliana [41]. The overexpression of WHY2 results in a reduction in ROS levels and an elevation of antioxidative enzyme activities in tobacco plants [42]. In this study, seven WHY genes were identified (Figure 1B) and had different subcellular locations in soybean (Table S2). These studies suggest significant differences in the WHY protein’s function. Understanding the underlying reasons for these variations is crucial in unraveling the complexities of biological systems.
Genes that exhibit distinct exon–intron arrangements and conserved domains may possess a wide range of functionalities [43]. In spite of their removal during post-transcriptional processing, introns have been hypothesized to possess significant significance in the evolution of plants and are regarded as a crucial mechanism for genes to acquire new functionalities [44]. Hence, it is imperative to perform a thorough examination of the exon–intron arrangement, conserved domains, and motifs within gene family members in order to investigate their evolutionary connections. In this study, GmWHYs were observed to contain three to eight exons; the number and arrangement of exons within a gene can have significant effects on its function and expression (Figure 2A). Understanding the structure and organization of GmWHYs is crucial for unraveling their biological roles in plant growth and development.
The outcomes of a phylogenetic tree analysis provide valuable insights into the relationship between organisms and their functional similarities. The clustering pattern observed in the phylogenetic tree reflects the evolutionary history of species, with closely related organisms being grouped together. This close clustering relationship often indicates a higher likelihood of having similar functions [45]. In this study, the phylogenetic tree constructed with WHY proteins specifically was divided into five subfamilies. By the subcellular localization analysis of soybean WHY proteins, GmWHY1, GmWHY2, and GmWHY5 were only located in the cell membrane, GmWHY4 was only located in the cell wall, and the other three GmWHY proteins were located in multiple sites of the cells (Table S2). The potential divergence in the subcellular distribution of WHY proteins suggest a possible variation in their respective functionalities. Additionally, segmental duplication events typically involve the dispersion of homologous genes across distant regions, whereas tandem duplication events occur when these genes are found in close proximity to each other [46]. According to our findings, the expansion of gene families is largely attributed to the process of gene duplication. Furthermore, the Ka/Ks ratios were found to be below 1 (Tables S6 and S7), indicating that the replication of the GmWHY genes is driven by selective purification and implying that the corresponding GmWHY proteins exhibit a relatively conserved characteristic.
Gene expression patterns play a crucial role in unraveling the intricate functions of genes [47]. By examining these patterns, scientists can gain valuable insights into how genes are regulated and their roles in various biological processes. In this study, the expression patterns of GmWHYs varied in different tissues. Most paralogous forms of this gene were found to be expressed in all tissues, while some exhibited tissue-specific expression or low expression (Figure 5). These differences may be attributed to the diverse functionalities or functional redundancy among WHY genes. As a vital nutrient element necessary for the growth and development of plants, Pi plays an indispensable role in acquiring, storing, and utilizing energy, regulating enzyme activities, and forming yields [20,48]. Therefore, we also investigated the expression of WHY family genes under low Pi stress. The expression of two GmWHYs in the leaves and three in the roots had no significant changes in soybean under low Pi stress, while other genes exhibited significant alterations. Among these significant alterative genes, the change tendency of different genes is also different, and the change in the same gene is different in different tissues (Figure 6). Under low Pi conditions, the expression levels of GmWHY3 and GmWHY5 in the leaves were significantly increased, while there was no significant change in the roots; the expression level of GmWHY7 in the roots was significantly increased, while there was no significant change in the leaves under low Pi conditions. Hence, it is hypothesized that the involvement of the GmWHY gene family in managing low Pi stress could be plausible. Therefore, we hypothesized that certain genes belonging to the WHY family are implicated in soybean’s response to low Pi stress, and conducting a comprehensive investigation into their functionalities will play a pivotal role in elucidating the regulatory mechanism underlying plant Pi efficiency.

5. Conclusions

As plant-specific proteins, WHYs have a high impact on plant development and stress resistance. In this study, we discovered seven paralogous forms of a GmWHY gene that distributed on six chromosomes of soybean. We examined the gene structures, evolutionary relationships, promoter cis-acting elements, and expression patterns of WHY genes in soybean to investigate their phylogeny and diversification. The promoter region of GmWHY genes contains cis-regulatory elements associated with hormone regulation, stress response, targeted expression, and cell cycle regulation, among others. The collinearity analysis revealed that a substantial proportion of the GmWHY genes likely originated from segmental duplications, which may experience purifying selection due to their indispensable functions or advantageous roles in soybean evolution. The RT-qPCR analysis showed that six GmWHY genes responded differently to low Pi stress, which has important implications for improving soybean crop productivity. Understanding the role of WHY genes in agronomic traits, such as yield potential, nutrient uptake efficiency, and environmental stress tolerance, is important for the genetic improvement of Pi efficiency and yield of soybeans.

Supplementary Materials

The following supporting information can be downloaded at: https://www.mdpi.com/article/10.3390/genes15070833/s1. Figure S1: The motifs of seven GmWHY proteins. Motifs 1–10 were predicted by MEME [26]; DBM, WHIRLY, C, pNLS, pCBM, and pAD motifs were predicted using websites as reported in Krupinska et al. [27]. Table S1: Primers used in this study for RT-qPCR. Table S2: List of the identified GmWHY genes and their related information in soybean. Table S3: List of the coding sequences of GmWHY genes. Table S4: WHY genes in Arabidopsis thaliana, Oryza sativa, and legume plants. Table S5: Tandemly and segmentally duplicated GmWHY gene pairs. Table S6: One-to-one orthologous relationships between the WHY gene members in Glycine max and Arabidopsis thaliana. Table S7: One-to-one orthologous relationships between the WHY gene members in Glycine max and Arabidopsis thaliana. Table S8: Analyses of the motifs in GmWHYs from the MEME website. Table S9: The motifs in GmWHY proteins. Table S10: Cis-element analyses of the GmWHY gene promoter regions. Table S11: Expression profiles of GmWHY genes in multiple tissues throughout various developmental stages.

Author Contributions

D.H. and Z.L. conceived and designed the research; Z.L., X.Z. (Xuhao Zhai) and L.Z. conducted the data analysis and experiments; H.Z. and H.L. carried out the low Pi stress experiment; Y.Y. and X.Z. (Xingguo Zhang) carried out the RT-qPCR experiment; E.X. and S.C. carried out the structural analysis; Z.L. wrote the manuscript; D.H. and D.Z. revised the manuscript. All authors discussed the results and contributed to the manuscript. All authors have read and agreed to the published version of the manuscript.

Funding

The work was supported in part by the National Natural Science Foundation of China (32072088 and 32272171), Major Science and Technology Project of Henan Province (221100110300), and Henan Province Outstanding Youth Science Fund Project (242300421031).

Institutional Review Board Statement

Not applicable.

Informed Consent Statement

Not applicable.

Data Availability Statement

Publicly available datasets were analyzed in this study. This data can be found here: (https://www.ncbi.nlm.nih.gov/geo/query/acc.cgi?acc=GSE173640, accessed on 25 December 2023)/GEO accession number: GSE173640.

Conflicts of Interest

The authors declare no conflicts of interest.

References

  1. Krupinska, K.; Desel, C.; Frank, S.; Hensel, G. WHIRLIES are multifunctional DNA-binding proteins with impact on plant development and stress resistance. Front. Plant Sci. 2022, 13, 880423. [Google Scholar] [CrossRef]
  2. Ruan, Q.; Wang, Y.; Xu, H.; Wang, B.; Zhu, X.; Wei, B.; Wei, X. Genome-wide identification, phylogenetic, and expression analysis under abiotic stress conditions of Whirly (WHY) gene family in Medicago sativa L. Sci. Rep. 2022, 12, 18676. [Google Scholar] [CrossRef]
  3. Krause, K.; Kilbienski, I.; Mulisch, M.; Rödiger, A.; Schäfer, A.; Krupinska, K. DNA-binding proteins of the Whirly family in Arabidopsis thaliana are targeted to the organelles. FEBS Lett. 2005, 579, 3707–3712. [Google Scholar] [CrossRef] [PubMed]
  4. Krause, K.; Krupinska, K. Nuclear regulators with a second home in organelles. Trends Plant Sci. 2009, 14, 194–199. [Google Scholar] [CrossRef] [PubMed]
  5. Golin, S.; Negroni, Y.L.; Bennewitz, B.; Klosgen, R.B.; Mulisch, M.; La Rocca, N.; Cantele, F.; Vigani, G.; Lo Schiavo, F.; Krupinska, K.; et al. WHIRLY2 plays a key role in mitochondria morphology, dynamics, and functionality in Arabidopsis thaliana. Plant Direct 2020, 4, e00229. [Google Scholar] [CrossRef]
  6. Desveaux, D.; Després, C.; Joyeux, A.; Subramaniam, R.; Brisson, N. PBF-2 is a novel single-stranded DNA binding factor implicated in PR-10a gene activation in potato. Plant Cell 2000, 12, 1477–1489. [Google Scholar] [CrossRef] [PubMed]
  7. Desveaux, D.; Allard, J.; Brisson, N.; Sygusch, J. A new family of plant transcription factors displays a novel ssDNA-binding surface. Nat. Struct. Biol. 2002, 9, 512–517. [Google Scholar] [CrossRef] [PubMed]
  8. Cappadocia, L.; Parent, J.S.; Sygusch, J.; Brisson, N. A family portrait: Structural comparison of the Whirly proteins from Arabidopsis thaliana and Solanum tuberosum. Acta Crystallogr. Sect. F Struct. Biol. Cryst. Commun. 2013, 69, 1207–1211. [Google Scholar] [CrossRef]
  9. Desveaux, D.; Subramaniam, R.; Després, C.; Mess, J.N.; Lévesque, C.; Fobert, P.R.; Dangl, J.L.; Brisson, N. A “Whirly” transcription factor is required for salicylic acid-dependent disease resistance in Arabidopsis. Dev. Cell 2004, 6, 229–240. [Google Scholar] [CrossRef]
  10. Akbudak, M.A.; Filiz, E. Whirly (Why) transcription factors in tomato (Solanum lycopersicum L.): Genome-wide identification and transcriptional profiling under drought and salt stresses. Mol. Biol. Rep. 2019, 46, 4139–4150. [Google Scholar] [CrossRef]
  11. Maréchal, A.; Parent, J.S.; Sabar, M.; Véronneau-Lafortune, F.; Abou-Rached, C.; Brisson, N. Overexpression of mtDNA-associated AtWhy2 compromises mitochondrial function. BMC Plant Biol. 2008, 8, 42. [Google Scholar] [CrossRef] [PubMed]
  12. Prikryl, J.; Watkins, K.P.; Friso, G.; van Wijk, K.J.; Barkan, A. A member of the Whirly family is a multifunctional RNA- and DNA-binding protein that is essential for chloroplast biogenesis. Nucleic Acids Res. 2008, 36, 5152–5165. [Google Scholar] [CrossRef]
  13. Maréchal, A.; Parent, J.S.; Véronneau-Lafortune, F.; Joyeux, A.; Lang, B.F.; Brisson, N. Whirly proteins maintain plastid genome stability in Arabidopsis. Proc. Natl. Acad. Sci. USA 2009, 106, 14693–14698. [Google Scholar] [CrossRef] [PubMed]
  14. Zhang, Y.F.; Hou, M.M.; Tan, B.C. The requirement of WHIRLY1 for embryogenesis is dependent on genetic background in maize. PLoS ONE 2013, 8, e67369. [Google Scholar] [CrossRef] [PubMed]
  15. Krupinska, K.; Braun, S.; Nia, M.S.; Schäfer, A.; Hensel, G.; Bilger, W. The nucleoid-associated protein WHIRLY1 is required for the coordinate assembly of plastid and nucleus-encoded proteins during chloroplast development. Planta 2019, 249, 1337–1347. [Google Scholar] [CrossRef] [PubMed]
  16. Miao, Y.; Jiang, J.; Ren, Y.; Zhao, Z. The single-stranded DNA-binding protein WHIRLY1 represses WRKY53 expression and delays leaf senescence in a developmental stage-dependent manner in Arabidopsis. Plant Physiol. 2013, 163, 746–756. [Google Scholar] [CrossRef] [PubMed]
  17. Fang, C.; Kong, F. Soybean. Curr. Biol. 2022, 32, 902–904. [Google Scholar] [CrossRef] [PubMed]
  18. Yang, Y.; Wang, L.; Che, Z.; Wang, R.; Cui, R.; Xu, H.; Chu, S.; Jiao, Y.; Zhang, H.; Yu, D.; et al. Novel target sites for soybean yield enhancement by photosynthesis. J. Plant Physiol. 2021, 268, 153580. [Google Scholar] [CrossRef]
  19. Feng, C.; Gao, H.; Zhou, Y.; Jing, Y.; Li, S.; Yan, Z.; Xu, K.; Zhou, F.; Zhang, W.; Yang, X.; et al. Unfolding molecular switches for salt stress resilience in soybean: Recent advances and prospects for salt-tolerant smart plant production. Front. Plant Sci. 2023, 14, 1162014. [Google Scholar] [CrossRef]
  20. Yang, Y.; Wang, L.; Zhang, D.; Che, Z.; Wang, Q.; Cui, R.; Zhao, W.; Huang, F.; Zhang, H.; Cheng, H.; et al. Soybean type-B response regulator GmRR1 mediates phosphorus uptake and yield by modifying root architecture. Plant Physiol. 2024, 194, 1527–1544. [Google Scholar] [CrossRef]
  21. Finn, R.; Clements, J.; Eddy, S. HMMER web server: Interactive sequence similarity searching. Nucleic Acids Res. 2011, 39, 29–37. [Google Scholar] [CrossRef] [PubMed]
  22. Duvaud, S.; Gabella, C.; Lisacek, F.; Stockinger, H.; Ioannidis, V.; Durinx, C. Expasy, the Swiss Bioinformatics Resource Portal, as designed by its users. Nucleic Acids Res. 2021, 49, 216–227. [Google Scholar] [CrossRef] [PubMed]
  23. Chen, C.; Chen, H.; Zhang, Y.; Thomas, H.; Frank, M.; He, Y.; Xia, R. TBtools: An integrative toolkit developed for interactive analyses of big biological data. Mol. Plant 2020, 13, 1194–1202. [Google Scholar] [CrossRef]
  24. Chou, K.C.; Shen, H.B. Cell-PLoc 2.0: An improved package of web-servers for predicting subcellular localization of proteins in various organisms. Nat. Protoc. 2008, 3, 153–162. [Google Scholar] [CrossRef] [PubMed]
  25. Yang, M.; Derbyshire, M.K.; Yamashita, R.A.; Marchler-Bauer, A. NCBI’s conserved domain database and tools for protein domain analysis. Curr. Protoc. Bioinform. 2019, 69, e90. [Google Scholar] [CrossRef] [PubMed]
  26. Bailey, T.L.; Johnson, J.; Grant, C.E.; Noble, W.S. The MEME Suite. Nucleic Acids Res. 2015, 43, 39–49. [Google Scholar] [CrossRef] [PubMed]
  27. Yang, J.Y.; Yan, R.X.; Roy, A.; Xu, D.; Poisson, J.; Zhang, Y. The I-TASSER Suite: Protein structure and function prediction. Nat. Methods 2015, 12, 7–8. [Google Scholar] [CrossRef] [PubMed]
  28. Lescot, M.; Déhais, P.; Thijs, G.; Marchal, K.; Moreau, Y.; Van de Peer, Y.; Rouzé, P.; Rombauts, S. PlantCARE, a database of plant cis-acting regulatory elements and a portal to tools for in silico analysis of promoter sequences. Nucleic Acids Res. 2002, 30, 325–327. [Google Scholar] [CrossRef] [PubMed]
  29. Severin, A.J.; Woody, J.L.; Bolon, Y.T.; Joseph, B.; Diers, B.W.; Farmer, A.D.; Muehlbauer, G.J.; Nelson, R.T.; Grant, D.; Specht, J.E. RNA-Seq Atlas of Glycine max: A guide to the soybean transcriptome. BMC Plant Biol. 2010, 10, 160. [Google Scholar] [CrossRef]
  30. Yang, Y.; Zhu, X.; Cui, R.; Wang, R.; Li, H.; Wang, J.; Chen, H.; Zhang, D. NCBI’s Identification of soybean phosphorous efficiency QTLs and genes using chlorophyll fluorescence parameters through GWAS and RNA-seq. Planta 2021, 254, 110. [Google Scholar] [CrossRef]
  31. Livak, K.J.; Schmittgen, T.D. Analysis of relative gene expression data using real-time quantitative PCR and the 2 Δ Δ C T method. Methods 2001, 25, 402–408. [Google Scholar] [CrossRef]
  32. Lu, S.J.; Dong, L.D.; Fang, C.; Liu, S.L.; Kong, L.P.; Cheng, Q.; Chen, L.Y.; Su, T.; Nan, H.Y.; Zhang, D.; et al. Stepwise selection on homeologous PRR genes controlling flowering and maturity during soybean domestication. Nat. Genet. 2020, 52, 428–436. [Google Scholar] [CrossRef] [PubMed]
  33. Guilfoyle, T.J.; Hagen, G. Auxin response factors. Curr. Opin. Plant Biol. 2007, 10, 453–460. [Google Scholar] [CrossRef] [PubMed]
  34. Okushima, Y.; Fukaki, H.; Onoda, M.; Theologis, A.; Tasaka, M. ARF7 and ARF19 regulate lateral root formation via direct activation of LBD/ASL genes in Arabidopsis. Plant Cell 2007, 19, 118–130. [Google Scholar] [CrossRef] [PubMed]
  35. Wu, F.; Yahaya, B.S.; Gong, Y.; He, B.; Gou, J.; He, Y.; Li, J.; Kang, Y.; Xu, J.; Wang, Q.; et al. ZmARF1 positively regulates low phosphorus stress tolerance via modulating lateral root development in maize. PLoS Genet. 2024, 20, e1011135. [Google Scholar] [CrossRef]
  36. Xia, T.; Zhu, X.; Zhan, Y.; Liu, B.; Zhou, X.; Zhang, Q.; Xu, W. The white lupin trehalase gene LaTRE1 regulates cluster root formation and function under phosphorus deficiency. Plant Physiol. 2024, kiae290. [Google Scholar] [CrossRef] [PubMed]
  37. Wang, R.; Liu, X.; Zhu, H.; Yang, Y.; Cui, R.; Fan, Y.; Zhai, X.; Yang, Y.; Zhang, S.; Zhang, J.; et al. Transcription factors GmERF1 and GmWRKY6 synergistically regulate low phosphorus tolerance in soybean. Plant Physiol. 2023, 192, 1099–1114. [Google Scholar] [CrossRef]
  38. Lin, W.; Huang, D.; Li, M.; Ren, Y.; Zheng, X.; Wu, B.; Miao, Y. WHIRLY proteins, multi-layer regulators linking the nucleus and organelles in developmental and stress-induced senescence of plants. Ann. Bot. 2024, mcae092. [Google Scholar] [CrossRef] [PubMed]
  39. Taylor, R.E.; West, C.E.; Foyer, C.H. WHIRLY protein functions in plants. Food Energy Secur. 2022, 12, e379. [Google Scholar] [CrossRef] [PubMed]
  40. Comadira, G.; Rasool, B.; Kaprinska, B.; García, B.M.; Morris, J.; Verrall, S.R.; Bayer, M.; Hedley, P.E.; Hancock, R.D.; Foyer, C.H. WHIRLY1 functions in the control of responses to nitrogen deficiency but not aphid infestation in barley. Plant Physiol. 2015, 168, 1140–1151. [Google Scholar] [CrossRef]
  41. Lin, W.; Huang, D.; Shi, X.; Deng, B.; Ren, Y.; Lin, W.; Miao, Y. H2O2 as a feedback signal on dual-located WHIRLY1 associates with leaf senescence in Arabidopsis. Cells 2019, 8, 1585. [Google Scholar] [CrossRef]
  42. Zhao, S.Y.; Wang, G.D.; Zhao, W.Y.; Zhang, S.; Kong, F.Y.; Dong, X.C.; Meng, Q.W. Overexpression of tomato WHIRLY protein enhances tolerance to drought stress and resistance to Pseudomonas solanacearum in transgenic tobacco. Biol. Plant. 2017, 62, 55–68. [Google Scholar] [CrossRef]
  43. Wang, L.; Zhang, J.; Li, H.; Zhang, G.; Hu, D.; Zhang, D.; Xu, X.; Yang, Y.; Huang, Z. Genome-wide identification of the phytocyanin gene family and its potential function in salt stress in soybean (Glycine max (L.) Merr.). Agronomy 2023, 13, 2484. [Google Scholar] [CrossRef]
  44. Jeffares, D.C.; Penkett, C.J.; Bähler, J. Rapidly regulated genes are intron poor. Trends Genet. 2008, 24, 375–378. [Google Scholar] [CrossRef] [PubMed]
  45. Christiaens, J.F.; Van Mulders, S.E.; Duitama, J.; Brown, C.A.; Ghequire, M.G.; De Meester, L.; Michiels, J.; Wenseleers, T.; Voordeckers, K.; Verstrepen, K.J. Functional divergence of gene duplicates through ectopic recombination. Embo Rep. 2012, 13, 1145–1151. [Google Scholar] [CrossRef]
  46. Hsia, C.C.; McGinnis, W. Evolution of transcription factor function. Curr. Opin. Genet. Dev. 2003, 13, 199–206. [Google Scholar] [CrossRef]
  47. Chang, Y.N.; Zhu, C.; Jiang, J.; Zhang, H.; Zhu, J.K.; Duan, C.G. Epigenetic regulation in plant abiotic stress responses. J. Integr. Plant Biol. 2020, 62, 563–580. [Google Scholar] [CrossRef]
  48. Lambers, H. Phosphorus Acquisition and Utilization in Plants. Annu. Rev. Plant Biol. 2022, 73, 17–42. [Google Scholar] [CrossRef]
Figure 1. Comparison of the WHY gene family. (A) Phylogenetic analysis of the WHY gene family. The phylogenetic tree was constructed for the WHY gene family using 37 WHY genes from various plant species, including A. thaliana (At), O. sativa (Os), M. truncatula (Mt), M. sativa (Ms), L. japonicus (Lj), P. coccineus (Pc), G. max (Gm), and G. soja (Gs). The classification of the WHY gene family into subfamilies was denoted as I, II, III, IV, and V. (B) Positions and synteny of GmWHY genes. The duplicated GmWHY gene pairs were connected by red lines. (C) Synteny patterns of the WHY genes between G. max and A. thaliana. (D) Synteny patterns of the WHY genes between G. max and G. soja. The red lines were used to emphasize the syntenic WHY gene pairs between soybean and other species.
Genes 15 00833 g001
Figure 2. Structure of GmWHYs. (A) The phylogenetic tree, gene structure, domains, and motifs of GmWHYs. Left panel: exons and introns are represented by red color boxes and gray lines, respectively, and the domains are represented by differently colored boxes. Right panel: ten motifs are represented in differently colored boxes and were predicted by MEME [26]. The sizes of exons and introns are proportional to their sequence lengths. (B) Predicted protein structure of GmWHYs. N: and C represent the N-terminus and C-terminus of the protein, respectively.
Genes 15 00833 g002
Figure 3. Cis-elements in the GmWHY gene promoter regions. The arrangement of the cis-regulatory elements within the 2000 bp upstream genetic regions of the seven identified GmWHYs is represented by colored boxes, each indicating a different cis-element.
Genes 15 00833 g003
Figure 4. Haplotypes of GmWHY genes among the natural soybean population. Green, yellow, purple, and blue bars represent 5′UTR, introns, exons, and 3′UTR.
Genes 15 00833 g004
Figure 5. Analysis of GmWHY expression in various soybean tissues. Evaluation of GmWHY expression in different tissues during soybean development using publicly available RNA-seq data. The heatmap depicts log2-normalized RPKM values to represent gene expression levels. DAFs denote days after flowering.
Genes 15 00833 g005
Figure 6. Expression analyses of GmWHYs in the leaves and roots of the cultivar Williams 82 under different Pi treatment levels. Data were normalized to the GmTubulin gene, and columns and error bars represent the means ± standard deviation (SD) of three independent biological replicates. Differences were evaluated using the two-tailed Student’s t-test (*** p < 0.001, ** p < 0.01, * p < 0.05, ns = no differences). LP, low Pi supply (5 μM, Pi); NP, normal Pi supply (500 μM, Pi).
Genes 15 00833 g006
Disclaimer/Publisher’s Note: The statements, opinions and data contained in all publications are solely those of the individual author(s) and contributor(s) and not of MDPI and/or the editor(s). MDPI and/or the editor(s) disclaim responsibility for any injury to people or property resulting from any ideas, methods, instructions or products referred to in the content.

