Objective Assessments of Smoking and Drinking Outperform Clinical Phenotypes in Predicting Variance in Epigenetic Aging


Abstract
:1. Introduction
2. Materials and Methods
2.1. Study Population
2.2. Methylation Analyses
2.3. Statistical Analyses
3. Results
3.1. Correlations
3.2. Multiple Regression Models Predicting PC-GrimAge Acceleration
3.3. Multiple Regression Models Predicting PACE
4. Discussion
Supplementary Materials
Author Contributions
Funding
Institutional Review Board Statement
Informed Consent Statement
Data Availability Statement
Conflicts of Interest
References
- Rodgers, J.L.; Jones, S.I.J.; Bolleddu, S.; Vanthenapalli, L.E.; Rodgers, K.; Karia, S.K.; Panguluri, S.K. Cardiovascular risks associated with gender and aging. J. Cardiovasc. Dev. Dis. 2019, 6, 19. [Google Scholar] [CrossRef] [PubMed]
- Oblak, L.; van der, Z.J.; Higgins-Chen, A.T.; Levine, M.E.; Boks, M.P. A systematic review of biological, social and environmental factors associated with epigenetic clock acceleration. Ageing Res. Rev. 2021, 69, 101348. [Google Scholar] [CrossRef] [PubMed]
- Pellegrini, C.; Pirazzini, C.; Sala, C.; Sambati, L.; Yusipov, I.; Kalyakulina, A.; Ravaioli, F.; Kwiatkowska, K.M.; Durso, D.F.; Ivanchenko, M.; et al. A meta-analysis of brain DNA methylation across sex, age, and alzheimer’s disease points for accelerated epigenetic aging in neurodegeneration. Front. Aging Neurosci. 2021, 13, 639428. [Google Scholar] [CrossRef] [PubMed]
- Kresovich, J.K.; Martinez Lopez, A.M.; Garval, E.L.; Xu, Z.; White, A.J.; Sandler, D.P.; Taylor, J.A. Alcohol consumption and methylation-based measures of biological age. J. Gerontol. Ser. A 2021, 76, 2107–2111. [Google Scholar] [CrossRef] [PubMed]
- Nannini, D.R.; Joyce, B.T.; Zheng, Y.; Gao, T.; Wang, J.; Liu, L.; Jacobs, D.R., Jr.; Schreiner, P.J.; Liu, C.; Dai, Q. Alcohol consumption and epigenetic age acceleration in young adults. Aging 2023, 15, 371. [Google Scholar] [CrossRef] [PubMed]
- Wang, M.; Li, Y.; Lai, M.; Nannini, D.R.; Hou, L.; Joehanes, R.; Huan, T.; Levy, D.; Ma, J.; Liu, C. Alcohol consumption and epigenetic age acceleration across human adulthood. Aging 2023, 15, 10938–10971. [Google Scholar] [CrossRef] [PubMed]
- Rosen, A.D.; Robertson, K.D.; Hlady, R.A.; Muench, C.; Lee, J.; Philibert, R.; Horvath, S.; Kaminsky, Z.A.; Lohoff, F.W. DNA methylation age is accelerated in alcohol dependence. Transl. Psychiatry 2018, 8, 182. [Google Scholar] [CrossRef] [PubMed]
- Gao, X.; Zhang, Y.; Breitling, L.P.; Brenner, H. Relationship of tobacco smoking and smoking-related DNA methylation with epigenetic age acceleration. Oncotarget 2016, 7, 46878–46889. [Google Scholar] [CrossRef]
- Cardenas, A.; Ecker, S.; Fadadu, R.P.; Huen, K.; Orozco, A.; McEwen, L.M.; Engelbrecht, H.-R.; Gladish, N.; Kobor, M.S.; Rosero-Bixby, L. Epigenome-wide association study and epigenetic age acceleration associated with cigarette smoking among costa rican adults. Sci. Rep. 2022, 12, 4277. [Google Scholar] [CrossRef]
- Jatlow, P.; Toll, B.A.; Leary, V.; Krishnan-Sarin, S.; O’Malley, S.S. Comparison of expired carbon monoxide and plasma cotinine as markers of cigarette abstinence. Drug Alcohol. Depend. 2008, 98, 203–209. [Google Scholar] [CrossRef]
- Shipton, D.; Tappin, D.M.; Vadiveloo, T.; Crossley, J.A.; Aitken, D.A.; Chalmers, J. Reliability of self reported smoking status by pregnant women for estimating smoking prevalence: A retrospective, cross sectional study. BMJ 2009, 339, b4347. [Google Scholar] [CrossRef] [PubMed]
- Grüner Nielsen, D.; Andersen, K.; Nielsen, A.S.; Juhl, C.; Mellentin, A. Consistency between self-reported alcohol consumption and biological markers among patients with alcohol use disorder—A systematic review. Neurosci. Biobehav. Rev. 2021, 124, 370–385. [Google Scholar] [CrossRef] [PubMed]
- Wetterling, T.; Dibbelt, L.; Wetterling, G.; Göder, R.; Wurst, F.; Margraf, M.; Junghanns, K. Ethyl glucuronide (etg): Better than breathalyser or self-reports to detect covert short-term relapses into drinking. Alcohol. Alcohol. 2014, 49, 51–54. [Google Scholar] [CrossRef] [PubMed]
- Lei, M.-K.; Gibbons, F.X.; Gerrard, M.; Beach, S.R.H.; Dawes, K.; Philibert, R. Digital methylation assessments of alcohol and cigarette consumption account for common variance in accelerated epigenetic ageing. Epigenetics 2022, 17, 1991–2005. [Google Scholar] [CrossRef] [PubMed]
- Andersen, A.; Milefchik, E.; Papworth, E.; Penaluna, B.; Dawes, K.; Moody, J.; Weeks, G.; Froehlich, E.; deBlois, K.; Long, J.D.; et al. Zscan25 methylation predicts seizures and severe alcohol withdrawal syndrome. Epigenetics 2024, 19, 2298057. [Google Scholar] [CrossRef] [PubMed]
- Dawes, K.; Andersen, A.; Reimer, R.; Mills, J.A.; Hoffman, E.; Long, J.D.; Miller, S.; Philibert, R. The relationship of smoking to cg05575921 methylation in blood and saliva DNA samples from several studies. Sci. Rep. 2021, 11, 21627. [Google Scholar] [CrossRef] [PubMed]
- Fang, F.; Andersen, A.M.; Philibert, R.; Hancock, D.B. Epigenetic biomarkers for smoking cessation. Addict. Neurosci. 2023, 6, 100079. [Google Scholar] [CrossRef]
- Gelernter, J.; Polimanti, R. Genetics of substance use disorders in the era of big data. Nat. Rev. Genet. 2021, 22, 712–729. [Google Scholar] [CrossRef]
- Monick, M.M.; Beach, S.R.; Plume, J.; Sears, R.; Gerrard, M.; Brody, G.H.; Philibert, R.A. Coordinated changes in ahrr methylation in lymphoblasts and pulmonary macrophages from smokers. Am. J. Med. Genet. B Neuropsychiatr. Genet. 2012, 159B, 141–151. [Google Scholar] [CrossRef]
- Miller, S.; Mills, J.A.; Long, J.; Philibert, R. A comparison of the predictive power of DNA methylation with carbohydrate deficient transferrin for heavy alcohol consumption. Epigenetics 2020, 16, 969–979. [Google Scholar] [CrossRef]
- Philibert, R.; Miller, S.; Noel, A.; Dawes, K.; Papworth, E.; Black, D.W.; Beach, S.R.H.; Long, J.D.; Mills, J.A.; Dogan, M. A four marker digital PCR toolkit for detecting heavy alcohol consumption and the effectiveness of its treatment. J. Insur. Med. 2019, 48, 90–102. [Google Scholar] [CrossRef] [PubMed]
- Beach, S.R.; Ong, M.L.; Gibbons, F.X.; Gerrard, M.; Lei, M.-K.; Dawes, K.; Philibert, R.A. Epigenetic and proteomic biomarkers of elevated alcohol use predict epigenetic aging and cell-type variation better than self-report. Genes 2022, 13, 1888. [Google Scholar] [CrossRef] [PubMed]
- Philibert, R.A.; Beach, S.R.; Brody, G.H. Demethylation of the aryl hydrocarbon receptor repressor as a biomarker for nascent smokers. Epigenetics 2012, 7, 1331–1338. [Google Scholar] [CrossRef] [PubMed]
- Dogan, M.V.; Beach, S.R.H.; Philibert, R.A. Genetically contextual effects of smoking on genome wide DNA methylation. Am. J. Med. Genet. Part. B Neuropsychiatr. Genet. 2017, 174, 595–607. [Google Scholar] [CrossRef] [PubMed]
- Philibert, R.; Mills, J.A.; Long, J.D.; Salisbury, S.E.; Comellas, A.; Gerke, A.; Dawes, K.; Weg, M.V.; Hoffman, E.A. The reversion of cg05575921 methylation in smoking cessation: A potential tool for incentivizing healthy aging. Genes 2020, 11, 1415. [Google Scholar] [CrossRef] [PubMed]
- Tsaprouni, L.G.; Yang, T.-P.; Bell, J.; Dick, K.J.; Kanoni, S.; Nisbet, J.; Viñuela, A.; Grundberg, E.; Nelson, C.P.; Meduri, E.; et al. Cigarette smoking reduces DNA methylation levels at multiple genomic loci but the effect is partially reversible upon cessation. Epigenetics 2020, 9, 1382–1396. [Google Scholar] [CrossRef] [PubMed]
- Belsky, D.W.; Caspi, A.; Corcoran, D.L.; Sugden, K.; Poulton, R.; Arseneault, L.; Baccarelli, A.; Chamarti, K.; Gao, X.; Hannon, E. Dunedinpace, a DNA methylation biomarker of the pace of aging. Elife 2022, 11, e73420. [Google Scholar] [CrossRef]
- Lu, A.T.; Quach, A.; Wilson, J.G.; Reiner, A.P.; Aviv, A.; Raj, K.; Hou, L.; Baccarelli, A.A.; Li, Y.; Stewart, J.D. DNA methylation grimage strongly predicts lifespan and healthspan. Aging 2019, 11, 303. [Google Scholar] [CrossRef]
- Lu, A.T.; Binder, A.M.; Zhang, J.; Yan, Q.; Reiner, A.P.; Cox, S.R.; Corley, J.; Harris, S.E.; Kuo, P.L.; Moore, A.Z.; et al. DNA methylation grimage version 2. Aging 2022, 14, 9484–9549. [Google Scholar] [CrossRef]
- Beach, S.R.H.; Barton, A.W.; Lei, M.K.; Brody, G.H.; Kogan, S.M.; Hurt, T.R.; Fincham, F.D.; Stanley, S.M. The effect of communication change on long-term reductions in child exposure to conflict: Impact of the promoting strong african american families (prosaaf) program. Fam. Process 2014, 53, 580–595. [Google Scholar] [CrossRef]
- Faul, J.D.; Kim, J.K.; Levine, M.E.; Thyagarajan, B.; Weir, D.R.; Crimmins, E.M. Epigenetic-based age acceleration in a representative sample of older americans: Associations with aging-related morbidity and mortality. Proc. Natl. Acad. Sci. USA 2023, 120, e2215840120. [Google Scholar] [CrossRef] [PubMed]
- Philibert, R.; Dogan, M.; Beach, S.R.H.; Mills, J.A.; Long, J.D. Ahrr methylation predicts smoking status and smoking intensity in both saliva and blood DNA. Am. J. Genet. 2019, 183, 51–60. [Google Scholar] [CrossRef]
- Davis, S.; Bilke, S. An introduction to the methylumi package. Biocond. Package 2010, 10, B9. [Google Scholar]
- Wong, C.C.; Pidsley, R.; Schalkwyk, L.C. The Watermelon Package. 2013. Available online: https://bioconductor.org/packages/release/bioc/html/wateRmelon.html (accessed on 2 March 2023).
- Illumina. Infinium Human Methylationepic Array Product Files. Available online: https://bioconductor.org/packages/release/data/annotation/html/IlluminaHumanMethylationEPICanno.ilm10b2.hg19.html (accessed on 2 March 2023).
- Dogan, M.V.; Xiang, J.; Beach, S.R.; Cutrona, C.; Gibbons, F.X.; Simons, R.L.; Brody, G.H.; Stapleton, J.T.; Philibert, R.A. Ethnicity and smoking-associated DNA methylation changes at hiv co-receptor gpr15. Front. Psychiatry 2015, 6, 132. [Google Scholar] [CrossRef] [PubMed]
- Meeks, K.A.C.; Henneman, P.; Venema, A.; Addo, J.; Bahendeka, S.; Burr, T.; Danquah, I.; Galbete, C.; Mannens, M.M.A.M.; Mockenhaupt, F.P.; et al. Epigenome-wide association study in whole blood on type 2 diabetes among sub-saharan african individuals: Findings from the rodam study. Int. J. Epidemiol. 2018, 48, 58–70. [Google Scholar] [CrossRef] [PubMed]
- Nuotio, M.-L.; Pervjakova, N.; Joensuu, A.; Karhunen, V.; Hiekkalinna, T.; Milani, L.; Kettunen, J.; Järvelin, M.-R.; Jousilahti, P.; Metspalu, A.; et al. An epigenome-wide association study of metabolic syndrome and its components. Sci. Rep. 2020, 10, 20567. [Google Scholar] [CrossRef] [PubMed]
- Soriano-Tárraga, C.; Jiménez-Conde, J.; Giralt-Steinhauer, E.; Mola-Caminal, M.; Vivanco-Hidalgo, R.M.; Ois, A.; Rodríguez-Campello, A.; Cuadrado-Godia, E.; Sayols-Baixeras, S.; Elosua, R.; et al. Epigenome-wide association study identifies txnip gene associated with type 2 diabetes mellitus and sustained hyperglycemia. Hum. Mol. Genet. 2015, 25, 609–619. [Google Scholar] [CrossRef]
- Dawes, K.; Sampson, L.; Reimer, R.; Miller, S.; Philibert, R.; Andersen, A. Epigenetic analyses of alcohol consumption in combustible and non-combustible nicotine product users. Epigenomes 2021, 5, 18. [Google Scholar] [CrossRef] [PubMed]
- Akaike, H. Akaike’s information criterion. In International Encyclopedia of Statistical Science; Springer: Berlin/Heidelberg, Germany, 2011; p. 25. [Google Scholar]
- Schwarz, G. Estimating the dimension of a model. Ann. Stat. 1978, 6, 461–464. [Google Scholar] [CrossRef]
- Mills, J.A.; Beach, S.R.; Dogan, M.; Simons, R.L.; Gibbons, F.X.; Long, J.D.; Philibert, R. A direct comparison of the relationship of epigenetic aging and epigenetic substance consumption markers to mortality in the framingham heart study. Genes 2019, 10, 51. [Google Scholar] [CrossRef]
- Marsh, O. Life cycle of a star: Carl sagan and the circulation of reputation. Br. J. Hist. Sci. 2019, 52, 467–486. [Google Scholar] [CrossRef] [PubMed]
- Keenan, N.L.; Rosendorf, K.A. Prevalence of hypertension and controlled hypertension-united states, 2005–2008. Morb. Mortal. Wkly. Rep. 2011, 60, 94–97. [Google Scholar]
- Lu, Y.; Kwong, K.; Wells, J.; Edwards, A.; Chen, Z.; Tseng, T.-S.; Zhang, K. Quitting smoking after a cancer diagnosis is associated with high-risk neutrophil-to-lymphocyte ratio among tobacco use-related cancer survivors. Sci. Rep. 2023, 13, 2745. [Google Scholar] [CrossRef] [PubMed]

| Female | Male | |
|---|---|---|
| Sex | 164 | 114 |
| Age (chronological) | 46.1 ± 7.1 | 49.6 ± 9.3 |
| Physiologic Parameters | ||
| BMI ** | 35.4 ± 8.1 | 32 ± 8.2 |
| Systolic BP ** | 127 ± 21 mm Hg | 140 ± 24 mm Hg |
| Diastolic BP ** | 87 ± 12 mm Hg | 88 ± 14 mm Hg |
| Cholesterol | 182 ± 40 mg/dL | 179 ± 41 mg/dL |
| LDL ** | 106 ± 35 mg/dL | 102 ± 38 mg/dL |
| HDL ** | 55 ± 22 mg/dL | 49 ± 14 mg/dL |
| HbA1c ** | 5.9 ± 1.5% | 6.4 ± 1.8% |
| Triglycerides ** | 111 ± 60 mg/dL | 138 ± 79 mg/dL |
| Self-Reported Behaviors and Conditions | ||
| Smoking * | 25 (15%) | 34 (30%) |
| Binge Drinking * | 33 (20%) | 42 (37%) |
| Heart Disease | 15 (9%) | 17 (15%) |
| Hypertension | 89 (54%) | 64 (56%) |
| Diabetes | 29 (18%) | 25 (22%) |
| Arthritis | 50 (31%) | 24 (21%) |
| Cancer | 2 (1%) | 3 (3%) |
| Liver Disease | 3 (2%) | 1 (1%) |
| Kidney Disease | 6 (4%) | 5 (4%) |
| Cataracts | 7 (4%) | 8 (7%) |
| Exposure to Community Crime | ||
| Crime | 0.103 ± 0.25 | 0.174 ± 0.30 |
| Epigenetic Measures of Age and Aging | ||
| GrimAge | 52.8 ± 8.8 years | 58.9 ± 8.4 years |
| GrimAge2 | 59.0 ± 7.2 years | 64.4 ± 8.7 years |
| PCGrimAge | 60.1 ± 6.2 years | 66.2 ± 7.9 years |
| GrimAgeAcc * | 6.7 ± 7.7 years | 9.35 ± 5.7 years |
| GrimAge2Acc * | 13.0 ± 5.7 years | 14.9 ± 6.5 years |
| PCGrimAge Acc * | 14.1 ± 3.9 years | 16.6 ± 4.3 years |
| PACE | 1.07 ± 0.17 | 1.08 ± 0.14 |
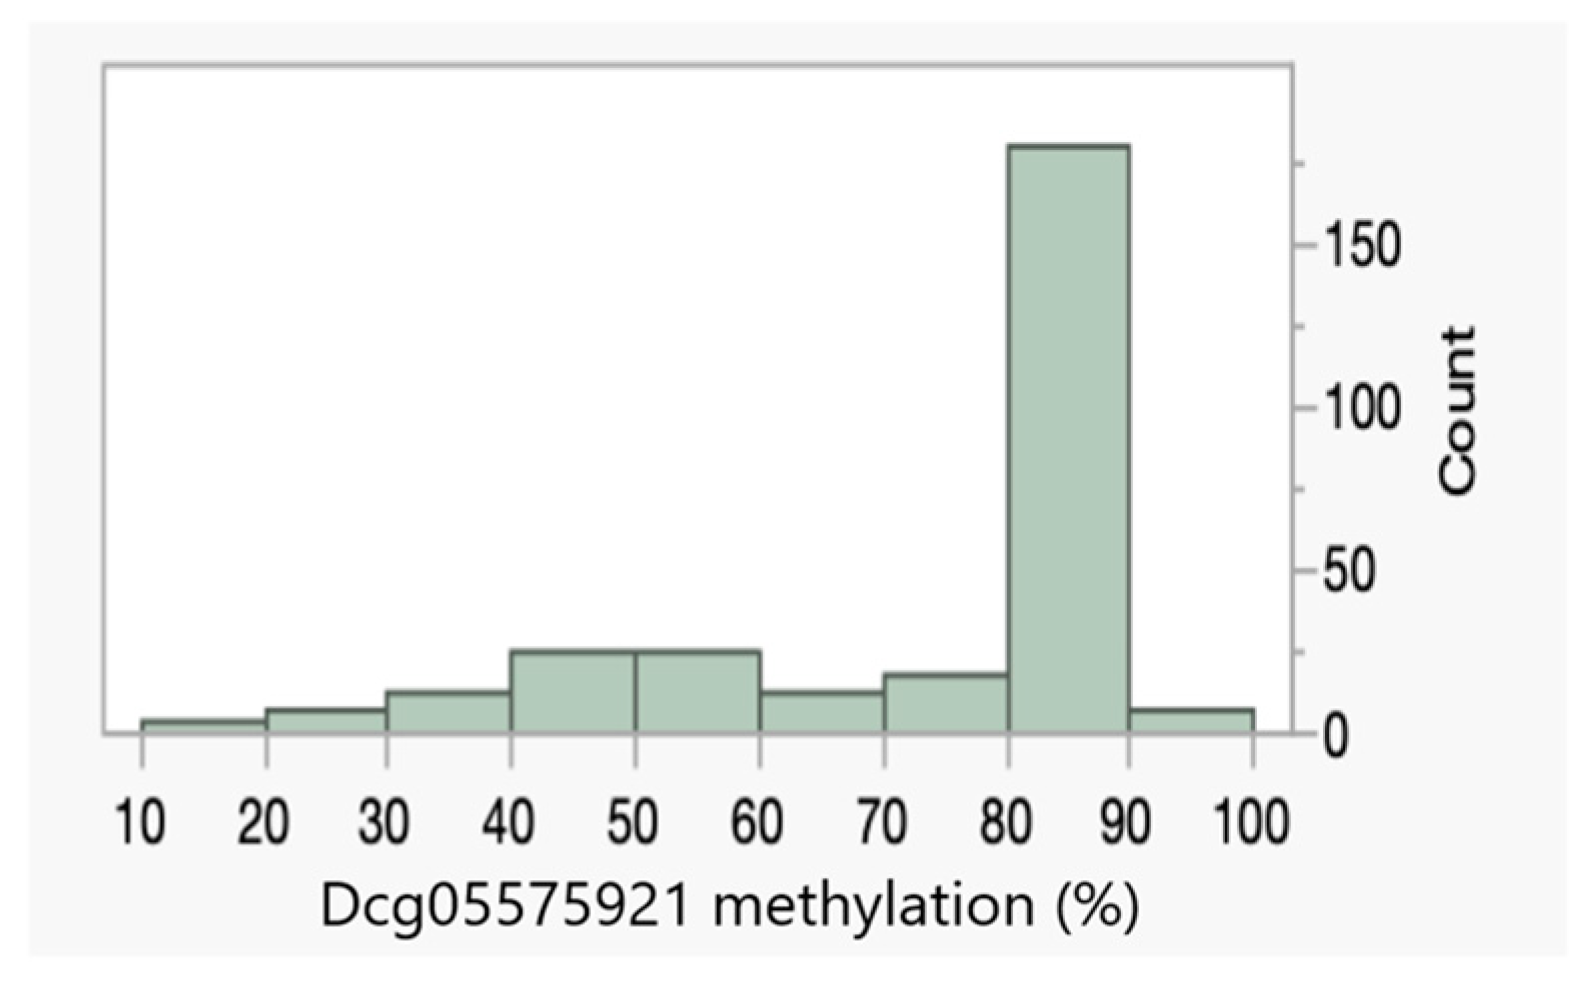
| Dcg05575921 | 79 ± 15% | 68 ± 21% |
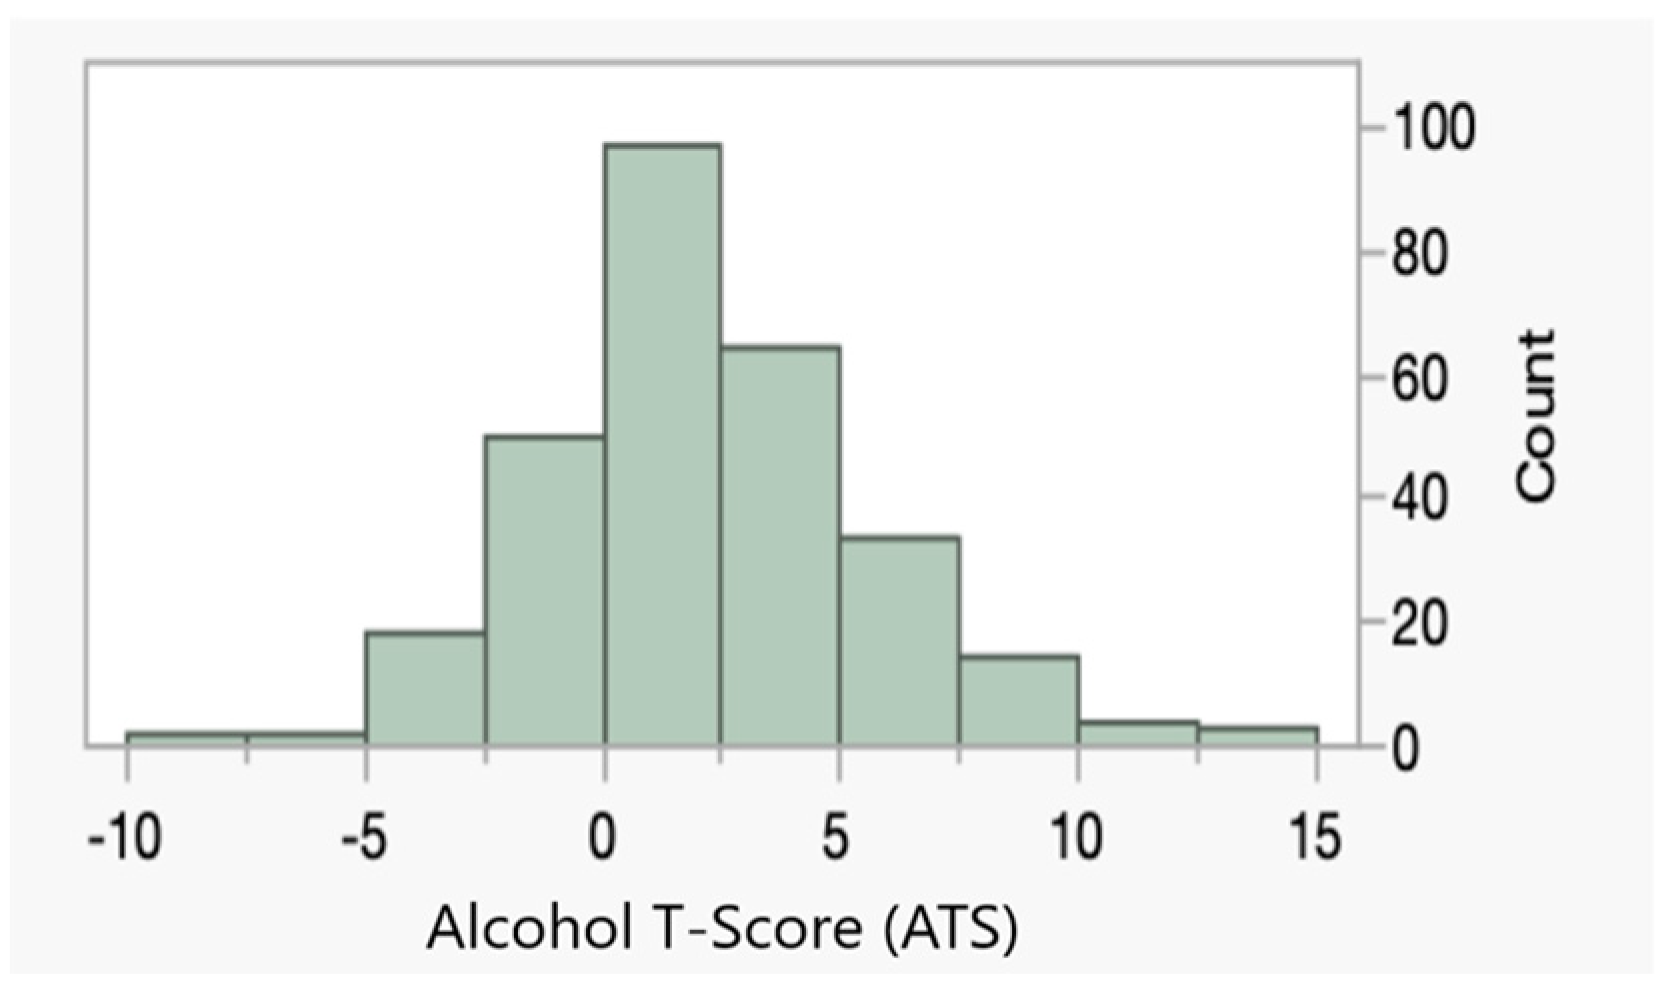
| ATS | 1.5 ± 2.9 | 3.2 ± 3.7 |
| Cg19693031 | 78.3% | 73.1% |
| Adj. R2 | AIC | BIC | ||
|---|---|---|---|---|
| Demographic | Age | 0.168 | 1548 | 1555 |
| Sex | 0.085 | 1574 | 1581 | |
| Epigenetic | Dcg05575921 (Dcg055) | 0.459 | 1428 | 1435 |
| ATS | 0.285 | 1505 | 1513 | |
| cg19693031 | 0.037 | 1588 | 1596 | |
| Vitals | BMI | 0.015 | 1594 | 1602 |
| Systolic | 0.004 | 1598 | 1605 | |
| Diastolic | −0.003 | 1600 | 1607 | |
| Serum | HbA1c | −0.001 | 1599 | 1606 |
| Cholesterol | 0.004 | 1598 | 1604 | |
| LDL | 0.006 | 1597 | 1604 | |
| HDL | 0.005 | 1597 | 1604 | |
| Triglycerides | 0.015 | 1595 | 1601 | |
| Med History | Smoking | 0.257 | 1516 | 1524 |
| Binge Drinking | 0.055 | 1583 | 1591 | |
| Heart Disease | −0.002 | 1599 | 1606 | |
| Hypertension | 0.043 | 1587 | 1593 | |
| Diabetes | −0.003 | 1600 | 1607 | |
| Arthritis | 0.024 | 1592 | 1599 | |
| Cancer | −0.002 | 1599 | 1606 | |
| Liver Disease | 0.013 | 1595 | 1602 | |
| Kidney Disease | 0.004 | 1598 | 1605 | |
| Cataracts | 0.005 | 1597 | 1605 | |
| Crime | Crime | 0.025 | 1592 | 1599 |
| Model | ||||
| 1 | Age + Sex | 0.321 | 1492 | 1503 |
| 2 | Dcg055 + ATS | 0.486 | 1415 | 1426 |
| 3 | Age + Sex + Dcg055 + ATS | 0.744 | 1223 | 1241 |
| 4 | Model 3 + cg19693031 | 0.747 | 1221 | 1242 |
| 5 | Model 3 + BMI | 0.744 | 1224 | 1246 |
| 6 | Model 3 + Triglycerides | 0.745 | 1223 | 1245 |
| 7 | Model 3 + Smoking | 0.743 | 1225 | 1247 |
| 8 | Model 3 + Binge Drinking | 0.743 | 1225 | 1247 |
| 9 | Model 3 + Hypertension | 0.743 | 1225 | 1247 |
| 10 | Model 3 + Arthritis | 0.744 | 1225 | 1246 |
| 11 | Model 3 + Liver Disease | 0.743 | 1225 | 1247 |
| 12 | Model 3 + Crime | 0.748 | 1220 | 1242 |
| 13 | Model 3 + All Significant Predictors | 0.748 | 1216 | 1241 |
| 14 | Model 3 + All Significant Predictors + PACE | 0.752 | 1217 | 1246 |
| 15 | Model 3 + PACE | 0.744 | 1224 | 1246 |
| Adj. R2 | AIC | BIC | ||
|---|---|---|---|---|
| Demographic | Age | 0.022 | −248 | −241 |
| Sex | −0.002 | −241 | −234 | |
| Epigenetic | Dcg05575921 (Dcg055) | 0.036 | −252 | −245 |
| ATS | 0.103 | −272 | −265 | |
| cg19693031 | 0.003 | −243 | −235 | |
| Vitals | BMI | 0.043 | −254 | −247 |
| Systolic | 0.006 | −243 | −236 | |
| Diastolic | 0.003 | −242 | −235 | |
| Serum | HbA1c | 0.039 | −253 | −246 |
| Cholesterol | 0.008 | −244 | −237 | |
| LDL | −0.004 | −241 | −234 | |
| HDL | 0.079 | −265 | −257 | |
| Triglycerides | 0.007 | −244 | −236 | |
| Med History | Smoking | 0.014 | −246 | −239 |
| Binge Drinking | −0.000 | −242 | −234 | |
| Heart Disease | 0.047 | −255 | −248 | |
| Hypertension | 0.012 | −245 | −238 | |
| Diabetes | 0.022 | −248 | −241 | |
| Arthritis | 0.004 | −243 | −236 | |
| Cancer | −0.001 | −241 | −234 | |
| Liver Disease | −0.003 | −241 | −233 | |
| Kidney Disease | 0.006 | −243 | −236 | |
| Cataracts | −0.003 | −241 | −233 | |
| Crime | Crime | 0.003 | −243 | −235 |
| Model | ||||
| 1 | Age | 0.022 | −248 | −241 |
| 2 | Dcg055 + ATS | 0.100 | −270 | −259 |
| 3 | Age + Dcg055 + ATS | 0.104 | −270 | −256 |
| 4 | Model 3 + BMI | 0.207 | −303 | −285 |
| 5 | Model 3 + HbA1c | 0.129 | −277 | −259 |
| 6 | Model 3 + HDL | 0.179 | −294 | −276 |
| 7 | Model 3 + Smoking | 0.101 | −268 | −250 |
| 8 | Model 3 + Heart Disease | 0.126 | −276 | −258 |
| 9 | Model 3 + Hypertension | 0.111 | −271 | −253 |
| 10 | Model 3 + Diabetes | 0.116 | −273 | −255 |
| 11 | Model 3 + All Significant Predictors * | 0.255 | −318 | −285 |
| 12 | Model 3 + All Significant + PCGrimAgeAcc | 0.258 | −317 | −280 |
| 13 | Model 3 + PCGrimAgeAcc | 0.118 | −269 | −250 |
Disclaimer/Publisher’s Note: The statements, opinions and data contained in all publications are solely those of the individual author(s) and contributor(s) and not of MDPI and/or the editor(s). MDPI and/or the editor(s) disclaim responsibility for any injury to people or property resulting from any ideas, methods, instructions or products referred to in the content. |
© 2024 by the authors. Licensee MDPI, Basel, Switzerland. This article is an open access article distributed under the terms and conditions of the Creative Commons Attribution (CC BY) license (https://creativecommons.org/licenses/by/4.0/).
Share and Cite
Philibert, R.; Lei, M.-K.; Ong, M.L.; Beach, S.R.H. Objective Assessments of Smoking and Drinking Outperform Clinical Phenotypes in Predicting Variance in Epigenetic Aging. Genes 2024, 15, 869. https://doi.org/10.3390/genes15070869
Philibert R, Lei M-K, Ong ML, Beach SRH. Objective Assessments of Smoking and Drinking Outperform Clinical Phenotypes in Predicting Variance in Epigenetic Aging. Genes. 2024; 15(7):869. https://doi.org/10.3390/genes15070869
Chicago/Turabian StylePhilibert, Robert, Man-Kit Lei, Mei Ling Ong, and Steven R. H. Beach. 2024. "Objective Assessments of Smoking and Drinking Outperform Clinical Phenotypes in Predicting Variance in Epigenetic Aging" Genes 15, no. 7: 869. https://doi.org/10.3390/genes15070869
APA StylePhilibert, R., Lei, M.-K., Ong, M. L., & Beach, S. R. H. (2024). Objective Assessments of Smoking and Drinking Outperform Clinical Phenotypes in Predicting Variance in Epigenetic Aging. Genes, 15(7), 869. https://doi.org/10.3390/genes15070869