Abstract
Since the dawn of agriculture, crops have been genetically altered for desirable characteristics. This has included the selection of natural and induced mutants. Increasing the production of plant oils such as soybean (Glycine max) oil as a renewable resource for food and fuel is valuable. Successful breeding for higher oil levels in soybeans, however, usually results in reduced seed protein. A soybean fast neutron population was screened for oil content, and three high oil mutants with minimal reductions in protein levels were found. Three backcross F2 populations derived from these mutants exhibited segregation for seed oil content. DNA was pooled from the high-oil and normal-oil plants within each population and assessed by comparative genomic hybridization. A deletion encompassing 20 gene models on chromosome 14 was found to co-segregate with the high-oil trait in two of the three populations. Eighteen genes in the deleted region have known functions that appear unrelated to oil biosynthesis and accumulation pathways, while one of the unknown genes (Glyma.14G101900) may contribute to the regulation of lipid droplet formation. This high-oil trait can facilitate the breeding of high-oil soybeans without protein reduction, resulting in higher meal protein levels.
1. Introduction
There is a strong genetic component that is well understood for oil content and quality via the oil biosynthetic pathway and its regulation. Seed oil is biosynthesized during the second main stage of seed maturation [1,2,3], at which time the relevant biosynthetic enzymes are highly expressed. For instance, in studies of expression profiles of triacylglyceride (TAG) biosynthetic enzymes and oil accumulation in developing soybeans (Glycine max), DGAT1 shows an expression profile suggesting a dominant role in soybean oil biosynthesis, but DGAT2 and PDAT do not [4,5,6].
It is becoming increasingly possible to alter hydrocarbon flux in soybeans. Multiple studies indicate that oil content increases with a higher expression of TAG biosynthetic genes [7,8,9]. Increased expression of regulatory genes that upregulate multiple enzymes for fatty acid biosynthesis also can result in higher oil levels [9]. Co-expression of the transcription factor WRI1 with DGAT1, a key rate-limiting enzyme, is shown to have a synergistic effect on TAG biosynthesis in plants [10,11,12]. Overall, increasing sink strength results in increased oil and protein, with a strong pronounced effect on protein and less on oils [13].
Cultivar effects are well understood to affect protein content and amino acids in soybeans, most likely due to heritable differences in TAG biosynthetic genes and regulatory factors. For instance, germplasm line N6202 produced seeds with 45.7% protein content and a 10% reduction in grain yield compared to a control variety, NC-Roy [14]. In contrast, TN03-350 and TN04-5321 achieved 43.1–43.9% protein content without sacrificing seed yield. Considering the importance of grain yields in commercial varieties, such a result is more desirable than a decrease in yield with improved grain quality. In soybean genotypes of early maturity groups, average-to-high protein content (399–476 g/kg−1) was found in years with high air temperature and moderate rates of rainfall during the seed-filling period, whereas seed protein content was drastically reduced (265–347 g/kg−1) in seasons of insufficient nitrogen fixation or higher amounts of precipitation during seed filling [15].
In plant breeding, random mutagenesis is a common way to generate mutations and increase genetic diversity for traits with limited natural variation. Common examples include the use of a chemical mutagen like ethyl methane sulfonate (EMS) or bombardment with gamma radiation, and today even site-directed mutagenesis is possible [16]. While these methods can produce useful traits, such as an early flowering mutant or increased oil content, it is possible that other important genes could be mutated, causing undesirable phenotypes, such as altered seed composition. However, mutagenized populations are not brought under the same scrutiny as transgenic approaches, and therefore traits induced this way are much easier to incorporate into the existing germplasm.
While utilization of mutagens can introduce much-needed levels of genetic and phenotypic diversity, it is imperative to understand the nature of the mutations induced. The mutagen used in this study, fast neutron bombardment (FN), typically induces deletion and/or chromosomal rearrangement events from several base pairs-long to several megabases [17,18,19]. The phenotypic variation can be used to study the association of genes with specific traits [20] or as a source of new variation for breeding purposes [21,22,23]. Comparative genomic hybridization (CGH) is one of the fastest and most effective ways to assess duplications or deletions caused by irradiation mutagenesis, such as FN. This technology utilizes oligonucleotide probes affixed to slides, known as microarrays. Fluorescently labeled DNA samples can then be hybridized to the probes, thus emitting a fluorescence intensity proportional to the DNA sample copy number for each probe sequence. The mutant DNA sample can be compared to a control sample (the non-mutagenized parent DNA) to identify tracts of sequence that have been duplicated or deleted in the mutant compared to its parent line [17,18,24]. In the case of the current study, the soybean microarray consists of 700,000+ features, allowing for a probe spacing of approximately 1000 base pairs across the euchromatic portion of the genome. With the advances of next generation sequencing and microarray technology, combined with intimate knowledge of the soybean genome, we can now harness CGH technology to quickly and precisely assess copy number variants (CNVs) in segregating mutant backcrosses.
Here, we utilized a fast neutron population of soybeans which exhibit 3-to-4% higher oil content than the parent variety with only a minor decrease in protein, resulting in seeds with increased oil plus protein content compared to the parent varieties. We hypothesize that the loss of a specific gene or genes within the deleted 300 kb region on chromosome 14 is responsible for the high-oil phenotype. Our analysis provides new insight into which of these genes may be the most likely to cause this change and may be the best candidate for future functional analyses.
2. Materials and Methods
2.1. Genetic Material
Seeds from three mutant lines, 1R22C28Cgadbr355aMN13, 5R12C21Dar387dMN13, and 5R16C01Dar388eMN13, and their parent, M92-220, from the University of Minnesota, were requested from their fast neutron (FN) mutant library in April 2014 and planted in the field in Lexington, KY, during the summer of 2014 to verify high-oil content in that environment using a single-line, randomized complete block design with border seed of the “Jack” cultivar. Ten plants were in each line, with three total replications, with each plant individually bulked and analyzed via non-destructive NIRS [25,26,27].
M92-220 is a maturity group “I” soybean produced by the University of Minnesota soybean breeding program. It is derived from the cultivar “MN1302” (PI 616498), which was originally selected from a cross between “Hendricks” × “Archer” [28]. M92-220 exhibits an indeterminate growth habit, purple flowers, grey pubescence, brown pods, yellow seeds, and a buff hilum.
2.2. Backcrossing
Two mutant lines (1R22C28Cgadbr355aMN13 and 5R12C21Dar387dMN13) in the M8 and M5 generations, respectively, exhibited high oil content in the KY environment and were thus planted and backcrossed to the parent line M92-220 in 2015, similar to other methodologies [18]. Successful crosses were harvested, and eleven F1 crosses were assessed for oil content via single-seed NMR. These were then grown in a greenhouse in the winter of 2015–2016 and in the spring of 2016. Thirty F2 seeds from each of the F1 plants were assessed for single-seed oil content and then planted at Spindletop Farm in Lexington, KY. In addition, 30 other randomly selected seeds were planted for each line, bringing the total to 60 total F2 seeds from F1 plants planted for each line.
2.3. Tissue Sampling, Seed Composition, and DNA Extraction
Leaf tissue was collected and frozen at −80 °C [29] for comparative genomic hybridization (CGH) analysis from F2 plants. Seeds were harvested from each plant in the fall, and each F2 plant’s F3 seed was analyzed in bulk with a Perten DA7200 NIRS for oil, protein, and moisture content. These data were used to generate scatter plots of the F2 sibs. Strong inverse correlations of oil and protein content suggested that segregations of the mutant trait were found in three F2 populations.
2.4. NMR Methods
Oil content was determined by single-seed NMR, using a Minspec 20 (Bruker Biospin, The Woodlands, TX, USA) [25]. The instrument accommodates a 20 mm sampling-tube diameter. Seeds were weighed and placed into the tube and allowed to warm to 40 °C before insertion into the instrument. The standard oil seed measurement procedure supplied with the instrument controller was used. Calibration of the NMR instrument was performed using weighed amounts of extracted soybean oil encompassing the range of oil weights of the seed samples. Four different weights were used and were expressed on tissue paper at the bottom of the 20 mm sample tube.
2.5. CGH Analysis
DNA was extracted on a per-plant basis using a QIAGEN Plant DNeasy Kit from the leaves of three F2 populations (known here as A1, A2, and A3) expected to segregate for seed-oil content. The F2 plants that gave rise to F2:3 seeds with the highest seed oil (“high-oil” plants) and lowest seed oil (“normal-oil” plants) were respectively identified using NIRS. The DNA from the high-oil F2 plants was bulked, and the DNA for the normal-oil F2 plants was bulked for each of the three populations. The bulked DNAs were then subjected to CGH analyses, as previously described [17], using a custom NimbleGen CGH microarray with over approximately 700,000 probes, approximately 1 probe every 1 kb [17]. The CGH probe positions were designed according to the soybean cultivar Williams 82 genome version 2 assembly (Wm82.a2.v1). Each CGH was performed as a comparison within each population (e.g., A1 high-oil versus A1 normal-oil, etc.) From these comparisons, a large deletion was detected on chromosome 14, and the genes in that region (according to the Williams 82 version Wm82.a2.v1 gene annotation set) were analyzed on soybase.org and cross-referenced to homologous genes in the TAIR database.
2.6. Functional Analysis
SignalP-6.0 (https://services.healthtech.dtu.dk/services/SignalP-6.0/, accessed on 1 January 2024) was used to investigate possible signal peptides. The topology analysis was performed by Protter (https://wlab.ethz.ch/protter/start/, accessed on 1 January 2024) [30], and the protein network was established using the STRING database (https://string-db.org, accessed on 1 January 2024) [31]. Interactions in STRING are derived from genomic-context predictions, high-throughput lab experiments, co-expression, automated text-mining, and previous knowledge in databases. Phyre2, also known as Protein Fold Recognition Server, is a web portal for protein modeling, prediction, and analysis (http://www.sbg.bio.ic.ac.uk, accessed on 1 January 2024) [32]. Phyre2 was used to study the function of unknown genes in this study, and Chimera software version 1.11.2 was used to visualize the structural protein models [33].
3. Results
3.1. Oil and Protein Content of Backcrosses
Three mutant lines were selected for analysis based on previously observed high seed-oil content when grown in MN. The full names of these lines (1R22C28Cgadbr355aMN13, 5R12C21Dar387dMN13, and 5R16C01Dar388eMN13) are abbreviated herein as “1R22”, “5R12”, and “5R16” for simplicity. When grown in KY in 2015, these lines again showed a higher mean seed oil content, though not as pronounced compared to their wild-type parent line, M92-220, as was previously observed in MN (Table 1). We attempted to backcross the mutants to M92-220, resulting in eleven successful crosses. However, successful crosses were only observed for two of the mutants, 1R22 and 5R12.

Table 1.
Mean oil content (on a dry weight basis) and the standard error in parentheses of three FN lines from the field in Minnesota (2013) and Lexington, KY (2015), and the parental line, determined on a dry-weight basis via bulk-seed NIRS. n = 3 plots in one location. Data are displayed as mean ± SE.
Successful crosses were obtained between 1R22 × M92-220 and 5R12 × M92-220. The oil content of the resulting F1 seeds ranged from 17.3 to 22.5% (Table 2), as was determined by single-seed NMR. These F1 seeds were grown in a greenhouse over winter and designated as A1 through B3 plants. A5, A6, A7, and B3 seeds were planted but were not viable or did not survive to maturity. The F2 seeds resulting from the greenhouse planting were harvested and bulked to measure oil and protein content for all the seeds from each F2 population via NIRS (Table 3). Furthermore, thirty seeds were randomly selected from each of these populations for single-seed NMR analysis. Table 4 shows data from the A1 population. These 30 F2 seeds analyzed via NMR were then planted in the field for each respective population, along with an additional 30 F2 seeds that did not contain single-seed data per population. Leaf tissue was collected during the two-leaf stage for the F2 plants, and the F3 seeds were harvested at maturity. NIRS bulk data were collected on each F2:3 sample, using approximately 100 seeds. The protein and oil estimates for these families are shown for lines derived from the A1, A2, and A3 F1 lineages, which are all from crosses between 1R22 and the M92-220 WT (Table 5). Scatter plots of the protein and oil estimates for a deeper sampling of F2:3 families are shown (Figure 1); each data point represents the values for a given F2:3 sample of seeds. The populations generally showed good spread in their data, with inverse correlations between protein and oil. This indicates that a genetic factor may have segregated in the F2 plants, perhaps an FN-induced mutation that is associated with the high-oil trait.
Table 2.
Oil content of individual F1 seeds. Each F1 seed was assigned a population name for reference to the future generations raised from that seed. The first parent mentioned is the maternal plant, and the second mentioned is the paternal. Oil content was determined by single-seed NMR using a Minspec 20 (Bruker Biospin, The Woodlands, TX, USA). Seeds were weighed and placed into the tube and allowed to warm to 40 °C before insertion into the instrument. The standard oil seed measurement procedure supplied with the instrument controller was used. n = 3 technical replications on each seed, and SEs are in parentheses. Herein, the lines are referred to by the population name rather than parents for clarity.
Table 3.
Protein and oil content of bulked F2 seeds. The “Cross” column shows the parents in the original cross; the first parent shown is the maternal plant, and the second mentioned is the paternal. Oil and protein content was determined by bulk-seed NIRS using a Perten DA7200 Spectrometer with n = 3 technical replications on each seed batch.
Table 4.
Single-seed oil and protein of 30 randomly selected F2 seeds (from F1 plants) selected for field planting, all of which are sibs. The field # (number) serves as an identifier related to seeds retained in long-term storage and used to track lineages. Oil and protein were determined for each seed using single-seed NIRS with 3 technical reps per seed. Single seeds were also surveyed in a similar way for lines A2, A3, A4, A8, B1, and B2, whose genetic lineages are described in Table 3.
Table 5.
Seed oil and protein from F2:3 lines A1, A2, and A3 (all originally derived from 1R22×WT crosses). Each row represents data from a sample of F3 seeds derived from an individual F2 plant. Oil and protein were determined via NIRS using a Perten DA7200 spectrometer and calculated on a 0% moisture basis. Each population (A1, A2, and A3) was split into a high-oil (bold text) and normal-oil (non-bold text) group. These groupings were used to determine which F2 DNA samples were bulked together for CGH analyses (high-oil bulk versus normal-oil bulk).
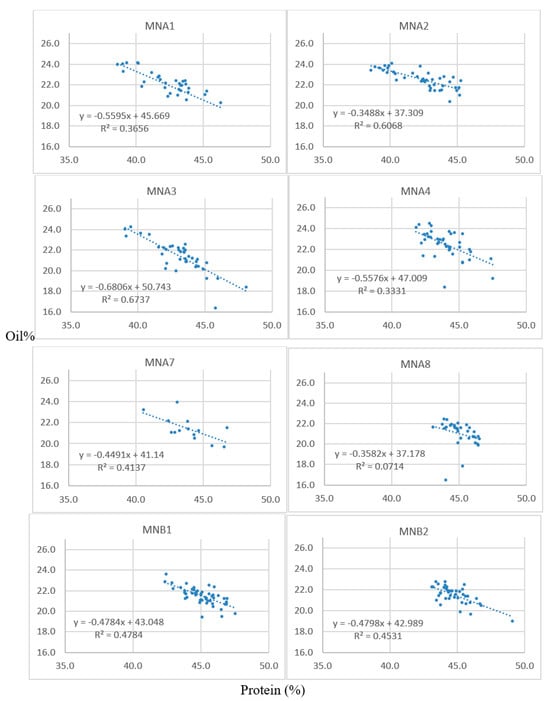
Figure 1.
Scatter plots of the protein (x-axes) and oil (y-axes) content of F2:3 seeds. Each data point represents the NIRS values for each respective F2:3 family (e.g., corresponding to the rows in Table 5 for the A1, A2, and A3 populations). Seeds were analyzed for percent oil and protein content on a dry-weight basis via bulk-seed NIRS with n = 3 technical replications for each F2:3 seed lot.
3.2. CGH Analysis Reveals a Strong Candidate Deletion for the High-Oil Mutant Phenotype
We chose to further investigate the A1, A2, and A3 populations to determine if an FN-induced deletion was co-segregating with the high-seed-oil phenotype in the 1R22 mutant populations. We collected DNA for each of the F2 plants grown in the field in KY. We performed a bulk segregant analysis using CGH to see if there were any deletions that co-segregated with the high-oil phenotype. Based on the F2:3 NIRS data (Table 5), we binned each F2 into those that gave rise to high seed oil (high-oil, bold) and those that gave rise to normal seed oil levels (normal-oil, non-bold) within each respective population. We then bulked the DNA for the high-oil and normal-oil plants, respectively. These bulked DNA samples were subjected to CGH analyses to compare the deletion/duplication profile of the high-oil and normal-oil bulks for each of the three populations. The deletion/duplication profile of the high-oil and normal-oil bulks for each of the three populations was determined. We expected that the CGH profile would identify a differential hybridization between any deletion that was enriched in the high-oil segregating bulk of individuals compared to the normal-oil segregating bulk.
One large deletion event (>300 kb) on chromosome 14 was enriched in the high-oil bulks of the A1 and A3 populations (Figure 2), as evidenced by the string of data points below the log2 value of zero. (Zero indicates no difference between the high-oil bulk and the normal bulk, whereas values below zero indicate an enrichment for an FN deletion in the high-oil bulks compared to the normal bulks.) Specifically, the deletion was found on Chr14, from bp 9,994,086 to 10,301,954, a span of approximately 308 kb. The deletion is more pronounced in the A1 population, indicating that a greater proportion of individuals in that population were likely homozygous for the large deletion. Nonetheless, the A3 population also shows an enrichment for the large deletion in the high-oil bulk compared to the normal bulk. We know from previous experience that it is difficult to determine perfect bulks based on phenotypes for seed composition traits [18]. Thus, it is not surprising that our three populations did not all show similar enrichment. In fact, the A2 population did not show enrichment for this deletion in its high-oil bulk. It is worth noting, however, that the spread of the oil data in the A2 population was less distinct than the spread from the A1 and A3 populations (Figure 1), indicating that the A2 plants were more likely to have their DNA samples bulked into the wrong group. Thus, we tentatively conclude that the large deletion on chromosome 14 is likely co-segregating with the high-seed-oil phenotype in these mutant populations.
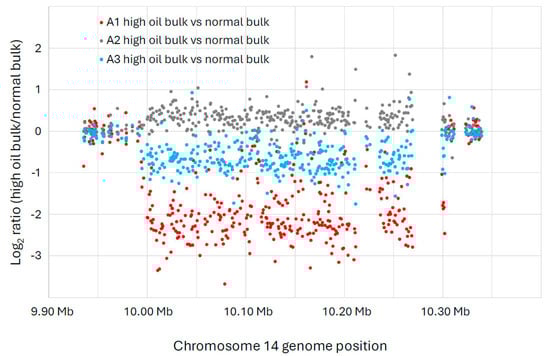
Figure 2.
A large copy number variation (CNV) event detected in chromosome 14 of the A1 and A3 populations (both derived from separate crosses between 1R22 × WT) exhibited strong inverse correlations of oil and protein content. The x-axis indicates the location of each microarray feature along chromosome 14, according to the Williams 82 genome version 2 assembly (Wm82.a2.v1). The y-axis shows the log2 ratio of the CGH intensity from the high-oil versus the normal-oil bulk for each microarray feature. The blue dots show the CGH comparison between A1 high-oil versus A1 normal-oil. The orange dots show the CGH of high-oil versus normal-oil for A2, and the grey dots show the CGH of high-oil versus normal-oil for A3. These data indicate that a large deletion is enriched in the high-oil plants of the A1 and A3 populations, while the A2 population does not show this enrichment. This deletion event was detected on Chr14, from bp 9,994,086 to 10,301,954, a span of approximately 308 kb.
3.3. Functional Analysis
The deletion on chromosome 14 encompasses 20 soybean gene models. All annotated functions of the 20 putative genes in the deleted region are summarized (Table 6). Of the 20 genes, 18 have a readily predicted function, but none appears to have an obvious connection to seed oil phenotypes. Table 6, Table 7 and Table 8 contain information about all genes within the deletion region. Among genes in this table, Glyma.14G102100 and Glyma.14G101900 had no readily predicted function. Therefore, bioinformatic analyses were performed to reveal possible functions for these genes. Glyma.14G101900 with 82 amino acids is composed of 61% disordered protein (lacks an ordered three-dimensional structure) (Table 7) and is predicted to be a transmembrane protein by TAIR. The membrane topology of this gene was illustrated and predicted by Protter (Figure 3). The protein network for Glyma.14G101900 (Figure 4) and the PDB model of both Glyma.14G101900 and Glyma.14G102100 were predicted by Phyre2 and illustrated by Chimera (Figure 5 and Figure 6).
Table 6.
A large deletion event was detected on Chr14, from position 9,994,086 to 10,301,954 (coordinates based on the Williams 82 genome version 2 assembly (Wm82.a2.v1), a span of approximately 308 kb in the 1R22-derived populations. * Putative transcription factors.
Table 7.
Phyre2 results for unknown genes (Glyma.14G101900 and Glyma.14G102100).
Table 8.
Review of putative function of 19 Arabidopsis homologues of the genes in the deleted region of the high-oil soybean mutant.
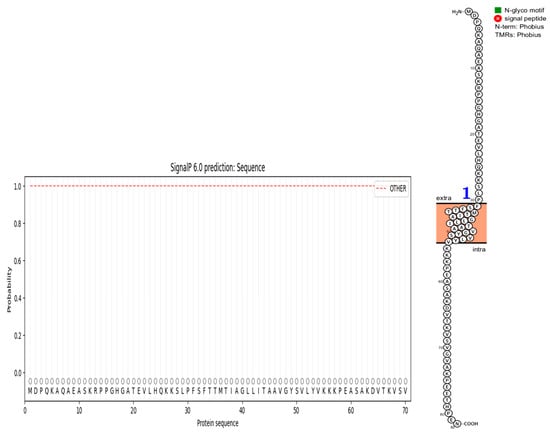
Figure 3.
Predicted topology of Glyma.14G101900. It has one transmembrane region, designated by the blue 1. Extra means extra-cellular, and intra means inside the plasma membrane.
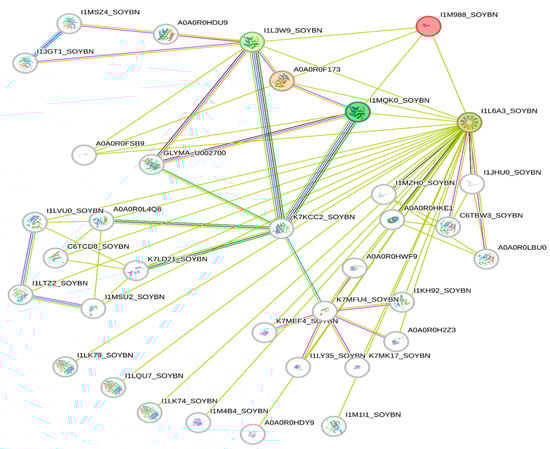
Figure 4.
Protein network for Glyma.14G101900 clustered in three groups. Glyma.14G101900 is referred to as I1M988 (red color) in the STRING database. Green lines represent all relationships to Glyma14G101900, whereas other colors represent multiple unique connections between genes in the associated network families.
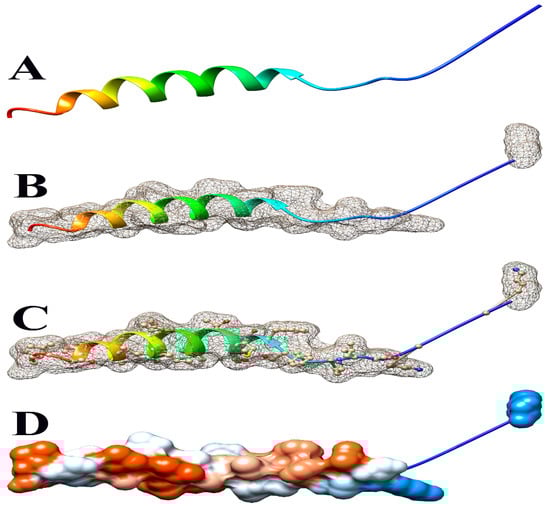
Figure 5.
Some views of Glyma.14G101900 PDB model predicted by Phyre2 and illustrated by Chimera. (A) Ribbon view, (B) mesh surface view, (C) mesh surface with ball and stick view, and (D) hydrophobicity surface (hydrophobicity surface preset from dodger blue for the most hydrophilic to white to orange-red for the most hydrophobic).
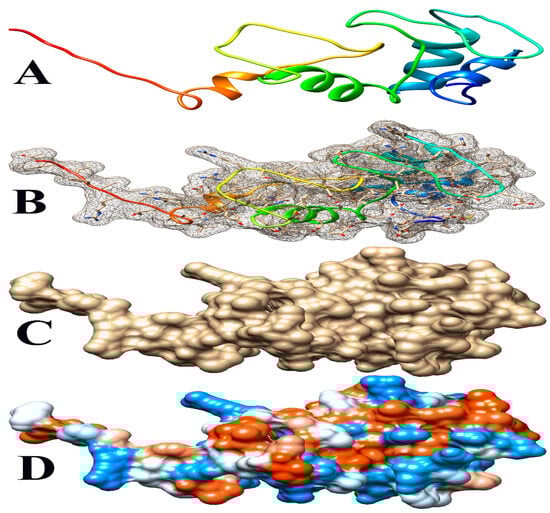
Figure 6.
Some views of Glyma.14G102100 PDB model predicted by Phyre2 and illustrated by Chimera. (A) Ribbon view, (B) mesh surface with ball and stick view, (C) surface view, and (D) hydrophobicity surface (hydrophobicity surface preset from dodger blue for the most hydrophilic to white to orange-red for the most hydrophobic).
4. Discussion
Forward screening of mutant populations for seed composition traits has been utilized with success in many crop species, including soybean seed composition changes induced by FN [18,21,22]. Soybean FN mutant families are powerful due to large variations in mutation sizes, from several bp deletions up to Mb-sized deletion events [17,18,19,24]. We utilized this resource and a forward screening approach to identify three mutants with high seed oil content and lower decreases in protein than are found in varieties produced using conventional breeding techniques [126,127,128]. These mutants were then backcrossed to the parent variety, which, in theory, should produce heterozygous offspring for the mutant traits in the F1 population. After a generation of self-pollination, we would expect to observe a genotypic segregation ratio of 1:2:1 for the homozygous mutant/heterozygous/homozygous wild type.
In the populations A1, A2, and A3, phenotype segregation was apparent in the F2:3 seeds, with oil content ranging from 19 to 24%, spread over a somewhat normal distribution. Assuming that the high-oil phenotype is caused by an FN-induced deletion, CGH may be able to show the deletion event when comparing the highest and lowest oil F2 bulked DNA samples, which was clearly observed in the A1 population. Furthermore, the size of the deletion detected, about 300 kb, is within the size range we anticipate and is frequently observed in CGH on soybean FN mutants [17,18,24].
While the size of the deletion event may imply that it is the source of observed phenotypic variation, it is also important to examine the deleted genes to begin to hypothesize about the mechanism which causes the observed variability. To date, many efforts have been made through mutagenesis, conventional breeding, and biotechnology to increase oil content of seeds. It has been well established that the ratio of sucrose/asn+gln from the mother plant significantly alters oil and protein content but results in an inverse correlation of these traits [129,130,131].
There is a genetic component to this, as high oil is heritable when selected in this manner, but usually results in a corresponding and roughly equal loss of protein. Metabolic engineering efforts have been effective at elevating oil content without the corresponding loss in protein by utilizing push, pull, and protect mechanisms. First, the “push” mechanism directs hydrocarbon resources toward the oil biosynthetic pathway, creating an abundant source of metabolic precursors. The transcription factor WRI1 is known to operate in this fashion [12,132,133]. Next, “pull” mechanisms occur later in the pathway and use downstream metabolites at a faster rate, thereby causing upstream resources to be re-directed into the pathway [11].
The enzyme diacylglycerol acyltransferase (DGAT) catalyzes the final and only dedicated step to TAG synthesis via the Kennedy pathway by combining a diacylglycerol molecule with an acyl-CoA [134]. Biochemical studies have also determined that this is a rate-limiting step in many species, so increasing the speed of TAG formation via DGAT increases the speed of the entire pathway [135]. DGAT-overexpression studies confirm this phenomenon, and DGAT-overexpressed plants have significantly higher oil levels, with no decrease in protein [136,137]. Lastly, “protect” mechanisms ensure that TAGs already formed do not degrade. For example, lipase knockouts [138] exhibit increased oil content, as do oleosin overexpressors, which are proteins that stabilize storage oil bodies [11]. Better yet, plants which are engineered with two or more of these steps exhibit synergistic increases in oil, such as tobacco leaves with up to 30% on a dry-weight basis of storage lipids [12].
In 1R22, the main FN mutant from this study, 20 gene models are located within a deletion that co-segregates with the high-oil phenotype. Eighteen of these genes have known functions but do not have an obvious fit to the high-seed-oil mutant phenotype. One of the unknown genes, Glyma.14G102100, is predicted to be a transposon ty3-g gag-pol polyprotein with 99.4% confidence and classified as a DNA-binding protein by Phyre2 (Table 7). We have no reason to suspect that this gene is involved in the mutant high-oil trait. The other unknown gene, Glyma.14G101900, has a COOH terminus predicted to be inside the plasma membrane, while the H2N terminal is predicted to be extra-cellular. A signal peptide analysis also showed that Glyma.14G101900 has no signal peptide (Figure 3). Some articles state that disordered proteins mainly trigger cellular stress responses or affect protein interaction networks. Ma et al. [139] stated that the deletion of such a disordered region enhances oil accumulation in Arabidopsis. The hydrophobicity surface and other views of the Glyma.14G101900 and Glyma.14G102100 PDB model predicted by Phyre2 and is illustrated via Chimera (Figure 5 and Figure 6).
Protein network analysis performed by the STRING database indicates that Glyma.14G101900 has an interaction with four main proteins (STRING identifiers: I1L6A3, I1MQK0, A0A0R0F173, and I1L3W9), as shown in Figure 4. I1L3W9 is an uncharacterized protein that belongs to the short-chain dehydrogenase/reductase (SDR) family. A0A0R0F173 is AB hydrolase-1 domain-containing protein. I1MQK0 is also an uncharacterized protein that belongs to the short-chain dehydrogenases/reductases (SDR) family. SDR enzymes have critical roles in lipid metabolism [140].
I1L6A3 is a Seipin 1A that has a role in lipid droplet formation and storage, and it is necessary for both adipogenesis and lipid droplet (LD) organization [141]. At this stage, we do not know how a deletion of Glyma.14G101900 would change the interactions between these proteins to produce high oil. It is possible that Glyma.14G101900 has a negative interaction with these proteins, specifically Seipin, such that its deletion increases oil production.
We also speculate that one of the proteins in the deleted section may have a role in reducing triacylglycerol biosynthesis. Thus, many pathway analyses were performed, but no clear role of any of the gene products in triacylglycerol biosynthesis has been uncovered so far. The investigations of possible functions of these putative genes (especially from available RNA-seq data) are summarized in Table 8.
There seem to be several plausible hypotheses for how this deletion event may be influencing oil content in seeds; however, further studies are needed to confirm this. First, it would be useful to establish a genetic marker for this deletion to confirm that this location is the source of the high-oil phenotype. This could be a simple PCR amplicon across the deletion boundaries, which would provide a PCR product in plants that carry the deletion and no product in plants that do not carry the deletion. This would be analogous to a VgDGAT marker that was used to track a transgene conferring a high-oil phenotype [136,137]. In other CGH mutant lines, this method was used to confirm a FAD2 gene deletion, and the high oleic acid content correlated directly with the presence or absence of a PCR marker [17]. In addition, cloning of the genes in this region and inserting them into the mutant via transgenesis may be able to rescue the wild-type phenotype and precisely pinpoint the gene responsible for increased oil content. In the future, a full functional analysis could systematically reveal the candidate gene or genes within this deletion that underly the changes in phenotype. Ultimately, breeders and growers are not very concerned with the exact gene or mechanism which increases oil content; they know only that change is established as heritable, is easily identifiable with standard assays, and has limited other detrimental effects on the phenotype. Ultimately, it seems that the loss of a specific gene or genes within the deleted 300 kb region on chromosome 14 is responsible for the high-oil phenotype, and a further analysis could pinpoint the ultimate cause of these changes.
Author Contributions
Conceptualization, W.R.S. and D.H.; methodology, D.H., R.M.S. and W.R.S.; investigation, W.R.S., M.F.S.G., A.O.S. and P.R.A.; data curation W.R.S., A.O.S. and P.R.A.; writing—original draft preparation, W.R.S. and M.F.S.G.; writing—review and editing, W.R.S., D.H. and R.M.S.; visualization, R.M.S.; supervision, D.H. and R.M.S.; project administration, R.M.S. and D.H.; funding acquisition, D.H. and R.M.S. All authors have read and agreed to the published version of the manuscript.
Funding
Funding for DNA extraction and the oil and protein analysis was provided by the Kentucky Soybean Board, and CGH analysis was provided by the United Soybean Board, Project #1520-532-5603.
Institutional Review Board Statement
Not applicable.
Informed Consent Statement
Not applicable.
Data Availability Statement
All relevant and pertinent data are made available in the manuscript. We encourage anyone with questions to contact William Serson for further information: wrs5272@psu.edu.
Acknowledgments
We would like to thank Evie Beckert, Kai Su, and Jeff Roessler for their assistance in the maintenance and harvesting of these soybeans in the field, as well as in the oil and protein analysis, and the University of Kentucky farm crew at Spindletop Farm for preparing the land. The mention of trade names or commercial products in this publication is solely for the purpose of providing specific information and does not imply recommendation or endorsement by the U.S. Department of Agriculture. USDA is an equal-opportunity provider and employer.
Conflicts of Interest
The authors declare no conflicts of interest.
References
- Goldberg, R.B.; Barker, S.J.; Perez-Grau, L. Regulation of gene expression during plant embryogenesis. Cell 1989, 56, 149–160. [Google Scholar] [CrossRef] [PubMed]
- Harwood, J.L.; Page, R.A. Biochemistry of oil synthesis. In Designer Oil Crops; Murphy, D.J., Ed.; VCH: Weinheim, Germany, 1994; pp. 165–194. [Google Scholar]
- Le, B.H.; Wagmaister, J.A.; Kawashima, T.; Bui, A.Q.; Harada, J.J.; Goldberg, R.B. Using genomics to study legume seed development. Plant Physiol. 2007, 144, 562–574. [Google Scholar] [CrossRef] [PubMed]
- Li, R.; Hatanaka, T.; Yu, K.; Wu, Y.; Fukushige, H.; Hildebrand, D. Soybean oil biosynthesis: Role of diacylglycerol acyltransferases. Funct. Integr. Genom. 2013, 13, 99–113. [Google Scholar] [CrossRef] [PubMed]
- Flyckt, K.S.; Roesler, K.; Haug Collet, K.; Jaureguy, L.; Booth, R.; Thatcher, S.R.; Everard, J.D.; Ripp, K.G.; Liu, Z.-B.; Shen, B. A Novel Soybean Diacylglycerol Acyltransferase 1b Variant with Three Amino Acid Substitutions Increases Seed Oil Content. Plant Cell Physiol. 2023, 65, 872–884. [Google Scholar] [CrossRef] [PubMed]
- Torabi, S.; Sukumaran, A.; Dhaubhadel, S.; Johnson, S.E.; LaFayette, P.; Parrott, W.A.; Rajcan, I.; Eskandari, M. Effects of type I Diacylglycerol O-acyltransferase (DGAT1) genes on soybean (Glycine max L.) seed composition. Sci. Rep. 2021, 11, 2556. [Google Scholar] [CrossRef] [PubMed]
- Rao, S.; Hildebrand, D. Changes in Oil Content of Transgenic Soybeans Expressing the Yeast SLC1 Gene. Lipids 2009, 44, 945–951. [Google Scholar] [CrossRef] [PubMed]
- Taylor, D.C.; Yan, Z.; Kumar, A.; Francis, T.; Giblin, E.M.; Barton, D.L.; Ferrie, J.R.; Laroche, A.; Shah, S.; Weiming, Z.; et al. Molecular modification of triacylglycerol accumulation by over-expression of DGAT1 to produce canola with increased seed oil content under field conditions. Botany 2009, 87, 533–543. [Google Scholar] [CrossRef]
- Andrianov, V.; Borisjuk, N.; Pogrebnyak, N.; Brinker, A.; Dixon, J.; Spitsin, S.; Flynn, J.; Matyszczuk, P.; Andryszak, K.; Laurelli, M.; et al. Tobacco as a production platform for biofuel: Overexpression of Arabidopsis DGAT and LEC2 genes increases accumulation and shifts the composition of lipids in green biomass. Plant Biotechnol. J. 2010, 8, 277–287. [Google Scholar] [CrossRef] [PubMed]
- Van Erp, H.; Kelly, A.A.; Menard, G.; Eastmond, P.J. Multigene engineering of triacylglycerol metabolism boosts seed oil content in Arabidopsis. Plant Physiol. 2014, 165, 30–36. [Google Scholar] [CrossRef]
- Vanhercke, T.; El Tahchy, A.; Shrestha, P.; Zhou, X.-R.; Singh, S.P.; Petrie, J.R. Synergistic effect of WRI1 and DGAT1 coexpression on triacylglycerol biosynthesis in plants. FEBS Lett. 2013, 587, 364–369. [Google Scholar] [CrossRef]
- Vanhercke, T.; El Tahchy, A.; Liu, Q.; Zhou, X.-R.; Shrestha, P.; Divi, U.K.; Ral, J.-P.; Mansour, M.P.; Nichols, P.D.; James, C.N.; et al. Metabolic engineering of biomass for high energy density: Oilseed-like triacylglycerol yields from plant leaves. Plant Biotechnol. J. 2014, 12, 231–239. [Google Scholar] [CrossRef] [PubMed]
- Rotundo, J.L.; Borrás, L.; Westgate, M.E. Linking assimilate supply and seed developmental processes that determine soybean seed composition. Eur. J. Agron. 2011, 35, 184–191. [Google Scholar] [CrossRef]
- Carter, T.E.; Rzewnicki, P.E.; Burton, J.W.; Villagarcia, M.R.; Bowman, D.T.; Taliercio, E.; Kwanyuen, P. Registration of N6202 soybean germplasm with high protein, favorable yield potential, large seed, and diverse pedigree. J. Plant Regist. 2010, 4, 73–79. [Google Scholar] [CrossRef]
- Vollmann, J.; Fritz, C.N.; Wagentristl, H.; Ruckenbauer, P. Environmental and genetic variation of soybean seed protein content under Central European growing conditions. J. Sci. Food Agric. 2000, 80, 1300–1306. [Google Scholar] [CrossRef]
- Bezie, Y.; Tilahun, T.; Atnaf, M.; Taye, M. The potential applications of site-directed mutagenesis for crop improvement: A review. J. Crop Sci. Biotechnol. 2021, 24, 229–244. [Google Scholar] [CrossRef]
- Bolon, Y.-T.; Haun, W.J.; Xu, W.W.; Grant, D.; Stacey, M.G.; Nelson, R.T.; Gerhardt, D.J.; Jeddeloh, J.A.; Stacey, G.; Muehlbauer, G.J.; et al. Phenotypic and Genomic Analyses of a Fast Neutron Mutant Population Resource in Soybean. Plant Physiol. 2011, 156, 240–253. [Google Scholar] [CrossRef] [PubMed]
- Dobbels, A.A.; Michno, J.-M.; Campbell, B.W.; Virdi, K.S.; Stec, A.O.; Muehlbauer, G.J.; Naeve, S.L.; Stupar, R.M. An induced chromosomal translocation in soybean disrupts a KASI ortholog and is associated with a high-sucrose and low-oil seed phenotype. G3 Genes Genomes Genet. 2017, 7, 1215–1223. [Google Scholar] [CrossRef] [PubMed]
- Wyant, S.R.; Rodriguez, M.F.; Carter, C.K.; Parrott, W.A.; Jackson, S.A.; Stupar, R.M.; Morrell, P.L. Fast neutron mutagenesis in soybean enriches for small indels and creates frameshift mutations. G3 Genes Genomes Genet. 2022, 12, jkab431. [Google Scholar] [CrossRef]
- Campbell, B.W.; Hofstad, A.N.; Sreekanta, S.; Fu, F.; Kono, T.J.Y.; O’Rourke, J.A.; Vance, C.P.; Muehlbauer, G.J.; Stupar, R.M. Fast neutron-induced structural rearrangements at a soybean NAP1 locus result in gnarled trichomes. Theor. Appl. Genet. 2016, 129, 1725–1738. [Google Scholar] [CrossRef]
- Prenger, E.M.; Ostezan, A.; Mian, M.A.R.; Stupar, R.M.; Glenn, T.; Li, Z. Identification and characterization of a fast-neutron-induced mutant with elevated seed protein content in soybean. Theor. Appl. Genet. 2019, 132, 2965–2983. [Google Scholar] [CrossRef]
- Ostezan, A.; Prenger, E.M.; Rosso, L.; Zhang, B.; Stupar, R.M.; Glenn, T.; Mian, M.A.R.; Li, Z. A chromosome 16 deletion conferring a high sucrose phenotype in soybean. Theor. Appl. Genet. 2023, 136, 109. [Google Scholar] [CrossRef] [PubMed]
- Islam, N.; Stupar, R.M.; Qijian, S.; Luthria, D.L.; Garrett, W.; Stec, A.O.; Roessler, J.; Natarajan, S.S. Genomic changes and biochemical alterations of seed protein and oil content in a subset of fast neutron induced soybean mutants. BMC Plant Biol. 2019, 19, 420. [Google Scholar] [CrossRef] [PubMed]
- Bolon, Y.-T.; Stec, A.O.; Michno, J.-M.; Roessler, J.; Bhaskar, P.B.; Ries, L.; Dobbels, A.A.; Campbell, B.W.; Young, N.P.; Anderson, J.E.; et al. Genome Resilience and Prevalence of Segmental Duplications Following Fast Neutron Irradiation of Soybean. Genetics 2014, 198, 967–981. [Google Scholar] [CrossRef] [PubMed]
- Armstrong, P.R.; Tallada, J.G.; Hurburgh, C.; Hildebrand, D.F.; Specht, J.E. Development of single-seed near-infrared spectroscopic predictions of corn and soybean constituents using bulk reference values and mean spectra. Trans. ASABE 2011, 54, 1529–1535. [Google Scholar] [CrossRef]
- Jiang, G.-L. Comparison and application of non-destructive NIR evaluations of seed protein and oil content in soybean breeding. Agronomy 2020, 10, 77. [Google Scholar] [CrossRef]
- Serson, W.; Armstrong, P.; Maghirang, E.; Al-Bakri, A.; Phillips, T.; Al-Amery, M.; Su, K.; Hildebrand, D. Development of Whole and Ground Seed Near-Infrared Spectroscopy Calibrations for Oil, Protein, Moisture, and Fatty Acids in Salvia hispanica. J. Am. Oil Chem. Soc. 2020, 97, 3–13. [Google Scholar] [CrossRef]
- Orf, J.H.; Denny, R.L. Registration of ‘MN1302’ Soybean. Crop Sci. 2004, 44, 693. [Google Scholar] [CrossRef]
- Till, B.J.; Jankowicz-Cieslak, J.; Huynh, O.A.; Beshir, M.M.; Laport, R.G.; Hofinger, B.J.; Till, B.J.; Jankowicz-Cieslak, J.; Huynh, O.A.; Beshir, M.M. Sample collection and storage. In Low-Cost Methods for Molecular Characterization of Mutant Plants: Tissue Desiccation, DNA Extraction and Mutation Discovery: Protocols; Till, B.J., Jankowicz-Cieslak, J., Huynh, O.A., Beshir, M.M., Laport, R.G., Hofinger, B.J., Eds.; Springer: Berlin/Heidelberg, Germany, 2015; pp. 9–11. [Google Scholar]
- Omasits, U.; Ahrens, C.H.; Müller, S.; Wollscheid, B. Protter: Interactive protein feature visualization and integration with experimental proteomic data. Bioinformatics 2014, 30, 884–886. [Google Scholar] [CrossRef]
- Szklarczyk, D.; Kirsch, R.; Koutrouli, M.; Nastou, K.; Mehryary, F.; Hachilif, R.; Gable, A.L.; Fang, T.; Doncheva, N.T.; Pyysalo, S. The STRING database in 2023: Protein–protein association networks and functional enrichment analyses for any sequenced genome of interest. Nucleic Acids Res. 2023, 51, D638–D646. [Google Scholar] [CrossRef] [PubMed]
- Kelley, L.A.; Mezulis, S.; Yates, C.M.; Wass, M.N.; Sternberg, M.J. The Phyre2 web portal for protein modeling, prediction and analysis. Nat. Protoc. 2015, 10, 845–858. [Google Scholar] [CrossRef]
- Yang, Z.; Lasker, K.; Schneidman-Duhovny, D.; Webb, B.; Huang, C.C.; Pettersen, E.F.; Goddard, T.D.; Meng, E.C.; Sali, A.; Ferrin, T.E. UCSF Chimera, MODELLER, and IMP: An integrated modeling system. J. Struct. Biol. 2012, 179, 269–278. [Google Scholar] [CrossRef] [PubMed]
- Turek, I.; Wheeler, J.; Bartels, S.; Szczurek, J.; Wang, Y.H.; Taylor, P.; Gehring, C.; Irving, H. A natriuretic peptide from Arabidopsis thaliana (AtPNP-A) can modulate catalase 2 activity. Sci. Rep. 2020, 10, 19632. [Google Scholar] [CrossRef] [PubMed]
- Eudes, A.; Kunji, E.R.; Noiriel, A.; Klaus, S.M.; Vickers, T.J.; Beverley, S.M.; Gregory, J.F.; Hanson, A.D. Identification of transport-critical residues in a folate transporter from the folate-biopterin transporter (FBT) family. J. Biol. Chem. 2010, 285, 2867–2875. [Google Scholar] [CrossRef] [PubMed]
- Ozyigit, I.I.; Filiz, E.; Vatansever, R.; Kurtoglu, K.Y.; Koc, I.; Öztürk, M.X.; Anjum, N.A. Identification and comparative analysis of H2O2-scavenging enzymes (ascorbate peroxidase and glutathione peroxidase) in selected plants employing bioinformatics approaches. Front. Plant Sci. 2016, 7, 301. [Google Scholar] [CrossRef] [PubMed]
- Chang, C.C.; Slesak, I.; Jordá, L.; Sotnikov, A.; Melzer, M.; Miszalski, Z.; Mullineaux, P.M.; Parker, J.E.; Karpinska, B.; Karpinski, S. Arabidopsis chloroplastic glutathione peroxidases play a role in cross talk between photooxidative stress and immune responses. Plant Physiol. 2009, 150, 670–683. [Google Scholar] [CrossRef] [PubMed]
- Santamaría, M.E.; Arnaiz, A.; Velasco-Arroyo, B.; Grbic, V.; Diaz, I.; Martinez, M. Arabidopsis response to the spider mite Tetranychus urticae depends on the regulation of reactive oxygen species homeostasis. Sci. Rep. 2018, 8, 9432. [Google Scholar] [CrossRef] [PubMed]
- Sun, X.; Matus, J.T.; Wong, D.C.J.; Wang, Z.; Chai, F.; Zhang, L.; Fang, T.; Zhao, L.; Wang, Y.; Han, Y. The GARP/MYB-related grape transcription factor AQUILO improves cold tolerance and promotes the accumulation of raffinose family oligosaccharides. J. Exp. Bot. 2018, 69, 1749–1764. [Google Scholar] [CrossRef] [PubMed]
- Koschmieder, J.; Wüst, F.; Schaub, P.; Álvarez, D.; Trautmann, D.; Krischke, M.; Rustenholz, C.; Mano, J.i.; Mueller, M.J.; Bartels, D. Plant apocarotenoid metabolism utilizes defense mechanisms against reactive carbonyl species and xenobiotics. Plant Physiol. 2021, 185, 331–351. [Google Scholar] [CrossRef] [PubMed]
- Zhang, Q.; Dai, X.; Wang, H.; Wang, F.; Tang, D.; Jiang, C.; Zhang, X.; Guo, W.; Lei, Y.; Ma, C. Transcriptomic Profiling Provides Molecular Insights into Hydrogen Peroxide-Enhanced Arabidopsis Growth and Its Salt Tolerance. Front. Plant Sci. 2022, 13, 866063. [Google Scholar] [CrossRef]
- Lazzarotto, F.; Wahni, K.; Piovesana, M.; Maraschin, F.; Messens, J.; Margis-Pinheiro, M. Arabidopsis APx-R is a plastidial ascorbate-independent peroxidase regulated by photomorphogenesis. Antioxidants 2021, 10, 65. [Google Scholar] [CrossRef]
- Stock, J.; Bräutigam, A.; Melzer, M.; Bienert, G.P.; Bunk, B.; Nagel, M.; Overmann, J.; Keller, E.J.; Mock, H.-P. The transcription factor WRKY22 is required during cryo-stress acclimation in Arabidopsis shoot tips. J. Exp. Bot. 2020, 71, 4993–5009. [Google Scholar] [CrossRef] [PubMed]
- Passaia, G.; Queval, G.; Bai, J.; Margis-Pinheiro, M.; Foyer, C.H. The effects of redox controls mediated by glutathione peroxidases on root architecture in Arabidopsis thaliana. J. Exp. Bot. 2014, 65, 1403–1413. [Google Scholar] [CrossRef] [PubMed]
- Luo, M.; Liu, X.; Su, H.; Li, M.; Li, M.; Wei, J. Regulatory Networks of Flowering Genes in Angelica sinensis during Vernalization. Plants 2022, 11, 1355. [Google Scholar] [CrossRef] [PubMed]
- Jia, F.; Gampala, S.S.; Mittal, A.; Luo, Q.; Rock, C.D. Cre-lox univector acceptor vectors for functional screening in protoplasts: Analysis of Arabidopsis donor cDNAs encoding ABSCISIC ACID INSENSITIVE1-like protein phosphatases. Plant Mol. Biol. 2009, 70, 693–708. [Google Scholar] [CrossRef]
- Suzuki, M.; Ketterling, M.G.; Li, Q.-B.; McCarty, D.R. Viviparous1 alters global gene expression patterns through regulation of abscisic acid signaling. Plant Physiol. 2003, 132, 1664–1677. [Google Scholar] [CrossRef] [PubMed]
- Ramel, F.; Sulmon, C.; Cabello-Hurtado, F.; Taconnat, L.; Martin-Magniette, M.-L.; Renou, J.-P.; El Amrani, A.; Couée, I.; Gouesbet, G. Genome-wide interacting effects of sucrose and herbicide-mediated stress in Arabidopsis thaliana: Novel insights into atrazine toxicity and sucrose-induced tolerance. BMC Genom. 2007, 8, 450. [Google Scholar] [CrossRef] [PubMed]
- Dong, P.; Xiong, F.; Que, Y.; Wang, K.; Yu, L.; Li, Z.; Ren, M. Expression profiling and functional analysis reveals that TOR is a key player in regulating photosynthesis and phytohormone signaling pathways in Arabidopsis. Front. Plant Sci. 2015, 6, 677. [Google Scholar] [CrossRef]
- Leonhardt, N.; Kwak, J.M.; Robert, N.; Waner, D.; Leonhardt, G.; Schroeder, J.I. Microarray expression analyses of Arabidopsis guard cells and isolation of a recessive abscisic acid hypersensitive protein phosphatase 2C mutant. Plant Cell 2004, 16, 596–615. [Google Scholar] [CrossRef]
- Luna, E.; Van Hulten, M.; Zhang, Y.; Berkowitz, O.; López, A.; Pétriacq, P.; Sellwood, M.A.; Chen, B.; Burrell, M.; Van De Meene, A. Plant perception of β-aminobutyric acid is mediated by an aspartyl-tRNA synthetase. Nat. Chem. Biol. 2014, 10, 450–456. [Google Scholar] [CrossRef]
- Fabro, G.; Di Rienzo, J.A.; Voigt, C.A.; Savchenko, T.; Dehesh, K.; Somerville, S.; Alvarez, M.E. Genome-wide expression profiling Arabidopsis at the stage of Glovinomyces cichoracearum haustorium formation. Plant Physiol. 2008, 146, 1421–1439. [Google Scholar] [CrossRef]
- Bai, B.; Van Der Horst, S.; Cordewener, J.H.; America, T.A.; Hanson, J.; Bentsink, L. Seed-stored mRNAs that are specifically associated to monosomes are translationally regulated during germination. Plant Physiol. 2020, 182, 378–392. [Google Scholar] [CrossRef] [PubMed]
- Schwarzenbacher, R.E.; Wardell, G.; Stassen, J.; Guest, E.; Zhang, P.; Luna, E.; Ton, J. The IBI1 receptor of β-aminobutyric acid interacts with VOZ transcription factors to regulate abscisic acid signaling and callose-associated defense. Mol. Plant 2020, 13, 1455–1469. [Google Scholar] [CrossRef] [PubMed]
- Knuesting, J.; Riondet, C.; Maria, C.; Kruse, I.; Bécuwe, N.; König, N.; Berndt, C.; Tourrette, S.; Guilleminot-Montoya, J.; Herrero, E. Arabidopsis glutaredoxin S17 and its partner, the nuclear factor Y subunit C11/negative cofactor 2α, contribute to maintenance of the shoot apical meristem under long-day photoperiod. Plant Physiol. 2015, 167, 1643–1658. [Google Scholar] [CrossRef] [PubMed]
- Duchêne, A.-M.; Giritch, A.; Hoffmann, B.; Cognat, V.; Lancelin, D.; Peeters, N.M.; Zaepfel, M.; Maréchal-Drouard, L.; Small, I.D. Dual targeting is the rule for organellar aminoacyl-tRNA synthetases in Arabidopsis thaliana. Proc. Natl. Acad. Sci. USA 2005, 102, 16484–16489. [Google Scholar] [CrossRef] [PubMed]
- Waterworth, W.M.; Latham, R.; Wang, D.; Alsharif, M.; West, C.E. Seed DNA damage responses promote germination and growth in Arabidopsis thaliana. Proc. Natl. Acad. Sci. USA 2022, 119, e2202172119. [Google Scholar] [CrossRef] [PubMed]
- Mróz, T.L.; Eves-van den Akker, S.; Bernat, A.; Skarzyńska, A.; Pryszcz, L.; Olberg, M.; Havey, M.J.; Bartoszewski, G. Transcriptome analyses of mosaic (MSC) mitochondrial mutants of cucumber in a highly inbred nuclear background. G3 Genes Genomes Genet. 2018, 8, 953–965. [Google Scholar] [CrossRef] [PubMed]
- Dietzen, C.; Koprivova, A.; Whitcomb, S.J.; Langen, G.; Jobe, T.O.; Hoefgen, R.; Kopriva, S. The transcription factor EIL1 participates in the regulation of sulfur-deficiency response. Plant Physiol. 2020, 184, 2120–2136. [Google Scholar] [CrossRef] [PubMed]
- Kim, J.-S.; Lim, J.Y.; Shin, H.; Kim, B.-G.; Yoo, S.-D.; Kim, W.T.; Huh, J.H. ROS1-dependent DNA demethylation is required for ABA-inducible NIC3 expression. Plant Physiol. 2019, 179, 1810–1821. [Google Scholar] [CrossRef] [PubMed]
- Rasheed, S.; Bashir, K.; Kim, J.-M.; Ando, M.; Tanaka, M.; Seki, M. The modulation of acetic acid pathway genes in Arabidopsis improves survival under drought stress. Sci. Rep. 2018, 8, 7831. [Google Scholar] [CrossRef]
- Lian, J.-l.; Ren, L.-S.; Zhang, C.; Yu, C.-Y.; Huang, Z.; Xu, A.-X.; Dong, J.-G. How exposure to ALS-inhibiting gametocide tribenuron-methyl induces male sterility in rapeseed. BMC Plant Biol. 2019, 19, 124. [Google Scholar] [CrossRef]
- Lange, H.; Holec, S.; Cognat, V.; Pieuchot, L.; Le Ret, M.; Canaday, J.; Gagliardi, D. Degradation of a polyadenylated rRNA maturation by-product involves one of the three RRP6-like proteins in Arabidopsis thaliana. Mol. Cell. Biol. 2008, 28, 3038–3044. [Google Scholar] [CrossRef] [PubMed]
- Guo, X.; Wang, Y.; Hou, Y.; Zhou, Z.; Sun, R.; Qin, T.; Wang, K.; Liu, F.; Wang, Y.; Huang, Z. Genome-wide dissection of the genetic basis for drought tolerance in Gossypium hirsutum L. races. Front. Plant Sci. 2022, 13, 876095. [Google Scholar] [CrossRef] [PubMed]
- Lange, H.; Gagliardi, D. Catalytic activities, molecular connections, and biological functions of plant RNA exosome complexes. Plant Cell 2022, 34, 967–988. [Google Scholar] [CrossRef] [PubMed]
- Duruflé, H.; Ranocha, P.; Balliau, T.; Zivy, M.; Albenne, C.; Burlat, V.; Déjean, S.; Jamet, E.; Dunand, C. An integrative study showing the adaptation to sub-optimal growth conditions of natural populations of Arabidopsis thaliana: A focus on cell wall changes. Cells 2020, 9, 2249. [Google Scholar] [CrossRef] [PubMed]
- Pasoreck, E.K.; Su, J.; Silverman, I.M.; Gosai, S.J.; Gregory, B.D.; Yuan, J.S.; Daniell, H. Terpene metabolic engineering via nuclear or chloroplast genomes profoundly and globally impacts off-target pathways through metabolite signalling. Plant Biotechnol. J. 2016, 14, 1862–1875. [Google Scholar] [CrossRef]
- Roomi, S.; Masi, A.; Conselvan, G.B.; Trevisan, S.; Quaggiotti, S.; Pivato, M.; Arrigoni, G.; Yasmin, T.; Carletti, P. Protein profiling of Arabidopsis roots treated with humic substances: Insights into the metabolic and interactome networks. Front. Plant Sci. 2018, 9, 1812. [Google Scholar] [CrossRef]
- Nintemann, S.J.; Vik, D.; Svozil, J.; Bak, M.; Baerenfaller, K.; Burow, M.; Halkier, B.A. Unravelling protein-protein interaction networks linked to aliphatic and indole glucosinolate biosynthetic pathways in Arabidopsis. Front. Plant Sci. 2017, 8, 2028. [Google Scholar] [CrossRef]
- Haga, N.; Kobayashi, K.; Suzuki, T.; Maeo, K.; Kubo, M.; Ohtani, M.; Mitsuda, N.; Demura, T.; Nakamura, K.; Jürgens, G. Mutations in MYB3R1 and MYB3R4 cause pleiotropic developmental defects and preferential down-regulation of multiple G2/M-specific genes in Arabidopsis. Plant Physiol. 2011, 157, 706–717. [Google Scholar] [CrossRef]
- Teaster, N.D.; Motes, C.M.; Tang, Y.; Wiant, W.C.; Cotter, M.Q.; Wang, Y.-S.; Kilaru, A.; Venables, B.J.; Hasenstein, K.H.; Gonzalez, G. N-Acylethanolamine metabolism interacts with abscisic acid signaling in Arabidopsis thaliana seedlings. Plant Cell 2007, 19, 2454–2469. [Google Scholar] [CrossRef]
- Shaar-Moshe, L.; Hübner, S.; Peleg, Z. Identification of conserved drought-adaptive genes using a cross-species meta-analysis approach. BMC Plant Biol. 2015, 15, 111. [Google Scholar] [CrossRef]
- Movahedi, S.; Van de Peer, Y.; Vandepoele, K. Comparative network analysis reveals that tissue specificity and gene function are important factors influencing the mode of expression evolution in Arabidopsis and rice. Plant Physiol. 2011, 156, 1316–1330. [Google Scholar] [CrossRef] [PubMed]
- Verdier, J.; Lalanne, D.; Pelletier, S.; Torres-Jerez, I.; Righetti, K.; Bandyopadhyay, K.; Leprince, O.; Chatelain, E.; Vu, B.L.; Gouzy, J. A regulatory network-based approach dissects late maturation processes related to the acquisition of desiccation tolerance and longevity of Medicago truncatula seeds. Plant Physiol. 2013, 163, 757–774. [Google Scholar] [CrossRef] [PubMed]
- Amil-Ruiz, F.; Garrido-Gala, J.; Gadea, J.; Blanco-Portales, R.; Muñoz-Mérida, A.; Trelles, O.; de Los Santos, B.; Arroyo, F.T.; Aguado-Puig, A.; Romero, F. Partial activation of SA-and JA-defensive pathways in strawberry upon Colletotrichum acutatum interaction. Front. Plant Sci. 2016, 7, 1036. [Google Scholar] [CrossRef] [PubMed]
- Yin, Z.; Balmant, K.; Geng, S.; Zhu, N.; Zhang, T.; Dufresne, C.; Dai, S.; Chen, S. Bicarbonate induced redox proteome changes in Arabidopsis suspension cells. Front. Plant Sci. 2017, 8, 58. [Google Scholar] [CrossRef] [PubMed]
- Jung, S.; Main, D.; Staton, M.; Cho, I.; Zhebentyayeva, T.; Arús, P.; Abbott, A. Synteny conservation between the Prunus genome and both the present and ancestral Arabidopsis genomes. BMC Genom. 2006, 7, 81. [Google Scholar] [CrossRef] [PubMed]
- Song, D.; Xi, W.; Shen, J.; Bi, T.; Li, L. Characterization of the plasma membrane proteins and receptor-like kinases associated with secondary vascular differentiation in poplar. Plant Mol. Biol. 2011, 76, 97–115. [Google Scholar] [CrossRef] [PubMed]
- Petridis, A.; Döll, S.; Nichelmann, L.; Bilger, W.; Mock, H.P. Arabidopsis thaliana G2-LIKE FLAVONOID REGULATOR and BRASSINOSTEROID ENHANCED EXPRESSION1 are low-temperature regulators of flavonoid accumulation. New Phytol. 2016, 211, 912–925. [Google Scholar] [CrossRef] [PubMed]
- Yang, M.; Yang, H.; Kuang, R.; Zhou, C.; Huang, B.; Wei, Y. Genome-wide analysis of basic helix-loop-helix (bHLH) transcription factors in papaya (Carica papaya L.). PeerJ 2019, 8, e9319. [Google Scholar] [CrossRef] [PubMed]
- Cifuentes-Esquivel, N.; Bou-Torrent, J.; Galstyan, A.; Gallemí, M.; Sessa, G.; Salla Martret, M.; Roig-Villanova, I.; Ruberti, I.; Martínez-García, J.F. The b HLH proteins BEE and BIM positively modulate the shade avoidance syndrome in Arabidopsis seedlings. Plant J. 2013, 75, 989–1002. [Google Scholar] [CrossRef]
- Pathak, A.K.; Singh, S.P.; Sharma, R.; Nath, V.; Tuli, R. Transcriptome analysis at mid-stage seed development in litchi with contrasting seed size. 3 Biotech 2022, 12, 47. [Google Scholar] [CrossRef]
- Yuan, L.-B.; Chen, L.; Zhai, N.; Zhou, Y.; Zhao, S.-S.; Shi, L.-L.; Xiao, S.; Yu, L.-J.; Xie, L.-J. The anaerobic product ethanol promotes autophagy-dependent submergence tolerance in Arabidopsis. Int. J. Mol. Sci. 2020, 21, 7361. [Google Scholar] [CrossRef] [PubMed]
- Friedrichsen, D.M.; Nemhauser, J.; Muramitsu, T.; Maloof, J.N.; Alonso, J.; Ecker, J.R.; Furuya, M.; Chory, J. Three redundant brassinosteroid early response genes encode putative bHLH transcription factors required for normal growth. Genetics 2002, 162, 1445–1456. [Google Scholar] [CrossRef] [PubMed]
- Liu, H.; Xiao, S.; Sui, S.; Huang, R.; Wang, X.; Wu, H.; Liu, X. A tandem CCCH type zinc finger protein gene CpC3H3 from Chimonanthus praecox promotes flowering and enhances drought tolerance in Arabidopsis. BMC Plant Biol. 2022, 22, 506. [Google Scholar] [CrossRef] [PubMed]
- Wang, F.; Gao, Y.; Liu, Y.; Zhang, X.; Gu, X.; Ma, D.; Zhao, Z.; Yuan, Z.; Xue, H.; Liu, H. BES1-regulated BEE1 controls photoperiodic flowering downstream of blue light signaling pathway in Arabidopsis. New Phytol. 2019, 223, 1407–1419. [Google Scholar] [CrossRef] [PubMed]
- Cao, J.; Liang, Y.; Yan, T.; Wang, X.; Zhou, H.; Chen, C.; Zhang, Y.; Zhang, B.; Zhang, S.; Liao, J. The photomorphogenic repressors BBX28 and BBX29 integrate light and brassinosteroid signaling to inhibit seedling development in Arabidopsis. Plant Cell 2022, 34, 2266–2285. [Google Scholar] [CrossRef] [PubMed]
- Zhang, X.-Y.; Qiu, J.-Y.; Hui, Q.-L.; Xu, Y.-Y.; He, Y.-Z.; Peng, L.-Z.; Fu, X.-Z. Systematic analysis of the basic/helix-loop-helix (bHLH) transcription factor family in pummelo (Citrus grandis) and identification of the key members involved in the response to iron deficiency. BMC Genom. 2020, 21, 233. [Google Scholar] [CrossRef] [PubMed]
- Martínez-García, P.J.; Parfitt, D.E.; Bostock, R.M.; Fresnedo-Ramirez, J.; Vazquez-Lobo, A.; Ogundiwin, E.A.; Gradziel, T.M.; Crisosto, C.H. Application of genomic and quantitative genetic tools to identify candidate resistance genes for brown rot resistance in peach. PLoS ONE 2013, 8, e78634. [Google Scholar] [CrossRef]
- Herbert, D.B.; Gross, T.; Rupp, O.; Becker, A. Transcriptome analysis reveals major transcriptional changes during regrowth after mowing of red clover (Trifolium pratense). BMC Plant Biol. 2021, 21, 95. [Google Scholar] [CrossRef] [PubMed]
- Lestari, P.; Van, K.; Lee, J.; Kang, Y.J.; Lee, S.-H. Gene divergence of homeologous regions associated with a major seed protein content QTL in soybean. Front. Plant Sci. 2013, 4, 176. [Google Scholar] [CrossRef]
- Luttgeharm, K.D.; Chen, M.; Mehra, A.; Cahoon, R.E.; Markham, J.E.; Cahoon, E.B. Overexpression of Arabidopsis ceramide synthases differentially affects growth, sphingolipid metabolism, programmed cell death, and mycotoxin resistance. Plant Physiol. 2015, 169, 1108–1117. [Google Scholar] [CrossRef]
- Corral, J.M.; Vogel, H.; Aliyu, O.M.; Hensel, G.; Thiel, T.; Kumlehn, J.; Sharbel, T.F. A conserved apomixis-specific polymorphism is correlated with exclusive exonuclease expression in premeiotic ovules of apomictic Boechera species. Plant Physiol. 2013, 163, 1660–1672. [Google Scholar] [CrossRef] [PubMed]
- Vargas, J.; Gómez, I.; Vidal, E.A.; Lee, C.P.; Millar, A.H.; Jordana, X.; Roschzttardtz, H. Growth Developmental Defects of Mitochondrial Iron Transporter 1 and 2 Mutants in Arabidopsis in Iron Sufficient Conditions. Plants 2023, 12, 1176. [Google Scholar] [CrossRef]
- Krishnatreya, D.B.; Ray, D.; Baruah, P.M.; Dowarah, B.; Bordoloi, K.S.; Agarwal, H.; Agarwala, N. Identification of putative miRNAs from expressed sequence tags of Gnetum gnemon L. and their cross-kingdom targets. BioTechnologia 2021, 102, 179. [Google Scholar] [CrossRef]
- Xie, Y.; Straub, D.; Eguen, T.; Brandt, R.; Stahl, M.; Martínez-García, J.F.; Wenkel, S. Meta-analysis of Arabidopsis KANADI1 direct target genes identifies a basic growth-promoting module acting upstream of hormonal signaling pathways. Plant Physiol. 2015, 169, 1240–1253. [Google Scholar] [CrossRef] [PubMed]
- Sakai, T.; Haga, K. Molecular genetic analysis of phototropism in Arabidopsis. Plant Cell Physiol. 2012, 53, 1517–1534. [Google Scholar] [CrossRef] [PubMed]
- Huang, T.; Harrar, Y.; Lin, C.; Reinhart, B.; Newell, N.R.; Talavera-Rauh, F.; Hokin, S.A.; Barton, M.K.; Kerstetter, R.A. Arabidopsis KANADI1 acts as a transcriptional repressor by interacting with a specific cis-element and regulates auxin biosynthesis, transport, and signaling in opposition to HD-ZIPIII factors. Plant Cell 2014, 26, 246–262. [Google Scholar] [CrossRef]
- Li, Y.; Dai, X.; Cheng, Y.; Zhao, Y. NPY genes play an essential role in root gravitropic responses in Arabidopsis. Mol. Plant 2011, 4, 171–179. [Google Scholar] [CrossRef]
- Cheng, Y.; Qin, G.; Dai, X.; Zhao, Y. NPY genes and AGC kinases define two key steps in auxin-mediated organogenesis in Arabidopsis. Proc. Natl. Acad. Sci. USA 2008, 105, 21017–21022. [Google Scholar] [CrossRef]
- Cheng, Y.; Qin, G.; Dai, X.; Zhao, Y. NPY1, a BTB-NPH3-like protein, plays a critical role in auxin-regulated organogenesis in Arabidopsis. Proc. Natl. Acad. Sci. USA 2007, 104, 18825–18829. [Google Scholar] [CrossRef]
- Gipson, A.B.; Morton, K.J.; Rhee, R.J.; Simo, S.; Clayton, J.A.; Perrett, M.E.; Binkley, C.G.; Jensen, E.L.; Oakes, D.L.; Rouhier, M.F. Disruptions in valine degradation affect seed development and germination in Arabidopsis. Plant J. 2017, 90, 1029–1039. [Google Scholar] [CrossRef]
- Zhu, F.; Alseekh, S.; Koper, K.; Tong, H.; Nikoloski, Z.; Naake, T.; Liu, H.; Yan, J.; Brotman, Y.; Wen, W. Genome-wide association of the metabolic shifts underpinning dark-induced senescence in Arabidopsis. Plant Cell 2022, 34, 557–578. [Google Scholar] [CrossRef] [PubMed]
- Zhu, Q.; King, G.J.; Liu, X.; Shan, N.; Borpatragohain, P.; Baten, A.; Wang, P.; Luo, S.; Zhou, Q. Identification of SNP loci and candidate genes related to four important fatty acid composition in Brassica napus using genome wide association study. PLoS ONE 2019, 14, e0221578. [Google Scholar] [CrossRef] [PubMed]
- Carrie, C.; Venne, A.S.; Zahedi, R.P.; Soll, J. Identification of cleavage sites and substrate proteins for two mitochondrial intermediate peptidases in Arabidopsis thaliana. J. Exp. Bot. 2015, 66, 2691–2708. [Google Scholar] [CrossRef] [PubMed]
- Allen, A.M.; Lexer, C.; Hiscock, S.J. Comparative analysis of pistil transcriptomes reveals conserved and novel genes expressed in dry, wet, and semidry stigmas. Plant Physiol. 2010, 154, 1347–1360. [Google Scholar] [CrossRef] [PubMed]
- Binder, S. Branched-Chain Amino Acid Metabolism in Arabidopsis thaliana; The Arabidopsis Book/American Society of Plant Biologists: Rockville, MD, USA, 2010; Volume 8. [Google Scholar]
- Almeida, J.; Quadrana, L.; Asís, R.; Setta, N.; De Godoy, F.; Bermudez, L.; Otaiza, S.N.; Correa da Silva, J.V.; Fernie, A.R.; Carrari, F. Genetic dissection of vitamin E biosynthesis in tomato. J. Exp. Bot. 2011, 62, 3781–3798. [Google Scholar] [CrossRef] [PubMed]
- Le Boulch, P.; Poëssel, J.-L.; Roux, D.; Lugan, R. Molecular mechanisms of resistance to Myzus persicae conferred by the peach Rm2 gene: A multi-omics view. Front. Plant Sci. 2022, 13, 992544. [Google Scholar] [CrossRef] [PubMed]
- Yokoyama, R.; de Oliveira, M.V.; Kleven, B.; Maeda, H.A. The entry reaction of the plant shikimate pathway is subjected to highly complex metabolite-mediated regulation. Plant Cell 2021, 33, 671–696. [Google Scholar] [CrossRef] [PubMed]
- Qian, Y.; Lynch, J.H.; Guo, L.; Rhodes, D.; Morgan, J.A.; Dudareva, N. Completion of the cytosolic post-chorismate phenylalanine biosynthetic pathway in plants. Nat. Commun. 2019, 10, 15. [Google Scholar] [CrossRef]
- Tohge, T.; Watanabe, M.; Hoefgen, R.; Fernie, A.R. Shikimate and phenylalanine biosynthesis in the green lineage. Front. Plant Sci. 2013, 4, 62. [Google Scholar] [CrossRef]
- Tzin, V.; Galili, G. The Biosynthetic Pathways for Shikimate and Aromatic Amino Acids in Arabidopsis thaliana; The Arabidopsis Book/American Society of Plant Biologists: Rockville, MD, USA, 2010; Volume 8. [Google Scholar]
- Less, H.; Galili, G. Principal transcriptional programs regulating plant amino acid metabolism in response to abiotic stresses. Plant Physiol. 2008, 147, 316–330. [Google Scholar] [CrossRef]
- Less, H.; Galili, G. Coordinations between gene modules control the operation of plant amino acid metabolic networks. BMC Syst. Biol. 2009, 3, 14. [Google Scholar] [CrossRef] [PubMed]
- Schmid, M.W.; Heichinger, C.; Coman Schmid, D.; Guthörl, D.; Gagliardini, V.; Bruggmann, R.; Aluri, S.; Aquino, C.; Schmid, B.; Turnbull, L.A. Contribution of epigenetic variation to adaptation in Arabidopsis. Nat. Commun. 2018, 9, 4446. [Google Scholar] [CrossRef]
- Cvrčková, F.; Novotný, M.; Pícková, D.; Žárský, V. Formin homology 2 domains occur in multiple contexts in angiosperms. BMC Genom. 2004, 5, 44. [Google Scholar] [CrossRef] [PubMed]
- Janssen, B.J.; Thodey, K.; Schaffer, R.J.; Alba, R.; Balakrishnan, L.; Bishop, R.; Bowen, J.H.; Crowhurst, R.N.; Gleave, A.P.; Ledger, S. Global gene expression analysis of apple fruit development from the floral bud to ripe fruit. BMC Plant Biol. 2008, 8, 16. [Google Scholar] [CrossRef] [PubMed]
- Shang, G.-D.; Xu, Z.-G.; Wan, M.-C.; Wang, F.-X.; Wang, J.-W. FindIT2: An R/Bioconductor package to identify influential transcription factor and targets based on multi-omics data. BMC Genom. 2022, 23, 272. [Google Scholar] [CrossRef] [PubMed]
- Liu, Z.Q.; Shi, L.P.; Yang, S.; Qiu, S.S.; Ma, X.L.; Cai, J.S.; Guan, D.Y.; Wang, Z.H.; He, S.L. A conserved double-W box in the promoter of CaWRKY40 mediates autoregulation during response to pathogen attack and heat stress in pepper. Mol. Plant Pathol. 2021, 22, 3–18. [Google Scholar] [CrossRef]
- Bergmann, T.; Menkhaus, J.; Ye, W.; Schemmel, M.; Hasler, M.; Rietz, S.; Leckband, G.; Cai, D. QTL mapping and transcriptome analysis identify novel QTLs and candidate genes in Brassica villosa for quantitative resistance against Sclerotinia sclerotiorum. Theor. Appl. Genet. 2023, 136, 86. [Google Scholar] [CrossRef]
- Xu, X.; Chen, C.; Fan, B.; Chen, Z. Physical and functional interactions between pathogen-induced Arabidopsis WRKY18, WRKY40, and WRKY60 transcription factors. Plant Cell 2006, 18, 1310–1326. [Google Scholar] [CrossRef] [PubMed]
- Kashima, M.; Kamitani, M.; Nomura, Y.; Mori-Moriyama, N.; Betsuyaku, S.; Hirata, H.; Nagano, A.J. DeLTa-Seq: Direct-lysate targeted RNA-Seq from crude tissue lysate. Plant Methods 2022, 18, 99. [Google Scholar] [CrossRef]
- Che, Y.; Sun, Y.; Lu, S.; Zhao, F.; Hou, L.; Liu, X. AtWRKY40 functions in drought stress response in Arabidopsis thaliana. J. Plant Physiol. 2018, 54, 456–464. [Google Scholar]
- Chen, H.; Lai, Z.; Shi, J.; Xiao, Y.; Chen, Z.; Xu, X. Roles of Arabidopsis WRKY18, WRKY40 and WRKY60 transcription factors in plant responses to abscisic acid and abiotic stress. BMC Plant Biol. 2010, 10, 281. [Google Scholar] [CrossRef] [PubMed]
- Carrera, C.; Martínez, M.J.; Dardanelli, J.; Balzarini, M. Environmental Variation and Correlation of Seed Components in Nontransgenic Soybeans: Protein, Oil, Unsaturated Fatty Acids, Tocopherols, and Isoflavones. Crop Sci. 2011, 51, 800–809. [Google Scholar] [CrossRef]
- Ergo, V.V.; Veas, R.E.; Vega, C.R.C.; Lascano, R.; Carrera, C.S. Ecophysiological mechanisms underlying the positive relationship between seed protein concentration and yield in soybean under field heat and drought stress. J. Agron. Crop Sci. 2024, 210, e12703. [Google Scholar] [CrossRef]
- Fields, J.; Saxton, A.M.; Beyl, C.A.; Kopsell, D.A.; Cregan, P.B.; Hyten, D.L.; Cuvaca, I.; Pantalone, V.R. Seed Protein and Oil QTL in a Prominent Glycine max Genetic Pedigree: Enhancing Stability for Marker Assisted Selection. Agronomy 2023, 13, 567. [Google Scholar] [CrossRef]
- Allen, D.K.; Young, J.D. Carbon and nitrogen provisions alter the metabolic flux in developing soybean embryos. Plant Physiol. 2013, 161, 1458–1475. [Google Scholar] [CrossRef] [PubMed]
- Pavlovic, T.; Margarit, E.; Müller, G.L.; Saenz, E.; Ruzzo, A.I.; Drincovich, M.F.; Borrás, L.; Saigo, M.; Wheeler, M.C.G. Differential metabolic reprogramming in developing soybean embryos in response to nutritional conditions and abscisic acid. Plant Mol. Biol. 2023, 113, 89–103. [Google Scholar] [CrossRef]
- Schwender, J. Walking the ‘design–build–test–learn’cycle: Flux analysis and genetic engineering reveal the pliability of plant central metabolism. New Phytol. 2023, 239, 1539–1541. [Google Scholar] [CrossRef] [PubMed]
- Focks, N.; Benning, C. wrinkled1: A Novel, Low-Seed-Oil Mutant of Arabidopsis with a Deficiency in the Seed-Specific Regulation of Carbohydrate Metabolism. Plant Physiol. 1998, 118, 91–101. [Google Scholar] [CrossRef] [PubMed]
- Jo, L.; Pelletier, J.; Harada, J.J. Genome-Wide Profiling of Soybean WRINKLED1 Transcription Factor Binding Sites Provides Insight into the Regulation of Fatty Acid and Triacylglycerol Biosynthesis Program in Seeds. bioRxiv 2024. [CrossRef]
- Sidorov, R.A.; Tsydendambaev, V.D. Biosynthesis of fatty oils in higher plants. Russ. J. Plant Physiol. 2014, 61, 1–18. [Google Scholar] [CrossRef]
- Weselake, R.J.; Shah, S.; Tang, M.; Quant, P.A.; Snyder, C.L.; Furukawa-Stoffer, T.L.; Zhu, W.; Taylor, D.C.; Zou, J.; Kumar, A.; et al. Metabolic control analysis is helpful for informed genetic manipulation of oilseed rape (Brassica napus) to increase seed oil content. J. Exp. Bot. 2008, 59, 3543–3549. [Google Scholar] [CrossRef] [PubMed]
- Roesler, K.; Shen, B.; Bermudez, E.; Li, C.; Hunt, J.; Damude, H.G.; Ripp, K.G.; Everard, J.D.; Booth, J.R.; Castaneda, L.; et al. An Improved Variant of Soybean Type 1 Diacylglycerol Acyltransferase Increases the Oil Content and Decreases the Soluble Carbohydrate Content of Soybeans. Plant Physiol. 2016, 171, 878–893. [Google Scholar] [CrossRef] [PubMed]
- Hatanaka, T.; Serson, W.; Li, R.; Armstrong, P.; Yu, K.; Pfeiffer, T.; Li, X.-L.; Hildebrand, D. A Vernonia Diacylglycerol Acyltransferase Can Increase Renewable Oil Production. J. Agric. Food Chem. 2016, 64, 7188–7194. [Google Scholar] [CrossRef] [PubMed]
- Kelly, A.A.; Shaw, E.; Powers, S.J.; Kurup, S.; Eastmond, P.J. Suppression of the SUGAR-DEPENDENT1 triacylglycerol lipase family during seed development enhances oil yield in oilseed rape (Brassica napus L.). Plant Biotechnol. J. 2013, 11, 355–361. [Google Scholar] [CrossRef] [PubMed]
- Ma, W.; Kong, Q.; Grix, M.; Mantyla, J.J.; Yang, Y.; Benning, C.; Ohlrogge, J.B. Deletion of a C–terminal intrinsically disordered region of WRINKLED 1 affects its stability and enhances oil accumulation in Arabidopsis. Plant J. 2015, 83, 864–874. [Google Scholar] [CrossRef] [PubMed]
- Kavanagh, K.L.; Jörnvall, H.; Persson, B.; Oppermann, U. Medium-and short-chain dehydrogenase/reductase gene and protein families: The SDR superfamily: Functional and structural diversity within a family of metabolic and regulatory enzymes. Cell. Mol. Life Sci. 2008, 65, 3895–3906. [Google Scholar] [CrossRef]
- Fei, W.; Du, X.; Yang, H. Seipin, adipogenesis and lipid droplets. Trends Endocrinol. Metab. 2011, 22, 204–210. [Google Scholar] [CrossRef]


Disclaimer/Publisher’s Note: The statements, opinions and data contained in all publications are solely those of the individual author(s) and contributor(s) and not of MDPI and/or the editor(s). MDPI and/or the editor(s) disclaim responsibility for any injury to people or property resulting from any ideas, methods, instructions or products referred to in the content. |
© 2024 by the authors. Licensee MDPI, Basel, Switzerland. This article is an open access article distributed under the terms and conditions of the Creative Commons Attribution (CC BY) license (https://creativecommons.org/licenses/by/4.0/).