Abstract
Growth-regulating factor (GRF) is a multi-gene family that plays an important role in plant growth and development and is widely present in plants. Currently, GRF gene members have been reported in many plants, but the GRF gene family has not been found in sweet potato. In this study, ten GRF genes were identified in sweet potato (Ipomoea batatas), twelve and twelve were identified in its two diploid relatives (Ipomoea trifida) and (Ipomoea triloba), which were unevenly distributed on nine different chromosomes. Subcellular localization analysis showed that GRF genes of sweet potato, I. trifida, and I. triloba were all located in the nucleus. The expression analysis showed that the expression of IbGRFs was diverse in different sweet potato parts, and most of the genes were upregulated and even had the highest expression in the vigorous growth buds. These findings provide molecular characterization of sweet potato and its two diploid relatives, the GRF families, further supporting functional characterization.
1. Introduction
GRF (growth-regulating factor) is an important transcription factor in plants. Its functions are involved in leaf, stem, flowering, seed, root development, growth control under stress conditions, and plant life regulation [1]. Although these genes are present in all eukaryotes and have a wide range of functions [2], the GRF genes are highly expressed in seedling tissues, such as root tips, flower buds, and young leaves, and relatively weakly expressed in mature tissues or organs [3]. Structural studies have shown that the GRF proteins consist of nine typical antiparallel α-helices [4]. They frequently assemble into either homodimers or heterodimers, with each GRF protein constituent of the dimer capable of engaging with a distinct protein [5]. This property enables them to unite two dissimilar proteins, forming a protein complex, which subsequently physically interacts with numerous protein clients integral to the biosynthesis and signaling pathways of key plant hormones. Moreover, mounting functional evidence underscores the pivotal regulatory roles played by GRF–target interactions [6]. Two conserved domains were found in the N-terminal of the GRF family proteins, and it was found that not all species of GRF genes contain both two conserved domains [7]. In this identification, except ItbGRF5, all GRF genes identified contained WRC (Trp, Arg, Cys, PFAM: PF08880) and QLQ (Gln, Leu, Gln, PFAM: PF08880) domains. The QLQ domain is considered to be a protein–protein interaction domain, which also interacts with GRF interacting factors (GIF), and the resulting complex acts as a transcriptional co-activator [8,9]. The WRC domain contains functional nuclear localization signals and DNA-binding motifs [10]. With the development of sequencing technology, an increasing number of plant genomes and transcriptomes are being revealed, leading to a broader scope of research in this area. The function of the first GRF member was determined by OsGRF1 in rice, which is regulated by gibberellin, and overexpression of the OsGRF1 transcription factor can promote the elongation of rice stems. Subsequently, the GRF gene family is being identified in species constantly, including 9 Arabidopsis [11], 12 rice [12], 30 wheat [3], 14 maize [10], 17 Chinese cabbage [13], 35 rapeseed [14], 10 Brachystis bispike [15], 25 pear [16], and so on.
In addition, several species of GRF gene families have been validated for their function. The overexpression of AtGRF1 and AtGRF2 led to the development of plants exhibiting larger leaves and cotyledons, accompanied by a delay in the bolting process of the inflorescence stem [11]. AtGRF3 can promote the size of plant organs, do not cause morphological defects, that is, will not excessively increase the cost of plant defense, and also play a role in the early stage of panicle development [17]. AtGRF5 can enhance the proliferation of leaf primordium cells, and the leaf growth is larger than that of wild type [18]. AtGRF7 regulates abiotic stress by negatively regulating the expression of dehydration response element binding protein (DREB2A) [19]. AtGRF9 has the function of reducing the leaf size by restricting the number of cells in the leaf primordiums, while the size of the leaf cells remains unchanged [20]. OsGRF1 plays a regulatory role in stem elongation induced by gibberellin, also mainly at the early stages of panicle development [8,21]. The mutation of OsGRF4 can generate larger grain size and enhance higher grain yield in rice [22]. OsGRF6 can adjust the development of auxiliary branches and spikelets and greatly improve the grain yield indirectly [23]. OsGRF7 has been shown involved in rice tiller determination to regulate the biosynthesis of strigolactone [24]. The overexpression of OsGRF8 can resist the infection of brown planthopper (BPH) on rice and increase rice yield; it can also be involved in regulating rice particle size, improving crops, and increasing yields [25,26]. As with OsGRF6, OsGRF8 was able to express largely in developing panicles, and mainly at the early stages of panicle development, while OsGRF7 and OsGRF9 mainly at the later stages [21]. OsGRF11 can also play a role in the early panicle development and participate in reproductive function [21]. Overexpression of BrGRF8 significantly increases the shoot and root fresh weight, seedling root length, and lateral root number and significantly reduce the nitrate content under nitrate-poor and nitrate-rich conditions in Arabidopsis, which is related to its extensive regulation with N uptake, utilization, and signaling [27]. Silencing CsGRF04 can significantly reduce the resistance to salt stress and cold stress but can improve the drought tolerance in Citrus [28]. LsaGRF5 may play a role as a transcription factor in the nucleus through subcellular localization observation and transactivation assays, and the overexpression of LsaGRF5 can stimulate leaf growth and lead to leaf enlargement [29]. The PbGRF18 has the ability to enhance the sugar content found in both the leaves and fruits of tomatoes [16]. MdGRF6 enhances the sensitivity of apples to salt stress by modulating the activity of antioxidant enzymes and regulating the expression of genes involved in the salt stress response [30].
Sweet potato [Ipomoea batatas (L.) Lam.] is an annual herb belonging to the Convolvulaceae family, which is the seventh most important food crop in the world, also an important energy crop for its high edible, feed, and medicinal values [31]. The hexaploid nature of sweet potato (2n = 6x = 90), characterized by a high degree of heterozygosity and general self-incompatibility, leading to outcrossing polyploidy, poses numerous obstacles to conventional breeding methods [32]. So, its productivity and quality are often limited by abiotic and biological stresses, which affect greater economic losses. The use of genetic engineering to change molecular breeding mechanisms has been shown to have great potential to improve the resistance of sweet potatoes to these pressures and improve quality and yield [33]. In this study, the GRF gene family of sweet potato was identified by bioinformatics, and its physicochemical property, collinearity, chromosome distribution, phylogenetic relationship, conserved motifs, and cis-regulatory elements of promoters were analyzed. Furthermore, the candidate GRF genes were quantitatively analyzed and their expression patterns were assessed. The results provided a theoretical basis for understanding the function and molecular breeding of the GRF gene in sweet potato.
2. Results
2.1. Identification of GRFs in Sweet Potato and Its Two Diploid Wild Relatives
Ten, twelve, and twelve GRF genes were identified in I. batatas, I. trifida, and I. triloba, which were named IbGRF1-10, ItfGRF1-12, and ItbGRF1-12, respectively, according to their positions on the chromosome. In sweet potato, CDS length ranged from 1071 bp (IbGRF10) to 3672 bp (IbGRF7), genome length ranged from 2444 bp (IbGRF5) to 7869 bp (IbGRF8), and the protein sequence ranged from 356 aa (IbGRF10) to 611 aa (IbGRF7). The molecular weight (MW) was 39.16 kDa to 64.87 kDa, and the isoelectric point (pI) was 5.89 (IbGRF3) to 9.22 (IbGRF5). All IbGRFs were unstable with an instability coefficient greater than 45. They were hydrophilic proteins with negative hydrophilic index, and the best hydrophilic protein was IbGRF5 (−0.762). Subcellular localization predictions showed that all identified sweet potato IbGRFs were located in the nucleus (Table 1).

Table 1.
Identification of IbGRFs and analysis of physicochemical properties of proteins in sweet potato.
In I. trifida, the CDS length ranged from 957 bp (ItfGRF6) to 1815 bp (ItfGRF7), the genome length ranged from 1979 bp (ItfGRF10) to 4507 bp (ItfGRF5), and the protein sequence ranged from 318 aa (ItfGRF6) to 604 aa (ItfGRF7). The MW was 35.42 kDa (ItfGRF6) to 64.02 (ItfGRF7) kDa, and the pI was 5.89 (ItfGRF12) to 9.1 (ItfGRF10). In I. triloba, the CDS length ranged from 957 bp (ItbGRF6) to 1830 bp (ItbGRF7), the genome length ranged from 2075 bp (ItbGRF12) to 4623 bp (ItbGRF5), and the protein sequence was 319 aa (ItbGRF6) to 609 aa (ItbGRF7). With a MW of 35.24 kDa (ItbGRF5) to 64.63 kDa (ItbGRF7), the pI ranged from 6.26 (ItbGRF12) to 9.22 (ItbGRF10). All IbGRFs were unstable with an instability coefficient greater than 45. It can be seen that both ItfGRFs and ItbGRFs were soluble in water, and the hydrophilic indexes were negative. The best hydrophilic indexes were ItfGRF4 and ItbGRF4, respectively. Subcellular localization prediction revealed that all identified ItfGRFs and ItbGRFs, like IbGRFs, were located in the nucleus (Table 1).
Chromosome localization results showed that GRF genes from I. batata, I. trifida, and I. triloba were unevenly distributed on 9 chromosomes, respectively. Some chromosomes contained two GRF genes, such as LG5 of I. batata, Chr03, Chr08, and Chr12 of I. trfida, and Chr03, Chr08, and Chr12 of I. triloba (Figure 1 and Table S1).
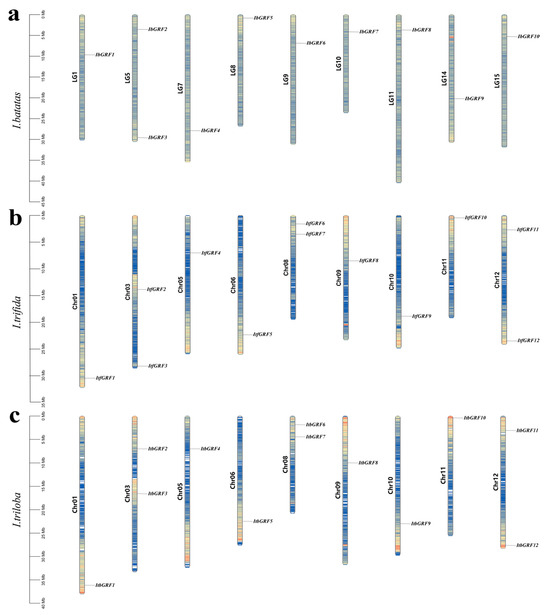
Figure 1.
Chromosomal localization and distribution of I. batatas (a), I. trifida (b) and I. triloba (c). The bars represent chromosomes, with chromosome numbers on the left and gene names on the right. The number line on the left gives a visual view of chromosome length, and the number line on the left indicates species. Blue, yellow, and red represent the size of the gene density on the chromosome, from small to large, respectively.
2.2. Collinearity Analysis of GRF Genes and Ka/Ks Analysis
Gene replication, including tandem replication, fragment replication, and whole genome replication, is the primary driving force of plant evolution [34]. In order to reveal the replication mechanism of IbGRFs, ItfGRFs, and ItbGRFs gene families, we analyzed GRFs gene pairs and performed intraspecific collinearity analysis using TBtools method (v.2.084). It showed that I. batatas, I. trifida, and I. triloba generate 6 pairs, 8 pairs, and 9 pairs (Figure 2a–c). It showed that there was more collinearity between species, greater relationships, and greater homology, and these genes originated from ancestral genes (Figure 2d).
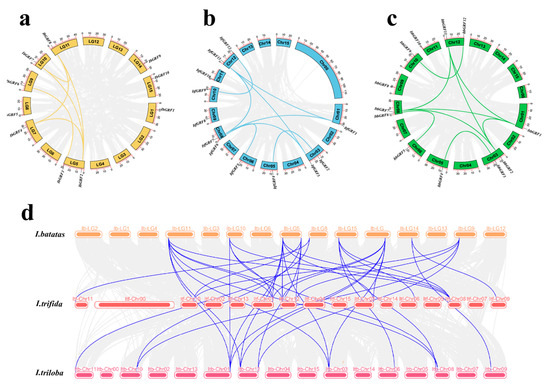
Figure 2.
Localization and collinearity analysis of the GRF genes in I. batatas (a), I. trifida (b), and I. triloba (c), with yellow, blue, and green blocks representing chromosomes, and colored lines connecting two duplicate genes. (d) Collinearity analysis between the three species, the color block represents the chromosome, and the gene pairs with repeated relationships are connected by a bluish violet line, representing the common relationship between the three species.
Furthermore, we calculated the Ka/Ks ratio to estimate the selection pressure and gene evolution rate among duplicate GRF genes [35]. The results showed that the Ka/Ka ratio of GRFs duplicate genes ranged from 0.136 to 0.404, with an average value of 0.221. The Ka/Ks ratio of all gene pairs was less than 1, which meant that these genes duplicated and evolved in purification selection. Also, according to the approximate dates of GRFs calculation formula of the obtained gene duplication events, the duplication events of GRFs occurred in about 128.374 Mya to 667.871 Mya, with an average of 329.591 Mya (Table S2).
2.3. Phylogenetic Relationship Analysis of GRFs in Sweet Potato and Its Two Diploid Relatives
Based on the identified GRFs that were downloaded from NCBI, MEGA7.0 software was used to construct a phylogenetic tree and analyze the evolutionary relationships of GRFs among 10 I. batatas, 12 I. trifida, 12 I. triloba, 9 Arabidopsis thaliana, 10 Oryza sativa, and 17 Brassica rapa. The results showed that similar sequences with evolutionary relationships were clustered together. According to the relationship between evolution and development, 70 GRFs were divided into 4 groups (Figure 3). In general, all IbGRFs, ItfGRFs, and ItbGRFs were clustered together with their corresponding homologues (Figure 3).
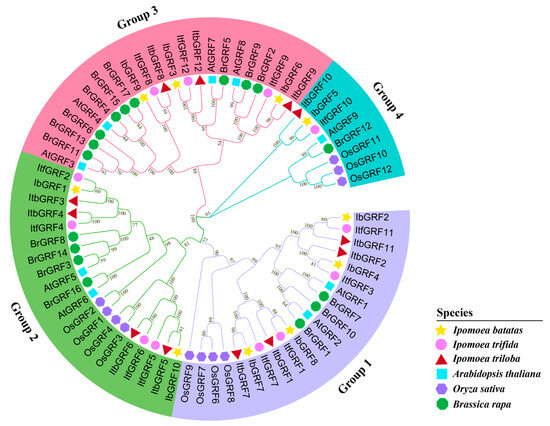
Figure 3.
Phylogenetic analysis of GRFs in I. batatas, I. trifida, I. triloba, Arabidopsis, rice, and Chinese cabbage. A phylogenetic tree was constructed by the neighbor-joining method based on MEGA7.0 with 1000 bootstrap replicates. Different legends represent different species, the yellow stars represent 10 IbGRFs in I. batatas, the pink circles represent 12 ItfGRFs in I. trifida, the red triangles represent 12 ItbGRFs in I. triloba, the blue squares represent 9 AtGRFs in Arabidopsis, the purple hexagon represent 10 OsGRFs in rice, and the green octagon represent 17 BrGRFs in Chinese cabbage.
2.4. Conserved Motifs, Conserved Domain and Exon–Intron Structure Analysis of GRFs from I. batatas and Its Two Relatives I. trifida and I. triloba
The MEME online website was used to predict the conserved motifs of GRFs and a total of 10 conserved motifs were identified and the sequence logos were obtained (Figure 4). Also, a hitdate file was downloaded from the NCBI database to predict conserved domains (Figure 5c). As shown in Figure 5, the 34 GRFs were divided into seven groups. There were certain differences in the number and distribution of motifs in each group of GRFs; each gene contained 4 to 10 motifs, and all members had motif 1. Group 1 of GRFs lacked motif 7 and motif 9, Group 2 had ten motifs, Group 3 lacked motif 6 and motif 9, Group 4 lacked motif 9, Groups 5, 6, 7 and 8 had a small number of motifs, Group 9 lacked motif 5, motif 7, motif 10, where ItbGRF5 in Group 9 also lacked motif 2, Group 10 lacked motif 5, motif 6, motif 7, motif 10, Group 11 lacked motif 5, motif 6, motif 7, motif 9, motif 10, and Group 12 lacked motif 6, motif 7, motif 9, motif 10 (Figure 5b). Therefore, the GRF genes exhibited variations during their evolutionary processes.
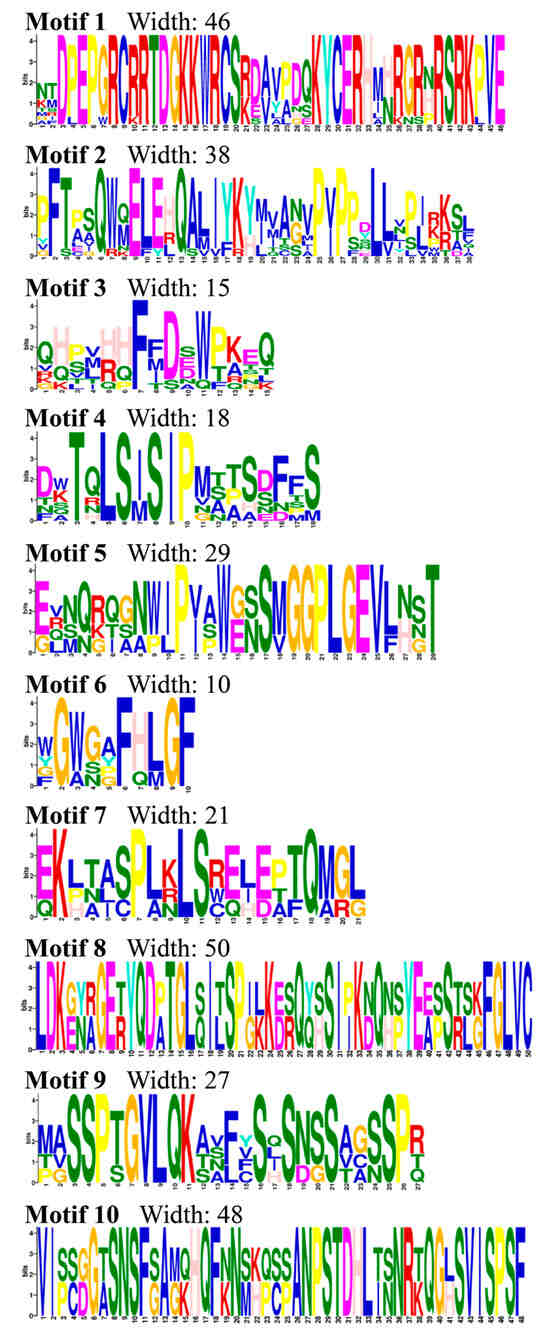
Figure 4.
Sequence logos of the 10 conserved motifs.
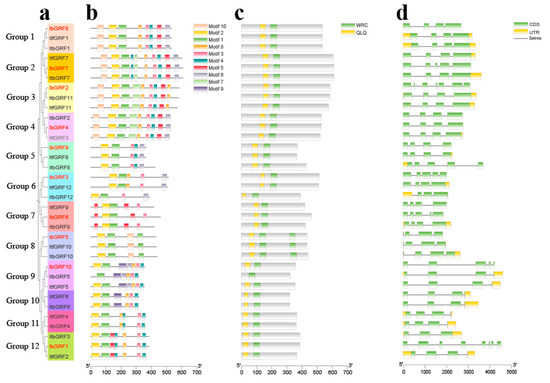
Figure 5.
Analysis of conserved motif, conserved domain, and exon–intron structure of GRF genes in I. batatas, I. trifida, and I. triloba. (a) The phylogenetic tree of IbGRFs, ItfGRFs, and ItbGRFs was constructed by the neighbor-joining method based on MEGA7.0 with 1000 bootstrap replicates. (b) The ten conserved motifs were shown in different colors. (c) The conserved domains were shown in 34 GRFs; the green and yellow boxes represent WRC and QLQ domains, respectively. (d) Exon–intron structures of GRFs. The green boxes, yellow boxes, and black lines represent UTRs, exons, and introns, respectively.
Furthermore, we analyzed the structure of GRFs by TBtools software (v.2.084). According to the results, we can find a clear difference in the number of exons and introns in GRFs. The number of introns in the GRF genes ranged from 2 to 7, while the number of exons ranged from 3 to 8. Most of these genes had three introns (27 out of 34), followed by four introns (5 out of 34), and most of these genes had four exons (17 out of 34), followed by three exons (9 out of 34) (Figure 5d). These results suggested that the similarities and differences of genes during evolution may be related to intron–exon differences.
2.5. Analysis of Putative Cis-Regulatory Elements of GRFs Promoters from I. batata and Its Two Diploid Relatives I. trifida and I. triloba
Cis-acting elements are transcription factor DNA binding sites and other regulatory motifs with special functions in the same DNA molecule, which hold a crucial position in the regulation of gene transcription initiation. Therefore, we extracted the 2000 bp promoter sequence upstream of the GRF genes start codon from TBtools software (v.2.084) and used the PlantCARE online tool to predict the regulatory characteristics of expression in GRF genes. As shown in Figure 6, we found a number of endogenous hormone response elements, including abscisic acid responsiveness (ABRE), MeJA responsiveness (CGTCA-motif and TGACG-motif), gibberellin responsiveness (GARE-motif, P-box, and TATC-box), salicylic acid responsiveness (TCA-element), and auxin responsiveness (AuxRR-core and TGA-element), that indicated GRFs were involved in plant hormone expression. In addition, several abiotic stress-responsive elements, such as anaerobic induction elements (ARE and GC-motif), low-temperature responsiveness element (LIR), drought-inducibility element (MBS), and defense and stress responsiveness element (TC-rich repeats), were found in promoters. Therefore, we also found that some growth and development regulatory and biosynthesis elements, covering meristem expression (CAT-box), seed-specific regulation (RY-element), cell cycle regulation (MSA-like), zein metabolism (O2-site), circadian control (circadian), endosperm expression (GCN4_motif), and palisade mesophyll cells differentiation (HD-Zip 1) in GRFs. The results showed that GRF genes were closely related to the growth and development of sweet potato and biological processes such as biological and abiotic stress. In addition, it also found that protein binding site, regulatory element, wound responsiveness, and elicitor-mediated activation. Interestingly, a total of 339 light responsiveness elements were identified, with the most prevalent elements among the three species. This suggested that GRF genes were involved in light regulation (Figure 6).
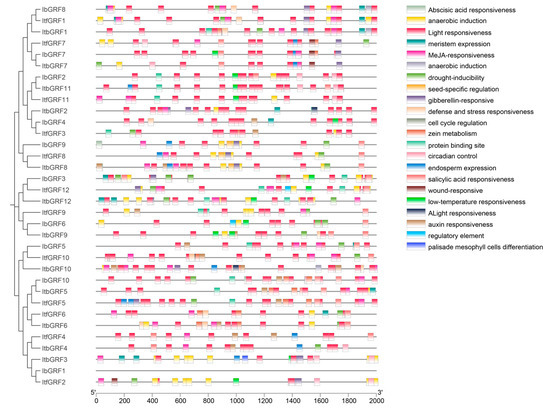
Figure 6.
Cis-element analysis in the promoters of GRFs in I. batatas, I. trifida, and I. triloba. The cis-elements were divided into twenty-two broad categories. The corresponding color blocks matched to the class of homeopathic components.
2.6. Expression Analysis of GRFs in I. batata, I. trifida and I. triloba
2.6.1. Expression Analysis under Hormone Stress
To investigate the potential biological function of GRF genes in plant hormone signal processing, we utilized the “Xushu 18” RNA-seq data obtained from the NCBI database (PRJNA511028) and characterized the expression profiles of 10 IbGRF genes across three distinct tissues following treatment with ABA, SA, and MeJA. In fibrous roots, IbGRF3 and IbGRF10 were upregulated after the ABA treatment, IbGRF2, IbGRF4, and IbGRF7-9 were upregulated after the SA treatment, and IbGRF2-3, IbGRF6-10 were upregulated after the MeJA treatment. In stems, the transcription of GRF genes was different under diverse hormone stress. For instance, IbGRF1 was downregulated, while IbGRF2, IbGRF4, and IbGRF8-10 were upregulated after the three hormone treatments. In leaf, all IbGRFs were upregulated after SA and MeJA treatments, but after the ABA treatment, except for IbGRF3 and IbGRF7, the left genes were upregulated or had no significant change (Figure 7).
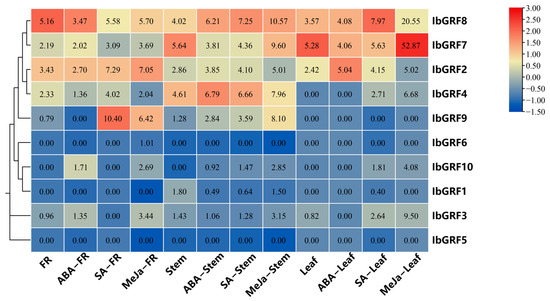
Figure 7.
Expression analysis of IbGRFs in fibrous roots (FR), stems and leaves of sweet potato under hormones treatment as determined by RNA−seq. The figure value is the true expression, and the scale value is standardized according to the true expression, which reflects the relative expression value.
Furthermore, RNA-seq data of I. trifida and I. triloba were used to analyze the expression patterns of ItfGRFs and ItbGRFs under ABA, GA3, and IAA treatments. After the ABA treatment, only ItfGRF2 and ItfGRF5 were downregulated, and the others were upregulated or did not show significant changes. Under the GA3 treatment, only ItfGRF4 and ItfGRF11 were upregulated, while the other was downregulated. Under the IAA treatment, eight ItfGRFs were downregulated, and ItfGRF2, ItfGRF6, ItfGRF10, and ItfGRF11 were upregulated. In I. triloba, ItbGRF3, ItbGRF4, ItbGRF8, and ItbGRF9 were upregulated, and the others were downregulated or did not show significant changes after ABA treatment. Under the GA3 treatment, ItbGRF4, ItbGRF8, ItbGRF9, and ItbGRF11 were upregulated, except ItbGRF3 and ItbGRF10, and the others were downregulated. Under the IAA treatment, only ItbGRF7, ItbGRF10, and ItbGRF12 were upregulated, and the others were upregulated or had no significant change (Figure S1).
2.6.2. Expression Analysis under Cold Stress
The expression profiles of 10 IbGRFs were detected by transcriptome data of cold−tolerant “Liaohanshu 21” and cold−sensitive “Shenshu 28”, which was studied in a previous report after cold stress [36]. As shown in Figure 8, except for IbGRF9, only IbGRF6 were upregulated in “Shenshu 28” after cold stress, while the rest of the genes were all downregulated. And IbGRF1, IbGRF5, IbGRF6, and IbGRF10 were upregulated in “Liaohanshu 21” after cold stress, while IbGRF2, IbGRF3, IbGRF4, IbGRF7, and IbGRF8 were upregulated (Figure 8).
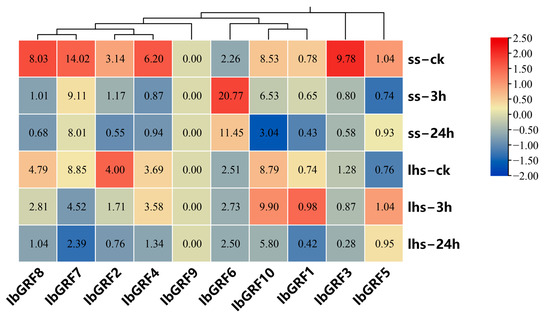
Figure 8.
Gene expression patterns of IbGRFs under cold stress as determined by RNA−seq. ss: cold−sensitive “Shenshu 28”, lhs: cold−tolerant “Liaohanshu 21”; ck: control group. The figure value is the true expression, and the scale value is standardized according to the true expression, which reflects the relative expression value.
Additionally, the expression patterns of ItfGRFs and ItbGRFs were analyzed also. ItfGRF1, ItfGRF4, ItfGRF5, ItfGRF7, ItfGRF10, and ItfGRF11 were upregulated after cold stress, whereas half−leaf ItfGRFs were downregulated. After a cold treatment, only ItbGRF11 was upregulated; the remaining genes were all downregulated (Figure S2).
2.6.3. Expression Analysis under Heat Stress
The expression profiles of 10 IbGRFs were detected by transcriptome data of heat−tolerant “Guangshu 87” and heat−sensitive “Ziluolan”, which were studied in a previous report after heat stress. As shown in the figure, the transcripts of fibrous root in the “Ziluolan” cultivar were downregulated except for IbGRF7, but in the “Guangshu 87” cultivar, only IbGRF9 was upregulated, while the other IbGRFs were downregulated. The transcripts of IbGRF1, IbGRF3, IbGRF9, and IbGRF10 in tuberous root were upregulated in the “Ziluolan” cultivar, while the other IbGRFs were downregulated. Otherwise, in the “Guangshu 87” cultivar, only IbGRF3, IbGRF6, and IbGRF10 were upregulated, while the other IbGRFs were downregulated (Figure 9).
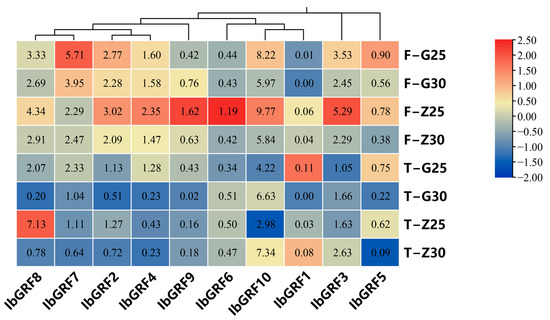
Figure 9.
Gene expression patterns of IbGRFs under heat stress as determined by RNA−seq. F: fibrous roots; T: tuberous roots; Z: heat−sensitive “Ziluolan”; G: heat−tolerant “Guangshu 87”. The figure value is the true expression, and the scale value is standardized according to the true expression, which reflects the relative expression value.
Furthermore, the expression patterns of both ItfGRFs and ItbGRFs were additionally analyzed under conditions of heat stress. After heat treatment, only ItfGRF5 and ItfGRF7 were upregulated. Five ItbGRFs were upregulated, while ItbGRF1, ItbGRF2, ItbGRF6, ItbGRF7, ItbGRF9, ItbGRF10, and ItbGRF11 were downregulated (Figure S3).
2.6.4. Expression Analysis under Salt and Drought Stresses
To explore the possible roles of IbGRFs in an abiotic stress response, we analyzed the expression patterns of IbGRFs under salt and drought treatments. As shown in the Figure 10, in flower organs, the expression of almost all IbGRFs genes was downregulated after salt and drought stresses, except IbGRF2, IbGRF3, IbGRF6, and IbGRF10, which were upregulated after drought stress. In firewood root, IbGRF2 and IbGRF8 were both upregulated after salt and drought stresses. In fruit, more than half of the IbGRFs were upregulated after salt treatment, while more than half of the IbGRFs were downregulated after drought treatment. In leaf, only IbGRF4, IbGRF6, and IbGRF10 were upregulated, while the others were downregulated after salt and drought stresses, except IbGRF7 and IbGRF9, which were upregulated after salt treatment but downregulated after drought treatment. In fibrous root, five IbGRFs were upregulated while two IbGRFs were downregulated after two kinds of stresses. In primary root, only IbGRF6 was upregulated after salt stress, and IbGRF5, IbGRF6, and IbGRF7 were upregulated after drought stress. In stem, all IbGRFs were downregulated after salt stress but not after drought stress. In root tuber, only IbGRF4 and IbGRF6 were upregulated after salt stress, and only IbGRF3 and IbGRF8 were upregulated after drought stress (Figure 10).
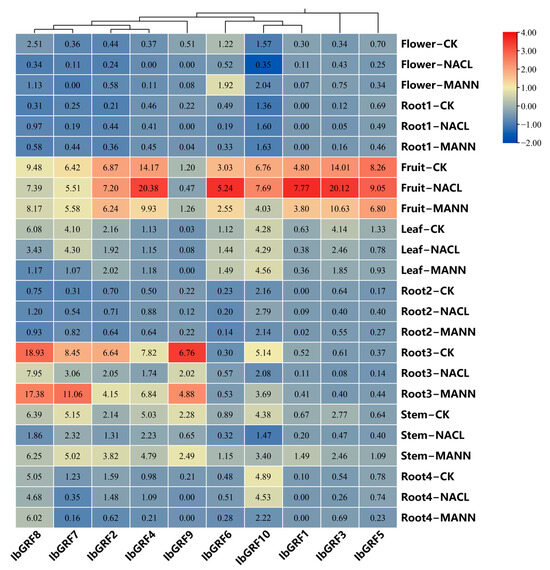
Figure 10.
Gene expression patterns of IbGRFs in flower, root1 (Firewood root), fruit, leaf, rool2 (fibrous root), rool3 (primary root), stem and rool4 (root tuber) under salt and drought stresses. NACL: salt stress; MANN: drought stress. The figure value is the true expression, and the scale value is standardized according to the true expression, which reflects the relative expression value.
To sum up, the expression of IbGRFs in most parts was downregulated under the salt stress. However, the expression of IbGRFs in fruit was upregulated mostly, which indicated that there are other factors in fruit that can promote the resistance of GRFs to salt stress and promote their expression. But the rule was not obvious under drought stress.
In addition, so as to explore the function of I. trifida and I. triloba, we examined the expression patterns of them under salt and drought stresses [37]. In I. trifida, ItfGRF4 and ItfGRF9 were upregulated under both stresses, while ItfGRF1, ItfGRF5, ItfGRF7 and ItfGRF12 were downregulated. In I. triloba, ItbGRF4 and ItbGRF9 were upregulated under both stresses, while ItbGRF1, ItbGRF3, ItbGRF7, ItbGRF10, and ItbGRF12 were downregulated (Figure S4).
2.6.5. Expression Analysis in Various Tissues
The transcript levels of IbGRFs identified by qPCR were detected in nine organs: flower, flower bud, fibrous root, firewood root, primary root, tender stem, old stem, tender leaf, and old leaf. The results revealed that the expression of IbGRF4 was higher in flowers and buds than in other tissues, which had a tissue-specific expression pattern. And the expression of IbGRFs was highest in the flower bud (Figure 11). According to the relative expression levels of IbGRFs in 9 tissues, old leaf was used as a control group; the expression of six IbGRFs (i.e., IbGRF1, −3, −4, −6, −9, −10) was upregulated, and the amount of expression was the highest. It was also found that IbGRFs were all have certain expression in flower and bud (Figure 12). These results indicated that IbGRFs are conducive to plant growth and development and express in large quantities in the meristem. The qPCR primers are detailed in Table S3.
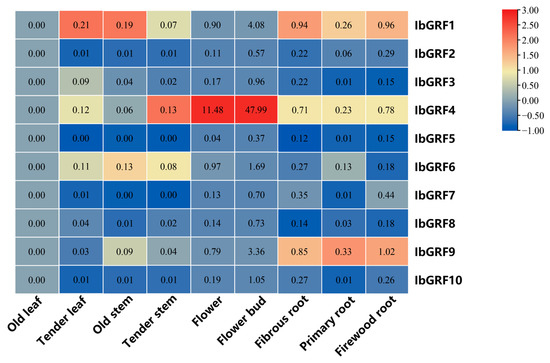
Figure 11.
Expression patterns of the 10 IbGRFs in 9 different tissues (flower, flower bud, fibrous root, firewood root, primary root, tender stem, old stem, tender leaf, and old leaf). The values were determined via qRT−PCR from three biological replicates consisting of pools of three plants, and the results were subjected to analysis utilizing the comparative CT method. The expression level of IbGRFs was analyzed by setting old leaf as control. The fragments per kilobase per million (FPKM) values are shown in the color blocks. The figure value is the true expression, and the scale value is standardized according to the true expression, which reflects the relative expression value.
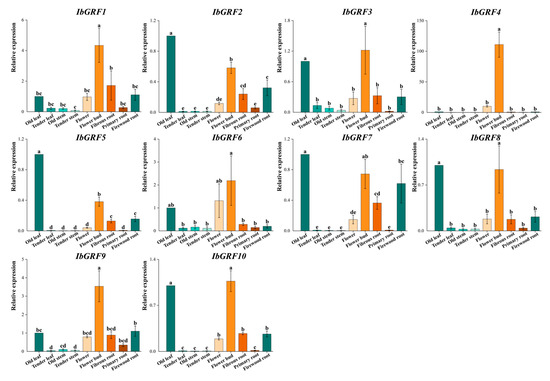
Figure 12.
Relative expression levels of 10 IbGRFs in 9 different tissues of the sweet potato. The x-axes represent different tissues, including flower, flower bud, fibrous root, firewood root, primary root, tender stem, old stem, tender leaf, and old leaf; the y-axes indicate the relative expression of IbGRFs; the error bars depicted represent the standard errors calculated from three technical replicates obtained from a single bulked biological sample. Significant differences in each IbGRF at p < 0.05 are determined by one-way ANOVA tests, which are indicated with small letters a–e.
2.7. Protein Interactions Network of GRFs in Sweet Potato
A sweet potato GRF protein interactions network was constructed based on the Arabidopsis protein interactions model. Protein interaction maps showed that all ten IbGRFs were homologous with AtGRFs, and all IbGRFs interacted with each other. For instance, IbGRF1 and IbGRF10 were homologous with GRF5-2, IbGRF2 and IbGRF4 were homologous with GRF2-2, IbGRF3 was homologous with GRF7-2, IbGRF5 were homologous with GRF9, IbGRF6 was homologous with GRF8-2, IbGRF7 and IbGRF8 were homologous with GRF1, and IbGRF9 was homologous with GRF3-2. Additionally, these IbGRFs also interacted with other functional proteins, such as transmembrane protein F4HT79 ARATH, domain-containing protein MJB21.7 and MVI11, and GIFs, which were GRF-interacting factors and transcription coactivators (Figure 13). In conclusion, IbGRFs may also be involved in the transmembrane transport of substances and participate in the composition of the domain. What is more, the figure confirmed that GRFs had a non-negligible relationship with GIF, which are bona fide partner proteins that together form a unique transcriptional complex specific to plants. Also, the GRF–GIF duo imparts a meristematic specification state to the primordial cells of both vegetative and reproductive organs, ensuring a steady supply of cells for organogenesis and successful reproduction [38].
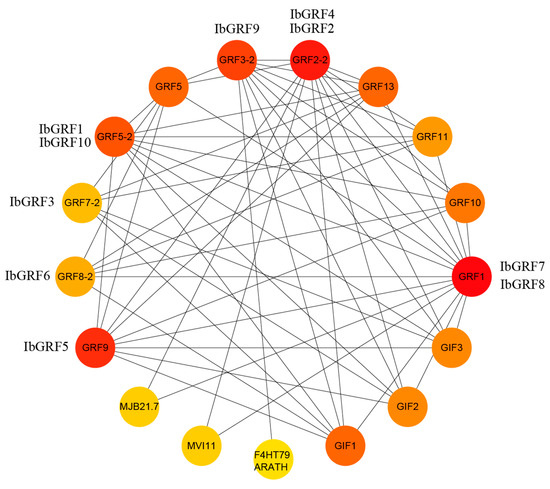
Figure 13.
Protein–protein interaction (PPI) network of sweet potato GRF proteins. The depth of the color indicates the degree of interaction between the proteins (the darker the color indicates, the greater the interaction).
2.8. Transcript Factors Network of Sweet Potato GRF Genes
The results of TF analysis in IbGRFs showed that a total of 578 TFs were identified and distributed in 45 TF families, and Figure 14 showed only 40 TFs of them, distributed in 11 families (ABI3, AP2, BHLH, C4-GATA-related, ERF/DREB, IDD, Jumonji, MIKC, RAV, SBP, MYB-related). Among them, the ERF/DREB TF family had 79 members, which was the most enriched; also, the number of members varies. What is more, the number of 10 IbGRFs genes targeted by TF was equal, and the members were similar, indicating that the functions of these ten genes were similar and functional redundancy existed in sweet potato (Figure 14).
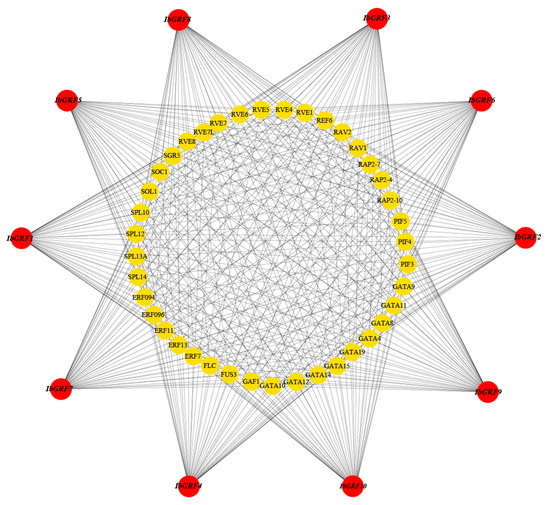
Figure 14.
The putative transcription factor regulatory network analysis of sweet potato GRF genes. The red circular nodes represent IbGRFs, and the yellow nodes in the figure are the transcription factors that interact most with IbGRFs.
3. Discussion
3.1. Identification and Evolution of Sweet Potato and Its Two Diploid Relatives I. trifida and I. triloba
The development and maturation of sequencing technology have allowed many plant genomes to be analyzed, thereby facilitating the identification and analysis of plant gene families at the whole genome level. Owing to the complexity of the hexaploid sweet potato genome, it is frequently analyzed in conjunction with its two diploid relatives, I. trifida and I. triloba, which is also beneficial to analyze the unity and specificity of structure and function and evolutionary relationships [39,40,41]. In our study, 10, 12, and 12 GRF genes were identified in I. batatas, I. trifida, and I. triloba, respectively. In general, the number of GRF transcription factor genes in terrestrial plants ranges from 8 to 20, but the number is lower in bryophytes, algae, and other plants [7]. Some studies suggest that the significant evolutionary expansion of GRF gene family members was due to enhanced adaptation to complex environments [42]. These genes were scattered across nine chromosomes, some of which contain two GRF genes, but were presented as single genes rather than clusters, indicating that they each had different biological regulatory and stress response functions.
According to previous studies, amplification of the GRF family occurred primarily through gene replication, including whole genome duplication (WGD) or tandem duplication [43]. The occurrences of fragment duplication were disseminated across the respective chromosomes, and these duplicated gene fragments were able to persist in diverse species via WGD, which was consistent with the previous research findings [44]. What is more, demonstrated the amplification of the GRF gene family mainly depended on fragment replication. This type of replication enriched the diversity of gene families and accelerated species evolution, improved the adaptability of evolved species to the environment and its own survival ability, promoted the morphological evolution of species, and played an important role in the expansion of GRF gene families (Figure 2).
Differences in gene structure and function are associated with exon/intron gain/loss events [45]. In our study, the number of introns in the GRF genes ranged from 2 to 7, while the number of exons ranged from 3 to 8. It seemed that the number of exons/introns in GRF genes was not conserved, and the differences might be caused by chromosome rearrangement and fusion, which in turn led to different biological functions of GRF genes [43]. However, in the same group, the number was conserved, indicating that the gene structure and function were similar in the same group (Figure 5d).
Cis-acting elements act as binding sites for various regulatory factors and proteins, thereby affecting gene expression. In the GRF genes, there were a large number of light response elements and hormone stress response elements, indicating that they were involved in light response and hormone signaling. In addition, various abiotic stress elements can also be found in GRF genes (Figure 6), suggesting that the regulatory role and expression of the GRF gene might be affected by environmental factors [46].
3.2. GRFs Are Involved in Plants Growth and Development Hormonal Regulation
Studies have shown that GRF genes play an important role in the regulation of plant growth and development, stress response, and other biological processes [8,47]. Just like previous studies in Arabidopsis, rice, corn, and even other plants, most of the AtGRFs, OsGRFs, and ZmGRFs are strongly expressed in actively growing and developing tissues, such as shoot tips, flower buds, and roots, but weakly in mature stem and leaf tissues [10,11,12]. In this study, quantitative analysis of candidate GRF genes also showed that the expression of GRF genes in young tissues or organs (flower bud) of sweet potato was higher than that in mature tissues or organs. As a result, genes of the GRF family mainly expressed in certain organs or tissues might play important roles in the growth and development of these organs or tissues.
GA was involved in various physiological activities and hormone regulation of plants [48]. Previous studies have shown that GA3 treatment induces upregulation of OsGRF1/2/3/7/10/12 and represses the expression of OsGRF9 in rice but results in reduced expression of most GRFs in cabbage [12,13]. In this study, we also found some gibberellin responsiveness cis-element, which implicated that gibberellin will induce or inhibit the function of GRFs in the plant. Furthermore, in one previous study, the KNOX protein negatively regulated gibberellin to increase its level in immature tissues and organs and then participated in the establishment and maintenance of plant meristems [47,48]. In the other study, GRF proteins acted as repressors and downregulators of KNOX gene expression [49]. As previously reported in rice and Chinese cabbage [12,13], we conclude that most IbGRFs transcription is induced by GA3 treatment. These results suggested that the GRF genes may function in maintaining or promoting cell proliferation in plants by a feedback regulation mechanism, in which the GRF genes positively regulate the production of GAs, and GAs in turn upregulate GRF gene expression. Surprisingly, GRFs are able to interact with a negative regulator of GA signaling, DELLA. What’s more, GRF activity was balanced by an antagonistic regulatory relationship with DELLA growth inhibitors [50]. The conclusion was contrary to most studies showing that GRF was a positive factor in promoting growth.
4. Materials and Methods
4.1. Identification and Physicochemical Properties of GRF Family Members
The protein sequences and annotation files of sweet potato, I. trifida, and I. triloba were obtained from the Sweet Potato Genomics Resource (http://sweetpotato.plantbiology.msu.edu/, accessed on 21 February 2024) and the Ipomoea Genome Hub (https://sweetpotao.com/, accessed on 21 February 2024). The Arabidopsis GRF proteins were downloaded from the TAIR database (https://www.arabidopsis.org/, accessed on 2 Match 2024), the rice. GRF proteins were downloaded from NCBI (https://www.ncbi.nlm.nih.gov/, accessed on 8 Match 2024), and the Brassica GRF proteins were downloaded from the BRAD database (http://brassicadb.cn/, accessed on 9 Match 2024). In order to identify the IbGRFs, we adopted the following methods. First, we developed an experimental method and fully consulted the literature to obtain the GRF protein sequence of the model plant Arabidopsis. Second, HMMsearch from NCBI was used to conserve the domain of AtGRFs (Pfam accession numbers: PF08879 and PF08880) [51]. Then, Arabidopsis GRF protein sequences were searched in the sweet potato variety Taizhong protein sequence library using the Blastp function in Bioedit software (v.7.1.3.0) with an E-value threshold of 1 × 10⁻¹⁰ [52]. After searching, there were 835 genes with similar parts of Arabidopsis GRF gene structure. Afterwards, the domain of all the IbGRFs was identified by the CD-Search tool in the NCBI database and the Simple Modular Architecture Research Tool (SMART) (https://smart.embl.de/, accessed on 22 April 2024) [53]. Genes that do not contain conserved domains were deleted, while genes with intact domains were retained. Finally, 10 GRF gene family candidate genes of sweet potato were obtained, and the ratio of gene number to blastp result was 0.20. The Protein Parameter Calc function of TBtools software (v.2.084) was used to calculate protein physicochemical parameters [54]. Wolf PSORT (https://wolfpsort.hgc.jp/, accessed on 24 April 2024) was used to predict subcellular localization [55].
4.2. Collinearity Analysis of GRF Genes and Calculation of Ka/Ks Value
The MCScanX function of TBtools software (v.2.084) was used to construct inter-species and intra-species collinearity relationships, and Synteny Plot was used to visualize the relationships [56]. Similarly, we used TBtools 2.084 with default parameters to calculate the Ka/Ks ratio to estimate the rate of evolution of GRF genes over repetition. (Ka: nonsynonymous substitution rate, Ks: synonymous substitution rate). The estimated separation time (T, Mya: million years ago) was calculated according to the previous report [57].
4.3. Phylogenetic Analysis of GRFs
The phylogenetic analysis tree of the GRFs of Arabidopsis, rice, and Chinese cabbage, which were acquired, and I. batatas, I. trifida, and I. triloba, which were screened, was constructed using the ClustalW function in MEGA7.0 software with the default parameter neighbor-joining (NJ) method, and bootstrapping was performed with 1000 replicates [58]. After obtaining the phylogenetic tree, the online pretty print tool Evolview (https://www.evolgenius.info/evolview/, accessed on 28 April 2024) and Adobe Illustrator 2022 (AI) were used to beautify the phylogenetic tree [59].
4.4. Conserved Motifs and Gene Structure Analysis of GRFs
The conserved motif of GRF protein sequence was analyzed by the MEME (v.5.5.5) online tool (https://meme-suite.org/meme/tools/meme, accessed on 17 March 2024), and the number of motifs was set to 10, while default settings were adopted for other parameters [60]. Furthermore, the hitdata file of protein sequence and the Newick file of phylogenetic tree were downloaded from the NCBI online website and MEGA 7.0. Finally, the GRF genes phylogenetic tree, gene structure, and conserved motifs were visualized on the Gene Structure View function of TBtools software (v.2.084) to obtain the conserved motif and gene structure map [54].
4.5. Analysis of Putative Cis-Regulatory Elements of GRFs
The upstream promoter 2000 bp was extracted by TBtools software (v.2.084) and then submitted to the PlantCare (https://bioinformatics.psb.ugent.be/webtools/plantcare/html/, accessed on 25 April 2024) online website, analyzing the cis-components of GRFs [61]. Then, processed file data were obtained through personal email, and the Simple BioSequence Viewer of TBtools software (v.2.084) was used to visualize the cis-regulatory element figure [54].
4.6. Protein Interactions Analysis of Sweet Potato GRFs
Initial parameters were set on the online website STRING (https://cn.string-db.org/, accessed on 23 April 2024) to execute the potential protein interactions between model plant Arabidopsis Thaliana and sweet potato GRF proteins [62]. After obtaining the initial interaction figure, Cytoscape software (v.3.9.1) was used to beautify the protein–protein interaction network [63].
4.7. Transcript Factors Regulatory Network Analysis of Sweet Potato GRFs
Based on the homologous relationship between model plant Arabidopsis thaliana and sweet potato, the JASPAR online website (https://jaspar.elixir.no/, accessed on 25 April 2024) was used to predict the TFs of sweet potato GRF genes [64]. The Cytoscape software version 3.9.1 was used to visualized the potential TF regulatory networks [63].
4.8. Transcriptome Analysis
Five transcriptome bio-project datasets were chosen for the sweet potato GRF gene expression profile analysis. Of which, two bio-project datasets (PRJNA511028 for hormone and PRJNA987163 for cold) were downloaded from the NCBI database. Another three were our in-house (unpublished) sweet potato heat treatment, salt treatment, and drought treatment. Among them, “Xushu 18” was for hormonal treatment, cold-tolerant “Liaohanshu 21” and cold-sensitive “Shenshu 28” for cold treatment, heat tolerant “Guangshu 87” and heat-sensitive “Ziluolan” for heat treatment, and salt-tolerant and drought-tolerant “Guangshu 87” for salt and drought treatment. Additionally, the gene expression data of I. trifida and I. triloba were downloaded from the Sweet Potato Genomics Resource (http://sweetpotato.plantbiology.msu.edu/, accessed on 15 March 2024). The GRF expression was measured in fragments per kilo base of exon per million fragments mapped (FPKM) [65]. The heat maps of expression were constructed by TBtools software (v.2.084) [54].
4.9. Quantitative Analysis of Candidate IbGRF Genes
The sweet potato (I. batatas) cultivar “Jishu 26” was used for qRT-PCR analysis in this study. Sweet potato plants were cultivated at the experimental field of Guangdong Ocean University, Guangdong, China. For tissue expression, the flower, flower bud, tender leaf, old leaf, tender stem, old stem, primary root, firewood root, and tuberous root tissues were sampled from 3-month-old “Jishu 26” planted in the field. Among them, tender and old leaves are the first spreading leaf and the fifth leaf from the apical meristem; the tender and old stem are the first and tenth segments from the meristem. After the tissues of different parts of sweet potato were taken from the experimental field, they were covered with dry ice after being quickly frozen with liquid nitrogen. Then extracted RNA by the TRIzol method (Invitrogen, Carlsbad, CA, USA) in the laboratory, which was then transcribed into cDNA [66]. Primers were designed using Prime-BLAST of the NCBI database and sent to the company to synthesize primers. The qRT-PCR reaction was performed utilizing the Bio-Rad system, adhering to the specified thermal cycling protocol: Initiating with a 3 min pre-degeneration at 95 °C, subsequently proceeding through 40 cycles consisting of a 10 s denaturation phase at 95 °C and a 30 s annealing phase at 60 °C. The reaction concluded with a 5 s final extension step at 65 °C, followed by a gradual cooling to 95 °C at a rate of 0.5 °C per step [67]. Each sample was replicated three times, adhering to Dingfa’s methodology, which employed the IbARF gene as an internal reference. For quantification, we utilized the 2−ΔΔCT method to determine the relative transcript levels [68].
5. Conclusions
In this study, 34 GRF genes were identified in the sweet potato and its two diploid relatives. By analyzing the development and evolution of GRF genes, we found that IbGRFs experienced frequent duplication leading to complex functions. Analysis of conserved motifs and gene structure showed that GRFs had conserved and dispersed characteristics in the evolutionary process. The results of the study indicated that the GRF genes were involved in light-responsive expression, which was consistent with their role as growth-regulating factors involved in plant photosynthesis and growth and development. Expression analysis revealed the expression patterns of IbGRFs in different sweet potato parts, reflecting the expression diversity and thus reflecting the functional diversity and regulatory role of IbGRFs. In Figure 15, we clearly demonstrated GRF genes worthy of further study in plant growth and development in the form of conductive graph, including IbGRF1 and IbGRF4, and the expression patterns of GRF gene under abiotic and hormonal stress. This study provides a solid foundation for further exploring the molecular evolutionary mechanism and potential biological functions of the sweet potato GRF gene family.

Figure 15.
A conclusive graph of functions of GRFs in sweet potato and its two relatives, I. trifida and I. triloba. The red font means the expression is upregulated, and the blue font means the expression is downregulated. The tissue where the gene responds to stress is shown in parentheses. ss: cold-sensitive “Shenshu 28”, TZ: tuberous roots in heat-sensitive “Ziluolan”, Rool3 (primary root), FR: fibrous root.
Supplementary Materials
The following supporting information can be downloaded at: https://www.mdpi.com/article/10.3390/genes15081064/s1, Figure S1: Expression analysis of I. trifida (a) and I. triloba (b) under hormones treatment (ABA, GA3 and IAA) as determined by RNA-seq; Figure S2: Gene expression patterns of I. trifida (a) and I. triloba (b) under cold stress as determined by RNA-seq; Figure S3: Gene expression patterns of I. trifida (a) and I. triloba (b) under heat stress as determined by RNA-seq; Figure S4: Gene expression patterns of I. trifida (a) and I. triloba (b) under salt and drought Stresses. NACL: salt stress; MANN: drought stress; Table S1: Chromosomal localization of GRFs in I. batatas, I. trifida and I. triloba; Table S2: Ka/Ks analysis and predicted divergence time in I. batatas, I. trifida and I. triloba; Table S3: The qPCR primers of I. batatas; Table S4: The accession number of I. batatas in GenBank Banklt.
Author Contributions
Conceptualization, W.H.; methodology, W.H. and Z.L.; software, W.H., X.L. and Z.L.; formal analysis, X.L., Z.L. and J.M.; investigation, J.M. and H.Z.; resources, H.Z., X.L. and M.H.; writing—original draft preparation, W.H.; writing—review and editing, W.H. and H.Z.; visualization, W.H., X.L. and M.H.; supervision, H.Z.; project administration, H.Z. All authors have read and agreed to the published version of the manuscript.
Funding
This research was funded by the Natural Science Foundation of China Guangdong Joint Fund, China, and Studies on Resistance Resources and Molecular Mechanisms of Sweet Potato Weevil in South China (Grant number, U1701234).
Institutional Review Board Statement
Not applicable.
Informed Consent Statement
Not applicable.
Data Availability Statement
Data are contained within the article or Supplementary Materials.
Acknowledgments
We thank the Ipomoea Genome Hub project team for sharing the I. batatas genome annotation data (https://sweetpotao.com/, accessed on 21 February 2024). Thanks to all authors for their contribution in this study.
Conflicts of Interest
The authors declare that there are no conflicts of interest to report regarding this current study.
References
- Liang, G.; He, H.; Li, Y.; Wang, F.; Yu, D. Molecular Mechanism of microRNA396 Mediating Pistil Development in Arabidopsis. Plant Physiol. 2013, 164, 249–258. [Google Scholar] [CrossRef]
- Rosenquist, M.; Alsterfjord, M.; Larsson, C.; Sommarin, M. Data mining the Arabidopsis genome reveals fifteen 14-3-3 genes. Expression is demonstrated for two out of five novel genes. Plant Physiol. 2001, 127, 142–149. [Google Scholar] [CrossRef] [PubMed]
- Zan, T.; Zhang, L.; Xie, T.; Li, L. Genome-Wide Identification and Analysis of the Growth-Regulating Factor (GRF) Gene Family and GRF-Interacting Factor Family in Triticum aestivum L. Biochem. Genet. 2020, 58, 705–724. [Google Scholar] [CrossRef] [PubMed]
- Carlson, F.D.; Hubbard, J. Physiological and biochemical aspects of nervous integration. Physiol. Zool. 1968, 42, 348–349. [Google Scholar]
- Obsil, T.; Obsilova, V. Structural basis of 14-3-3 protein functions. Semin. Cell Dev. Biol. 2011, 22, 663–672. [Google Scholar] [CrossRef] [PubMed]
- Camoni, L.; Visconti, S.; Aducci, P.; Marra, M. 14-3-3 Proteins in Plant Hormone Signaling: Doing Several Things at Once. Front. Plant Sci. 2018, 9, 297. [Google Scholar] [CrossRef]
- Omidbakhshfard, M.A.; Proost, S.; Fujikura, U.; Mueller-Roeber, B. Growth-Regulating Factors (GRFs): A Small Transcription Factor Family with Important Functions in Plant Biology. Mol. Plant 2015, 8, 998–1010. [Google Scholar] [CrossRef]
- Van der Knaap, E.; Kim, J.H.; Kende, H. A novel gibberellin-induced gene from rice and its potential regulatory role in stem growth. Plant Physiol. 2000, 122, 695–704. [Google Scholar] [CrossRef] [PubMed]
- Li, Y.; Vasupalli, N.; Cai, O.; Lin, X.; Wu, H. Network of miR396-mRNA in Tissue Differentiation in Moso Bamboo (Phyllostachys edulis). Plants 2023, 12, 1103. [Google Scholar] [CrossRef]
- Zhang, D.-F.; Li, B.; Jia, G.-Q.; Zhang, T.-F.; Dai, J.-R.; Li, J.-S.; Wang, S.-C. Isolation and characterization of genes encoding GRF transcription factors and GIF transcriptional coactivators in Maize (Zea mays L.). Plant Sci. 2008, 175, 809–817. [Google Scholar] [CrossRef]
- Kim, J.H.; Choi, D.; Kende, H. The AtGRF family of putative transcription factors is involved in leaf and cotyledon growth in Arabidopsis. Plant J. 2003, 36, 94–104. [Google Scholar] [CrossRef] [PubMed]
- Choi, D.; Kim, J.H.; Kende, H. Whole genome analysis of the OsGRF gene family encoding plant-specific putative transcription activators in rice (Oryza sativa L.). Plant Cell Physiol. 2004, 45, 897–904. [Google Scholar] [CrossRef]
- Wang, F.; Qiu, N.; Ding, Q.; Li, J.; Zhang, Y.; Li, H.; Gao, J. Genome-wide identification and analysis of the growth-regulating factor family in Chinese cabbage (Brassica rapa L. ssp. pekinensis). BMC Genom. 2014, 15, 807. [Google Scholar] [CrossRef] [PubMed]
- Ma, J.Q.; Jian, H.J.; Yang, B.; Lu, K.; Zhang, A.X.; Liu, P.; Li, J.N. Genome-wide analysis and expression profiling of the GRF gene family in oilseed rape (Brassica napus L.). Gene 2017, 620, 36–45. [Google Scholar] [CrossRef] [PubMed]
- FİLİZ, E.; KoÇ, İ.; TombuloĞLu, H. Genome-wide identification and analysis of growth regulating factor genes in Brachypodium distachyon: In silico approaches. Turk. J. Biol. 2014, 38, 296–306. [Google Scholar] [CrossRef]
- Zhu, R.; Cao, B.; Sun, M.; Wu, J.; Li, J. Genome-Wide Identification and Evolution of the GRF Gene Family and Functional Characterization of PbGRF18 in Pear. Int. J. Mol. Sci. 2023, 24, 14690. [Google Scholar] [CrossRef]
- Matías, B.; Florencia, E.M.; Manuel, D.J.; Camila, G.; Rojas, A.M.L.; Florencia, N.; Elena, A.M.; Liesbeth, V.; Dirk, I.; Palatnik, J.F. Robust increase of leaf size by Arabidopsis thaliana GRF3-like transcription factors under different growth conditions. Sci. Rep. 2018, 8, 13447. [Google Scholar]
- Horiguchi, G.; Kim, G.T.; Tsukaya, H. The transcription factor AtGRF5 and the transcription coactivator AN3 regulate cell proliferation in leaf primordia of Arabidopsis thaliana. Plant J. 2005, 43, 68–78. [Google Scholar] [CrossRef] [PubMed]
- Kim, J.S.; Mizoi, J.; Kidokoro, S.; Maruyama, K.; Nakajima, J.; Nakashima, K.; Mitsuda, N.; Takiguchi, Y.; Ohme-Takagi, M.; Kondou, Y. Arabidopsis growth-regulating factor7 functions as a transcriptional repressor of abscisic acid- and osmotic stress-responsive genes, including DREB2A. Plant Cell 2012, 24, 3393–3405. [Google Scholar] [CrossRef]
- Amin, O.M.; Ushio, F.; Jadwiga, O.J.; Gang-Ping, X.; Salma, B.; Bernd, M.R.; Scott, P.R. GROWTH-REGULATING FACTOR 9 negatively regulates arabidopsis leaf growth by controllingORG3and restricting cell proliferation in leaf primordia. PLoS Genet. 2018, 14, e1007484. [Google Scholar]
- Diao, Z.; Yu, M.; Bu, S.; Duan, Y.; Zhang, L.; Wu, W. Functional characterization of OsmiR396a in rice (Oryza sativa L.). Plant Growth Regul. Int. J. Nat. Synth. Regul. 2018, 85, 351–361. [Google Scholar] [CrossRef]
- Li, S.; Gao, F.; Xie, K.; Zeng, X.; Cao, Y.; Zeng, J.; He, Z.; Ren, Y.; Li, W.; Deng, Q. The OsmiR396c-OsGRF4-OsGIF1 regulatory module determines grain size and yield in rice. Plant Biotechnol. J. 2016, 14, 2134–2146. [Google Scholar] [CrossRef]
- Gao, F.; Wang, K.; Liu, Y.; Chen, Y.; Chen, P.; Shi, Z.; Luo, J.; Jiang, D.; Fan, F.; Zhu, Y.; et al. Blocking miR396 increases rice yield by shaping inflorescence architecture. Nat. Plants 2015, 2, 15196. [Google Scholar] [CrossRef] [PubMed]
- Chen, Y.; Dan, Z.; Li, S. Rice GROWTH-REGULATING FACTOR 7 controls tiller number by regulating strigolactone synthesis. Plant Signal. Behav. 2020, 15, 1804685. [Google Scholar] [CrossRef] [PubMed]
- Dai, Z.; Tan, J.; Zhou, C.; Yang, X.; Shi, Z. The OsmiR396-OsGRF8-OsF3H-flavonoid pathway mediates resistance to the brown planthopper in rice (Oryza sativa). Plant Biotechnol. J. 2019, 17, 1657–1669. [Google Scholar] [CrossRef] [PubMed]
- Yang, X.; Zhao, X.; Dai, Z.; Ma, F.; Miao, X.; Shi, Z. OsmiR396/Growth Regulating Factor modulate rice grain size through direct regulation of embryo-specific miR408. Plant Physiol. 2021, 186, 519–533. [Google Scholar] [CrossRef] [PubMed]
- Zhang, S.; Li, G.; Wang, Y.; Anwar, A.; He, B.; Zhang, J.; Chen, C.; Hao, Y.; Chen, R.; Song, S. Genome-wide identification of BcGRF genes in flowering Chinese cabbage and preliminary functional analysis of BcGRF8 in nitrogen metabolism. Front. Plant Sci. 2023, 14, 1144748. [Google Scholar] [CrossRef] [PubMed]
- Fu, M.K.; He, Y.N.; Yang, X.Y.; Tang, X.; Wang, M.; Dai, W.S. Genome-wide identification of the GRF family in sweet orange (Citrus sinensis) and functional analysis of the CsGRF04 in response to multiple abiotic stresses. BMC Genom. 2024, 25, 37. [Google Scholar] [CrossRef]
- Zhang, B.; Tong, Y.; Luo, K.; Zhai, Z.; Liu, X.; Shi, Z.; Zhang, D.; Li, D. Identification of GROWTH-REGULATING FACTOR transcription factors in lettuce (Lactuca sativa) genome and functional analysis of LsaGRF5 in leaf size regulation. BMC Plant Biol. 2021, 21, 485. [Google Scholar] [CrossRef]
- Zhu, Y.; Kuang, W.; Leng, J.; Wang, X.; Qiu, L.; Kong, X.; Wang, Y.; Zhao, Q. The apple 14-3-3 gene MdGRF6 negatively regulates salt tolerance. Front. Plant Sci. 2023, 14, 1161539. [Google Scholar] [CrossRef]
- Wang, S.; Nie, S.; Zhu, F. Chemical constituents and health effects of sweet potato. Food Res. Int. 2016, 89, 90–116. [Google Scholar] [CrossRef] [PubMed]
- Yang, J.; Moeinzadeh, M.H.; Kuhl, H.; Helmuth, J.; Xiao, P.; Haas, S.; Liu, G.; Zheng, J.; Sun, Z.; Fan, W.; et al. Haplotype-resolved sweet potato genome traces back its hexaploidization history. Nat. Plants 2017, 3, 696–703. [Google Scholar] [CrossRef] [PubMed]
- Liu, Q. Improvement for agronomically important traits by gene engineering in sweetpotato. Breed. Sci. 2017, 67, 15–26. [Google Scholar] [CrossRef] [PubMed]
- Wan, F.X.; Gao, J.; Wang, G.L.; Niu, Y.; Wang, L.Z.; Zhang, X.G.; Wang, Y.Q.; Pan, Y. Genome-wide identification of NAC transcription factor family and expression analysis of ATAF subfamily members under abiotic stress in eggplant. Sci. Hortic. 2021, 289, 110424. [Google Scholar] [CrossRef]
- Liu, Z.; Fu, M.; Li, H.; Chen, Y.; Wang, L.; Liu, R. Systematic analysis of NAC transcription factors in Gossypium barbadense uncovers their roles in response to Verticillium wilt. PeerJ 2019, 7, e7995. [Google Scholar] [CrossRef] [PubMed]
- Pan, J.; Zhang, Q.; Liu, S.; Liu, Z.; Bian, X.; Yu, T. De novo transcriptome sequencing and gene expression profiling of sweetpotato leaves during low temperature stress. Plant Biotechnol. Rep. 2023, 17, 875–888. [Google Scholar] [CrossRef]
- Wu, S.; Lau, K.H.; Cao, Q.; Hamilton, J.P.; Sun, H.; Zhou, C.; Eserman, L.; Gemenet, D.C.; Olukolu, B.A.; Wang, H.; et al. Genome sequences of two diploid wild relatives of cultivated sweetpotato reveal targets for genetic improvement. Nat. Commun. 2018, 9, 4580. [Google Scholar] [CrossRef] [PubMed]
- Kim, J.H.; Tsukaya, H. Regulation of plant growth and development by the GROWTH-REGULATING FACTOR and GRF-INTERACTING FACTOR duo. J. Exp. Bot. 2015, 66, 6093–6107. [Google Scholar] [CrossRef]
- Dai, Z.; Yan, P.; He, S.; Jia, L.; Wang, Y.; Liu, Q.; Zhai, H.; Zhao, N.; Gao, S.; Zhang, H. Genome-Wide Identification and Expression Analysis of SWEET Family Genes in Sweet Potato and Its Two Diploid Relatives. Int. J. Mol. Sci. 2022, 23, 15848. [Google Scholar] [CrossRef]
- Jiang, Z.; Zhang, H.; Gao, S.; Zhai, H.; He, S.; Zhao, N.; Liu, Q. Genome-Wide Identification and Expression Analysis of the Sucrose Synthase Gene Family in Sweet Potato and Its Two Diploid Relatives. Int. J. Mol. Sci. 2023, 24, 12493. [Google Scholar] [CrossRef] [PubMed]
- Li, Z.; Shi, L.; Lin, X.; Tang, B.; Xing, M.; Zhu, H. Genome-Wide Identification and Expression Analysis of Malate Dehydrogenase Gene Family in Sweet Potato and Its Two Diploid Relatives. Int. J. Mol. Sci. 2023, 24, 16549. [Google Scholar] [CrossRef]
- Houjun, Z.; Kaili, W.; Cheng, J.; Yanqiu, Z.; Xueqin, S.; Mengzhu, L. Negative Regulation of GRF1/2d on the Formation and Development of Adventitious Roots in Populus alba × P. glandulosa ‘84K’. Sci. Silvae Sin. 2017, 53, 33–39. [Google Scholar]
- Khisti, M.; Avuthu, T.; Yogendra, K.; Valluri, V.K.; Kudapa, H.; Reddy, P.S.; Tyagi, W. Genome-wide identification and expression profiling of growthregulating factor (GRF) and GRFinteracting factor (GIF) gene families in chickpea and pigeonpea. Sci. Rep. 2024, 14, 17178. [Google Scholar] [CrossRef] [PubMed]
- Chen, F.; Yang, Y.; Luo, X.; Zhou, W.; Shu, K. Genome-wide identification of GRF transcription factors in soybean and expression analysis of GmGRF family under shade stress. BMC Plant Biol. 2019, 19, 269. [Google Scholar] [CrossRef] [PubMed]
- Xu, G.; Guo, C.; Shan, H.; Kong, H. Divergence of duplicate genes in exon-intron structure. Proc. Natl. Acad. Sci. USA 2012, 109, 1187–1192. [Google Scholar] [CrossRef] [PubMed]
- Kim, J.H. Biological roles and an evolutionary sketch of the GRF-GIF transcriptional complex in plants. BMB Rep. 2019, 52, 227–238. [Google Scholar] [CrossRef] [PubMed]
- Bolduc, N.; Hake, S. The Maize Transcription Factor KNOTTED1 Directly Regulates the Gibberellin Catabolism Gene ga2ox1. Plant Cell 2009, 21, 1647–1658. [Google Scholar] [CrossRef]
- Daviere, J.M.; Achard, P. Gibberellin signaling in plants. Development 2013, 140, 1147–1151. [Google Scholar] [CrossRef]
- Kuijt, S.J.H.; Greco, R.; Agalou, A.; Shao, J.; Hoen, C.C.J.T.; Overnas, E.; Osnato, M.; Curiale, S.; Meynard, D.; Gulik, R.V. Interaction between the GROWTH-REGULATING FACTOR and KNOTTED1-LIKE HOMEOBOX Families of Transcription Factors. Plant Physiol. 2014, 164, 1952–1966. [Google Scholar] [CrossRef]
- Modulating plant growth-metabolism coordination for sustainable agriculture. Sci. Found. China 2018.
- Adam, K.; Hupp, T.R.; Matej, L.; Borivoj, V.; Petr, M. Hammock: A hidden Markov model-based peptide clustering algorithm to identify protein-interaction consensus motifs in large datasets. Bioinformatics 2016, 32, 9–16. [Google Scholar]
- Altschul, S.; Gish, W.; Miller, W.; Myers, E.; Lipman, D. Basic local alignment search tool. J. Mol. Biol. 1990, 215, 403–410. [Google Scholar] [CrossRef] [PubMed]
- Jrg, S.; Copley, R.R.; Tobias, D.; Ponting, C.P.; Peer, B. SMART: A web-based tool for the study of genetically mobile domains. Nucleic Acids Res. 2000, 28, 231–234. [Google Scholar]
- Chen, C.; Chen, H.; Zhang, Y.; Thomas, H.R.; Xia, R. TBtools: An Integrative Toolkit Developed for Interactive Analyses of Big Biological Data. Mol. Plant 2020, 13, 1194–1202. [Google Scholar] [CrossRef]
- Paul, H.; Keun-Joon, P.; Takeshi, O.; Naoya, F.; Hajime, H.; Adams-Collier, C.J.; Kenta, N. WoLF PSORT: Protein localization predictor. Nucleic Acids Res. 2007, 35, 585–587. [Google Scholar]
- Wang, Y.; Tang, H.; DeBarry, J.D.; Tan, X.; Li, J.; Wang, X.; Lee, T.H.; Jin, H.; Marler, B.; Guo, H.; et al. MCScanX: A toolkit for detection and evolutionary analysis of gene synteny and collinearity. Nucleic Acids Res. 2012, 40, e49. [Google Scholar] [CrossRef] [PubMed]
- Yan, H.; Ma, G.; Silva, J.A.T.D.; Qiu, L.; Xu, J.; Zhou, H.; Wei, M.; Xiong, J.; Li, M.; Zhou, S.; et al. Genome-Wide Identification and Analysis of NAC Transcription Factor Family in Two Diploid Wild Relatives of Cultivated Sweet Potato Uncovers Potential NAC Genes Related to Drought Tolerance. Front. Genet. 2021, 12, 744220. [Google Scholar] [CrossRef]
- Sudhir, K.; Glen, S.; Koichiro, T. MEGA7: Molecular Evolutionary Genetics Analysis Version 7.0 for Bigger Datasets. Mol. Biol. Evol. 2016, 33, 1870–1874. [Google Scholar]
- Subramanian, B.; Gao, S.; Lercher, M.J.; Hu, S.; Chen, W.H. Evolview v3: A webserver for visualization, annotation, and management of phylogenetic trees. Nuclc Acids Res. 2019, 47, W270–W275. [Google Scholar] [CrossRef]
- Bailey, T.L.; Boden, M.; Buske, F.A.; Frith, M.; Grant, C.E.; Clementi, L.; Ren, J.; Li, W.W.; Noble, W.S. MEME SUITE tools for motif discovery and searching. Nucleic Acids Res. 2009, 37, W202–W208. [Google Scholar] [CrossRef] [PubMed]
- Lescot, M. PlantCARE, a database of plant cis-acting regulatory elements and a portal to tools for in silico analysis of promoter sequences. Nucleic Acids Res. 2002, 30, 325–327. [Google Scholar] [CrossRef]
- Mering, C.V.; Jensen, L.J.; Snel, B.; Hooper, S.D.; Krupp, M.; Foglierini, M.; Jouffre, N.; Huynen, M.A.; Bork, P. STRING: Known and predicted protein–protein associations, integrated and transferred across organisms. Nucleic Acids Res. 2005, 33, D433–D437. [Google Scholar] [CrossRef] [PubMed]
- Shannon, P. Cytoscape: A Software Environment for Integrated Models of Biomolecular Interaction Networks. Genome Res. 2003, 13, 2498–2504. [Google Scholar] [CrossRef] [PubMed]
- Rauluseviciute, I.; Riudavets-Puig, R.; Blanc-Mathieu, R.; Castro-Mondragon, J.A.; Ferenc, K.; Kumar, V.; Lemma, R.B.; Lucas, J.; Chèneby, J.; Baranasic, D.; et al. JASPAR 2024: 20th anniversary of the open-access database of transcription factor binding profiles. Nucleic Acids Res. 2024, 52, D174–D182. [Google Scholar] [CrossRef] [PubMed]
- Florea, L.; Song, L.; Salzberg, S.L. Thousands of exon skipping events differentiate among splicing patterns in sixteen human tissues. F1000Research 2013, 2, 188. [Google Scholar] [CrossRef] [PubMed]
- Simms, D.; Chomczynski, P. TRIzolTM: A new reagent for optimal single-step isolation of RNA. Focus 1992, 15, 532–535. [Google Scholar]
- Shao, Z.; He, M.; Zeng, Z.; Chen, Y.; Hanna, A.D.; Zhu, H. Genome-Wide Identification and Expression Analysis of the MADS-Box Gene Family in Sweet Potato [Ipomoea batatas (L.) Lam]. Front. Genet. 2021, 12, 750137. [Google Scholar] [CrossRef] [PubMed]
- Ding, N.; Wang, A.; Zhang, X.; Wu, Y.; Wang, R.; Cui, H.; Huang, R.; Luo, Y. Identification and analysis of glutathione S-transferase gene family in sweet potato reveal divergent GST-mediated networks in aboveground and underground tissues in response to abiotic stresses. BMC Plant Biol. 2017, 17, 225. [Google Scholar] [CrossRef]
Disclaimer/Publisher’s Note: The statements, opinions and data contained in all publications are solely those of the individual author(s) and contributor(s) and not of MDPI and/or the editor(s). MDPI and/or the editor(s) disclaim responsibility for any injury to people or property resulting from any ideas, methods, instructions or products referred to in the content. |
© 2024 by the authors. Licensee MDPI, Basel, Switzerland. This article is an open access article distributed under the terms and conditions of the Creative Commons Attribution (CC BY) license (https://creativecommons.org/licenses/by/4.0/).