
Identification of KSR2 Variants in Pediatric Patients with Severe Early-Onset Obesity from Qatar
 ,
,
Abstract
:
1. Introduction
2. Materials and Methods
2.1. Ethical Approval and Family Enrolment
2.2. Whole Genome Sequencing and Variants Analysis
2.3. In Silico Modelling
2.4. Variant Searching through the Qatar Genome Program (QGP) Dataset
2.5. Statistical Analysis
3. Case Presentations
- Case 1
- Case 2
- Cases 3 and 4
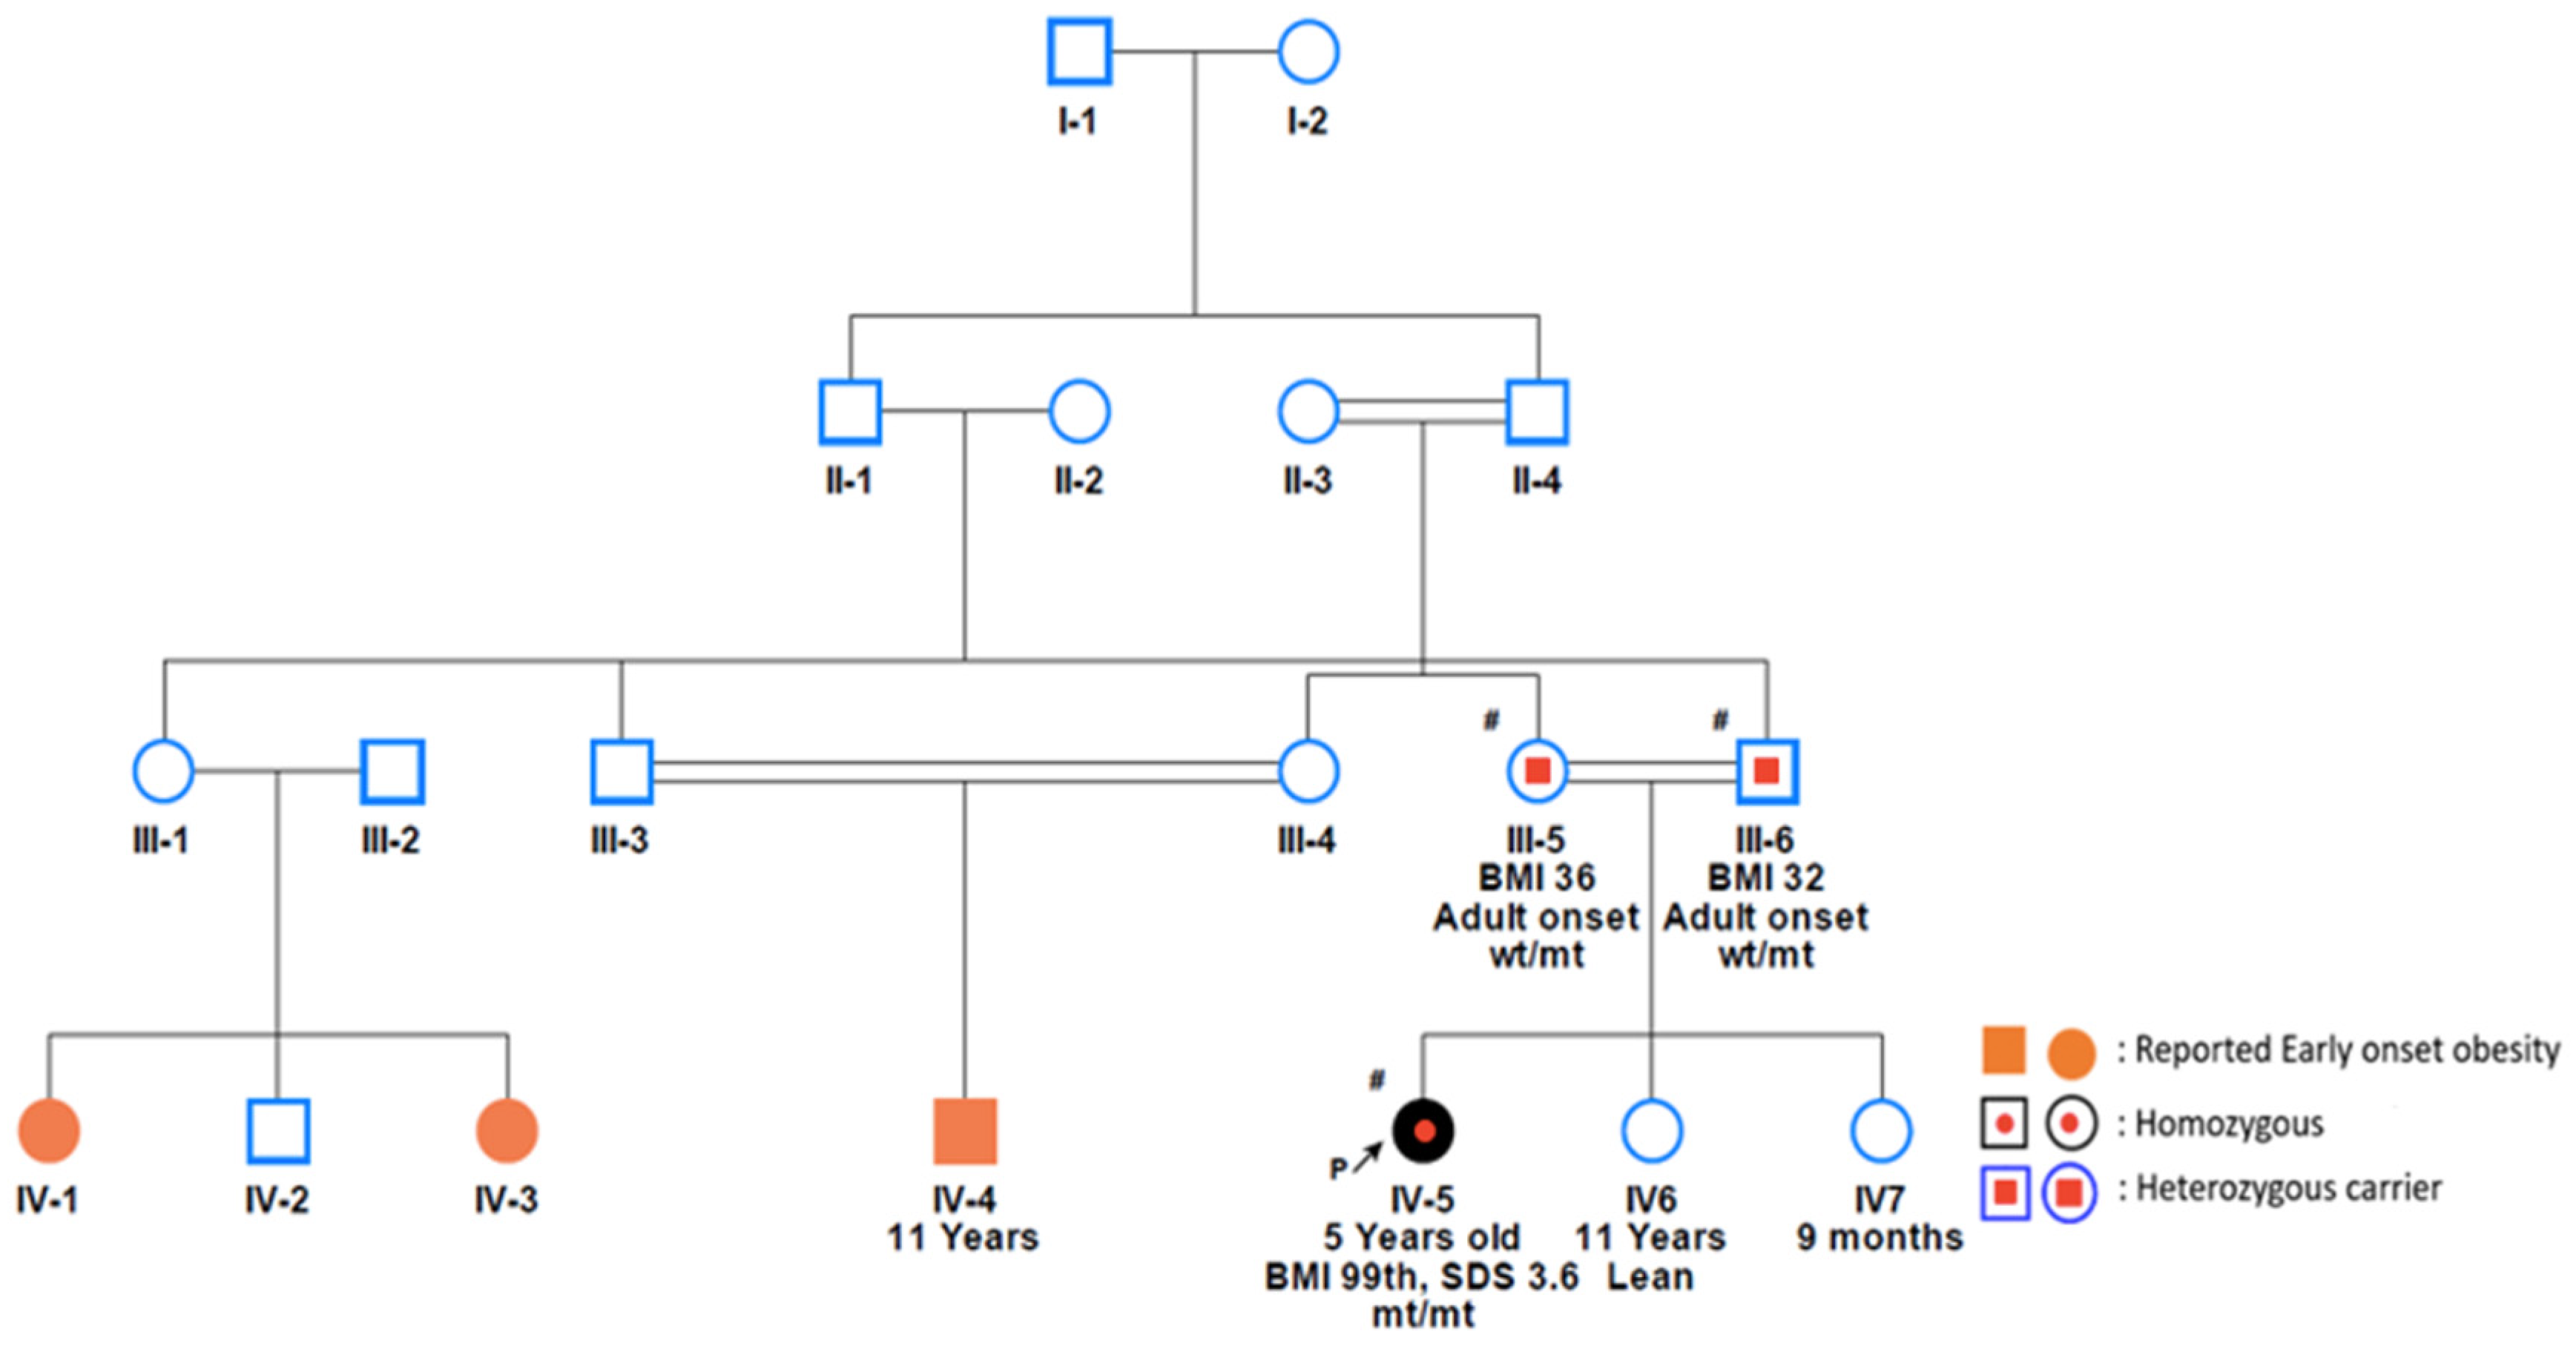
- Case 5
- Case 6
- Case 7
- Case 8
- Case 9
4. Variants Analysis
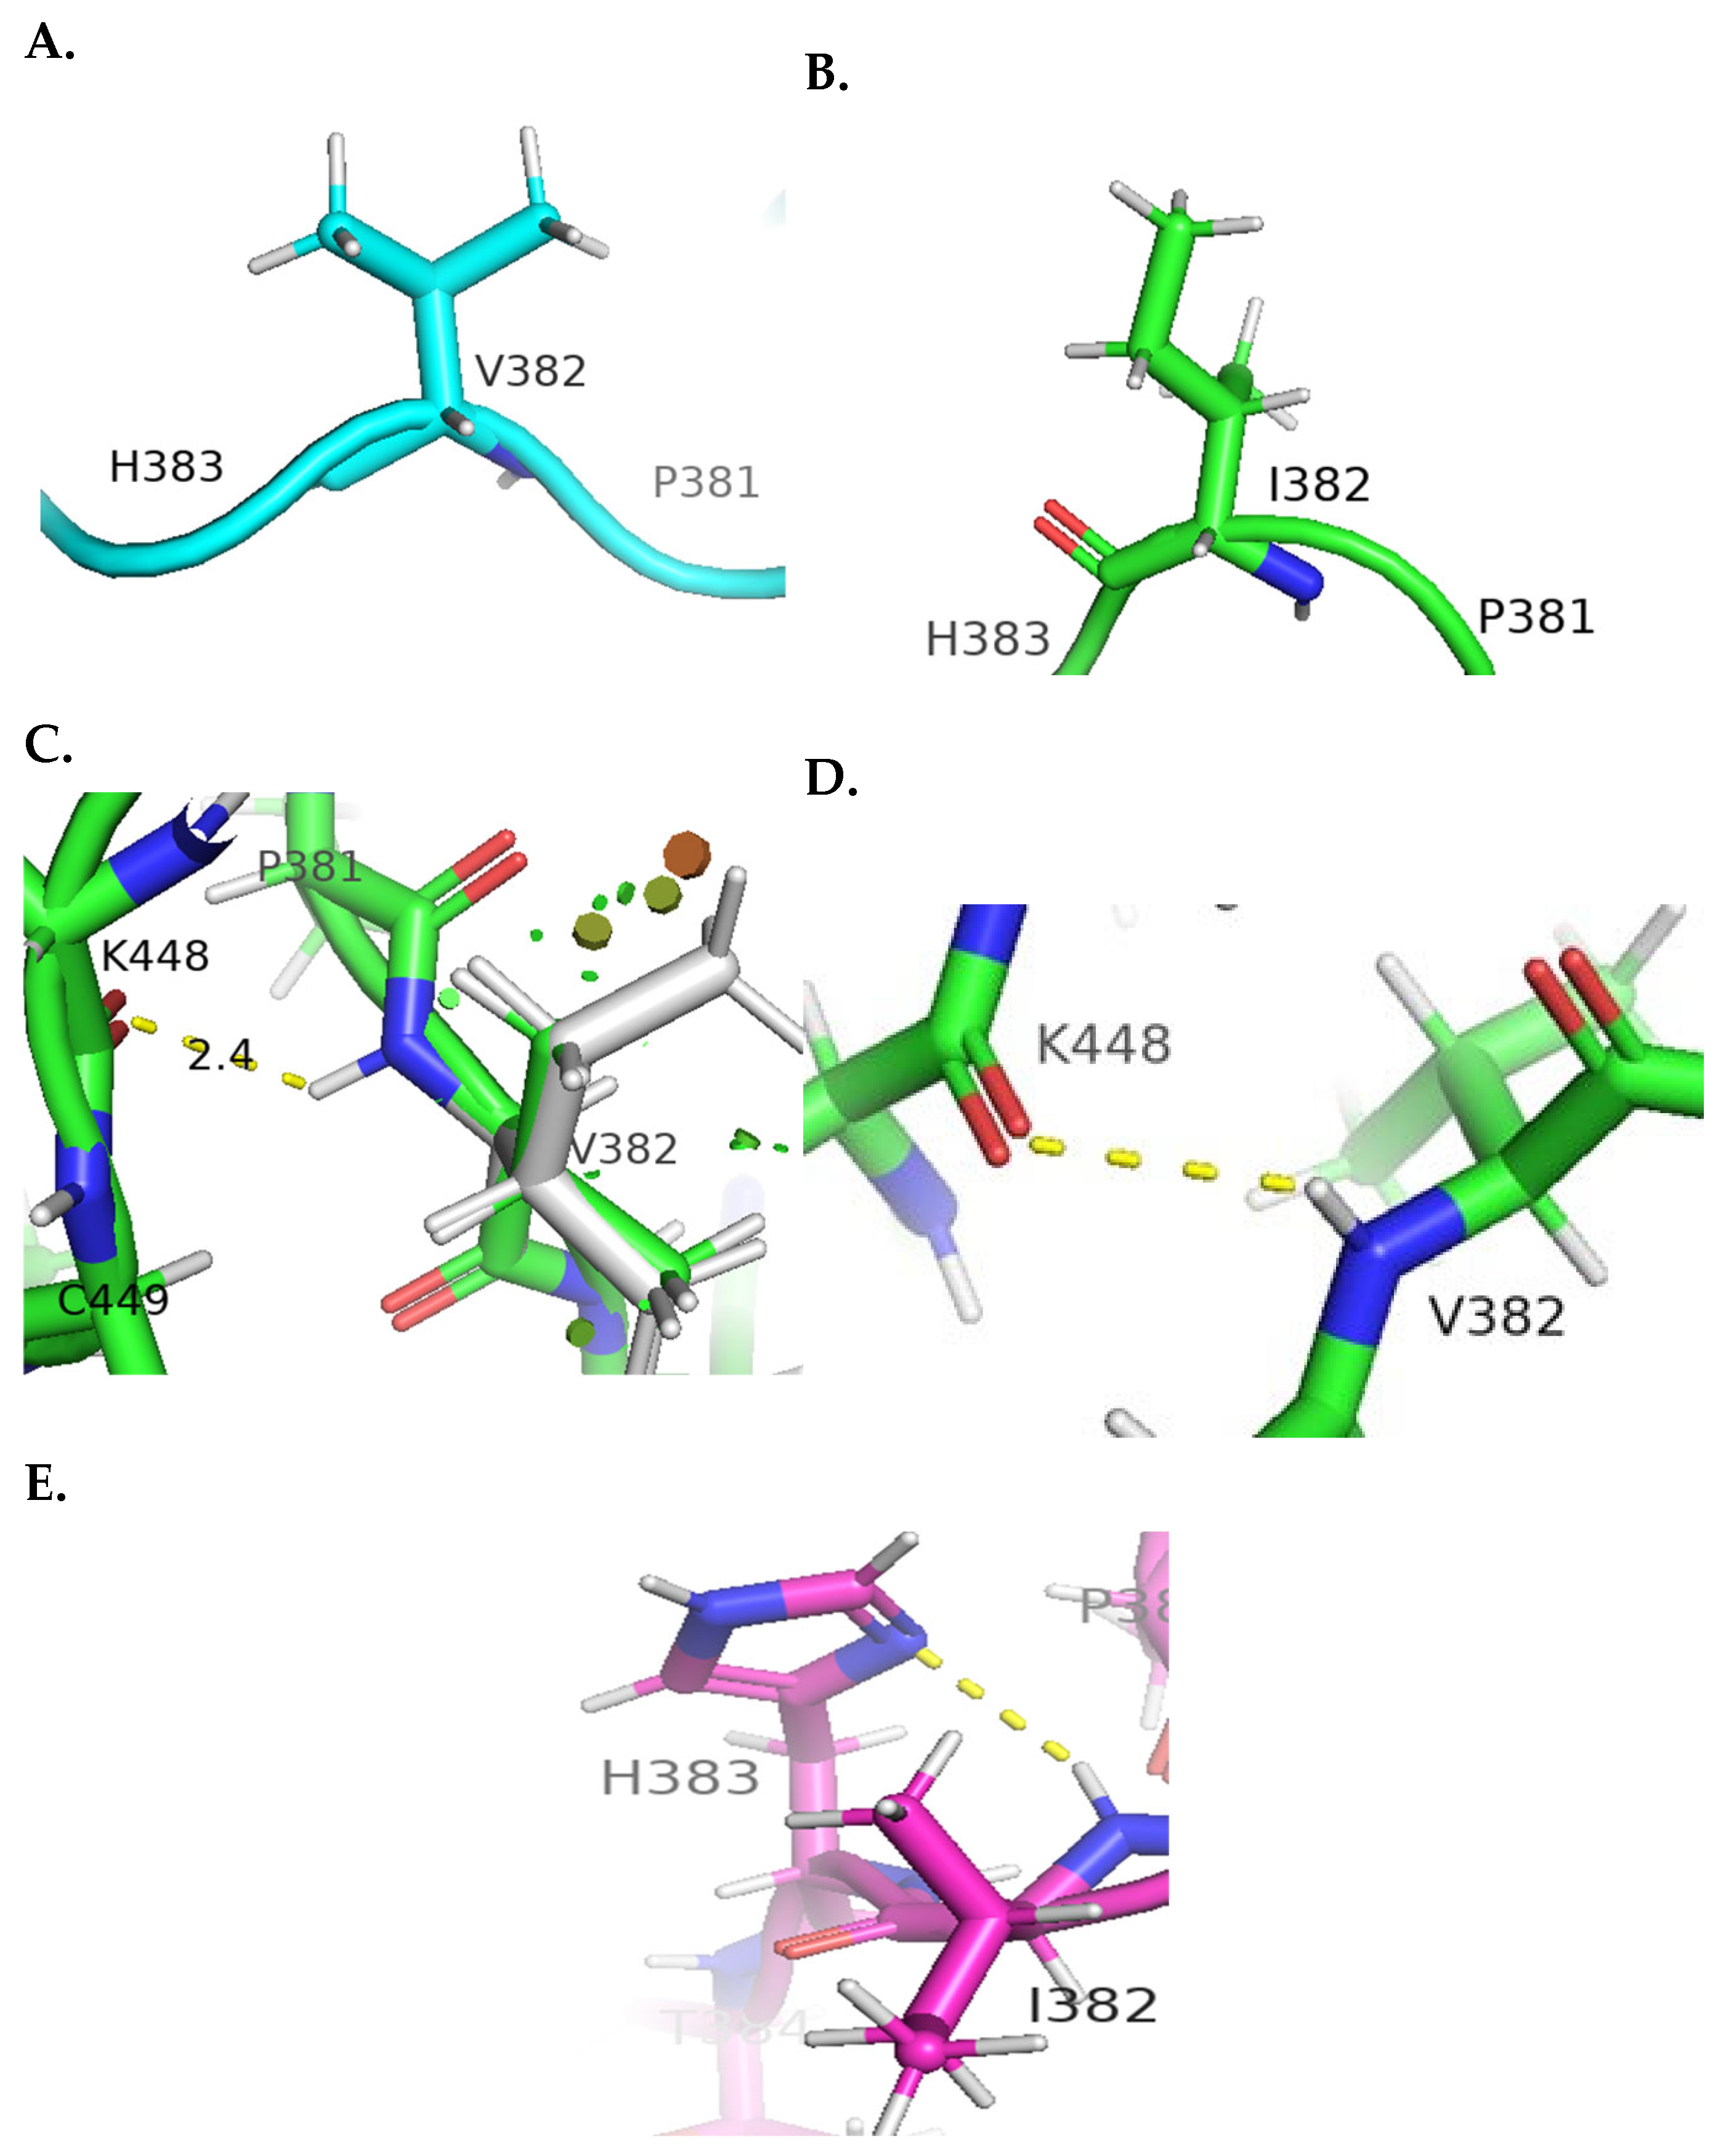
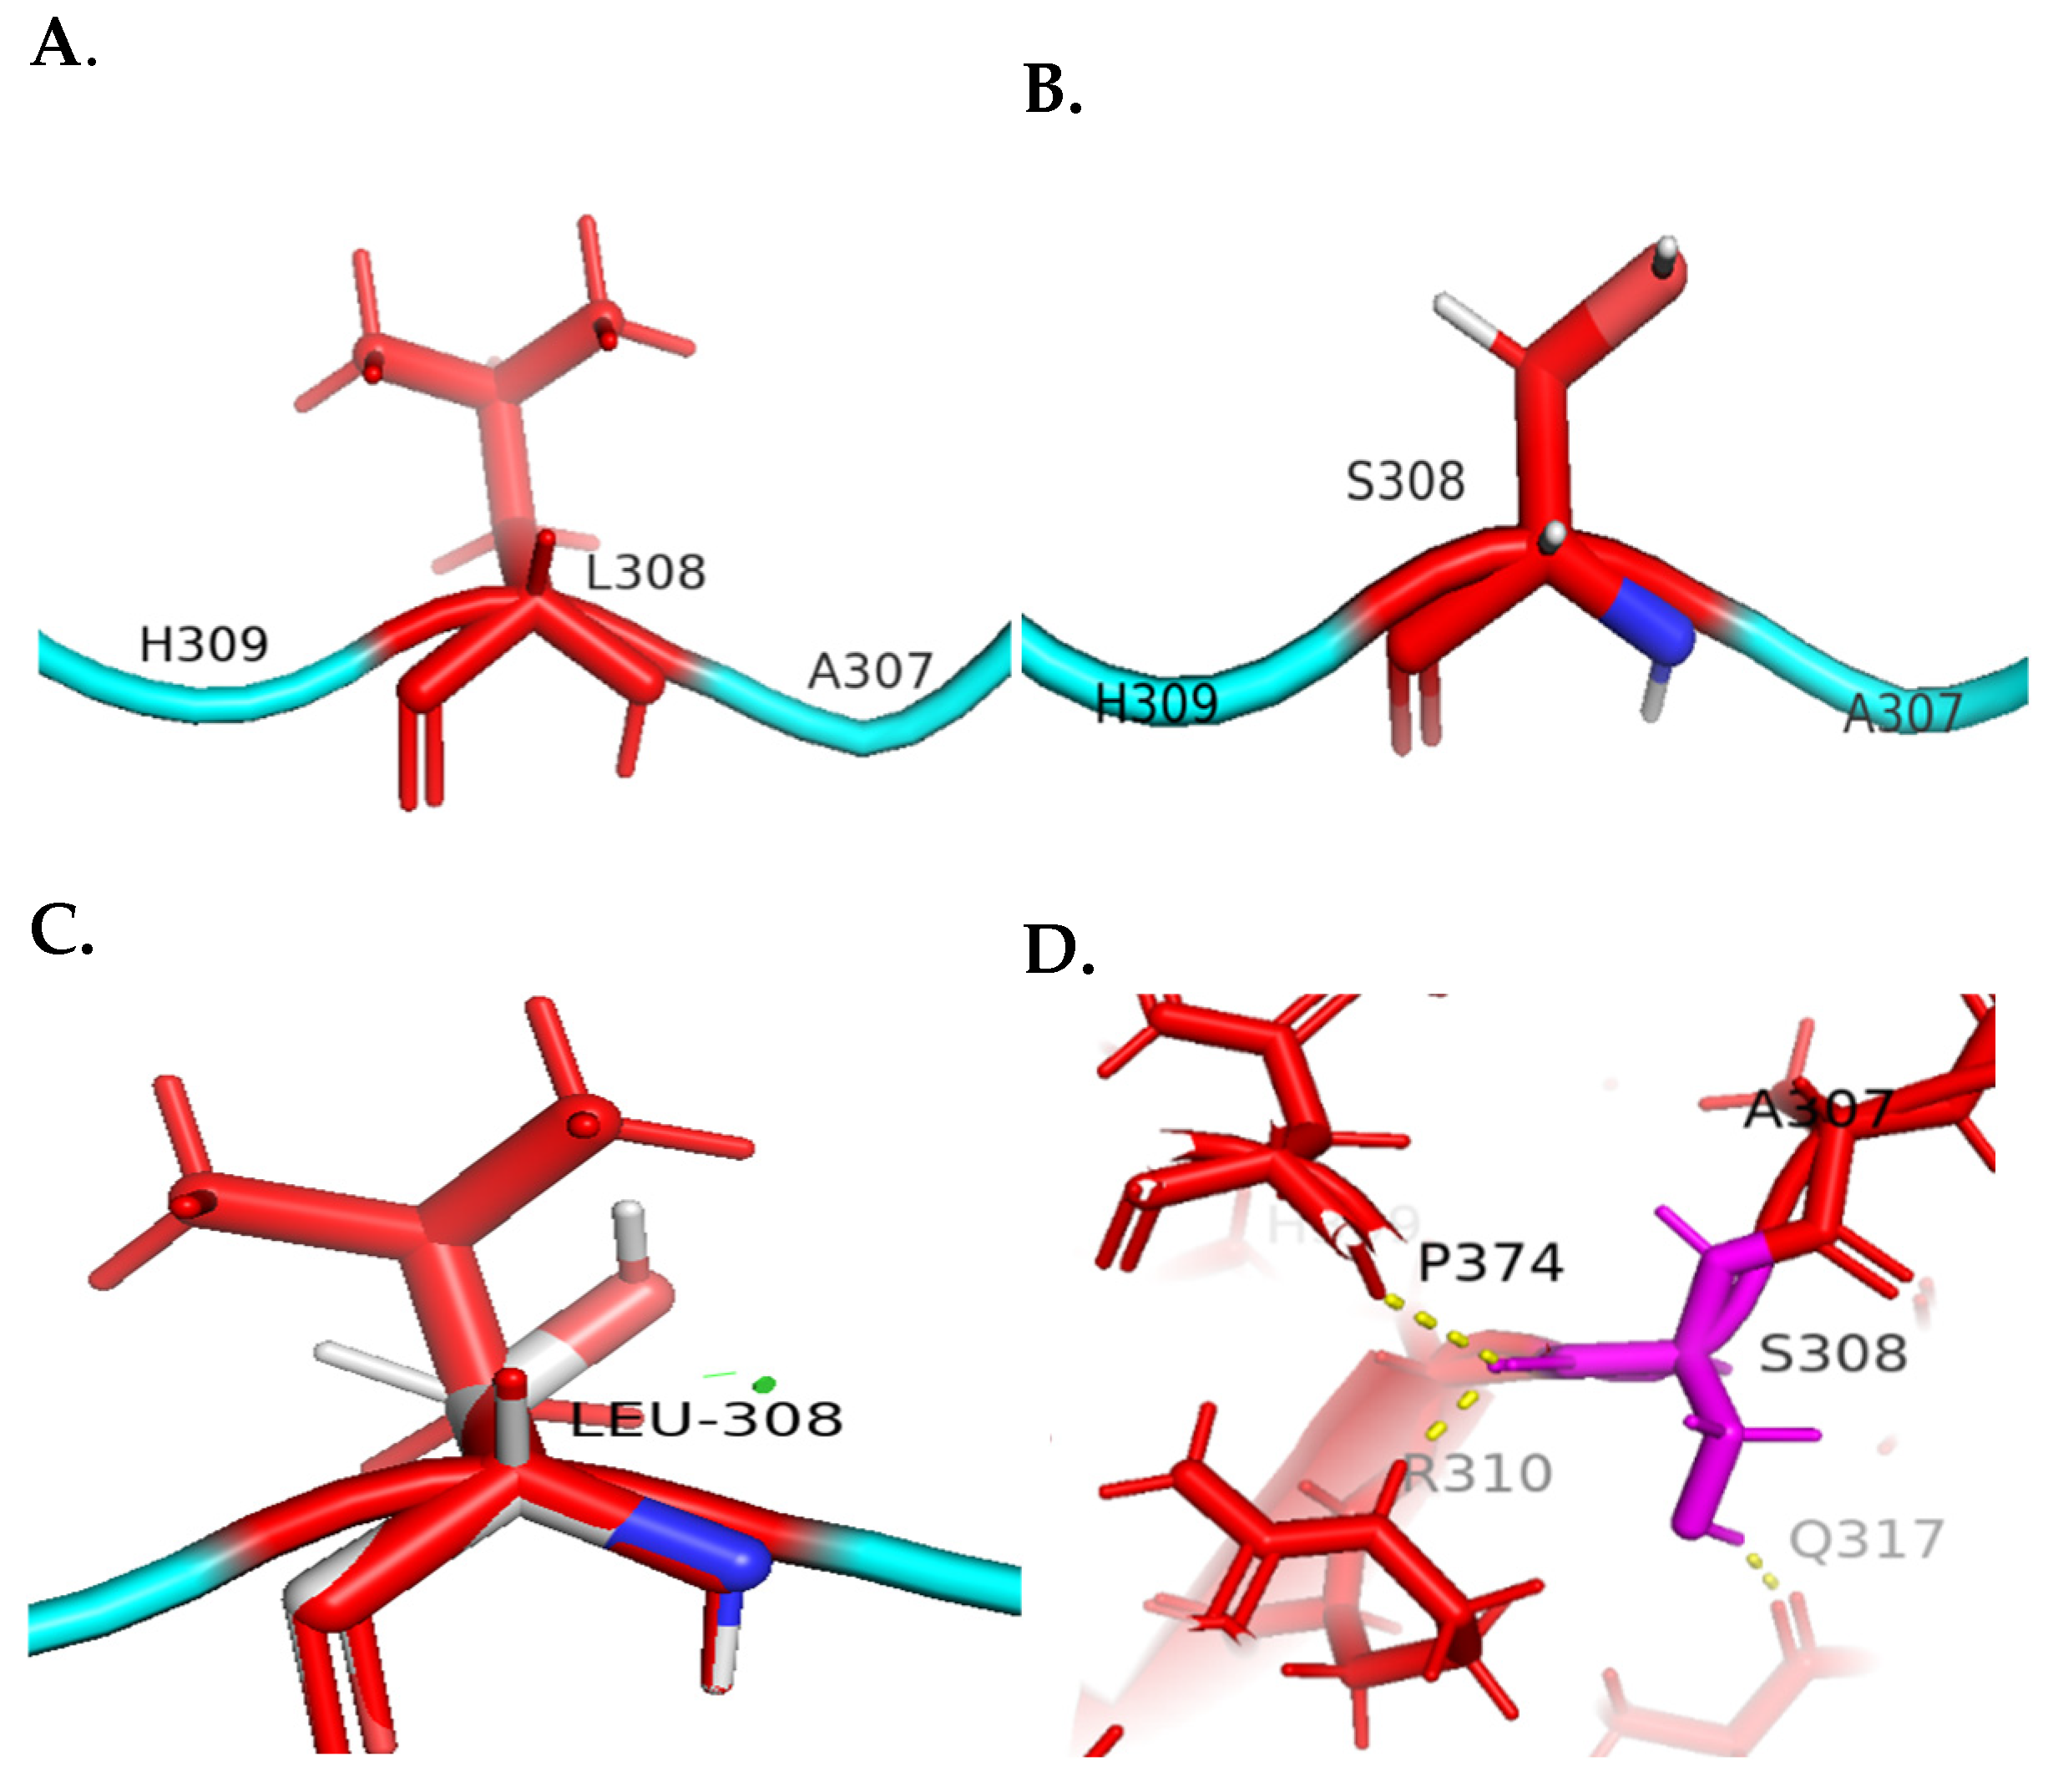
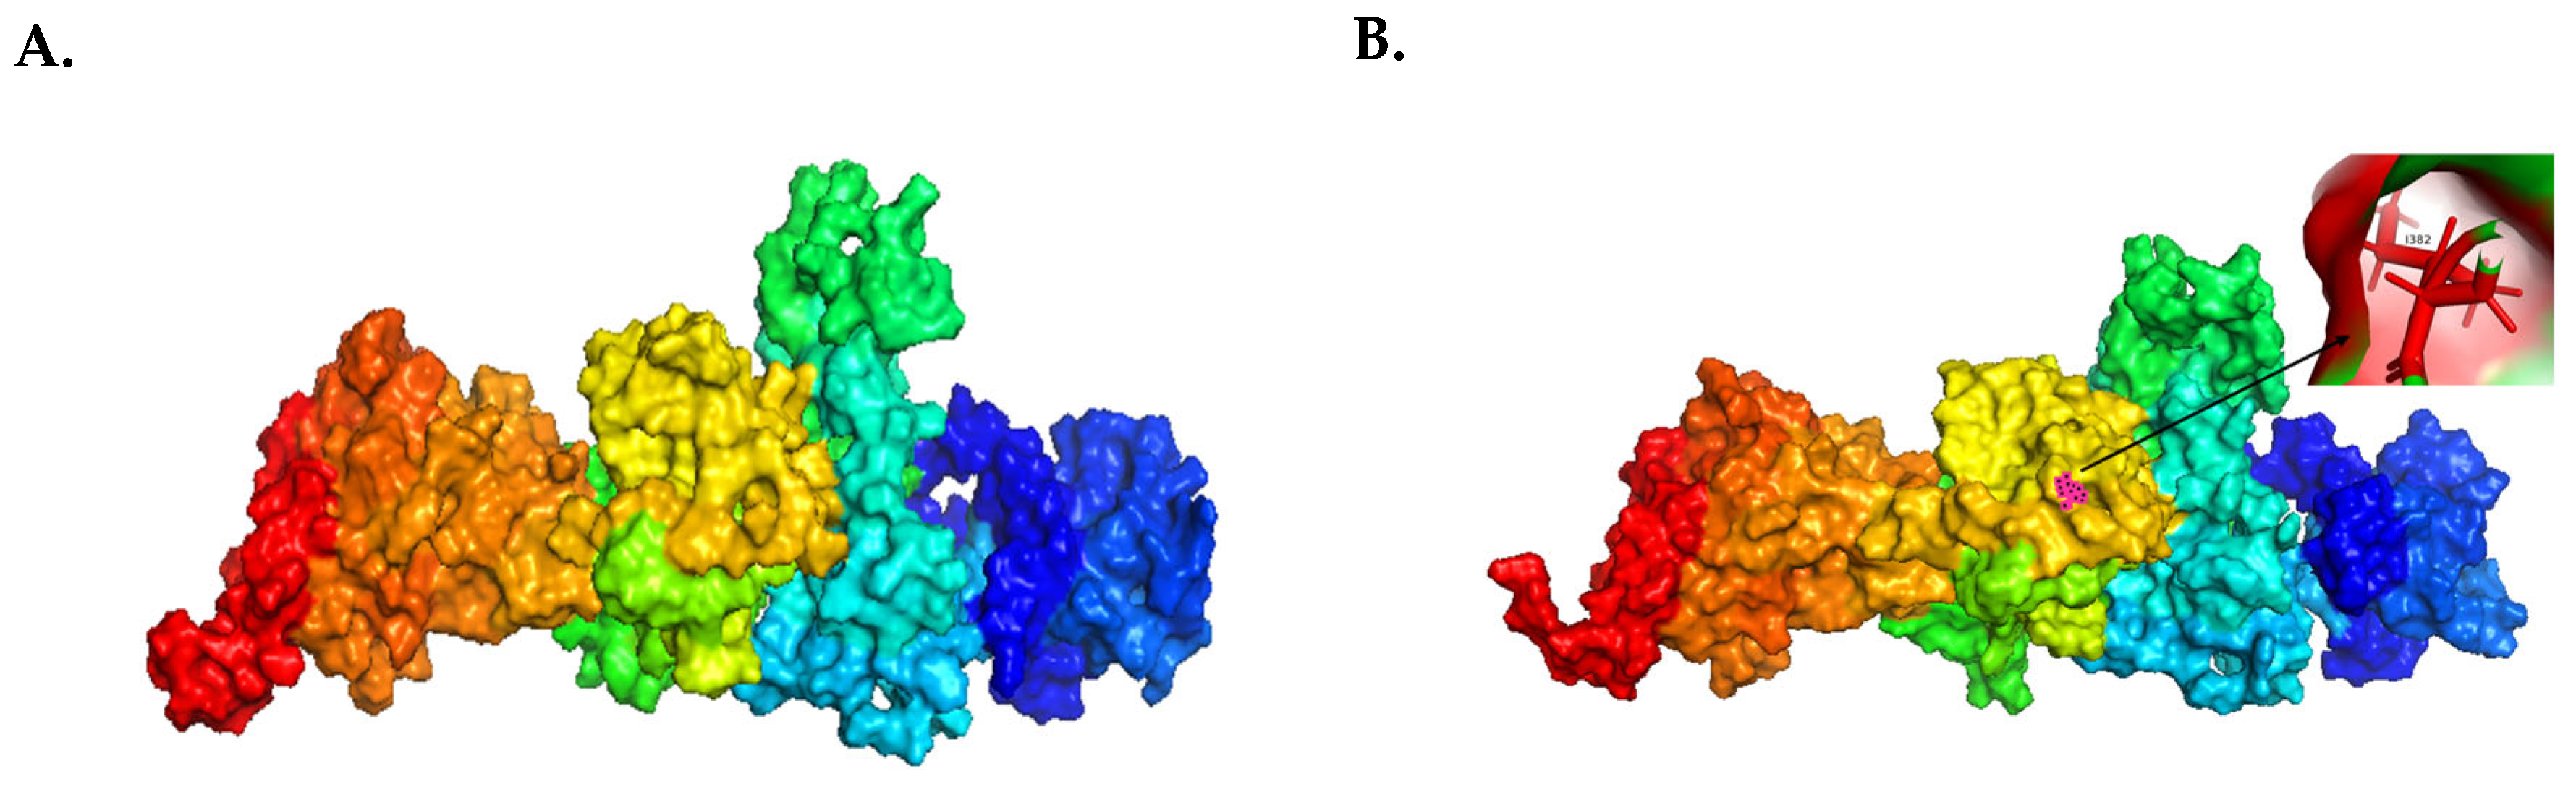
4.1. Molecular Visualization Analysis
4.2. Enrichment Analysis
5. Discussion
6. Conclusions
Author Contributions
Funding
Institutional Review Board Statement
Informed Consent Statement
Data Availability Statement
Acknowledgments
Conflicts of Interest
References
- World Obesity Orginization. World Obesity Atlas 2023 [Internet]. World Obesity Organization. 2023. Available online: https://s3-eu-west-1.amazonaws.com/wof-files/World_Obesity_Atlas_2023_Report.pdf (accessed on 7 August 2023).
- Okati-Aliabad, H.; Ansari-Moghaddam, A.; Kargar, S.; Jabbari, N. Prevalence of Obesity and Overweight among Adults in the Middle East Countries from 2000 to 2020: A Systematic Review and Meta-Analysis. J. Obes. 2022, 2022, e8074837. [Google Scholar] [CrossRef]
- Rizk, N.M.; Yousef, M. Association of lipid profile and waist circumference as cardiovascular risk factors for overweight and obesity among school children in Qatar. Diabetes Metab. Syndr. Obes. Targets Ther. 2012, 5, 425–432. [Google Scholar] [CrossRef] [PubMed]
- Al-Thani, M.H.; Alyafei, S.A.; Al-Mutawa, K.A.; Khalifa, S.A.H.; Mishra, A.; Poovelil, B.V.; Abdellatif, A.A.; Toumi, A.A.; Kokku, S.B. School children growth monitoring program in the state of Qatar: Observations from two survey rounds in 2016–17 and 2019–20. Public Health Chall. 2023, 1, e52. [Google Scholar] [CrossRef]
- Trang, K.; Grant, S.F.A. Genetics and Epigenetics in the Obesity Phenotyping Scenario. Rev. Endocr. Metab. Disord. 2023, 24, 775–793. [Google Scholar] [CrossRef] [PubMed]
- Elks, C.E.; Den Hoed, M.; Zhao, J.H.; Sharp, S.J.; Wareham, N.J.; Loos, R.J.; Ong, K.K. Variability in the Heritability of Body Mass Index: A Systematic Review and Meta-Regression. Front. Endocrinol. 2012, 3, 29. [Google Scholar] [CrossRef]
- Thaker, V.V. GENETIC AND EPIGENETIC CAUSES OF OBESITY. Adolesc. Med. State Art. Rev. 2017, 2, 379–405. [Google Scholar]
- Sohn, Y.B. The genetics of obesity: A narrative review. Precis. Future Med. 2022, 6, 226–232. [Google Scholar] [CrossRef]
- Huvenne, H.; Dubern, B.; Clément, K.; Poitou, C. Rare Genetic Forms of Obesity: Clinical Approach and Current Treatments in 2016. Obes Facts. 2016, 9, 158–173. [Google Scholar] [CrossRef] [PubMed]
- Loos, R.J.F.; Yeo, G.S.H. The genetics of obesity: From discovery to biology. Nat. Rev. Genet. 2022, 2, 120–133. [Google Scholar] [CrossRef] [PubMed]
- Ranadive, S.A.; Vaisse, C. Lessons from Extreme Human Obesity: Monogenic Disorders. Endocrinol. Metab. Clin. N. Am. 2008, 3, 733–751. [Google Scholar] [CrossRef]
- Mazen, I.H.; El-Gammal, M.A.; Elaidy, A.A.; Anwar, G.M.; Ashaat, E.A.; Abdel-Ghafar, S.F.; Abdel-Hamid, M.S. Congenital leptin and leptin receptor deficiencies in nine new families: Identification of six novel variants and review of literature. Mol. Genet. Genom. 2023, 298, 919–929. [Google Scholar] [CrossRef]
- Šket, R.; Kotnik, P.; Bizjan, B.J.; Kocen, V.; Mlinarič, M.; Tesovnik, T.; Debeljak, M.; Battelino, T.; Kovač, J. Heterozygous Genetic Variants in Autosomal Recessive Genes of the Leptin-Melanocortin Signalling Pathway Are Associated with the Development of Childhood Obesity. Front. Endocrinol. 2022, 13, 832911. [Google Scholar] [CrossRef]
- Farooqi, I.S.; Keogh, J.M.; Yeo, G.S.H.; Lank, E.J.; Cheetham, T.; O’Rahilly, S. Clinical spectrum of obesity and mutations in the melanocortin 4 receptor gene. N. Engl. J. Med. 2003, 348, 1085–1095. [Google Scholar] [CrossRef]
- AbouHashem, N.; Al-Shafai, K.; Al-Shafai, M. The genetic elucidation of monogenic obesity in the Arab world: A systematic review. J. Pediatr. Endocrinol. Metab. 2022, 35, 699–707. [Google Scholar] [CrossRef]
- Kleinendorst, L.; Abawi, O.; van der Voorn, B.; Jongejan, M.H.T.M.; Brandsma, A.E.; Visser, J.A.; van Rossum, E.F.C.; van der Zwaag, B.; Alders, M.; Boon, E.M.J.; et al. Identifying underlying medical causes of pediatric obesity: Results of a systematic diagnostic approach in a pediatric obesity center. PLoS ONE 2020, 5, e0232990. [Google Scholar] [CrossRef]
- Guo, L.; Costanzo-Garvey, D.L.; Smith, D.R.; Neilsen, B.K.; MacDonald, R.G.; Lewis, R.E. Kinase Suppressor of Ras 2 (KSR2) expression in the brain regulates energy balance and glucose homeostasis. Mol. Metab. 2016, 6, 194–205. [Google Scholar] [CrossRef]
- Dougherty, M.K.; Ritt, D.A.; Zhou, M.; Specht, S.I.; Monson, D.M.; Veenstra, T.D.; Morrison, D.K. KSR2 is a calcineurin substrate that promotes ERK cascade activation in response to calcium signals. Mol. Cell 2009, 34, 652–662. [Google Scholar] [CrossRef]
- Pearce, L.R.; Atanassova, N.; Banton, M.C.; Bottomley, B.; van der Klaauw, A.A.; Revelli, J.P.; Hendricks, A.; Keogh, J.M.; Henning, E.; Doree, D. KSR2 mutations are associated with obesity, insulin resistance, and impaired cellular fuel oxidation. Cell 2013, 155, 765–777. [Google Scholar] [CrossRef]
- Henry, M.D.; Costanzo-Garvey, D.L.; Klutho, P.J.; Lewis, R.E. Obesity-dependent dysregulation of glucose homeostasis in kinase suppressor of ras 2−/− mice. Physiol. Rep. 2014, 7, e12053. [Google Scholar] [CrossRef]
- Körber, I.; Sowada, N.; Schirmer, M.; Herrmann, G.; Nunziata, A.; Bald, M.; Ehehalt, S.; Paetow, U.; Ohlenschlaeger, U.; Rabenstein, H.; et al. Pathogenic Mutations and Variants in KSR2 in a Cohort of Obese Children. ESPE Abstr. 2019. Available online: https://abstracts.eurospe.org/hrp/0092/hrp0092p1-51 (accessed on 23 July 2023).
- Mierzwa, M.; Bik-Multanowski, M.; Ranke, M.B.; Brandt, S.; Flehmig, B.; Małecka-Tendera, E.; Mazur, A.; Petriczko, E.; Wabitsch, M.; Wójcik, M.; et al. Clinical, genetic, and epidemiological survey of Polish children and adolescents with severe obesity: A study protocol of the Polish–German study project on severe early-onset obesity. Front. Endocrinol. 2022, 13, 972174. [Google Scholar] [CrossRef] [PubMed]
- Roberts, K.J.; Ariza, A.J.; Selvaraj, K.; Quadri, M.; Mangarelli, C.; Neault, S.; Davis, E.E.; Binns, H.J. Testing for rare genetic causes of obesity: Findings and experiences from a pediatric weight management program. Int. J. Obes. 2022, 8, 1493–1501. [Google Scholar] [CrossRef]
- Revelli, J.P.; Smith, D.; Allen, J.; Jeter-Jones, S.; Shadoan, M.K.; Desai, U.; Schneider, M.; Van Sligtenhorst, I.; Kirkpatrick, L.; Platt, K.A.; et al. Profound obesity secondary to hyperphagia in mice lacking kinase suppressor of ras 2. Obesity 2011, 5, 1010–1018. [Google Scholar] [CrossRef] [PubMed]
- Gomez, G.A.; Rundle, C.H.; Xing, W.; Kesavan, C.; Pourteymoor, S.; Lewis, R.E.; Powell, D.R.; Mohan, S. Contrasting effects of Ksr2, an obesity gene, on trabecular bone volume and bone marrow adiposity. eLife 2022, 11, e82810. [Google Scholar] [CrossRef] [PubMed]
- WHO. Obesity [Internet]. 2023. Available online: https://www.who.int/health-topics/obesity (accessed on 13 July 2023).
- Albuquerque, D.; Stice, E.; Rodríguez-López, R.; Manco, L.; Nóbrega, C. Current review of genetics of human obesity: From molecular mechanisms to an evolutionary perspective. Mol. Genet. Genom. 2015, 4, 1191–1221. [Google Scholar] [CrossRef]
- Farooqi, I.S.; O’Rahilly, S. Monogenic obesity in humans. Annu. Rev. Med. 2005, 56, 443–458. [Google Scholar] [CrossRef]
- Fontaine, K.R.; Redden, D.T.; Wang, C.; Westfall, A.O.; Allison, D.B. Years of life lost due to obesity. JAMA 2003, 289, 187–193. [Google Scholar] [CrossRef]
- Gusev, A.; Lee, S.H.; Trynka, G.; Finucane, H.; Vilhjálmsson, B.J.; Xu, H.; Zang, C.; Ripke, S.; Bulik-Sullivan, B.; Stahl, E.; et al. Partitioning heritability of regulatory and cell-type-specific variants across 11 common diseases. Am. J. Hum. Genet. 2014, 95, 535–552. [Google Scholar] [CrossRef]
- Pigeyre, M.; Yazdi, F.T.; Kaur, Y.; Meyre, D. Recent progress in genetics, epigenetics and metagenomics unveils the pathophysiology of human obesity. Clin. Sci. 2016, 130, 943–986. [Google Scholar] [CrossRef]
- Liang, M.P.; Banatao, D.R.; Klein, T.E.; Brutlag, D.L.; Altman, R.B. WebFEATURE: An interactive web tool for identifying and visualizing functional sites on macromolecular structures. Nucleic Acids Res. 2003, 31, 3324–3327. [Google Scholar] [CrossRef]
- Yang, J.; Yan, R.; Roy, A.; Xu, D.; Poisson, J.; Zhang, Y. The I-TASSER Suite: Protein structure and function prediction. Nat. Methods 2015, 1, 7–8. [Google Scholar] [CrossRef]
- Colovos, C.; Yeates, T.O. Verification of protein structures: Patterns of nonbonded atomic interactions. Protein Sci. 1993, 9, 1511–1519. [Google Scholar] [CrossRef]
- Rentzsch, P.; Witten, D.; Cooper, G.M.; Shendure, J.; Kircher, M. CADD: Predicting the deleteriousness of variants throughout the human genome. Nucleic Acids Res. 2019, 47, D886–D894. [Google Scholar] [CrossRef] [PubMed]
- Adzhubei, I.; Jordan, D.M.; Sunyaev, S.R. Predicting Functional Effect of Human Missense Mutations Using PolyPhen-2. Curr. Protoc. Hum. Genet. 2013, 1, 7.20.1–7.20.41. [Google Scholar] [CrossRef]
- Vaser, R.; Adusumalli, S.; Leng, S.N.; Sikic, M.; Ng, P.C. SIFT missense predictions for genomes. Nat. Protoc. 2016, 1, 1–9. [Google Scholar] [CrossRef] [PubMed]
- Schwarz, J.M.; Cooper, D.N.; Schuelke, M.; Seelow, D. MutationTaster2: Mutation prediction for the deep-sequencing age. Nat. Methods 2014, 4, 361–362. [Google Scholar] [CrossRef]
- Gupta, C.L.; Akhtar, S.; Bajpaib, P.; Kandpal, K.N.; Desai, G.S.; Tiwari, A.K. Computational modeling and validation studies of 3-D structure of neuraminidase protein of H1N1 influenza A virus and subsequent in silico elucidation of piceid analogues as its potent inhibitors. EXCLI J. 2013, 12, 215–225. [Google Scholar]
- King, S.E.; Nilsson, E.; Beck, D.; Skinner, M.K. Adipocyte epigenetic alterations and potential therapeutic targets in transgenerationally inherited lean and obese phenotypes following ancestral exposures. Adipocyte 2019, 8, 362–378. [Google Scholar] [CrossRef] [PubMed]
- Ellingford, J.M.; Ahn, J.W.; Bagnall, R.D.; Baralle, D.; Barton, S.; Campbell, C.; Downes, K.; Ellard, S.; Duff-Farrier, C.; FitzPatrick, D.R.; et al. Recommendations for clinical interpretation of variants found in non-coding regions of the genome. Genome Med. 2022, 14, 73. [Google Scholar] [CrossRef]
- Yuan, J.; Dong, X.; Yap, J.; Hu, J. The MAPK and AMPK signalings: Interplay and implication in targeted cancer therapy. J. Hematol. Oncol. 2020, 13, 113. [Google Scholar] [CrossRef]


| Case No. | Age at Recruitment | Gender * | Nationality | Consanguineous Marriage | BMI (kg/m2) | BMI Percentile | Z-Score | Age of Obesity Onset | Zygosity ** | Nucleotide Change | Protein Change |
|---|---|---|---|---|---|---|---|---|---|---|---|
| 1 | 14 | M | Qatari | NR | 33.40 | 99.90 | 2.34 | 8 years | Het | c.1765-8G>A | - |
| 2 | 16 | F | Qatari | NR | 42.10 | 99.98 | 2.35 | NR | Het | c.1765-8G>A | - |
| 3 | 12 | F | Qatari | NR | 42.10 | 99.96 | 2.68 | 3 years | Hom | c.1765-8G>A | - |
| 4 | 13 | F | Qatari | NR | 46.60 | 100.00 | 2.72 | 3 years | Het | c.1765-8G>A | - |
| 5 | 5 | F | Saudi/Qatari | Yes | 27.90 | 100.00 | 3.13 | 2 months | Het | c.1765-8G>A | - |
| 6 | 7 | M | Saudi | Yes | NR | <99 | NR | 3 months | Het | c.1673G>A | p.Arg558Gin |
| 7 | 17 | M | Qatari | NR | 41.20 | 99.66 | 2.83 | NR | Het | c.1057G>A | p.Val353lle |
| 8 | 4 | F | Qatari | Yes | 32.32 | <99 | 3.60 | 2 months | Hom | c.1765-8G>A | - |
| 9 | 5 | F | Qatari | NR | 23.30 | <99 | 2.66 | 2 years | Het | c.923T>C | p.Leu308Ser |
| Transcript | Nucleotide Change | Amino Acid Change | SIFT | PolyPhen-2 | MutationTaster | CADD | ACMG Class | gnomAD | GME | QGP |
|---|---|---|---|---|---|---|---|---|---|---|
| NM_173598.6 | c.1765-8G>A rs375107117 | - | - | - | - | 21.10 | - | 0.00007752 | NR | 0.00907 |
| NM_173598.6 | c.1057G>A rs1485095679 | p.V382I | 0.16 tolerated | 0.22 benign | Disease-causing | 14.81 | VUS (PM1, PM2; warm) | 0.0033 | NR | NR |
| NM_173598.6 | c.1673G>A rs768799651 | p.R587Q | 0.59 tolerated | 0.02 benign | Disease-causing | 21.80 | VUS (PM1, PM2; warm) | 0.0098 | NR | NR |
| NM_173598.4 | c.923T>C ClinVar: 2632205 | p.L308S | 0.07 tolerated | 0.72 possibly damaging | Disease-causing | 24.30 | VUS (PM1, PM2; warm) | 0.0039 | NR | NR |
| gnomAD AC | QGP AC | Marginal Row Totals | |
|---|---|---|---|
| Variant AC | 8 | 261 | 269 |
| WT AC | 152,304 | 28,513 | 180,817 |
| Marginal column total | 152,312 | 28,774 | 181,088 |
| Zygosity | Underweight | Lean | Overweight | Obese |
|---|---|---|---|---|
| Homozygous | - | 1 | 3 | 7 |
| Heterozygous | 15 | 40 | 81 | 102 |
Disclaimer/Publisher’s Note: The statements, opinions and data contained in all publications are solely those of the individual author(s) and contributor(s) and not of MDPI and/or the editor(s). MDPI and/or the editor(s) disclaim responsibility for any injury to people or property resulting from any ideas, methods, instructions or products referred to in the content. |
© 2024 by the authors. Licensee MDPI, Basel, Switzerland. This article is an open access article distributed under the terms and conditions of the Creative Commons Attribution (CC BY) license (https://creativecommons.org/licenses/by/4.0/).
Share and Cite
Abu-Rub, L.I.; Al-Barazenji, T.; Abiib, S.; Hammad, A.S.; Abbas, A.; Hussain, K.; Al-Shafai, M. Identification of KSR2 Variants in Pediatric Patients with Severe Early-Onset Obesity from Qatar. Genes 2024, 15, 966. https://doi.org/10.3390/genes15080966
Abu-Rub LI, Al-Barazenji T, Abiib S, Hammad AS, Abbas A, Hussain K, Al-Shafai M. Identification of KSR2 Variants in Pediatric Patients with Severe Early-Onset Obesity from Qatar. Genes. 2024; 15(8):966. https://doi.org/10.3390/genes15080966
Chicago/Turabian StyleAbu-Rub, Lubna I., Tara Al-Barazenji, Sumaya Abiib, Ayat S Hammad, Alaa Abbas, Khalid Hussain, and Mashael Al-Shafai. 2024. "Identification of KSR2 Variants in Pediatric Patients with Severe Early-Onset Obesity from Qatar" Genes 15, no. 8: 966. https://doi.org/10.3390/genes15080966