Article

Multiple Localization Analysis of the Major QTL—sfw 2.2 for Controlling Single Fruit Weight Traits in Melon Based on SLAF Sequencing

1
Horticulture and Landscape Department, Heilongjiang Bayi Agriculture University, Daqing 163000, China
2
Horticultural Branch of Heilongjiang Academy of Agricultural Sciences, Harbin 150069, China
3
Daqing Branch of Heilongjiang Academy of Agricultural Sciences, Daqing 163000, China
*
Author to whom correspondence should be addressed.
Genes 2024, 15(9), 1138; https://doi.org/10.3390/genes15091138
Submission received: 11 July 2024 / Revised: 26 August 2024 / Accepted: 26 August 2024 / Published: 28 August 2024
(This article belongs to the Section Plant Genetics and Genomics)

Abstract

:
Cucumis melo is an annual dicotyledonous trailing herb. It is fruity, cool, and refreshing to eat and is widely loved by consumers worldwide. The single fruit weight is an important factor affecting the yield, and thus the income and economic benefits, of melon crops. In this study, to identify the main QTLs (quantitative trait locus) controlling the single fruit weight of melon and thereby identify candidate genes controlling this trait, specific-locus amplified fragment sequencing (SLAF) analysis was performed on the offspring of female 1244 plants crossed with male MS-5 plants. A total of 115 individual plants in the melon F2 population were analyzed to construct a genetic linkage map with a total map distance of 1383.88 cM by the group in the early stages of the project, which was divided into 12 linkage groups with a total of 10,596 SLAF markers spaced at an average genetic distance of 0.13 cM. A total of six QTLs controlling single fruit weight (sfw loci) were detected. Seven pairs of markers with polymorphisms were obtained by screening candidate intervals from the SLAF data. The primary QTL sfw2.2 was further studied in 300 F2:3 family lines grown in 2020 and 2021, respectively, a positioning sfw2.2 between the markers CY Indel 11 and CY Indel 16, between 18,568,142 and 18,704,724 on chromosome 2. This interval contained 136.58 kb and included three genes with functional annotations, MELO3C029673, MELO3C029669, and MELO3C029674. Gene expression information for different fruit development stages was obtained from 1244 and MS-5 fruits on the 15d, 25d, and 35d after pollination, and qRT-PCR (quantitative reverse transcription–PCR) indicated that the expression of the MELO3C029669 gene significantly differed between the parents during the three periods. The gene sequences between the parents of MELO3C029669 were analyzed and compared, a base mutation was found to occur in the intronic interval between the parents of the gene, from A-G. Phylogenetic evolutionary tree analysis revealed that the candidate gene MELO3C029669 is most closely related to Pisum sativum Fimbrin-5 variant 2 and most distantly related to Cucumis melo var. makuwa. Therefore, it was hypothesized that MELO3C029669 is the primary major locus controlling single fruit weight in melon. These results not only provide a theoretical basis for further studies to find genes with functions in melon single fruit weight but also lay the foundation for accelerating breakthroughs and innovations in melon breeding.

1. Introduction

Melon is a major economic plant in the Cucurbitaceae family that is rich in a variety of nutrients and is widely cultivated worldwide. Single fruit weight is an important external quality trait of cucurbit crops that not only affects yield but also determines consumer acceptance. Therefore, studying single fruit weight is important in melon breeding programs. To date, many researchers have performed QTL localization and candidate gene identification related to controlling single fruit weight based on genetic populations and linkage maps [1,2,3]. Most QTLs related to single fruit weight have been detected in the studies of horticultural fruit-related traits [4,5,6,7,8,9,10,11,12,13], and these QTLs have been highly important for accelerating the breeding of horticultural crops.
Previously, QTLs associated with single fruit weight traits were identified in watermelon, pumpkin, and wax gourd. Guo et al. [14] constructed 100 recombinant inbred lines (RILs) using small-fruited watermelon sh14-11 and large-fruited watermelon N14 as parents. Using whole genome resequencing (WGR) technology, a high-quality genetic map was constructed, and a locus controlling FW was localized on chromosome 2, which had an LOD value of 3.21, a PVE of 15.135%, and an ADD of 0.246. The FW9 locus was detected on chromosome 9 of the watermelon at 246.57–256.50 cM, with a logarithm of odds (LOD) value of 6.29 and a phenotypic contribution of 20.12% [15]. Li et al. [16] detected a QTL associated with fruit size on chromosome 8, which was named fs-B171. The locus was located at LG8 0–15.75 cM, with an LOD value of 8.03 and a phenotypic contribution of 41.37%, indicating a significant additive effect on fruit weight gain. Using sequencing technology, Han et al. [17] constructed a high-density genetic map of pumpkin containing 20 chromosomes and identified four QTLs associated with fruit weight, with LOD values ranging from 5.84 to 9.19 and phenotypic variation explained (PVE) values ranging from 4.01% to 5.13%. The colocalization of fw12.1 and fw16.1 with scs12.1 and fth16.1, respectively, suggested that flesh thickness (FTH) and seed cavity size (SCS) have a certain genetic basis associated with fruit weight (FW), and the results of this study have provided an important theoretical basis for pumpkin quality improvement through breeding. In the genetic analysis and QTL localization of wax gourd fruit-related traits, two QTL loci, fw3.1 and fw6.1, controlling fruit weight, were located in chr03 and chr06, respectively, with LOD values of 5.73 and 3.31. fw3.1 and fd3.1 controlling fruit width had similar genetic distances, which suggested that fruit weight and fruit width might be controlled by the same gene [18].
In recent years, melon has also shown extensive diversity in terms of fruit size, and there have been numerous reports on the use of QTL localization techniques for studying melon fruit size-related traits. A QTL qFWT6 associated with single fruit weight trait in melon, located at 79.162 cM–79.412 cM on chromosome 6, with an additive effect of −21.85 and a phenotypic contribution of 9.53%, was reported in the study by Zhang et al. [19]. Amanullah et al. [20] identified 4 QTL associated with fruit weight at different positions on chromosomes 1, 9, and 12 of melon, namely FWT1.1, FWT1.2, FWT9.1, and FWT12.1, with LOD values ranging from 3.53 to 7.55. Among them, the additive effects of FWT1.1 and FWT12.1 were positive, whereas the FWT1.2 and FWT9.1 had negative additive effects. Monforte et al. [21] in a study on the genetic basis of fruit morphology in horticultural crops: insights from tomato and melon, and introduced four QTLs FWMQ2, FWMQ3, FWMQ8, and FWMQ11 that control melon fruit weight, where the QTL FWMQ2 is co-segregating with the gene a, which controls sex determination in female flowers. In a previous study by Monforte et al. [22], it was concluded that the loss of protease activity encoded by the gene results in plants with monoecious flowers and the presence of stamens in female flowers limits longitudinal ovary growth and reduces fruit elongation. Thus, the sexually expressed gene has an effect on fruit size. Díaz et al. [23] constructed an F2 population with the Indian wild melon variety “Trigonus” and the western melon variety “Piel de Sapo” as parents, and analyzed the QTLs controlling traits related to the domestication of fruit morphology. Ten QTLs associated with fruit size were identified, including those controlling fruit length and fruit weight all located on chromosomes 2, 4, 6, and 8, while those controlling fruit width were located only on chromosomes 4 and 8. Díaz et al. [24] also identified seven QTLs related to fruit size in another study, with five QTLs controlling fruit length, flqs2.1, flqs3b.1, flqs6a.1, flqs8.1, and flqs10b.1, respectively. With LOD values ranging from 2.92 to 16.85; and 2 QTLs controlling the width of fruits, fdqs3a.1 and fdqs12.1, with LOD values of 25.6 and 52, respectively. Zhao et al. [25] detected QTL fwqaz8.1 controlling the FW trait in the region of about 2.95–4.77 Mb on chromosome 8 in a cross between wild and cultivated melons. This region is consistent with the previously reported QTL fwqc8.1; this QTL negatively contributed to the increase in melon fruit weight. Campos et al. [26] constructed the introgression line (IL) using the wild germplasm Ames 24297 (TRI) and ‘Piel de Sapo’ (PS) as the parents, to study fruit-related traits and the degree of FW trait variation ranged from +42% (TRI05-2) to −57% (TRI04-3) compared to PS, with TRI05-2 being the only IL that increased FW. Major QTLs associated with single fruit weight on chromosomes 5 and 8 were identified by Pereira et al. [27]. F2 populations (200 plants) were generated from two varieties (snake and thick-skinned melon) as parents to locate and analyze QTLs controlling traits such as single fruit weight and fruit shape, and eight QTLs controlling single fruit weight, soluble solids, etc., were newly located. Of these, two primary QTLs controlling the traits of single fruit weight in melon were located on chromosome 8, with phenotypic contributions of 20.60% and 12.8%, respectively [28].
These previous studies have laid a theoretical foundation for in-depth research on the fine positioning of single fruit weight-related traits and the associated candidate genes in melon. Candidate genes associated with single fruit weight in melon were previously screened based on the candidate intervals located by QTLs, and single candidate genes associated with fruit size, Cm arY5 (axial regulator YABBY 5) and Cm Arf (auxin response factor), were identified on chromosome 5 and chromosome 11 of melon, respectively [29]. YABBY-like transcription factors are associated with the evolution of tomato fruit size during domestication, and growth factors determine final fruit size by controlling cell division and cell proliferation, suggesting that these two candidate genes may play important roles in determining melon fruit size. Pereira et al. [28] also identified the gene MELO3C014402, which encodes the protein FANTASTIC FOUR 2 and is associated with meristematic tissue development and cell size regulation; therefore, MELO3C014402 is considered a potential gene related to single fruit weight. FWQP2.2 is located on melon chromosome 2, coincident with the gene associated with the sex of female flowers in melon, suggesting that differences in fruit weight in melon populations may be the result of sex determination [30]. MELO3C029669, the candidate gene found in this study, is related to the filamentous protein fimbrin-5. Five filamentous protein-like genes, FIM1-FIM5, were detected by Zhang et al. [31] in an Arabidopsis genome study, of which AtFIM4 and AtFIM5 have been intensively studied. It is hypothesised that both AtFIM4 and AtFIM5 are expressed in pollen and act synergistically. AtFIM5 regulates actin bundles throughout the pollen tube, and AtFIM4 begins to be expressed only after the pollen grains are hydrated. When the expression of both genes is reduced at the same time, the extent of filamentous bundles in the pollen tubes of Arabidopsis decreases, and pod length decreases significantly, which affects the size of the plants. Therefore, based on previous research, MELO3C029669, which is related to the fiber bundle protein fimbrin-5, may be considered the main candidate gene for control of the single fruit weight trait in melon.
With the rapid development of technology, molecular marker analysis has been widely applied in various crop genetic breeding studies. The commonly used molecular markers include SSR (simple sequence repeat) markers, CAPS (cleaved amplified polymorphic sequences) markers, Indel (insertion-deletion) markers, and more than ten other types of markers. Xu et al. [32] constructed a genetic linkage map of pumpkin rootstock containing 15 linkage groups using 95 pairs of polymorphic SSR markers and detected 3 QTLs related to cold resistance. Zhang et al. [33] used CAPS marker technology to identify the xa25 gene in rice; the CAPS marker designed for this study was isolated with the xa25 gene to clearly differentiate the rice xa25/Xa25 genotypes. Seo et al. [34] developed Indel markers for the development and validation of pod tolerance in soybeans. The marker successfully distinguished between pod-shattering-tolerant and pod-shattering-susceptible genotypes and can be effectively used for marker-assisted selection for pod resistance in soybean plants.
In this study, we selected wild-type melon (1244) females and thick-skinned melon (MS-5) males as test materials and obtained three segregating populations, F1, F2, and F2:3, after formulating the hybrid combinations. Based on the genetic linkage map constructed from SLAF sequencing results about the F2 population [35], we obtained candidate intervals for the primary loci controlling single fruit weight in melon, and further localized the QTLs sfw2.2 for the single fruit weight trait by using molecular markers to identify the linkage markers associated with the trait and shorten the candidate intervals. Moreover, the candidate genes MELO3C029669 were identified. We also carried out qRT-PCR verification of the gene, analyzed the sequence differences between the parents of the gene, and constructed a phylogenetic tree and other preliminary functional verification, which laid the foundation for further in-depth research on the genes controlling the single fruit weight of melons, and greatly accelerated the process of molecular breeding of melons.

2. Materials and Methods

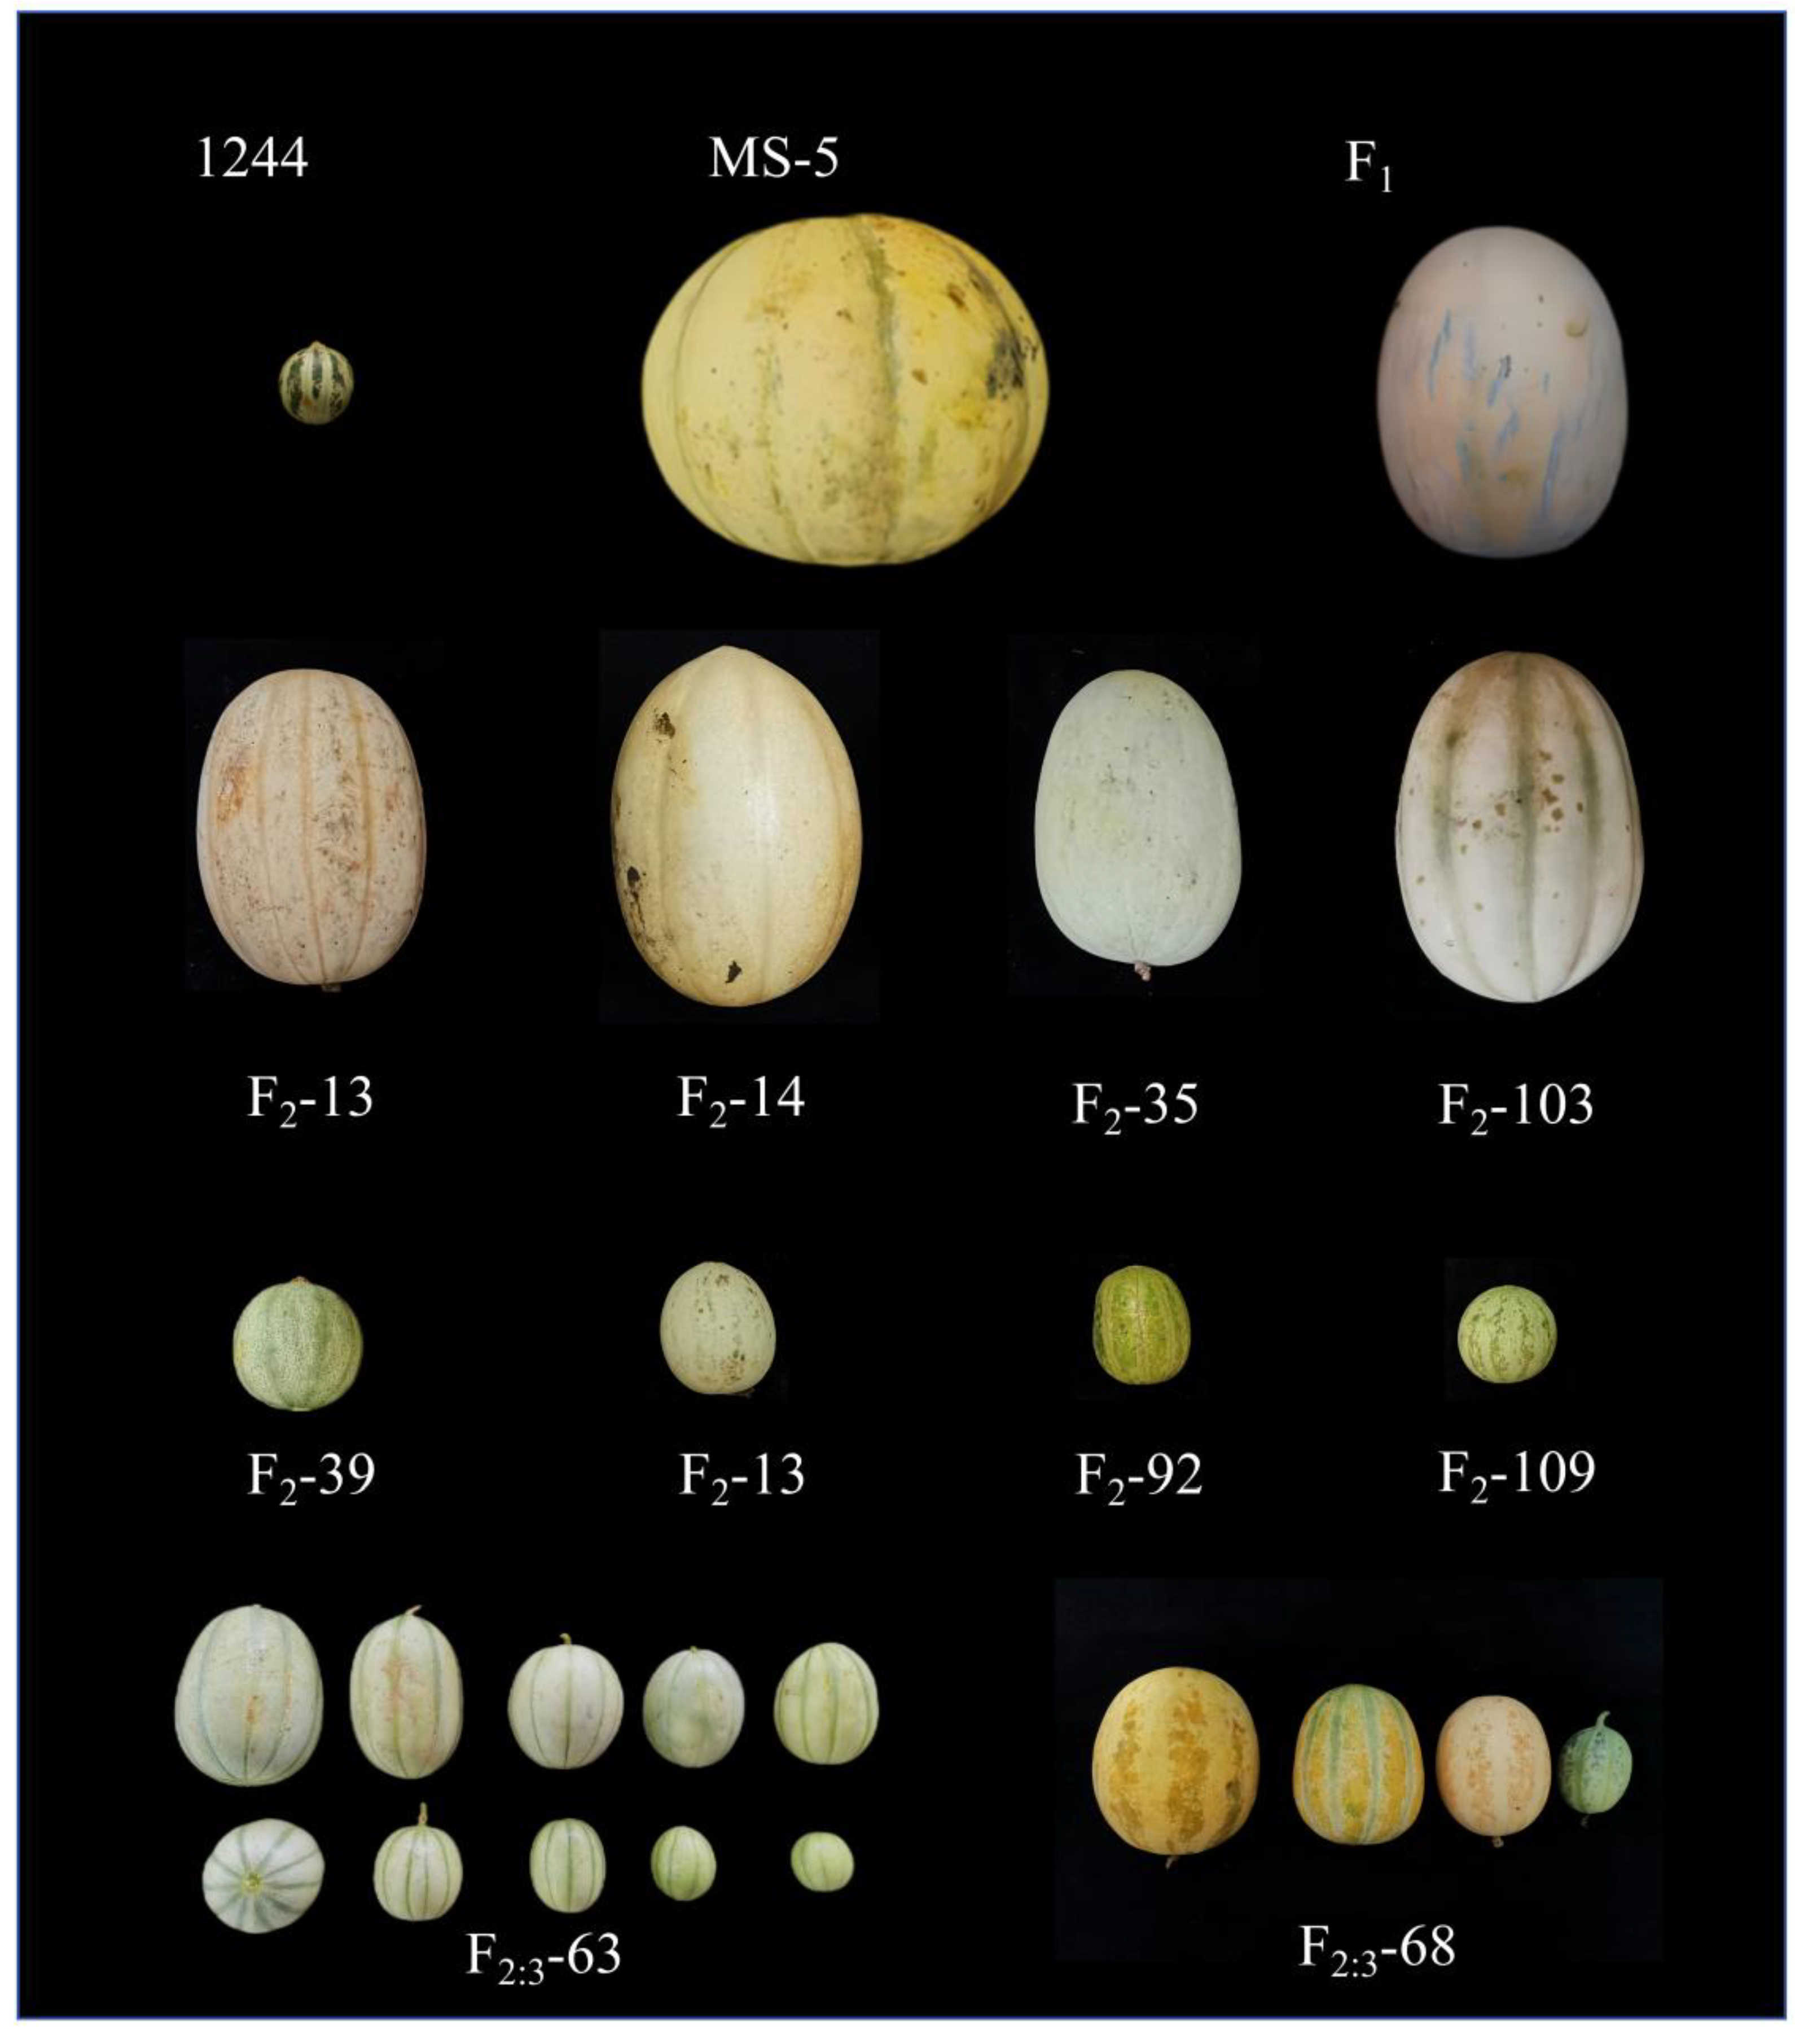
2.1. Plant Materials and Phenotyping

Wild-type melon 1244 provided by the Zhengzhou Fruit Tree Research Institute (with a single fruit weight of 22.59 g) was used as the female parent, and thick-skinned melon MS-5 provided by the U.S. Department of Agriculture (with a single fruit weight of 814.97 g) was used as the paternal parent. The offspring generation F1, F2, and F2:3 family lines obtained from the configured hybrid combinations were used as test materials (Figure 1). In the summer (June–September) of 2020, 15 individual 1244, MS-5, and F1 plants and 115 F2 population plants were used for construction of the specific-locus amplified fragment sequencing (SLAF-seq) genetic maps; for precise mapping and further location of the primary candidate QTL region, 300 F2:3 families plants were analyzed in Heilongjiang in the greenhouses at the Heilongjiang Bayi Agricultural University station (latitude 45°46′–46°55′ N) in Summer (June–September) of 2021, and in Autumn (October–December) of 2020 in Sanya, Hainan (latitude 18°09′–18°37′ N), respectively. The melon cultivation methods used included conventional water and fertilizer management, single-plant pollination, and double-vine branching.

2.2. Phenotype Collection

The single fruit weight was measured by a balance when the fruits turned color and ripened. From the 1244, MS-5, and F1 populations, 3 replicates from 5 single plants were collected and measured. The average single fruit weight of each F2 individual was measured in 2–3 fruits per plant, and 20 fruits were measured for each F2:3 family member (20 plants per family line, 1 fruit per plant). The average data were recorded, and the genetic patterns of single fruit weight were analyzed.

2.3. SLAF-Seq and Indel Molecular Marker Screening

Wang et al. [35] previously performed SLAF-seq (specific length amplified fragment sequencing) using the indicated parent lines and 115 F2 plants and obtained candidate regions controlling single fruit weight traits in melon based on the constructed genetic linkage maps. Raw data of SLAF-seq were deposited in the NCBl Sequence ReacArchive (SRA) database under BioProject ID: PRJNA1150761. On this basis, the resequencing data of the parental lines were compared to identify the differences in genome sequence between the parents, and 28 pairs of Indel primers between parents were designed using the software Primer 5.0. Of these, 7 pairs of Indel primers with polymorphisms between parents (Table 1) were used for further localization analysis of the genes responsible for single fruit weight in 300 F2:3 families (20 plants per line, 1 fruit per plant) planted in 2020 and 2021, respectively. DNA extraction was performed by the CTAB method. The concentration of the extracted DNA was determined using a nucleic acid protein concentration meter, and diluted to 50 ng/μL for subsequent experiments. The PCR mixture consisted of a total of 10 μL: 1 μL of upstream primer, 1 μL of downstream primer, 3 μL of Taq Master Mix, 1 μL of the DNA template, and 4 μL of ddH2O [36]. The PCR (polymerase chain reaction) amplification procedure was as follows: pre-denaturation at 95 °C for 5 min; denaturation at 95 °C for 30 s; annealing at 55 °C for 30 s; extension at 72 °C for 45 s, 35 cycles; extension at 72 °C for 10 min; and storage at 4 °C for subsequent experiments.

2.4. Candidate Gene Screening

After identifying candidate regions on the basis of the screened internal markers, candidate genes were detected using the melon genome (DHL92) v3.6.1 (http://cucurbitgenomics.org/) accessed on 23 November 2021, and functional annotations of the candidate genes were found using information from the Gene Ontology (GO) (http://www.geneontology.org) database accessed on 24 November 2021. This information was used to perform functional analyses of genes related to the control of single fruit weight in melon [37,38].

2.5. Candidate Gene qRT—PCR Verification

Fruits of 1244 and MS-5 were selected for qRT-PCR validation at 15d, 25d, and 35d days after pollination. RNA extraction for the real-time fluorescence quantitative PCR assay was performed according to the TRIzol method [39]. The RNA was reverse transcribed into cDNA using a Toyo Spun Reverse Transcription Kit, and the qRT—PCR test primers were designed according to the candidate genes, which were synthesized by Shanghai Bioengineering Technology Co. The qRT—PCR mixture was 10 μL in volume and included 0.75 μL of each upstream and downstream primer, 5 μL of SYBR enzyme, 1 μL of cDNA template, and 2.5 μL of ddH2O. The PCR amplification procedure was as follows: pre-denaturation at 95 °C for 10 min; denaturation at 95 °C for 15 s; renaturation at 57.5 °C for 30 s; extension at 72 °C for 40 s, 39 cycles, extension at 65 °C for 5 min; and storage at 4 °C for subsequent qRT—PCR verification.
Sequence differences between the parents of the candidate genes were analyzed via DNAMAN 6.0 software. Phylogenetic trees were constructed using the neighbor—joining method to infer evolutionary history. Evolutionary trees were drawn to scale, and evolutionary distances were calculated using the p-distance method in units of the number of amino acid differences at each locus. All positions with less than 50% site coverage were excluded. Evolutionary analyses were conducted in MEGA 7.0.

2.6. Data Analysis

2.6.1. Field Experiment

The single fruit weight data of fruits obtained from the field survey were tested for a normal distribution using Microsoft Excel 2021 software, and a histogram of the frequency distribution of the single fruit weight of melons was plotted [40]; statistical analyses of the mean ± standard deviation, maximum, minimum, and extreme deviation of single fruit weight were carried out using Oringe software 2019 [41].

2.6.2. Linkage Map Construction and QTL Analysis

The genetic linkage analysis of polymorphic molecular markers screened in the F2:3 family lines was performed using JoinMap 4.0 mapping software, and genetic linkage maps were generated. QTLIciMappingv4.2 software was used for the analysis, and the composite interval mapping (CIM) method was used to locate the QTLs controlling the single fruit weight trait in melon [42]. LOD thresholds were used to evaluate the statistical significance of each QTL and were set using a 1000 permutation test (PT). First, LOD thresholds corresponding to the 0.99 confidence level were considered. If there were no mapped regions, the 0.95 and 0.90 confidence level LOD thresholds were considered [43]. If the QTL interval remained undetected, the PT result was manually lowered to 3.0. The QTLs were named after the trait abbreviation in English + chromosome number.

2.6.3. qRT-PCR Data Analysis

The qRT-PCR assay was completed based on three sample replicates, and the average of the three replicates was calculated using the 2−ΔΔCt method to obtain the relative expression levels of the genes [35].

3. Results

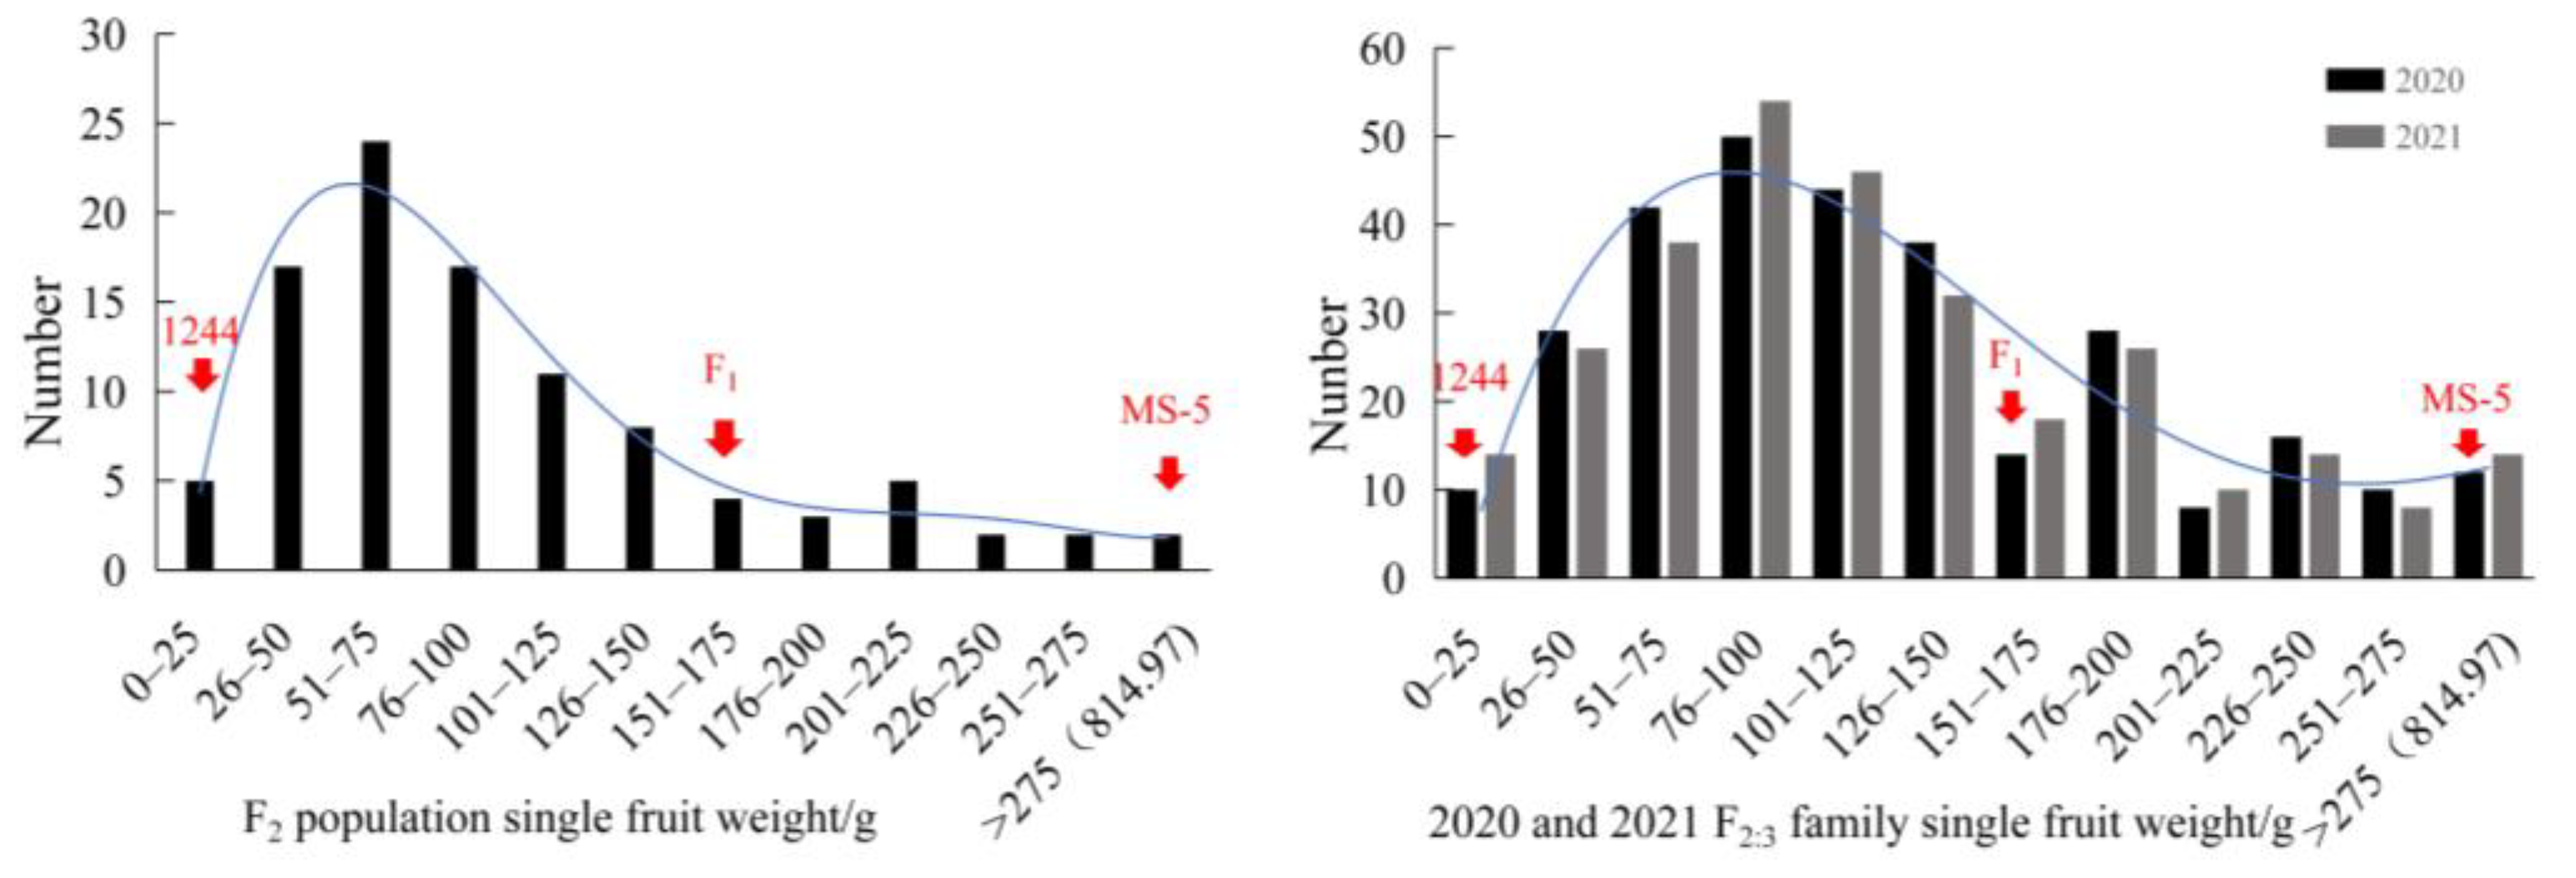
3.1. Analysis of Single Fruit Weight

Single fruit weights were collected from 1244, MS-5 and F1 individuals, the F2 population, 2020 and 2021 F2:3 families lines and analyzed via Excel software 2019. As shown in the Table 2, there was significant variability in single fruit weight between strains 1244 and MS-5, with mean values of 22.59 ± 11.74 g and 666.78 ± 71.44 g, respectively. In addition, the F1 single fruit weight was 160.17 ± 30.06 g, the F2 single fruit weight was 100.89 ± 71.97 g, and the single fruit weight of the 2020 and 2021 F2:3 families line was 112.29 ± 58.39 g and 106.37 ± 63.14 g. There were significant within-group differences in single fruit weights within the F2 population, 2020 and 2021 F2:3 family lines, with the mean values ranging between those of 1244 and MS-5.
A field survey was conducted and the data were analyzed to evaluate the single fruit weight trait. The frequency distributions for the single fruit weight trait in the F2 population, 2020 and 2021 F2:3 families lines exhibited wide genetic variation, and a skewed normal unimodal distribution was observed (Figure 2), which indicated that this trait was a quantitative trait controlled by polygenic inheritance.

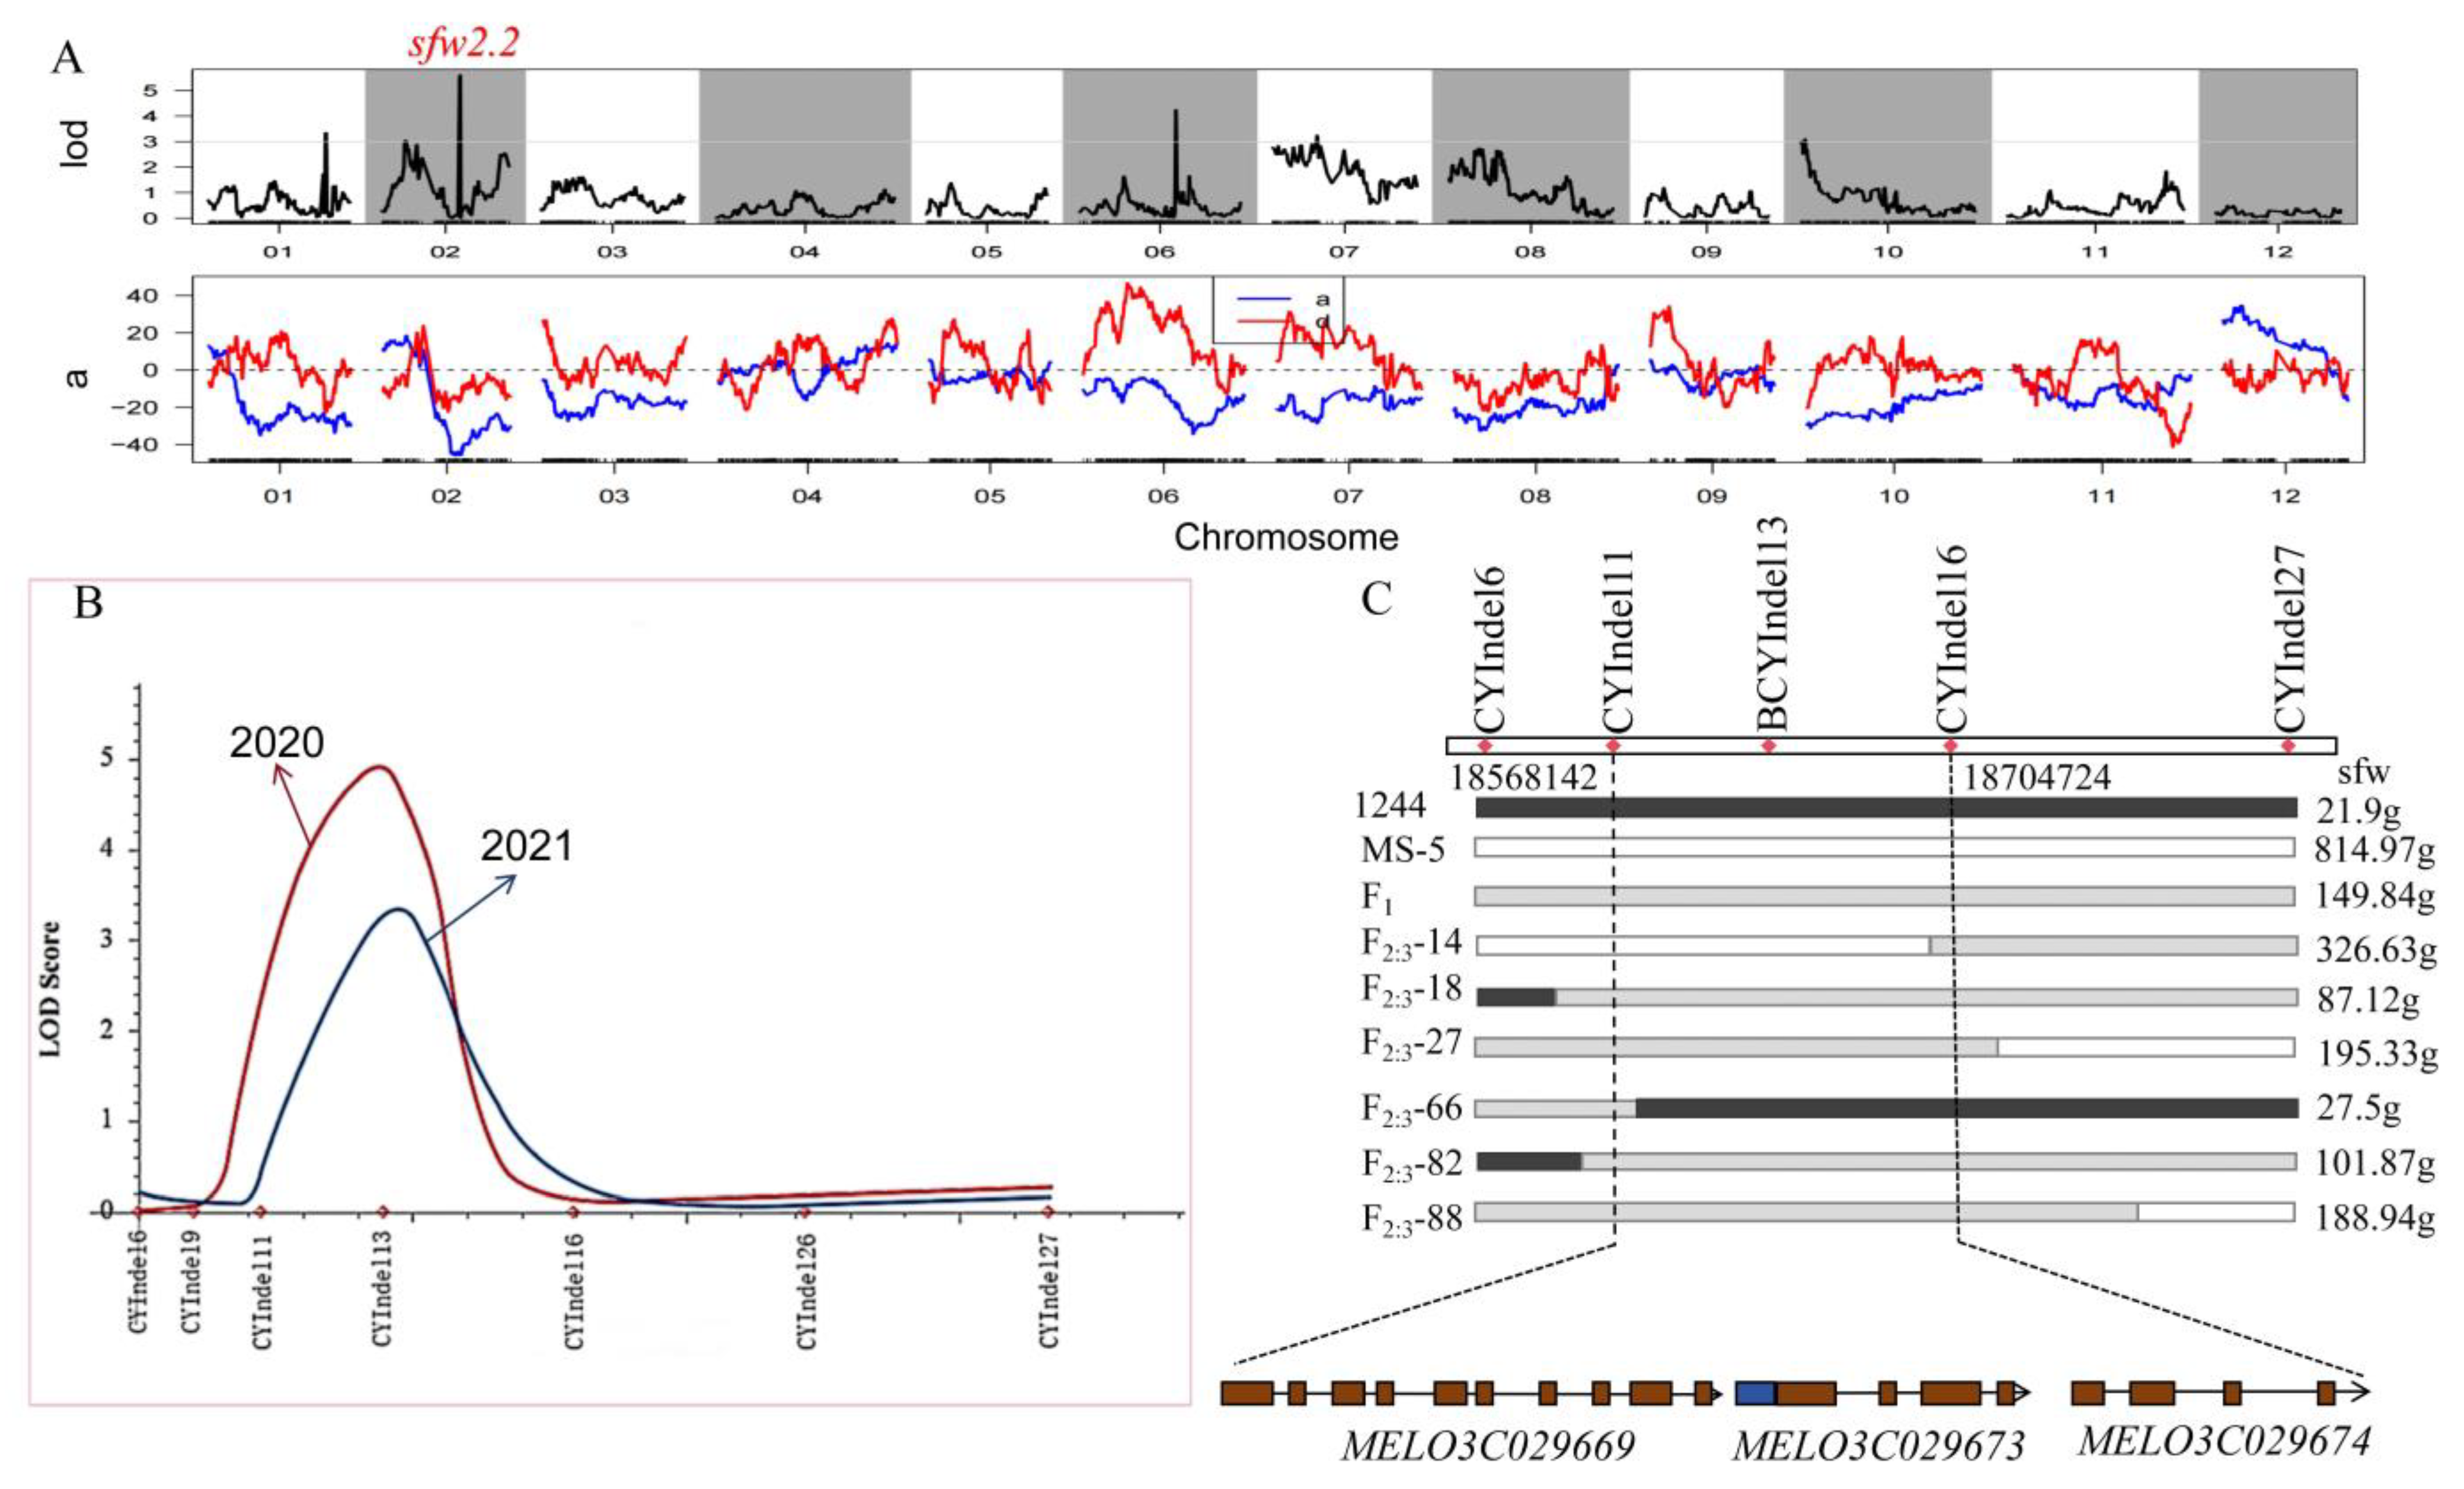
3.2. SLAF Sequencing and QTL Analysis of Melon Single Fruit Weight in the F2 Population

A total of 83.12 Gb of data were obtained from SLAF sequencing of the parents and 115 F2 plants according to Wang et al. (2021) [35] in the same research laboratory in their study on QTL analysis of flowering-related traits in melon, and a genetic map containing 12 linkage groups was constructed (Figure 3).
Based on the SLAF data, a genetic map containing a total of 12 chromosomes was constructed, with a total length of 1383.88 cM and a genetic spacing of 0.13 cM between markers on the map. A total of six QTLs related to the single fruit weight, sfw1.1, sfw2.1, sfw2.2, sfw6.1, sfw7.1, and sfw10.1, were found in the F2 population (shown in Figure 3). The sfw6.1 locus had a higher LOD value of 4.2, an additive effect of −21.93, a phenotypic contribution of 10.2%, and was located at 30,841,187–38,291,645; this locus contained the most genes, with 354 genes. For sfw2.2, both the LOD value and phenotypic contribution rates were the largest among all the loci, at 5.6 and 17.0%, respectively, the additive effect was −45.10, and the interval included 15 genes. Because the sfw2.2 locus had the highest phenotypic contribution and LOD, the interval of the sfw2.2 locus was considered a strong candidate interval for controlling the single fruit weight trait in melon and was subjected to further gene localization, as shown in Table 3.
As shown in Figure 4A, one of the six QTLs controlling the trait of single fruit weight in melon had a LOD value of 3.0, and the remaining five had LOD values greater than 3.0, of which the sfw2.2 locus located on the second chromosome had the largest LOD value, at 5.6. The dominant effects of the sfw6.1 and sfw7.1 loci were positive, and the dominant effects of the sfw1.1, sfw2.1, sfw2.2, and sfw10.1 loci were all negative. The sfw2.1 locus had a positive additive effect, and the remaining loci had negative additive effects. The results showed that most of these loci were affected mainly by paternal genetic effects.

3.3. Further Localization of the sfw2.2 Locus

Based on the QTL localization of the SLAF sequencing results, the primary candidate intervals controlling the single fruit weight trait in melon were obtained, and further localization was carried out by PCR amplification of 300 F2:3 family lines; each family contained 20 individuals grown in both 2020 and 2021 using seven pairs of Indel primers with polymorphisms in the candidate interval. QTL localization of plants from both years revealed that the primary effector was QTL sfw2.2, located on chromosome 2 (Figure 4B) within the candidate interval of the Indel markers CYInDel11 and CYInDel16. The LODs were 4.91 and 3.26, contributing 20.75% and 24.78%, respectively, with additive effects of −48.56 and −34.15.
Moreover, we genotyped six key recombinant plants, using A, B, and H to represent the 1244 allele genotype, MS-5 allele genotype, and heterozygous genotype, respectively. The single fruit weight of the recombinant plant F2:3-14 was 326.63 g, and the phenotype was B. Analysis of the CYInDel6-CYInDel16 allele of F2:3-14, the left fragment was derived from MS-5, and the right fragment was heterozygous for the CYInDel16-CYInDel27 allele. The phenotype and genotype of the recombinant F2:3-14 plants were used to determine the right edge of the CYInDel16 target region. Recombinant plant F2:3-66 had a single fruit weight of 27.5 g and phenotype A. Based on the CYInDel11-CYInDel27 allele in F2:3-66, it was suggested that the right fragment was derived from 1244 and that the left fragment was heterozygous for the CYInDel6-CYInDel11 allele. The phenotype and genotype of the recombinant plant F2:3-66 determined the left edge of the CYInDel11 target region. Eventually, the sfw2.2 locus, which controls single fruit weight in melon, was finely localized to CYInDel11-CYInDel16 at a physical distance of 136.5 kb (Figure 4C).

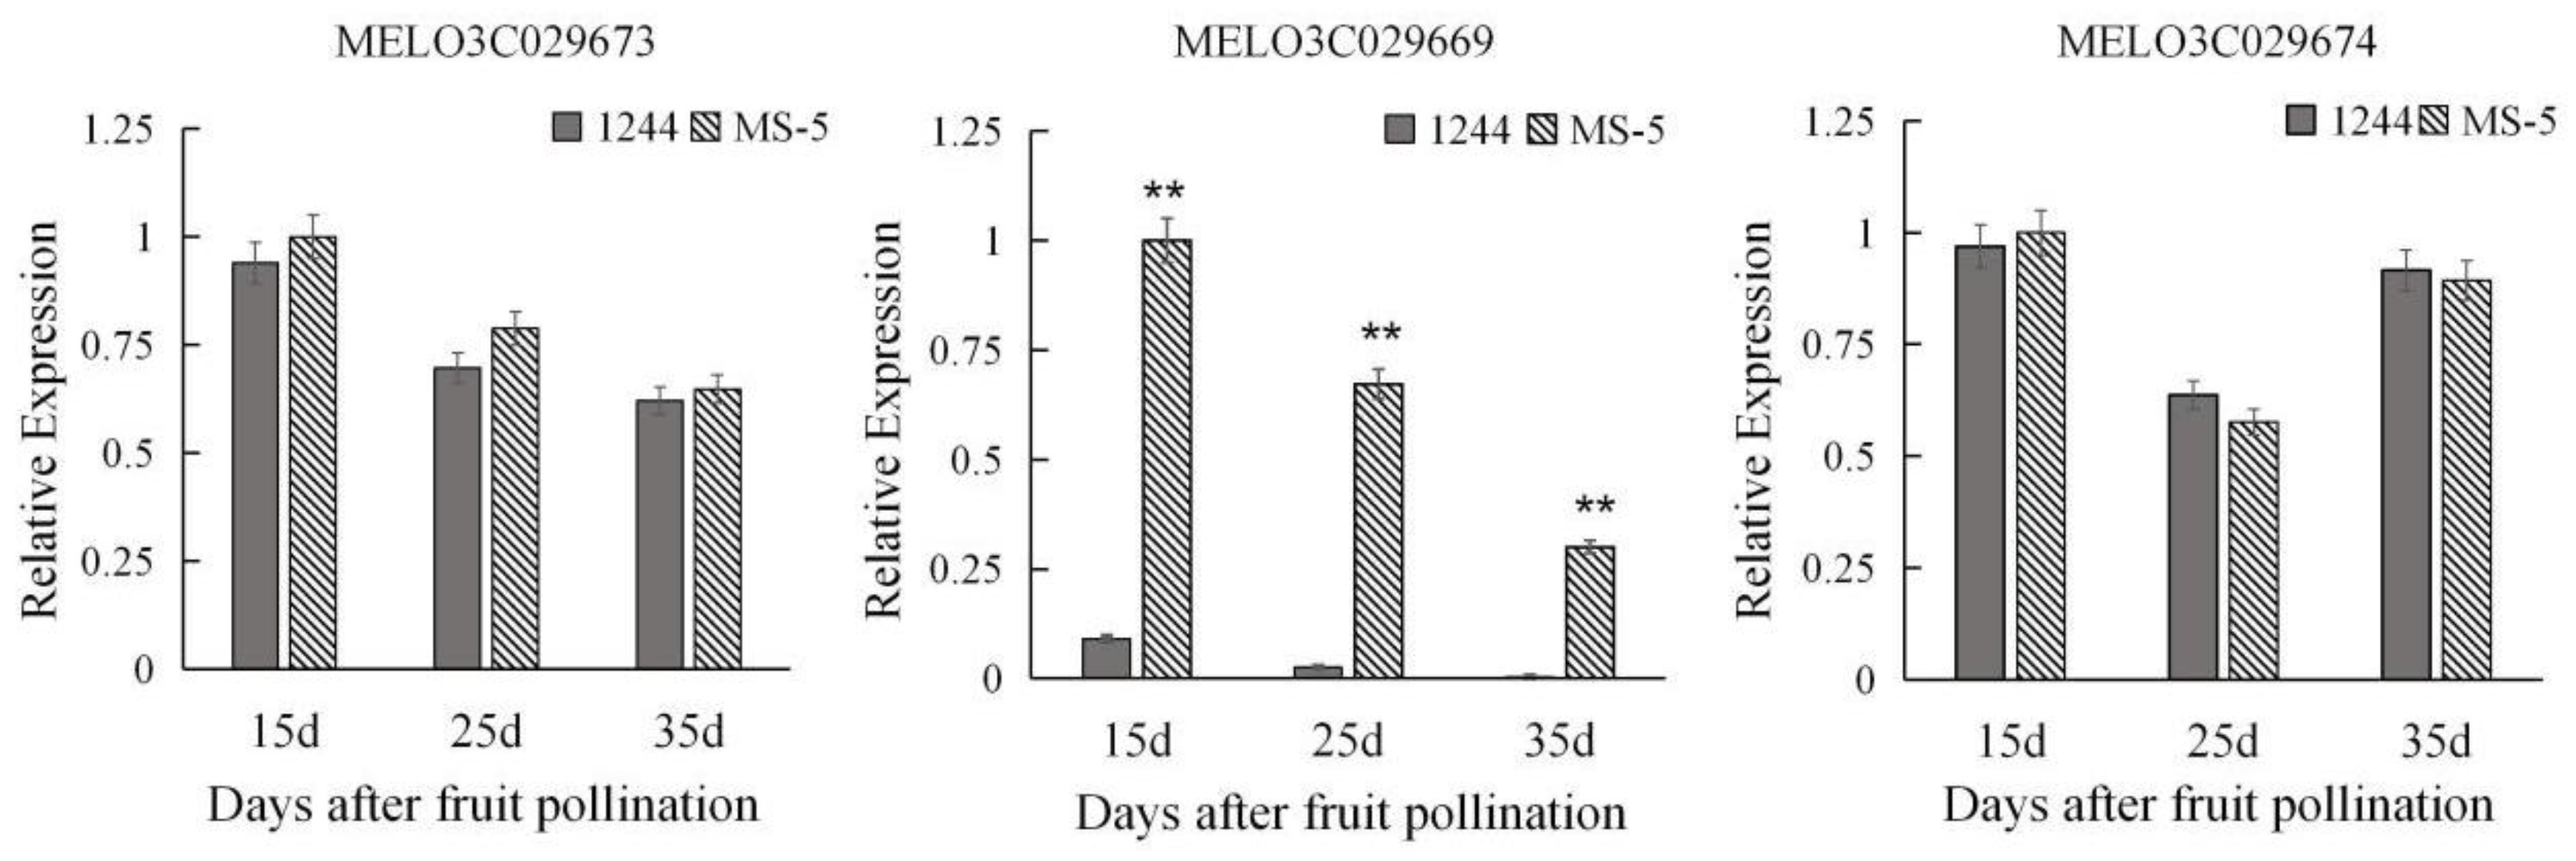
3.4. Candidate Genes and Preliminary Functional Validation

Within the candidate interval of the Indel markers CYInDel11-CYInDel16, three functionally annotated candidate genes in the melon genome were identified through the Cucurbit Genome Database (Melon [DHL92] genome 3.6.1). The annotation information of the candidate genes is shown in Table S1.
As shown in Figure 5, there was no significant difference between 1244 and MS-5 in the expression of the MELO3C029673 gene or the MELO3C029674 gene at 15d, 25d, and 35d of fruit growth. In contrast, the expression of the MELO3C029669 gene significantly differed between 1244 and MS-5 at 15d, 25d, and 35d of fruit growth, and the expression of this gene was always greater in MS-5 than in 1244. Similarly, the expression of MELO3C029669 gradually decreased in MS-5 with fruit growth and development. And there are multiple base differences between the sequences of the gene’s parents (Figure S1A). Figure S1B shows the evolutionary relationships of MELO3C029669 to homologous genes in other species, with the closest affinity to alfalfa and the furthest to C melo var. makuwa. In summary, MELO3C029669 was hypothesized to be a candidate gene for controlling single fruit weight in melon.

4. Discussion

For crops where the fruit is the product organ, the single fruit weight is an important trait that affects yield and economic efficiency. During fruit growth and development, the fruit weight changes in response to continuous changes in environmental factors and genetic regulation. The study of QTL localization for single fruit weight-related traits in melon and other crops provides a theoretical basis for identifying genes controlling single fruit weight, lays the foundation for plant molecular breeding, and simultaneously improves the yield and efficiency of melon and other crops [48,49,50,51,52,53,54,55,56].
In recent years, extensive research on QTL localization for single fruit weight has been carried out in other cucurbit crops. Kaźmińska et al. [57] located six QTLs controlling the weight of fruits, fw2.1, fw4.1, fw10.1, fw10.2, fw14.1, and fw17.1, in their study on the identification of Cucurbita maxima fruit-related QTLs using recombinant selfing lines. fw4.1 is located on chromosome 4 and was the primary effector QTL, explaining 41.00% and 32.00% of the phenotypic variance in Experiments I and II, respectively. fw14.1 is located on chromosome 14, and its PVE values are 17.80% and 16.60%, respectively. The remaining QTL for fruit weight was detected in both seasons but with lower PVE values of 10.10–15.40%. Osae et al. [58] crossed the watermelon varieties ZXG1553 and W1-17 to construct an F2 population for QTL localization of watermelon fruit size-related traits using CAPS markers. The loci qFW-3-2, which controls fruit weight, and qFL-3-1, which controls fruit length, were co-located together at 199 cM on chromosome 3, with LOD values of 2.57 and 3.00 and PVE values of 7.03% and 7.73%, respectively. Another QTL for fruit weight, qFW-3-1, was located at 36 cM on chromosome 3, with an LOD value of 2.73 and a PVE of 6.63%.
In this study, six QTLs (sfw1.1, sfw2.1, sfw2.2, sfw6.1, sfw7.1, and sfw10.1) associated with the single fruit weight trait of melons were found in the 1st, 2nd, 6th, 7th, and 10th linkage clusters by SLAF sequencing. The LOD value of sfw2.2 was 5.60, the additive effect was −45.10, and the dominant effect was −13.59; moreover, it had the highest phenotypic contribution rate, at 17%, indicating that this locus is the main effect locus controlling the single fruit weight of melon. Upon identifying the candidate interval of the sfw2.2 locus, further localization of the sfw2.2 locus using F2:3 family lines planted for two years, and the candidate intervals were shortened so that we could find candidate genes related to single fruit weight. According to current reports, the FWT1.1 locus localized by Amanullah et al. [21] in 2021 and the sfw1.1 locus localized in this study are both located on the first chromosome and have very similar genetic distances. The QTL qFWT6, detected by Zhang et al. [20] to control FW in melon, and the QTL sfw6.1, localized in this study, were close to each other on chr06, although at different locations. Monforte et al. [46] detected six QTLs that control the single fruit weight trait of sweet melons; these loci are different from those in this study and are located on the 3rd, 4th, 5th, and 12th linkage groups, sfw3.1, sfw4.1, sfw5.1, sfw5.2, sfw12.1, and sfw12.2, respectively. Among them, sfw5.2 had the largest LOD value of 5.99, sfw4.1 had the smallest LOD value of 2.29, and the range of R2 was 0.08–0.34. Santo et al. [59] detected a different QTL locus from the present study FWQW7.1 in a study on the fruit morphology and ripening-related QTLs in a newly developed introgression line collection of the elite varieties ‘Védrantais’ and ‘Piel de Sapo’. It can be used in melon breeding programs to change the size of the fruit without affecting the shape of the fruit. Similarly, Zhang et al. [47] identified three QTLs associated with single fruit weight in melon via QTL analyses for traits related to melon fruit. FW6.1 was found to be located on chromosome 6; the sfw6.1 locus identified in this study is also located on chromosome 6 but at a different position. The genetic distance of the FW6.1 locus was 98.01–104.07 cM, the LOD value was 3.93, and the additive effect was 0.10. The FW5.1 and FW11.1 loci were located on chromosomes 5 and 11, respectively. FW5.1 had the highest LOD value of 4.78 with a phenotypic variance of 6.85%, while FW11.1 had the lowest LOD value of 2.69 with a phenotypic variance of 3.78%. Harel-Beja et al. [44] crossed two melon subspecies, “PI 414723” and “Dulce”, and constructed a recombinant inbred (RI) population to establish a genetic linkage map of melon enriched for fruit traits. Two and one QTL related to the single fruit weight trait of melon were identified on LG2 and LG8 (fw2.1, fw2.2, and fw06 8.1i, with LOD values of 8.58, 3.02, and 4.14, respectively). The first two loci, along with fw2.1 and fw2.2 identified in this study, are located on chromosome 2 at different genetic distances. QTLs associated with melon fruit length, fl2.1 and fl8.1, were also detected on LG2 and LG8, respectively, with LOD values of 11.80 and 2.99. Thus, the two QTLs for weight and length, fw2.1 and fl2.1, co-segregated and overlapped on LG2 with higher LOD scores. This finding suggests that fruit weight in this melon population is related to fruit length. In the genetic study of traits related to melon yield, Zalapa et al. [45] used molecular markers such as SSR and RAPD (random amplified polymorphic DNA) to detect 12 QTLs related to melon single fruit weight in parental line, RIL (recombinant inbred lines), and to 3 control varieties (Esteem, Sol Dorado, and Hales Best Jumbo), including fw1.1, fw1.2, fw2.4, fw2.5, fw2.6, fw3.7, fw5.8, fw6.10, fw8.11, and fw8.12, where the fw1.2 locus is genetic distance similar to the fw1.1 locus localized in the first linkage cluster in this study. The LOD values ranged from 3.59 to 12.53, and the additive effects ranged from −0.18 to 0.42. Among them, four loci, fw5.8, fw6.10, fw8.11, and fw8.12, were consistently detected in different varieties, laying the foundation for further screening of genes related to fruit weight.
The candidate gene obtained in this study was MELO3C029669, which is related to fimbrin-5 (a filamentous protein) according to gene functional annotation (C melo fimbrin-5 (LOC103495662), transcript variant X3, mRNA) based on the gene ID. In a previous study on Arabidopsis thaliana, Zhang et al. [33] described five members of the Fimbrin family, of which AtFIM4 and AtFIM5 were expressed at higher levels in pollen than in other tissues. These findings suggest the involvement of AtFIM4 and AtFIM5 in the growth and regulation of pollen tubes. Loss of function of AtFIM5 leads to slow pollen tube growth and pod grain deficiency, which affects pod length, morphology, and fruit set; moreover, simultaneous reductions in AtFIM4 and AtFIM5 expression cause even more severe phenotypes, impacting Arabidopsis size and yield at maturity. Based on the results of this study, Ding et al. [60] from Northwestern University further reported that Arabidopsis plants exhibit a series of growth hormone-related phenotypes upon simultaneous deletion of AtFIM4 and AtFIM5. The double mutant atfim4-1/atfim5-2 presented a longer primary root length, more lateral roots, more apical meristematic tissues, and a significant decrease in growth hormone content at the static position of the root tip. Taken together, these findings suggest that the absence of AtFIM4 and AtFIM5 may affect the transport of growth hormone in roots and that growth hormones have a major impact on regulating plant size during plant growth and development. From this, it can be deduced that fimbrin-5 also affects the weight of melon plants during growth and development; thus, the MELO3C029669 gene is a reasonable candidate gene associated with single fruit weight trait in melons.
To further validate the speculation that MELO3C029669 is a candidate gene, DNAMAN software was used to analyze the sequence difference features between the parents of the genes, and a total of 12 base differences in the sequence between the parents were found. Among them, four differences occurred in the base sequence of the parent MS-5, and eight differences occurred in the base sequence of the parent 1244, as shown in Figure S1A. The candidate gene MELO3C029669 was more conserved in MS-5 and had more variation in 1244. In summary, MELO3C029669 is likely the most likely candidate gene for controlling the weight of a single fruit in melons.
The candidate gene MELO3C029669 is related to fimbrin-5 (a filamentous protein) according to gene function annotation. To investigate the evolutionary relationship of this gene to its homologs in other species, the amino acid sequence encoded by the MELO3C029669 gene was subjected to BLAST in the NCBI online database to obtain the amino acid sequences of the homologous genes in several different plant species, and phylogenetic evolutionary trees were constructed using the neighbor-joining (NJ) method in MEGA 7.0 software (Figure S1B). Different evolutionary branch lengths represent different degrees of evolution; the longer the branch, the greater the degree of evolution, and vice versa. The results showed that the melon single fruit weight candidate gene MELO3C029669 was most closely related to that in P sativum, with the Gene ID KAl5432624.1 and furthest related to C melo var. makuwa, with the Gene ID TYK04175.1.

5. Conclusions

In this study, sfw2.2 was identified as the main QTL locus controlling single fruit weight traits in melons based on the genetic linkage map constructed by the research group previously. On this basis, the QTL of the sfw2.2 locus was further localized between the CYInDel11 marker and the CYInDel16 marker, with LOD values of 4.91 and 3.26, respectively. In the candidate region, 3 candidate genes were identified within a candidate interval of 136.5 Kb. The qRT-PCR results verified that MELO3C029669 genes were different expressed in melon fruit development, and evolutionary relationships analysis also hypothesized that MELO3C029669 is a candidate gene for controlling the single fruit weight of melon, which lays the foundation for the next step of gene function validation.

Supplementary Materials

The following supporting information can be downloaded at: https://www.mdpi.com/article/10.3390/genes15091138/s1, Figure S1: Sequence comparisons between parents of candidate genes and analysis of the evolutionary relationships in other species. A. The candidate gene is located in chr02 with genomic location 18,564,512–18,570,079. DNAMAN 1 is the parent and DNAMAN 2 is the maternal parent, and the light blue markers in the sequence comparison plot indicate sequence differences between the parents. B. A phylogenetic tree was constructed with MEGA 7.0 using the rootless neighbor-joining (NJ) method. The tree was drawn to scale and analyzed involving 10 amino acid sequences. The different evolutionary branch lengths represent the degree of evolutionary branch changes, with longer representing greater gene changes and shorter representing smaller gene changes. The numbers on the branches are greater than 70%, indicating that the reliability of the constructed evolutionary tree is good. Table S1: Candidate gene annotation information.

Author Contributions

Y.S. designed the experiment and access to funding. Y.C. (Yi Cai) conducted the molecular experiment and writing of the manuscript. D.W. and T.L. investigated the performance in the field. Y.C. (Ye Che) analyzed the field data. L.W. conducted the qRT-PCR and drew the pictures. F.Z. analyzed all the data on the website. All authors have read and agreed to the published version of the manuscript.

Funding

This work was supported by the grants from the National Natural Science Foundation of China (31772330), the Natural Science Foundation of the Heilongjiang Province, China (LH2022C065), and the Programme of The Daqing Branch of Heilongjiang Academy of Agricultural Sciences (2023230611000583).

Institutional Review Board Statement

Not applicable.

Informed Consent Statement

Not applicable.

Data Availability Statement

Data are contained within the article and Supplementary Materials.

Conflicts of Interest

The authors declare no conflicts of interest.

References

  1. Quero-García, J.; Campoy, J.; Barreneche, T.; Le Dantec, L.; Wenden, B.; Fouché, M.; Dirlewanger, E.; Silva, H.; Cai, L.; Iezzoni, A. Present and future of marker-assisted breeding in sweet and sour cherry. Acta Hortic. 2019, 2019, 1235. [Google Scholar] [CrossRef]
  2. Shi, P.; Xu, Z.; Zhang, S.; Wang, X.; Ma, X.; Zheng, J.; Xing, L.; Zhang, D.; Ma, J.; Han, M.; et al. Construction of a high-density SNP-based genetic map and identification of fruit-related QTLs and candidate genes in peach [Prunus persica (L.) Batsch]. BMC Plant Biol. 2020, 20, 438. [Google Scholar] [CrossRef]
  3. Illa-Berenguer, E.; Van Houten, J.; Huang, Z.; van der Knaap, E. Rapid and reliable identification of tomato fruit weight and locule number loci by QTL-seq. Theor. Appl. Genet. 2015, 128, 1329–1342. [Google Scholar] [CrossRef] [PubMed]
  4. Curtolo, M.; Cristofani-Yaly, M.; Gazaffi, R.; Takita, M.A.; Figueira, A.; Machado, M.A. QTL mapping for fruit quality in Citrus using DArTseq markers. BMC Genom. 2017, 18, 289. [Google Scholar] [CrossRef] [PubMed]
  5. Wang, H.; Yan, A.; Sun, L.; Zhang, G.; Wang, X.; Ren, J.; Xu, H. Novel stable QTLs identification for berry quality traits based on high-density genetic linkage map construction in table grape. BMC Plant Biol. 2020, 20, 411. [Google Scholar] [CrossRef]
  6. Natarajan, S.; Hossain, M.R.; Kim, H.-T.; Denison, M.I.J.; Ferdous, M.J.; Jung, H.-J.; Park, J.-I.; Nou, I.-S. ddRAD-seq derived genome-wide SNPs, high density linkage map and QTLs for fruit quality traits in strawberry (Fragaria x ananassa). 3 Biotech 2020, 10, 353. [Google Scholar] [CrossRef] [PubMed]
  7. Mengist, M.F.; Bostan, H.; Young, E.; Kay, K.L.; Gillitt, N.; Ballington, J.; Kay, C.D.; Ferruzzi, M.G.; Ashrafi, H.; Lila, M.A.; et al. High-density linkage map construction and identification of loci regulating fruit quality traits in blueberry. Hortic. Res. 2021, 8, 169. [Google Scholar] [CrossRef]
  8. Nantawan, U.; Kanchana-Udomkan, C.; Bar, I.; Ford, R. Linkage mapping and quantitative trait loci analysis of sweetness and other fruit quality traits in papaya. BMC Plant Biol. 2019, 19, 499. [Google Scholar] [CrossRef]
  9. Fresnedo-Ramírez, J.; Frett, T.J.; Sandefur, P.J.; Salgado-Rojas, A.; Clark, J.R.; Gasic, K.; Peace, C.P.; Anderson, N.; Hartmann, T.P.; Byrne, D.H.; et al. QTL mapping and breeding value estimation through pedigree-based analysis of fruit size and weight in four diverse peach breeding programs. Tree Genet. Genomes 2016, 12, 25. [Google Scholar] [CrossRef]
  10. Fresnedo-Ramírez, J.; Bink, M.C.A.M.; van de Weg, E.; Famula, T.R.; Crisosto, C.H.; Frett, T.J.; Gasic, K.; Peace, C.P.; Gradziel, T.M. QTL mapping of pomological traits in peach and related species breeding germplasm. Mol. Breed. 2015, 35, 166. [Google Scholar] [CrossRef]
  11. Desnoues, E.; Baldazzi, V.; Génard, M.; Mauroux, J.-B.; Lambert, P.; Confolent, C.; Quilot-Turion, B. Dynamic QTLs for sugars and enzyme activities provide an overview of genetic control of sugar metabolism during peach fruit development. J. Exp. Bot. 2016, 67, 3419–3431. [Google Scholar] [CrossRef]
  12. Da Silva Linge, C.; Bassi, D.; Bianco, L.; Pacheco, I.; Pirona, R.; Rossini, L. Genetic dissection of fruit weight and size in an F2 peach (Prunus persica (L.) Batsch) progeny. Mol. Breed. 2015, 35, 71. [Google Scholar] [CrossRef]
  13. Kim, M.; Nguyen, T.T.P.; Ahn, J.-H.; Kim, G.-J.; Sim, S.-C. Genome-wide association study identifies QTL for eight fruit traits in cultivated tomato (Solanum lycopersicum L.). Hortic. Res. 2021, 8, 203. [Google Scholar] [CrossRef] [PubMed]
  14. Guo, S.; Tian, M.; Du, H.; Liu, S.; Yu, R.; Shen, H. Quantitative Trait Loci Mapping and Comparative Transcriptome Analysis of Fruit Weight (FW) in Watermelon (Citrullus lanatus L.). Genes 2024, 15, 933. [Google Scholar] [CrossRef] [PubMed]
  15. Yang, T.; Amanullah, S.; Pan, J.; Chen, G.; Liu, S.; Ma, S.; Wang, J.; Gao, P.; Wang, X. Identification of putative genetic regions for watermelon rind hardness and related traits by BSA-seq and QTL mapping. Euphytica 2021, 217, 19. [Google Scholar] [CrossRef]
  16. Li, N.; Kong, S.; Zhou, D.; Li, N.; Shang, J.; Wang, J.; Ma, S. Mapping and validation of a new quantitative trait locus (QTL) for fruit size in watermelon (Citrullus lanatus). Sci. Hortic. 2023, 318, 112054. [Google Scholar] [CrossRef]
  17. Han, X.; Min, Z.; Wei, M.; Li, Y.; Wang, D.; Zhang, Z.; Hu, X.; Kong, Q. QTL mapping for pumpkin fruit traits using a GBS-based high-density genetic map. Euphytica 2022, 218, 106. [Google Scholar] [CrossRef]
  18. Liu, W.; Jiang, B.; Peng, Q.; He, X.; Lin, Y.; Wang, M.; Liang, Z.; Xie, D.; Hu, K. Genetic analysis and QTL mapping of fruit-related traits in wax gourd (Benincasa hispida). Euphytica 2018, 214, 136. [Google Scholar] [CrossRef]
  19. Zhang, H.; Zhang, X.; Li, M.; Yang, Y.; Li, Z.; Xu, Y.; Wang, H.; Wang, D.; Zhang, Y.; Wang, H.; et al. Molecular mapping for fruit-related traits, and joint identification of candidate genes and selective sweeps for seed size in melon. Genomics 2022, 114, 110306. [Google Scholar] [CrossRef]
  20. Amanullah, S.; Gao, P.; Osae, B.A.; Saroj, A.; Yang, T.; Liu, S.; Weng, Y.; Luan, F. Genetic linkage mapping and QTLs identification for morphology and fruit quality related traits of melon by SNP based CAPS markers. Sci. Hortic. 2021, 278, 109849. [Google Scholar] [CrossRef]
  21. Monforte, A.J.; Diaz, A.; Caño-Delgado, A.; van der Knaap, E. The genetic basis of fruit morphology in horticultural crops: Lessons from tomato and melon. J. Exp. Bot. 2013, 65, 4625–4637. [Google Scholar] [CrossRef] [PubMed]
  22. Monforte, A.J.; Eduardo, I.; Abad, S.; Arus, P. Inheritance mode of fruit traits in melon: Heterosis for fruit shape and its correlation with genetic distance. Euphytica 2005, 144, 31–38. [Google Scholar] [CrossRef]
  23. Díaz, A.; Martín-Hernández, A.M.; Dolcet-Sanjuan, R.; Garcés-Claver, A.; Álvarez, J.M.; Garcia-Mas, J.; Picó, B.; Monforte, A.J. Quantitative trait loci analysis of melon (Cucumis melo L.) domestication-related traits. Theor. Appl. Genet. 2017, 130, 1837–1856. [Google Scholar] [CrossRef] [PubMed]
  24. Díaz, A.; Zarouri, B.; Fergany, M.; Eduardo, I.; Álvarez, J.M.; Picó, B.; Monforte, A.J. Mapping and Introgression of QTL Involved in Fruit Shape Transgressive Segregation into ‘Piel de Sapo’ Melon (Cucucumis melo L.). PLoS ONE 2014, 9, e104188. [Google Scholar] [CrossRef] [PubMed]
  25. Zhao, G.; Lian, Q.; Zhang, Z.; Fu, Q.; He, Y.; Ma, S.; Ruggieri, V.; Monforte, A.J.; Wang, P.; Julca, I.; et al. A comprehensive genome variation map of melon identifies multiple domestication events and loci influencing agronomic traits. Nat. Genet. 2019, 51, 1607–1615. [Google Scholar] [CrossRef]
  26. Campos, M.; Gonzalo, M.J.; Díaz, A.; Picó, B.; Gómez-Guillamón, M.L.; Monforte, A.J.; Esteras, C. A Novel Introgression Line Library Derived from a Wild Melon Gives Insights into the Genetics of Melon Domestication, Uncovering New Genetic Variability Useful for Breeding. Int. J. Mol. Sci. 2023, 24, 10099. [Google Scholar] [CrossRef]
  27. Pereira, L.; Ruggieri, V.; Pérez, S.; Alexiou, K.G.; Fernández, M.; Jahrmann, T.; Pujol, M.; Garcia-Mas, J. QTL mapping of melon fruit quality traits using a high-density GBS-based genetic map. BMC Plant Biol. 2018, 18, 324. [Google Scholar] [CrossRef]
  28. Ramamurthy, R.K.; Waters, B.M. Identification of fruit quality and morphology QTLs in melon (Cucumis melo) using a population derived from flexuosus and cantalupensis botanical groups. Euphytica 2015, 204, 163–177. [Google Scholar] [CrossRef]
  29. Lian, Q.; Fu, Q.; Xu, Y.; Hu, Z.; Zheng, J.; Zhang, A.; He, Y.; Wang, C.; Xu, C.; Chen, B.; et al. QTLs and candidate genes analyses for fruit size under domestication and differentiation in melon (Cucumis melo L.) based on high resolution maps. BMC Plant Biol. 2021, 21, 126. [Google Scholar] [CrossRef]
  30. Pereira, L.; Santo Domingo, M.; Argyris, J.; Mayobre, C.; Valverde, L.; Martín-Hernández, A.M.; Pujol, M.; Garcia-Mas, J. A novel introgression line collection to unravel the genetics of climacteric ripening and fruit quality in melon. Sci. Rep. 2021, 11, 11364. [Google Scholar] [CrossRef] [PubMed]
  31. Zhang, S.; Wang, C.; Xie, M.; Liu, J.; Kong, Z.; Su, H. Actin Bundles in The Pollen Tube. Int. J. Mol. Sci. 2018, 19, 3710. [Google Scholar] [CrossRef]
  32. Xu, Y.; Guo, S.-R.; Shu, S.; Ren, Y.; Sun, J. Construction of a genetic linkage map of rootstock-used pumpkin using SSR markers and QTL analysis for cold tolerance. Sci. Hortic. 2017, 220, 107–113. [Google Scholar] [CrossRef]
  33. Zhang, Y.; Zhang, P.; Bhadauria, V.; Chen, X.; Ma, B. An efficient CAPS marker for bacterial-blight resistance gene xa25 in rice. Can. J. Plant Pathol. 2017, 39, 117–120. [Google Scholar] [CrossRef]
  34. Seo, J.-H.; Dhungana, S.K.; Kang, B.-K.; Baek, I.-Y.; Sung, J.-S.; Ko, J.-Y.; Jung, C.-S.; Kim, K.-S.; Jun, T.-H. Development and Validation of SNP and InDel Markers for Pod-Shattering Tolerance in Soybean. Int. J. Mol. Sci. 2022, 23, 2382. [Google Scholar] [CrossRef] [PubMed]
  35. Wang, G.; Dai, D.; Wang, L.; Sheng, Y.; Wang, D.; Li, D.; Tian, L.; Luan, F. QTL analysis of flowering-related traits by specific length amplified fragment sequencing in melon. Crop Sci. 2021, 62, 203–215. [Google Scholar] [CrossRef]
  36. Niedz, R.P.; Song, Z.; Miao, H.; Zhang, S.; Wang, Y.; Zhang, S.P.; Gu, X.F. Genetic Analysis and QTL Mapping of Fruit Peduncle Length in Cucumber (Cucumis sativus L.). PLoS ONE 2016, 11, e0167845. [Google Scholar] [CrossRef]
  37. He, Y.; Li, L.; Yao, Y.; Li, Y.; Zhang, H.; Fan, M. Transcriptome-wide N6-methyladenosine (m6A) methylation in watermelon under CGMMV infection. BMC Plant Biol. 2021, 21, 516. [Google Scholar] [CrossRef]
  38. Wang, X.; Ando, K.; Wu, S.; Reddy, U.K.; Tamang, P.; Bao, K.; Hammar, S.A.; Grumet, R.; McCreight, J.D.; Fei, Z. Genetic characterization of melon accessions in the U.S. National Plant Germplasm System and construction of a melon core collection. Mol. Hortic. 2021, 1, 11. [Google Scholar] [CrossRef] [PubMed]
  39. Hazman, M.; Kabil, F.; Elhamid, S.A.; Nick, P. Double lysis: An integrative time-saving method yielding high-quality RNA from strawberry. J. Genet. Eng. Biotechnol. 2020, 18, 22–28. [Google Scholar] [CrossRef] [PubMed]
  40. Dong, Y.; Sun, W.; Yue, Z.; Gong, B.; Yang, X.; Wu, K.; Liu, C.; Xu, Y. Phenotypic Diversity and Relationships of Fruit Traits in Persimmon (Diospyros kaki Thunb.) Germplasm Resources. Agriculture 2023, 13, 1804. [Google Scholar] [CrossRef]
  41. Gong, C.; Zhao, S.; Yang, D.; Lu, X.; Anees, M.; He, N.; Zhu, H.; Zhao, Y.; Liu, W. Genome-wide association analysis provides molecular insights into natural variation in watermelon seed size. Hortic. Res. 2022, 9, uhab074. [Google Scholar] [CrossRef] [PubMed]
  42. Chen, K.-X.; Dai, D.-Y.; Wang, L.; Yang, L.-M.; Li, D.-D.; Wang, C.; Ji, P.; Sheng, Y.-Y. SLAF marker based QTL mapping of fruit-related traits reveals a major-effect candidate locus ff2.1 for flesh firmness in melon. J. Integr. Agric. 2023, 22, 3331–3345. [Google Scholar] [CrossRef]
  43. Rehman, F.; Gong, H.; Li, Z.; Zeng, S.; Yang, T.; Ai, P.; Pan, L.; Huang, H.; Wang, Y. Identification of fruit size associated quantitative trait loci featuring SLAF based high-density linkage map of goji berry (Lycium spp.). BMC Plant Biol. 2020, 20, 474. [Google Scholar] [CrossRef] [PubMed]
  44. Harel-Beja, R.; Tzuri, G.; Portnoy, V.; Lotan-Pompan, M.; Lev, S.; Cohen, S.; Dai, N.; Yeselson, L.; Meir, A.; Libhaber, S.E.; et al. A genetic map of melon highly enriched with fruit quality QTLs and EST markers, including sugar and carotenoid metabolism genes. Theor. Appl. Genet. 2010, 121, 511–533. [Google Scholar] [CrossRef] [PubMed]
  45. Zalapa, J.E.; Staub, J.E.; McCreight, J.D.; Chung, S.M.; Cuevas, H. Detection of QTL for yield-related traits using recombinant inbred lines derived from exotic and elite US Western Shipping melon germplasm. Theor. Appl. Genet. 2007, 114, 1185–1201. [Google Scholar] [CrossRef] [PubMed]
  46. Monforte, A.J.; Oliver, M.; Gonzalo, M.J.; Alvarez, J.M.; Dolcet-Sanjuan, R.; Arús, P. Identification of quantitative trait loci involved in fruit quality traits in melon (Cucumis melo L.). Theor. Appl. Genet. 2004, 108, 750–758. [Google Scholar] [CrossRef]
  47. Zhang, T.; Ding, Z.; Liu, J.; Qiu, B.; Gao, P. QTL mapping of pericarp and fruit-related traits in melon (Cucumis melo L.) using SNP-derived CAPS markers. Sci. Hortic. 2020, 265, 109243. [Google Scholar] [CrossRef]
  48. Zhu, W.-Y.; Huang, L.; Chen, L.; Yang, J.-T.; Wu, J.-N.; Qu, M.-L.; Yao, D.-Q.; Guo, C.-L.; Lian, H.-L.; He, H.-L.; et al. A High-Density Genetic Linkage Map for Cucumber (Cucumis sativus L.): Based on Specific Length Amplified Fragment (SLAF) Sequencing and QTL Analysis of Fruit Traits in Cucumber. Front. Plant Sci. 2016, 7, 437. [Google Scholar] [CrossRef]
  49. Sheng, Y.; Pan, Y.; Li, Y.; Yang, L.; Weng, Y.; Flachowsky, H. Quantitative trait loci for fruit size and flowering time-related traits under domestication and diversifying selection in cucumber (Cucumis sativus). Plant Breed. 2020, 139, 176–191. [Google Scholar] [CrossRef]
  50. Hernández-Bautista, A.; Lobato-Ortiz, R.; García-Zavala, J.J.; López-Fortoso, F.; Cruz-Izquierdo, S.; Chávez-Servia, J.L.; Cadeza-Espinosa, M. Quantitative trait locus mapping associated with earliness and fruit weight in tomato. Sci. Agric. 2016, 73, 478–486. [Google Scholar] [CrossRef]
  51. Lopez-Moreno, H.; Basurto-Garduño, A.C.; Torres-Meraz, M.A.; Diaz-Valenzuela, E.; Arellano-Arciniega, S.; Zalapa, J.; Sawers, R.J.H.; Cibrián-Jaramillo, A.; Diaz-Garcia, L. Genetic analysis and QTL mapping of domestication-related traits in chili pepper (Capsicum annuum L.). Front. Genet. 2023, 14, 1101401. [Google Scholar] [CrossRef] [PubMed]
  52. Zhang, Q.; Liu, J.; Liu, W.; Liu, N.; Zhang, Y.; Xu, M.; Liu, S.; Ma, X.; Zhang, Y. Construction of a high-density genetic map and identification of quantitative trait loci linked to fruit quality traits in apricots using specific-locus amplified fragment sequencing. Front. Plant Sci. 2022, 13, 798700. [Google Scholar] [CrossRef] [PubMed]
  53. Marco, C.; Irina, B.; Remo, C.; Chiozzotto, R.; Silvestri, C.; Rossini, L.; Bassi, D. Genetic and phenotypic analyses reveal major quantitative loci associated to fruit size and shape traits in a non-flat peach collection (P. persica L. Batsch). Hortic. Res. 2021, 8, 232. [Google Scholar] [CrossRef]
  54. Pan, L.; Wang, M.; Yang, Y.; Chen, C.; Dai, H.; Zhang, Z.; Hua, B.; Miao, M. Whole-genome resequencing identified QTLs, candidate genes and Kompetitive Allele-Specific PCR markers associated with the large fruit of Atlantic Giant (Cucurbita maxima). Front. Plant Sci. 2022, 13, 942004. [Google Scholar] [CrossRef]
  55. Chang, Y.; Zheng, W.; Wang, S.; He, X.; He, P.; Li, H.; Wang, H.; Li, L. QTL mapping combined RNA-seq technology identified potential genes involved in regulation of apple size. Sci. Hortic. 2023, 319, 112150. [Google Scholar] [CrossRef]
  56. Ning, Y.; Wei, K.; Li, S.; Zhang, L.; Chen, Z.; Lu, F.; Yang, P.; Yang, M.; Liu, X.; Liu, X.; et al. Fine Mapping of fw6.3, a Major-Effect Quantitative Trait Locus That Controls Fruit Weight in Tomato. Plants 2023, 12, 2065. [Google Scholar] [CrossRef] [PubMed]
  57. Kaźmińska, K.; Hallmann, E.; Korzeniewska, A.; Niemirowicz-Szczytt, K.; Bartoszewski, G. Identification of Fruit-Associated QTLs in Winter Squash (Cucurbita maxima Duchesne) Using Recombinant Inbred Lines. Genes 2020, 11, 419. [Google Scholar] [CrossRef]
  58. Osae, B.A.; Amanullah, S.; Liu, H.; Liu, S.; Saroj, A.; Zhang, C.; Liu, T.; Gao, P.; Luan, F. CAPS marker-base genetic linkage mapping and QTL analysis for watermelon ovary, fruit and seed-related traits. Euphytica 2022, 218, 39. [Google Scholar] [CrossRef]
  59. Santo Domingo, M.; Mayobre, C.; Pereira, L.; Argyris, J.; Valverde, L.; Martín-Hernández, A.M.; Garcia-Mas, J.; Pujol, M. Fruit morphology and ripening-related QTLs in a newly developed introgression line collection of the elite varieties ‘Védrantais’ and ‘Piel de Sapo’. Plants 2022, 11, 3120. [Google Scholar] [CrossRef] [PubMed]
  60. Ding, X.; Zhang, S.; Liu, J.; Liu, S.; Su, H. Arabidopsis FIM4 and FIM5 regulates the growth of root hairs in an auxin-insensitive way. Plant Signal. Behav. 2018, 13, e1473667. [Google Scholar] [CrossRef] [PubMed]
Figure 1. Female parent 1244, male parent MS-5, F1, F2, and F2:3 fruit size variation. Based on the images of the two parental lines and their F1 mature fruits, it is important to note the significant differences in fruit weight between the parental melon lines. Images of representative melons of different weights from the F2 population and F2:3 family lines, all showed differences in fruit size of plants within the F2 population and in fruit size of plants of the F2:3 family.
Genes 15 01138 g001
Figure 2. F2, 2020 and 2021 F2:3 families melon single fruit weight frequency distribution diagram. In this study, we collected data on single fruit weight of the F2 population, 2020 and 2021 F2:3 families from the cross 1244 × MS-5, and plotted the performance of single fruit weight traits of the two parents and their F1 fruits, as well as the frequency distribution of the F2 population, 2020 and 2021 F2:3 families.
Genes 15 01138 g002
Figure 3. Linkage map and chromosomal locations of QTL for single fruit weight. QTL localization of single fruit weight (sfw) in melon based on experimental data from F2:3 family lines. Previous studies of sfw are also listed to compare the loci. The number above the 12 chromosomes represents the length of the map, measured in millimeters (cM). The original QTL names from various publications are used. Six QTLs related to single fruit weight were identified in this study, represented in red bar. The brown bar sfw QTL comes from Harel et al. (2010) [44]; the yellow bar of sfw QTL comes from Zalapa et al. (2007) [45]; the blue bar of sfw QTL comes from Monforte et al. (2004) [46]; the purple bar of sfw QTL comes from Pereira et al. (2018) [27]; and the green bar of sfw QTL comes from Zhang et al. (2020) [47].
Genes 15 01138 g003
Figure 4. (A) Distribution curve of LOD value of QTL loci for single fruit weight trait of melon. The upper part is the distribution curve of the LOD value of the six QTL loci for the single fruit weight trait located, and the lower part is the additive effect (blue line) and dominant effect (red) curve corresponding to the position of the upper part. The sfw2.2 locus highlighted in red is the main effect QTL locus. (B) LOD profile of the primary QTL sfw2.2 detected in F2:3 family lines controlling single fruit weight trait in melon. The red curve represents the QTL positioning for 2020, and the blue curve represents the QTL positioning for 2021. Pink markers on the horizontal axis define the 3.0 LOD interval for each QTL. Fine localization using 300 plants from the F2:3 family line designated the 136.5kb region between CYIndel11 and CYIndel6 as the candidate gene region. (C) Black coding represents the genotype “1244”, white coding represents the genotype “MS-5”, and striped coding represents the heterozygous genotype. Three coding genes predicted in the 136.5 kb region, and the boxes represent genes.
Genes 15 01138 g004
Figure 5. Expression levels of the three candidate genes in fruits of 1244 and MS-5 at different times after pollination. Three genes were quantified using the 2−ΔΔCT method. For the two parents, the expression level of the respective genes in 15d, 25d, and 35d after pollination, respectively. Each sampling was repeated three times, and 10 plants were mixed in equal amounts to form one replicate in two parents. ** indicates an extremely significant difference, p < 0.01.
Genes 15 01138 g005
Table 1. Information about primers for fine localization.
NumberPrimer NameGenomic LocationForward SequenceReverse Sequence
1CYIndel618,524,772–18,524,791CCTAAGGCTAAAGGATATCGAAACATTTTGGAAGGGTAAG
2CYIndel918,560,853–18,561,288AGTAAAGATGGGGTGAAAACTGTGAAAAATGAGGATGGAA
3CYIndel1118,568,142–18,568,533GCTGTAGAACACATTAAGGACGATAAAGACCTTGGAAAATCGAATA
4CYIndel1318,602,885–18,603,339CTCCTGCTTGTGTCCTCATGTCAGTCTTCTCAAATCCTCCC
5CYIndel1618,704,309–18,704,724TCTTTCGGCTTCACTTGCTTGAAGAGCGTTGTGCTGTGG
6CYIndel2618,906,922–18,907,357TTTGTGAGAGACAAGTTTGAGTATACAGGAAGATTTTCTGCTAC
7CYIndel2718,920,443–18,920,801TCCTCGAAGTCGGTGGTAACTGGTCCTATCAATGAGGCAAAT
Table 2. Phenotypic analysis of single fruit weight traits in melon.
GenerationMean ± SDCVMaximumMinimumRangeH2 of Trait
124422.59 ± 11.74 a51.97%43.833.8340.0052.51%
MS-5814.97 ± 70.12 b8.60%931.84682.72249.12
F1160.17 ± 30.0618.77%201.4099.15102.25
F2100.89 ± 71.97Max: 170.99 ± 72.60 a71.34%406.8017.40389.40
Min: 59.72 ± 23.57 b
F2:3-2020106.37 ± 63.14Max: 163.42 ± 67.33 a59.36%395.7018.69377.01
Min: 65.32 ± 25.81 b
F2:3-2021112.29 ± 58.39Max: 151.60 ± 55.24 a52.00%326.6319.46307.17
Min: 70.52 ± 20.13 b
Note: p < 0.05. SD is standard deviation. CV values are coefficients of variation and indicate the degree of variability. H2 indicates heritability.
Table 3. QTL loci for single fruit weight traits by F2 population in melon.
TraitQTLsiteLinkage GroupGenome Start PositionGenome End PositionLOD ADDPVE (%)Gene Number
Single fruit weightsfw1.1134,295,74534,435,7273.30−28.388.3017
sfw2.121,626,5171,635,5043.0017.813.101
sfw2.2218,344,18418,881,3715.60−45.1017.0015
sfw6.1630,841,18738,291,6453.20−21.938.60354
sfw7.174,758,0467,547,7883.20−25.565.90113
sfw10.110485,913504,6013.10−30.648.302
LOD, logarithm of the odds; ADD, additive effect; PVE, phenotypic variation explained by specific QTL of total variances.
Disclaimer/Publisher’s Note: The statements, opinions and data contained in all publications are solely those of the individual author(s) and contributor(s) and not of MDPI and/or the editor(s). MDPI and/or the editor(s) disclaim responsibility for any injury to people or property resulting from any ideas, methods, instructions or products referred to in the content.

