A Review and Meta-Analysis of Genotype by Environment Interaction in Commercial Shrimp Breeding


Highlights
- We conducted a meta-analysis of all known genotype-by-environment interaction (GxE) studies in commercially farmed shrimp;
- The majority of studies were conducted in Pacific white shrimp (Litopenaeus vannamei);
- We detected low-to-moderate GxE in growth and body weight traits, but substantial GxE was evident for survival and disease resistance traits.
- Selection for growth in one environment should result in predictable improvement across a wide range of environments;
- Selection for survival is likely to be highly dependent on the specific environment in which shrimp are farmed, requiring tailored genetic improvement programmes;
- Further studies including opportunities for implementing GxE in genomic selection are required across different shrimp species.
Abstract
1. Introduction
2. Meta-Analysis Methodology
2.1. Study Selection
2.2. Basic Study Information and Weighted Estimation of Genetic Correlation
2.3. Factors Affecting G×E Detection
3. Meta-Analysis Results
4. Discussion and Implications for the Shrimp Industry
4.1. G×E in Growth Traits
4.2. G×E in Survival Traits
4.3. G×E in Other Economically-Important Traits
4.4. Prospects to Overcome G×E in Breeding Programs
5. Conclusions and Recommendation
Author Contributions
Funding
Conflicts of Interest
References
- Van Eenennaam, A.L. Application of genome editing in farm animals: Cattle. Transgenic Res. 2019, 28 (Suppl. 2), 93–100. [Google Scholar] [CrossRef] [PubMed]
- Athrey, G. Poultry genetics and breeding. In Animal Agriculture; Elsevier: Amsterdam, The Netherlands, 2020; pp. 317–330. [Google Scholar]
- Gjedrem, T.; Robinson, N.; Rye, M. The importance of selective breeding in aquaculture to meet future demands for animal protein: A review. Aquaculture 2012, 350, 117–129. [Google Scholar] [CrossRef]
- Andriantahina, F.; Liu, X.; Feng, T.; Xiang, J. Current status of genetics and genomics of reared penaeid shrimp: Information relevant to access and benefit sharing. Mar. Biotechnol. 2013, 15, 399–412. [Google Scholar] [CrossRef] [PubMed]
- Gjedrem, T. Genetic improvement for the development of efficient global aquaculture: A personal opinion review. Aquaculture 2012, 344, 12–22. [Google Scholar] [CrossRef]
- Anderson, J.; Valderrama, D.; Darryl, J. Shrimp Production Review; Global Outlook for Aquaculture Leadership (GOAL): Dublin, Ireland, 2017. [Google Scholar]
- Van Sang, N.; Luan, N.T.; Van Hao, N.; Van Nhien, T.; Vu, N.T.; Nguyen, N.H. Genotype by environment interaction for survival and harvest body weight between recirculating tank system and pond culture in Penaeus monodon. Aquaculture 2020, 525, 735278. [Google Scholar] [CrossRef]
- Mulder, H.A.; Bijma, P.; Hill, W.G. Selection for uniformity in livestock by exploiting genetic heterogeneity of residual variance. Genet. Sel. Evol. 2008, 40, 37. [Google Scholar]
- Hoffmann, A.A.; Merilä, J. Heritable variation and evolution under favourable and unfavourable conditions. Trends Ecol. Evol. 1999, 14, 96–101. [Google Scholar] [CrossRef]
- Falconer, D.S.; Mackay, T.F.C. Introduction to Quantitative Genetics, 4th ed.; Addison Wesley Longman: Harlow, UK, 1996. [Google Scholar]
- Lynch, M.; Walsh, B. Genetics and Analysis of Quantitative Traits; Sinauer: Sunderland, MA, USA, 1998. [Google Scholar]
- Mulder, H.; Bijma, P. Effects of genotype × environment interaction on genetic gain in breeding programs. J. Anim. Sci. 2005, 83, 49–61. [Google Scholar] [CrossRef]
- Drangsholt, T.; Gjerde, B.; Ødegård, J.; Finne-Fridell, F.; Evensen, Ø.; Bentsen, H. Quantitative genetics of disease resistance in vaccinated and unvaccinated Atlantic salmon (Salmo salar L.). Heredity 2011, 107, 471–477. [Google Scholar] [CrossRef]
- Kause, A.; Ritola, O.; Paananen, T.; Mäntysaari, E.; Eskelinen, U. Selection against early maturity in large rainbow trout Oncorhynchus mykiss: The quantitative genetics of sexual dimorphism and genotype-by-environment interactions. Aquaculture 2003, 228, 53–68. [Google Scholar] [CrossRef]
- Kolstad, K.; Thorland, I.; Refstie, T.; Gjerde, B. Genetic variation and genotype by location interaction in body weight, spinal deformity and sexual maturity in Atlantic cod (Gadus morhua) reared at different locations off Norway. Aquaculture 2006, 259, 66–73. [Google Scholar] [CrossRef]
- Nilsson, J.; Brännäs, E.; Eriksson, L.-O. The Swedish Arctic charr breeding programme. Hydrobiologia 2010, 650, 275–282. [Google Scholar] [CrossRef]
- Saillant, E.; Dupont-Nivet, M.; Haffray, P.; Chatain, B. Estimates of heritability and genotype–environment interactions for body weight in sea bass (Dicentrarchus labrax L.) raised under communal rearing conditions. Aquaculture 2006, 254, 139–147. [Google Scholar] [CrossRef]
- Navarro, A.; Zamorano, M.J.; Hildebrandt, S.; Ginés, R.; Aguilera, C.; Afonso, J.M. Estimates of heritabilities and genetic correlations for growth and carcass traits in gilthead seabream (Sparus auratus L.), under industrial conditions. Aquaculture 2009, 289, 225–230. [Google Scholar] [CrossRef]
- Guan, J.; Hu, Y.; Wang, M.; Wang, W.; Kong, J.; Luan, S. Estimating genetic parameters and genotype-by-environment interactions in body traits of turbot in two different rearing environments. Aquaculture 2016, 450, 321–327. [Google Scholar] [CrossRef]
- Mas-Muñoz, J.; Blonk, R.; Schrama, J.W.; van Arendonk, J.; Komen, H. Genotype by environment interaction for growth of sole (Solea solea) reared in an intensive aquaculture system and in a semi-natural environment. Aquaculture 2013, 410, 230–235. [Google Scholar] [CrossRef]
- Gjerde, B.; Mahapatra, K.D.; Reddy, P.V.; Saha, J.N.; Jana, R.K.; Meher, P.K.; Sahoo, M.; Khaw, H.L.; Gjedrem, T.; Rye, M. Genetic parameters for growth and survival in rohu carp (Labeo rohita). Aquaculture 2019, 503, 381–388. [Google Scholar] [CrossRef]
- Khaw, H.L.; Ponzoni, R.W.; Hamzah, A.; Abu-Bakar, K.R.; Bijma, P. Genotype by production environment interaction in the GIFT strain of Nile tilapia (Oreochromis niloticus). Aquaculture 2012, 326, 53–60. [Google Scholar] [CrossRef]
- Sae-Lim, P.; Gjerde, B.; Nielsen, H.M.; Mulder, H.; Kause, A. A review of genotype-by-environment interaction and micro-environmental sensitivity in aquaculture species. Rev. Aquac. 2016, 8, 369–393. [Google Scholar] [CrossRef]
- Argue, B.J.; Arce, S.M.; Lotz, J.M.; Moss, S.M. Selective breeding of Pacific white shrimp (Litopenaeus vannamei) for growth and resistance to Taura Syndrome Virus. Aquaculture 2002, 204, 447–460. [Google Scholar] [CrossRef]
- Pérez-Rostro, C.I.; Ibarra, A.M. Quantitative genetic parameter estimates for size and growth rate traits in Pacific white shrimp, Penaeus vannamei (Boone 1931) when reared indoors. Aquac. Res. 2003, 34, 543–553. [Google Scholar] [CrossRef]
- Pérez-Rostro, C.I.; Ibarra, A.M. Heritabilities and genetic correlations of size traits at harvest size in sexually dimorphic Pacific white shrimp (Litopenaeus vannamei) grown in two environments. Aquac. Res. 2003, 34, 1079–1085. [Google Scholar] [CrossRef]
- Pérez-Rostro, C.I.; Racotta, I.S.; Ibarra, A.M. Decreased genetic variation in metabolic variables of Litopenaeus vannamei shrimp after exposure to acute hypoxia. J. Exp. Mar. Biol. Ecol. 2004, 302, 189–200. [Google Scholar] [CrossRef]
- Gitterle, T.; Salte, R.; Gjerde, B.; Cock, J.; Johansen, H.; Salazar, M.; Lozano, C.; Rye, M. Genetic (co)variation in resistance to White Spot Syndrome Virus (WSSV) and harvest weight in Penaeus (Litopenaeus) vannamei. Aquaculture 2005, 246, 139–149. [Google Scholar] [CrossRef]
- Gitterle, T.; Rye, M.; Salte, R.; Cock, J.; Johansen, H.; Lozano, C.; Suárez, J.A.; Gjerde, B. Genetic (co)variation in harvest body weight and survival in Penaeus (Litopenaeus) vannamei under standard commercial conditions. Aquaculture 2005, 243, 83–92. [Google Scholar] [CrossRef]
- Gitterle, T.; Ødegård, J.; Gjerde, B.; Rye, M.; Salte, R. Genetic parameters and accuracy of selection for resistance to White Spot Syndrome Virus (WSSV) in Penaeus (Litopenaeus) vannamei using different statistical models. Aquaculture 2006, 251, 210–218. [Google Scholar] [CrossRef]
- Gitterle, T.; Gjerde, B.; Cock, J.; Salazar, M.; Rye, M.; Vidal, O.; Lozano, C.; Erazo, C.; Salte, R. Optimization of experimental infection protocols for the estimation of genetic parameters of resistance to White Spot Syndrome Virus (WSSV) in Penaeus (Litopenaeus) vannamei. Aquaculture 2006, 261, 501–509. [Google Scholar] [CrossRef]
- Castillo-Juárez, H.; Casares, J.C.Q.; Campos-Montes, G.; Villela, C.C.; Ortega, A.M.; Montaldo, H.H. Heritability for body weight at harvest size in the Pacific white shrimp, Penaeus (Litopenaeus) vannamei, from a multi-environment experiment using univariate and multivariate animal models. Aquaculture 2007, 273, 42–49. [Google Scholar] [CrossRef]
- Ibarra, A.M.; Famula, T.R. Genotype by environment interaction for adult body weights of shrimp Penaeus vannamei when grown at low and high densitie. Genet. Sel. Evol. 2008, 40, 541. [Google Scholar] [CrossRef]
- Campos-Montes, G.R.; Montaldo, H.H.; Martínez-Ortega, A.; Castillo-Juárez, H. Genotype by environment interaction effects for body weight at 130 days of age in the Pacific white shrimp [Penaeus (Litopenaeus) vannamei]. Vet. México 2009, 40, 255–268. [Google Scholar]
- Moss, D.R.; Moss, S.M.; Lotz, J.M. Estimation of genetic parameters for survival to multiple isolates of Taura syndrome virus in a selected population of Pacific white shrimp Penaeus (Litopenaeus) vannamei. Aquaculture 2013, 416, 78–84. [Google Scholar] [CrossRef]
- Li, W.; Luan, S.; Luo, K.; Sui, J.; Xu, X.; Tan, J.; Kong, J. Genetic parameters and genotype by environment interaction for cold tolerance, body weight and survival of the Pacific white shrimp Penaeus vannamei at different temperatures. Aquaculture 2015, 441, 8–15. [Google Scholar] [CrossRef]
- Luan, S.; Wang, J.; Yang, G.; Luo, K.; Chen, X.; Gao, Q.; Hu, H.; Kong, J. Genetic parameters of survival for six generations in the giant freshwater prawn Macrobrachium rosenbergii. Aquac. Res. 2015, 46, 1345–1355. [Google Scholar] [CrossRef]
- Caballero-Zamora, A.; Montaldo, H.H.; Campos-Montes, G.R.; Cienfuegos-Rivas, E.G.; Martínez-Ortega, A.; Castillo-Juárez, H. Genetic parameters for body weight and survival in the Pacific White Shrimp Penaeus (Litopenaeus) vannamei affected by a White Spot Syndrome Virus (WSSV) natural outbreak. Aquaculture 2015, 447, 102–107. [Google Scholar] [CrossRef]
- Sui, J.; Luan, S.; Luo, K.; Meng, X.; Lu, X.; Cao, B.; Li, W.; Chai, Z.; Liu, N.; Xu, S. Genetic parameters and response to selection for harvest body weight of Pacific white shrimp, Litopenaeus vannamei. Aquac. Res. 2016, 47, 2795–2803. [Google Scholar] [CrossRef]
- Lu, X.; Luan, S.; Cao, B.; Meng, X.; Sui, J.; Dai, P.; Luo, K.; Shi, X.; Hao, D.; Han, G. Estimation of genetic parameters and genotype-by-environment interactions related to acute ammonia stress in Pacific white shrimp (Litopenaeus vannamei) juveniles at two different salinity levels. PLoS ONE 2017, 12, e0173835. [Google Scholar] [CrossRef]
- Tan, J.; Luan, S.; Luo, K.; Guan, J.; Li, W.; Sui, J.; Guo, Z.; Xu, S.; Kong, J. Heritability and genotype by environment interactions for growth and survival in Litopenaeus vannamei at low and high densities. Aquac. Res. 2017, 48, 1430–1438. [Google Scholar] [CrossRef]
- Dai, P.; Kong, J.; Meng, X.; Luo, K.; Lu, X.; Chen, B.; Cao, B.; Luan, S. Genotype by environment interaction for feed efficiency trait of the juvenile Pacific white shrimp Litopenaeus vannamei held in individuals vs. in groups. Aquaculture 2019, 500, 506–513. [Google Scholar] [CrossRef]
- Giang, C.T.; Knibb, W.; Ninh, N.H.; Nguyen, N.H. Prospects for Genetic Improvement in Objective Measurements of Body Colour in Pacific Whiteleg Shrimp (Litopenaeus vannamei). J. Mar. Sci. Eng. 2019, 7, 460. [Google Scholar] [CrossRef]
- Nguyen, N.H.; Ninh, N.H.; Hung, N.H. Evaluation of two genetic lines of Pacific White leg shrimp Liptopenaeus vannamei selected in tank and pond environments. Aquaculture 2020, 516, 734522. [Google Scholar] [CrossRef]
- Cala-Moreno, N.; Campos-Montes, G.; Caballero-Zamora, A.; Berruecos-Villalobos, J.; Castillo-Juárez, H. Genotype-by-environment interaction in white shrimp associated with White Spot Disease. Abanico Vet. 2021, 11, e2020-95. [Google Scholar]
- Hayes, B.J.; Gitterle, T.; Gopikrishna, G.; Gopal, C.; Krishna, G.; Jahageerdar, S.; Lozano, C.; Alavandi, S.; Paulpandi, S.; Ravichandran, P. Limited evidence for genetic variation for resistance to the white spot syndrome virus in Indian populations of Penaeus monodon. Aquac. Res. 2010, 41, e872–e877. [Google Scholar] [CrossRef]
- Krishna, G.; Gopikrishna, G.; Gopal, C.; Jahageerdar, S.; Ravichandran, P.; Kannappan, S.; Pillai, S.M.; Paulpandi, S.; Kiran, R.P.; Saraswati, R. Genetic parameters for growth and survival in Penaeus monodon cultured in India. Aquaculture 2011, 318, 74–78. [Google Scholar] [CrossRef]
- Noble, T.H.; Coman, G.J.; Wade, N.M.; Thomson, P.C.; Raadsma, H.W.; Khatkar, M.S.; Guppy, J.L.; Jerry, D.R. Genetic parameters for tolerance to gill-associated virus under challenge-test conditions in the black tiger shrimp (Penaeus monodon). Aquaculture 2020, 516, 734428. [Google Scholar] [CrossRef]
- Jiang, S.; Mo, X.; Zhou, F.; Huang, J.; Yang, Q.; Yang, L.; Jiang, S. Genetic Evaluation of Body Weight and Survival of Black Tiger Shrimp (Penaeus monodon) fed on Different Dietary Levels of Fish Meal Protein. Pak. J. Zool. 2021, 53, 1–6. [Google Scholar] [CrossRef]
- Hasan, M.M.; Thomson, P.C.; Raadsma, H.W.; Khatkar, M.S. Genetic analysis of digital image derived morphometric traits of black tiger shrimp (Penaeus monodon) by incorporating G × E investigations. Front. Genet. 2022, 13, 1007123. [Google Scholar] [CrossRef]
- Coman, G.J.; Crocos, P.J.; Preston, N.P.; Fielder, D. The effects of temperature on the growth, survival and biomass of different families of juvenile Penaeus japonicus Bate. Aquaculture 2002, 214, 185–199. [Google Scholar] [CrossRef]
- Coman, G.J.; Crocos, P.J.; Preston, N.P.; Fielder, D. The effects of density on the growth and survival of different families of juvenile Penaeus japonicus Bate. Aquaculture 2004, 229, 215–223. [Google Scholar] [CrossRef]
- Jerry, D.R.; Preston, N.P.; Crocos, P.J.; Keys, S.; Meadows, J.R.; Li, Y. Application of DNA parentage analyses for determining relative growth rates of Penaeus japonicus families reared in commercial ponds. Aquaculture 2006, 254, 171–181. [Google Scholar] [CrossRef]
- Wang, H.; Zhang, Y.; Wang, L.; Guan, T.; Chang, G.; Wu, N.; Li, J. Heritability Estimates of Growth-Related Traits in Oriental River Prawns, Macrobrachium nipponense. Aquac. Res. 2023, 2023, 8315364. [Google Scholar] [CrossRef]
- Sui, J.; Luan, S.; Yang, G.; Xia, Z.; Tang, Q.; Luo, K.; Meng, X.; Kong, J. Effects of the individual rearing stage on the growth traits of candidate giant freshwater prawns (Macrobrachium rosenbergii). Aquac. Int. 2022, 30, 1659–1673. [Google Scholar] [CrossRef]
- Hedges, L.V.; Olkin, I. Statistical Methods for Meta-Analysis; Academic Press: Orlando, FL, USA, 1985. [Google Scholar]
- Marín-Martínez, F.; Sánchez-Meca, J. Weighting by Inverse Variance or by Sample Size in Random-Effects Meta-Analysis. Educ. Psychol. Meas. 2010, 70, 56–73. [Google Scholar] [CrossRef]
- Hasan, M.M.; Tulloch, R.L.; Thomson, P.C.; Raadsma, H.W.; Khatkar, M.S. Meta-analysis of genetic parameters of production traits in cultured shrimp species. Fish Fish. 2020, 21, 1150–1174. [Google Scholar] [CrossRef]
- Lenth, R.; Singmann, H.; Love, J.; Buerkner, P.; Herve, M. Emmeans: Estimated marginal means, aka least-squares means. (R package version 1.3), 2018.
- R Core Team. R: A Language and Environment for Statistical Computing; R Foundation for Statistical Computing: Vienna, Austria, 2021. [Google Scholar]
- Dupont-Nivet, M.; Karahan-Nomm, B.; Vergnet, A.; Merdy, O.; Haffray, P.; Chavanne, H.; Chatain, B.; Vandeputte, M. Genotype by environment interactions for growth in European seabass (Dicentrarchus labrax) are large when growth rate rather than weight is considered. Aquaculture 2010, 306, 365–368. [Google Scholar] [CrossRef]
- Trọng, T.Q.; Mulder, H.A.; van Arendonk, J.A.; Komen, H. Heritability and genotype by environment interaction estimates for harvest weight, growth rate, and shape of Nile tilapia (Oreochromis niloticus) grown in river cage and VAC in Vietnam. Aquaculture 2013, 384, 119–127. [Google Scholar] [CrossRef]
- Visscher, P.M.; Hill, W.G.; Wray, N.R. Heritability in the genomics era—Concepts and misconceptions. Nat. Rev. Genet. 2008, 9, 255–266. [Google Scholar] [CrossRef]
- Mousseau, T.A.; Roff, D.A. Natural selection and the heritability of fitness components. Heredity 1987, 59, 181–197. [Google Scholar] [CrossRef]
- Kenkel, C.; Setta, S.; Matz, M.V. Heritable differences in fitness-related traits among populations of the mustard hill coral, Porites astreoides. Heredity 2015, 115, 509–516. [Google Scholar] [CrossRef] [PubMed]
- Rye, M.; Lillevik, K.M.; Gjerde, B. Survival in early life of Atlantic salmon and rainbow trout: Estimates of heritabilities and genetic correlations. Aquaculture 1990, 89, 209–216. [Google Scholar] [CrossRef]
- Vehviläinen, H.; Kause, A.; Quinton, C.; Koskinen, H.; Paananen, T. Survival of the currently fittest: Genetics of rainbow trout survival across time and space. Genetics 2008, 180, 507–516. [Google Scholar] [CrossRef]
- Glencross, B.; Tabrett, S.; Irvin, S.; Wade, N.; Anderson, M.; Blyth, D.; Smith, D.; Coman, G.; Preston, N. An analysis of the effect of diet and genotype on protein and energy utilization by the black tiger shrimp, Penaeus monodon—Why do genetically selected shrimp grow faster? Aquac. Nutr. 2013, 19, 128–138. [Google Scholar] [CrossRef]
- Mulder, H.; Veerkamp, R.; Ducro, B.; Van Arendonk, J.; Bijma, P. Optimization of dairy cattle breeding programs for different environments with genotype by environment interaction. J. Dairy Sci. 2006, 89, 1740–1752. [Google Scholar] [CrossRef] [PubMed]
- James, J. Selection in two environments. Heredity 1961, 16, 145–152. [Google Scholar] [CrossRef]
- Sonesson, A.K.; Meuwissen, T.H. Testing strategies for genomic selection in aquaculture breeding programs. Genet. Sel. Evol. 2009, 41, 37. [Google Scholar] [CrossRef] [PubMed]
- Ponzoni, R.W.; Nguyen, N.H.; Khaw, H.L.; Ninh, N.H. Accounting for genotype by environment interaction in economic appraisal of genetic improvement programs in common carp Cyprinus carpio. Aquaculture 2008, 285, 47–55. [Google Scholar] [CrossRef]
- Nirea, K.; Meuwissen, T. Improving production efficiency in the presence of genotype by environment interactions in pig genomic selection breeding programmes. J. Anim. Breed. Genet. 2017, 134, 119–128. [Google Scholar] [CrossRef]
- Araus, J.L.; Kefauver, S.C.; Zaman-Allah, M.; Olsen, M.S.; Cairns, J.E. Translating high-throughput phenotyping into genetic gain. Trends Plant Sci. 2018, 23, 451–466. [Google Scholar] [CrossRef]
- Mulder, H.A. Genomic selection improves response to selection in resilience by exploiting genotype by environment interactions. Front. Genet. 2016, 7, 178. [Google Scholar] [CrossRef]
- Chu, T.T.; Alemu, S.W.; Norberg, E.; Sørensen, A.C.; Henshall, J.; Hawken, R.; Jensen, J. Benefits of testing in both bio-secure and production environments in genomic selection breeding programs for commercial broiler chicken. Genet. Sel. Evol. 2018, 50, 52. [Google Scholar] [CrossRef]
- Atlin, G.N.; Cairns, J.E.; Das, B. Rapid breeding and varietal replacement are critical to adaptation of cropping systems in the developing world to climate change. Glob. Food Secur. 2017, 12, 31–37. [Google Scholar] [CrossRef]
- Iung, L.H.d.S.; Carvalheiro, R.; Neves, H.H.d.R.; Mulder, H.A. Genetics and genomics of uniformity and resilience in livestock and aquaculture species: A review. J. Anim. Breed. Genet. 2020, 137, 263–280. [Google Scholar] [CrossRef] [PubMed]
- Khiem, N.M.; Takahashi, Y.; Oanh, D.T.H.; Hai, T.N.; Yasuma, H.; Kimura, N. The use of machine learning to predict acute hepatopancreatic necrosis disease (AHPND) in shrimp farmed on the east coast of the Mekong Delta of Vietnam. Fish. Sci. 2020, 86, 673–683. [Google Scholar] [CrossRef]
- Gillberg, J.; Marttinen, P.; Mamitsuka, H.; Kaski, S. Modelling G × E with historical weather information improves genomic prediction in new environments. Bioinformatics 2019, 35, 4045–4052. [Google Scholar] [CrossRef]
- Singh, R.P.; Hodson, D.P.; Jin, Y.; Huerta-Espino, J.; Kinyua, M.G.; Wanyera, R.; Njau, P.; Ward, R.W. Current status, likely migration and strategies to mitigate the threat to wheat production from rzace Ug99 (TTKS) of stem rust pathogen. CABI Rev. Perspect. Agric. Vet. Sci. Nutr. Nat. Resour. 2007, 1, 054. [Google Scholar] [CrossRef]
- Rana, M.; Rahman, A.; Hugo, D.; McCulloch, J.; Hellicar, A. Investigating data-driven approaches to understand the interaction between water quality and physiological response of sentinel oysters in natural environment. Comput. Electron. Agric. 2020, 175, 105545. [Google Scholar] [CrossRef]
- Xu, Y. Envirotyping for deciphering environmental impacts on crop plants. Theor. Appl. Genet. 2016, 129, 653–673. [Google Scholar] [CrossRef] [PubMed]
- Rahman, A.; Dabrowski, J.; McCulloch, J. Dissolved oxygen prediction in prawn ponds from a group of one step predictors. Inf. Process. Agric. 2020, 7, 307–317. [Google Scholar] [CrossRef]
- Kong, Z.; Kong, J.; Hao, D.; Lu, X.; Jian, T.; Meng, X.; Luo, K.; Cao, B.; Sui, J.; Li, X. Reducing the Common Environmental Effect on Litopenaeus vannamei Body Weight by Rearing Communally at Early Developmental Stages and Using a Reconstructed Pedigree. J. Ocean Univ. China 2020, 19, 923–930. [Google Scholar] [CrossRef]

| Species | Publication Year | Country | Traits | Environment | References |
|---|---|---|---|---|---|
| P. vannamei | 2002 | USA | Growth | Pond vs. tank | Argue, Arce [24] |
| P. vannamei | 2003 | Mexico | Growth | Tank A vs. B | Pérez-Rostro and Ibarra [25] |
| P. vannamei | 2003 | Mexico | Growth | Environment 1 vs. Environment 2 | Pérez-Rostro and Ibarra [26] |
| P. vannamei | 2004 | Mexico | Biochemical compounds (e.g., protein, lactate, carbohydrate) | Normoxic vs. hypoxic condition | Pérez-Rostro, Racotta [27] |
| P. vannamei | 2005 | Colombia | Growth, survival | Pathogenic stress | Gitterle, Salte [28] |
| P. vannamei | 2005 | Colombia | Growth, survival | Pond vs. tank | Gitterle, Rye [29] |
| P. vannamei | 2006 | Colombia | Survival | Pathogenic stress | Gitterle, Ødegård [30] |
| P. vannamei | 2006 | Colombia | Survival | Pathogenic stress | Gitterle, Gjerde [31] |
| P. vannamei | 2007 | Mexico | Growth | Stocking density | Castillo-Juárez, Casares [32] |
| P. vannamei | 2008 | Mexico | Growth | Stocking density | Ibarra and Famula [33] |
| P. vannamei | 2009 | Mexico | Growth | Environment 1 vs. Environment 2 | Campos-Montes, Montaldo [34] |
| P. vannamei | 2013 | USA | Survival | Pathogen A vs. B | Moss, Moss [35] |
| P. vannamei | 2015 | China | Growth, survival | Temperature | Li, Luan [36] |
| P. vannamei | 2015 | China | Growth | Stocking density | Luan, Wang [37] |
| P. vannamei | 2015 | Mexico | Growth, survival | Ponds | Caballero-Zamora, Montaldo [38] |
| P. vannamei | 2016 | China | Growth | Farms | Sui, Luan [39] |
| P. vannamei | 2017 | China | Growth, survival | Salinity levels | Lu, Luan [40] |
| P. vannamei | 2017 | China | Growth, survival | Stocking density | Tan, Luan [41] |
| P. vannamei | 2019 | China | Feed efficiency | Stocking density | Dai, Kong [42] |
| P. vannamei | 2019 | Vietnam | Growth, body color | Environments | Giang, Knibb [43] |
| P. vannamei | 2020 | Vietnam | Growth | Pond vs. tank | Nguyen, Ninh [44] |
| P. vannamei | 2021 | Mexico | Growth, survival | Pathogenic stress | Cala-Moreno, Campos-Montes [45] |
| P. monodon | 2010 | India | Survival | Tanks | Hayes, Gitterle [46] |
| P. monodon | 2011 | India | Growth, survival | Ponds | Krishna, Gopikrishna [47] |
| P. monodon | 2020 | Australia | Growth, survival | Pathogenic stress | Noble, Coman [48] |
| P. monodon | 2020 | Vietnam | Growth, survival | Recirculating system vs. ponds | Van Sang, Luan [7] |
| P. monodon | 2021 | China | Growth, survival | Diets | Jiang, Mo [49] |
| P. monodon | 2022 | Australia | Growth | Ponds | Hasan, Thomson [50] |
| P. japonicus | 2002 | Australia | Growth, survival | Temperature | Coman, Crocos [51] |
| P. japonicus | 2004 | Australia | Growth, survival | Stocking density | Coman, Crocos [52] |
| P. japonicus | 2006 | Australia | Growth | Ponds | Jerry, Preston [53] |
| M. rosenbergii | 2013 | China | Growth, survival | Ponds | Luan, Wang [37] |
| Trait | Definition |
|---|---|
| Growth | Body weight, growth rate, average daily gain (ADG), body length. |
| Survival | Overall (end of the culture period) or in a challenge test. |
| Other traits | Body composition, protein, lipid, carbohydrate content, body color, feed efficiency ratio (FER). |
| Environment | |
| Habitat | Pond vs. pond (location), pond vs. tank or cage. |
| Stress | Salinity, ammonia concentration, temperature, density (high vs. low), pathogens. |
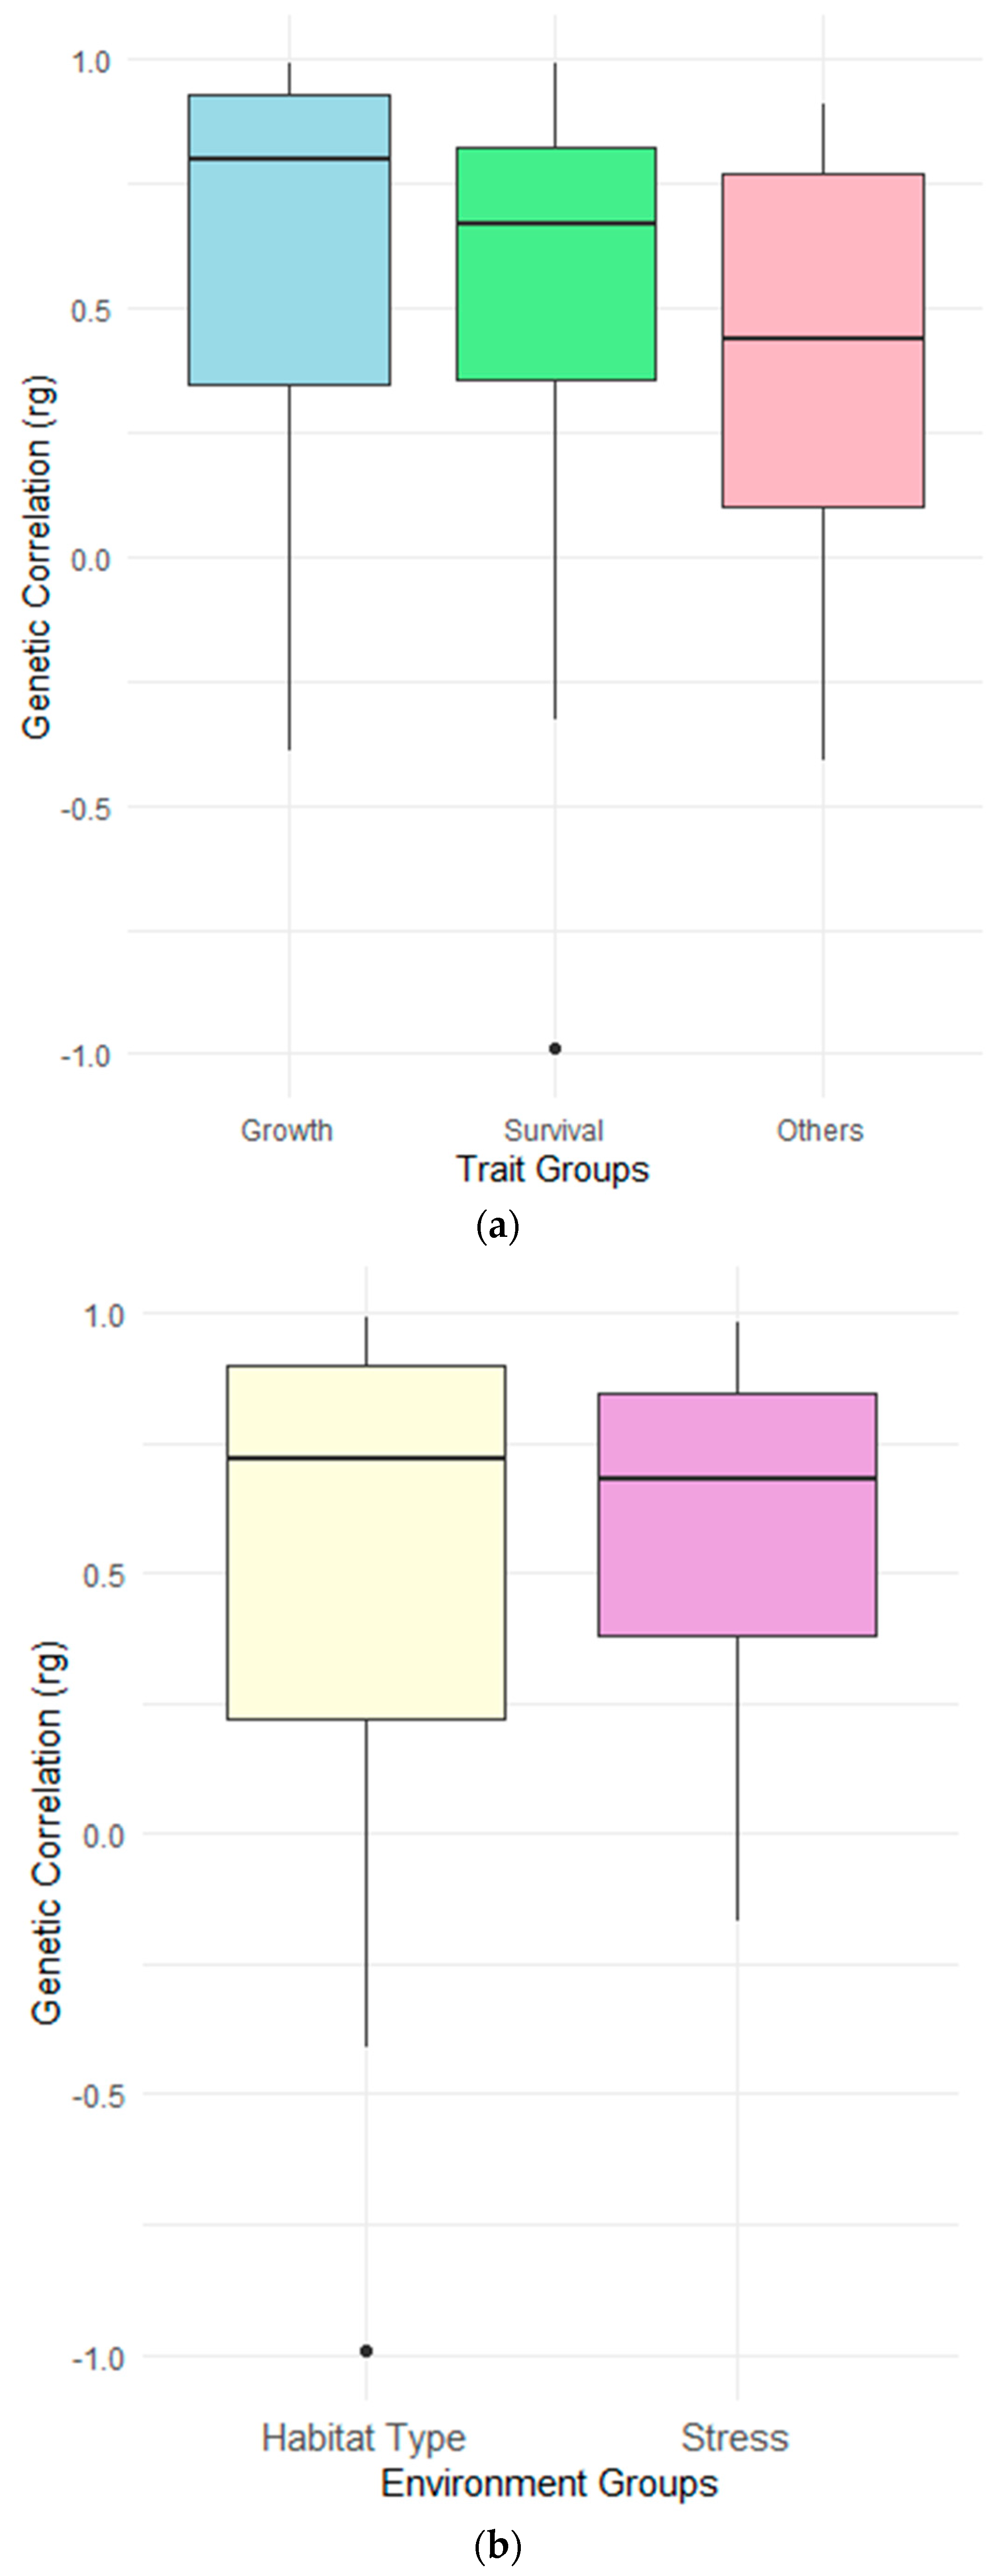
| (a) | ||
| Trait group | Meta Genetic Correlation | Group differences |
| Growth | 0.72 ± 0.05 | * |
| Survival | 0.58 ± 0.07 | * |
| Other traits | 0.48 ± 0.27 | * |
| (b) | ||
| Environments | Meta Genetic Correlation | Group differences |
| Habitat type | 0.65 ± 0.07 | NS |
| Stress | 0.67 ± 0.08 | NS |
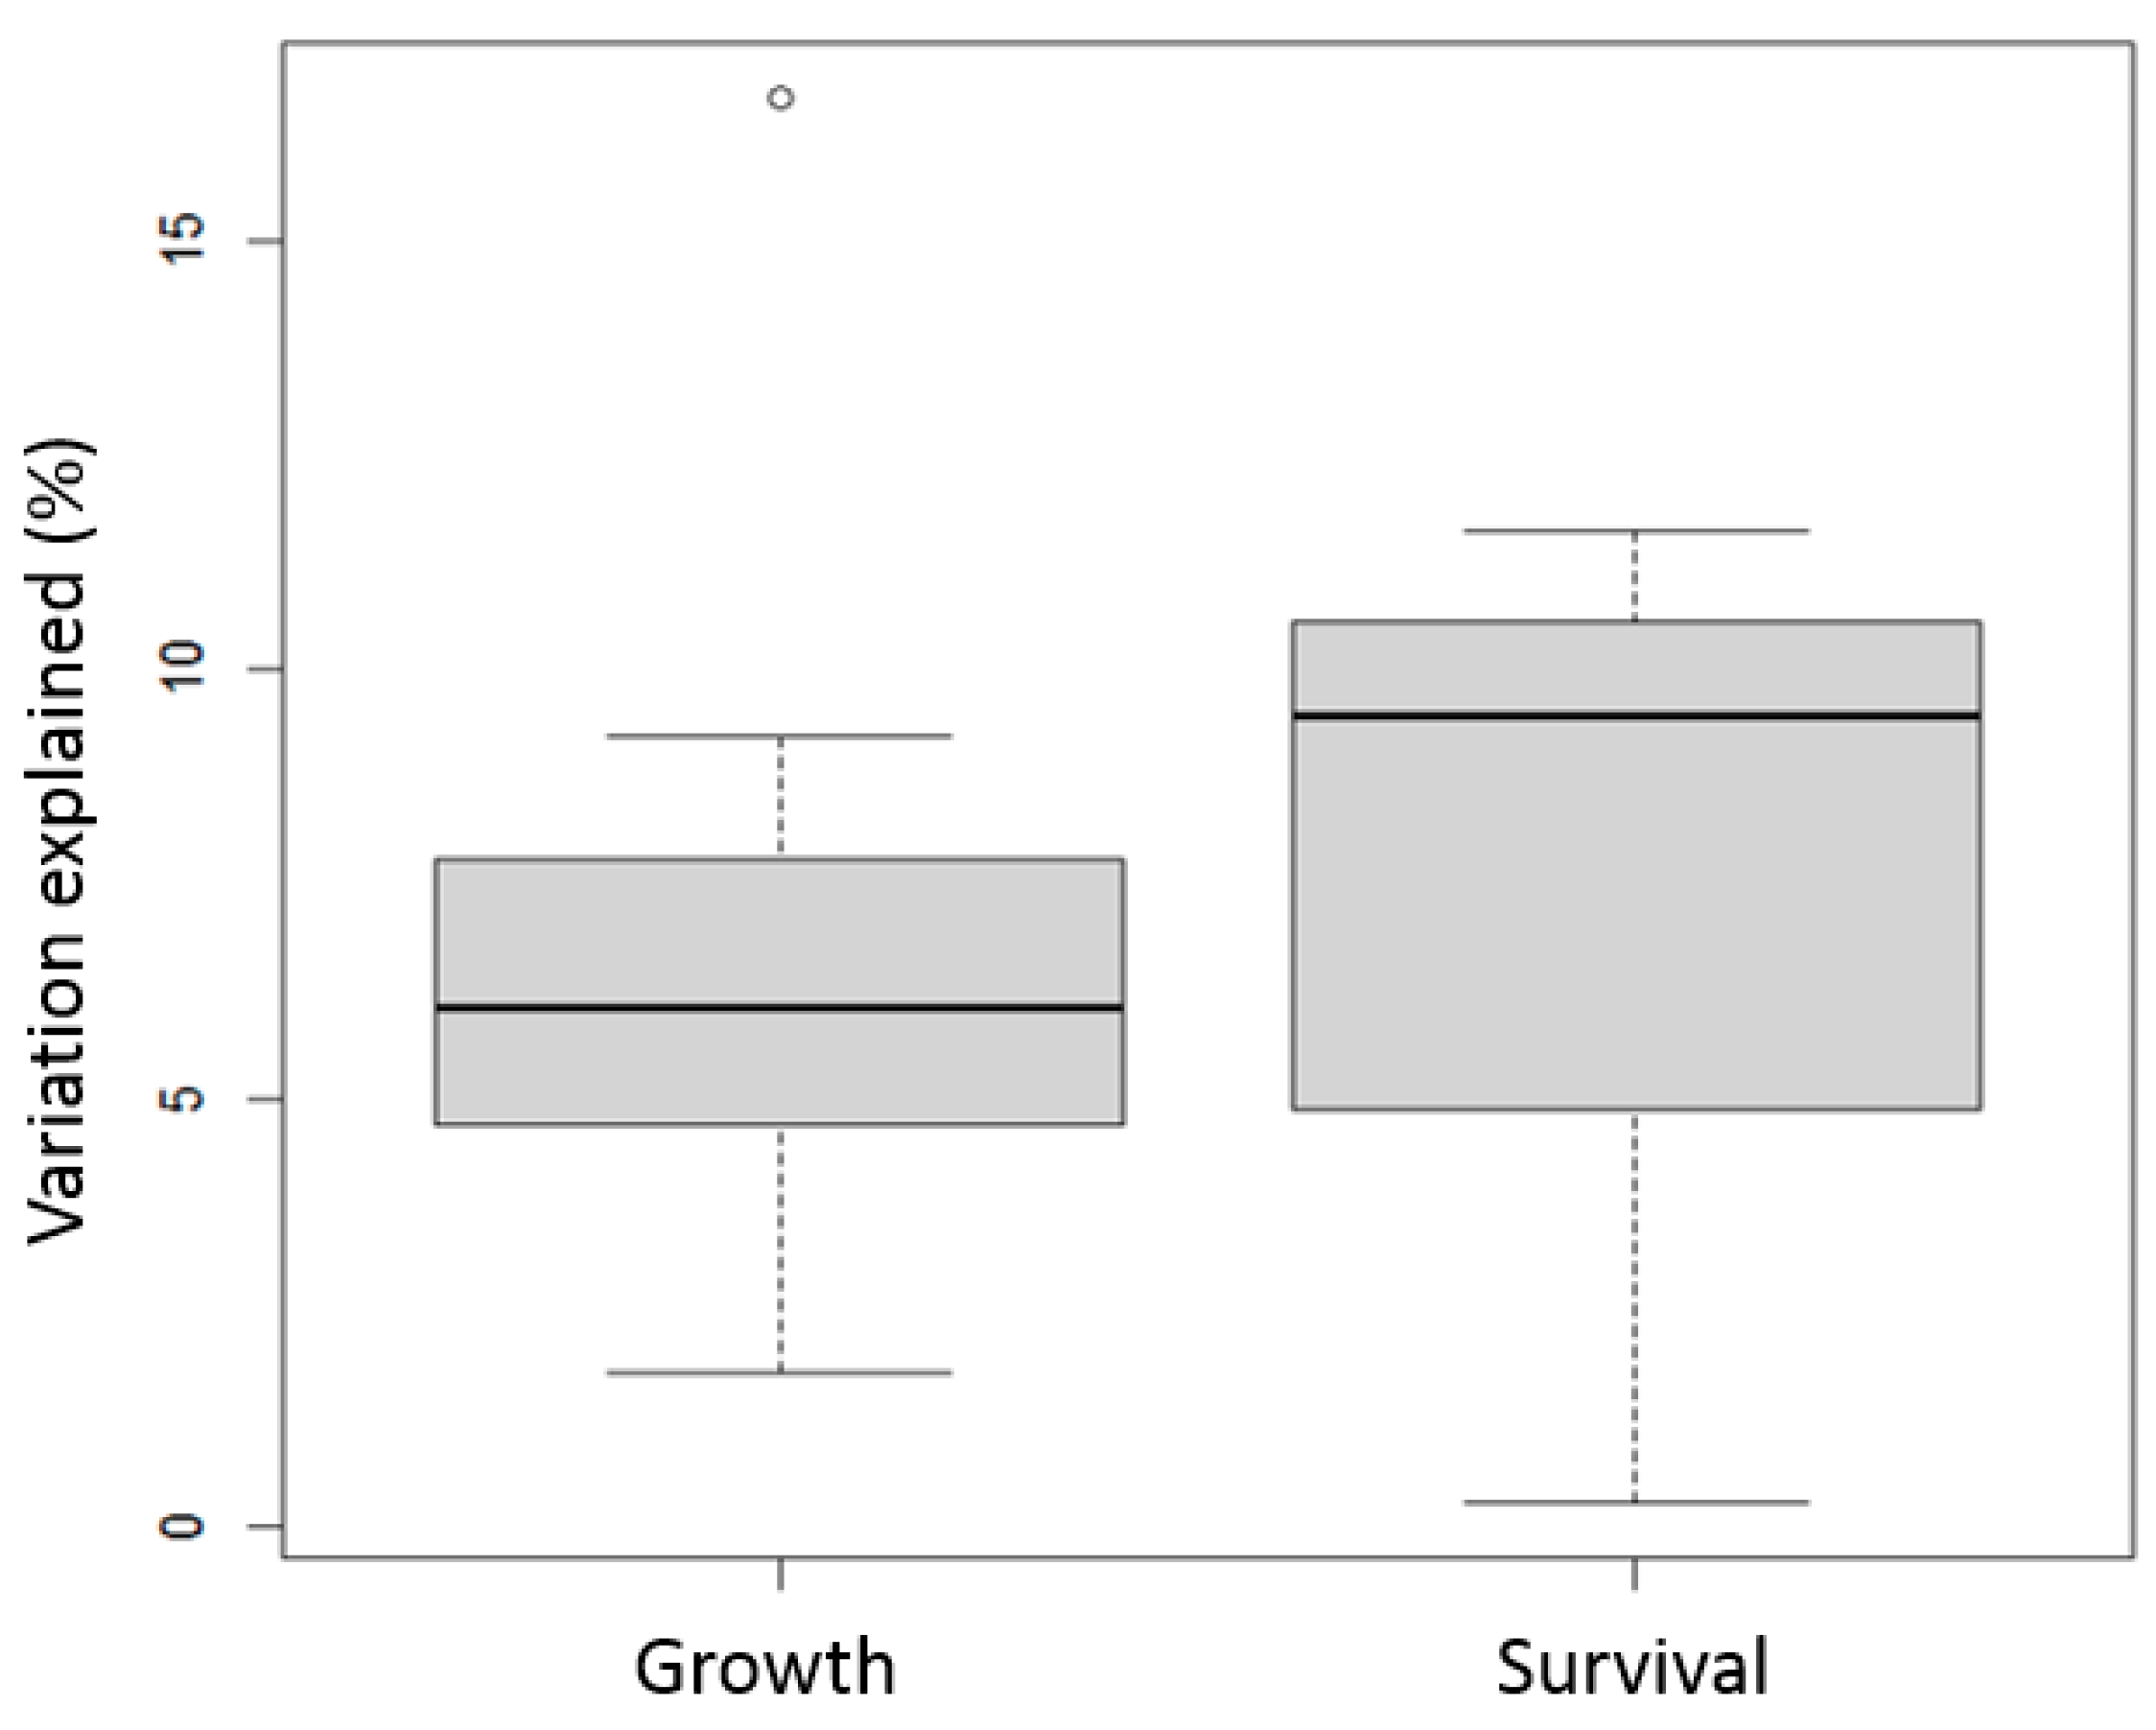
| Traits | Environment | Source of Variation (or G×E) | Variation Explained by G×E (%) | Reference |
|---|---|---|---|---|
| Survival | Density | Density∗Family | 0.3 | Coman, Crocos [52] |
| Growth | Density | Density∗Family | 1.95 | Coman, Crocos [52] |
| Growth | Hypoxic condition | Habitat∗Family | 7.78 | Pérez-Rostro, Racotta [27] |
| Growth | Hypoxic condition | Habitat∗Family | 9.23 | Pérez-Rostro, Racotta [27] |
| Growth | Hypoxic condition | Habitat∗Family | 16.65 | Pérez-Rostro, Racotta [27] |
| Growth | Hypoxic condition | Habitat∗Family | 6.06 | Pérez-Rostro, Racotta [27] |
| Growth | Hypoxic condition | Habitat∗Family | 4.98 | Pérez-Rostro, Racotta [27] |
| Growth | Hypoxic condition | Habitat∗Family | 7.03 | Pérez-Rostro, Racotta [27] |
| Growth | Hypoxic condition | Habitat∗Family | 4.7 | Pérez-Rostro, Racotta [27] |
| Growth | Temperature | Temperature∗Family | 4.68 | Coman, Crocos [51] |
| Growth | Temperature | Temperature∗Family | 3.74 | Coman, Crocos [51] |
| Survival | Temperature | Temperature∗Family | 11.63 | Coman, Crocos [51] |
| Survival | Temperature | Temperature∗Family | 9.46 | Coman, Crocos [51] |
| Growth | Temperature | Temperature∗Family | 6.93 | Coman, Crocos [51] |
| Growth | Temperature | Temperature∗Family | 7.96 | Coman, Crocos [51] |
| Growth | Habitat | Habitat∗Family | 1.8 | Argue, Arce [24] |
Disclaimer/Publisher’s Note: The statements, opinions and data contained in all publications are solely those of the individual author(s) and contributor(s) and not of MDPI and/or the editor(s). MDPI and/or the editor(s) disclaim responsibility for any injury to people or property resulting from any ideas, methods, instructions or products referred to in the content. |
© 2024 by the authors. Licensee MDPI, Basel, Switzerland. This article is an open access article distributed under the terms and conditions of the Creative Commons Attribution (CC BY) license (https://creativecommons.org/licenses/by/4.0/).
Share and Cite
Hasan, M.M.; Thomson, P.C.; Raadsma, H.W.; Khatkar, M.S. A Review and Meta-Analysis of Genotype by Environment Interaction in Commercial Shrimp Breeding. Genes 2024, 15, 1222. https://doi.org/10.3390/genes15091222
Hasan MM, Thomson PC, Raadsma HW, Khatkar MS. A Review and Meta-Analysis of Genotype by Environment Interaction in Commercial Shrimp Breeding. Genes. 2024; 15(9):1222. https://doi.org/10.3390/genes15091222
Chicago/Turabian StyleHasan, Md. Mehedi, Peter C. Thomson, Herman W. Raadsma, and Mehar S. Khatkar. 2024. "A Review and Meta-Analysis of Genotype by Environment Interaction in Commercial Shrimp Breeding" Genes 15, no. 9: 1222. https://doi.org/10.3390/genes15091222
APA StyleHasan, M. M., Thomson, P. C., Raadsma, H. W., & Khatkar, M. S. (2024). A Review and Meta-Analysis of Genotype by Environment Interaction in Commercial Shrimp Breeding. Genes, 15(9), 1222. https://doi.org/10.3390/genes15091222