Article

Complete Mitochondrial Genome of King Threadfin, Polydactylus macrochir (Günther, 1867): Genome Characterization and Phylogenetic Analysis

1
Key Laboratory of South China Sea Fishery Resources Exploitation and Utilization, Ministry of Agriculture and Rural Affairs, South China Sea Fisheries Research Institute, Chinese Academy of Fishery Sciences, Guangzhou 510300, China
2
Hainan Engineering Research Center for Deep-Sea Aquaculture and Processing, Sanya 572018, China
Genes 2025, 16(1), 88; https://doi.org/10.3390/genes16010088
Submission received: 11 December 2024 / Revised: 9 January 2025 / Accepted: 13 January 2025 / Published: 15 January 2025

Abstract

:
Background: Polydactylus macrochir (Günther; 1867) is a member of the family Polynemidae. The placement of Polynemidae among teleosts has varied over the years. Methods: Therefore, in this study, we sequenced the complete mitochondrial genome of P. macrochir, analyzed the characterization of the mitochondrial genome, and investigated the phylogenetic relationships of Polynemidae. Results: The length of the P. macrochir mitogenome was 16,738 bp, with a typical order. Nucleotide composition analysis showed that the P. macrochir mitogenome was AT-biased (54.15%), and the PCGs tended to use A and C rather than T and G at the third codon. All the PCGs started with the regular codon ATG, except for cox1, which started with GTG. The termination codon varied across the PCGs. It was shown that the ka/ks ratios of all the PCGs were less than one. Phylogenetic analysis, based on the maximum likelihood (ML) and Bayesian inference (BI) methods, indicated that eight threadfins formed a well-supported monophyletic cluster. Polynemidae and Sphyraenidae clustered together as a monophyletic group. According to TimeTree analyses, the most recent common ancestor (MRCA) of Polynemidae was traced back to about 52.81 million years ago (MYA), while six species within Polynemidae diverged from 11.70 MYA to 20.05 MYA. Conclusions: The present study provides valuable mitochondrial information for the classification of P. macrochir and new insights into the phylogenetic relationships of Polynemidae.

1. Introduction

Threadfins, specially the Polydactylus genus species, are easily identified due to their numerous, elongated, and threadlike pectoral fin rays [1]. These filamentous fin rays are necessary for threadfins inhabiting the sandy or muddy bottoms of turbid shallow waters to detect food, with both tactile and gustatory functions [2]. Threadfins belong to the family Polynemidae, which includes eight genera and 42 extant species [3]. The conservation management of Polynemidae is becoming increasingly vital for their commercial significance, with Eleutheronema tetradactylum (Shaw 1804) successfully adapted to the aquaculture industry [4,5], and some freshwater species to the aquarium trade [1].
Phylogenetic inference provides valuable insights into the origin and divergence history of morphological traits, taxonomic identification, and resource management and conservation. In recent years, the placement of Polynemidae among teleosts has varied according to different studies. Polynemidae had been previously considered related to Mugilidae, Sphyraenidae, Atherinidae, and Phallostethoidei and clustered into Mugiliformes [6]. A later study insisted that Polynemidae, Mugilidae, and Sphyraenidae should remain within the Perciformes [7]. The previous studies proposed that Polynemidae and Sciaenidae were sister groups [8,9,10], or aligned polynemids with Menidae [11], Menidae + Lactariidae [12], or Pleuronectiformes, respectively [13,14]. A study grouped Polynemidae with Menidae as the sister group of Sphyraenidae [15]. The recent study placed Polynemidae in the Order Polynemiformes [16]. As mentioned above, these different studies have advanced alternative hypotheses of the relationships for the family Polynemidae, but a consensual phylogenetic position is still lacking.
The mitochondrial genome, typically spanning 16–17k bp, generally consists of thirteen protein-coding genes, two ribosomal RNAs (rRNAs), twenty-two transfer RNAs (tRNAs), and two noncoding regions: the control region (CR) and the origin of L-strand replication (OL) [17]. Notably, mitochondrial DNA evolves at a faster rate and exhibits a remarkable degree of conservation in gene organization and a low recombination level [18]. In addition, the complete mitogenome has an advantage in providing comprehensive information when used for evolutionary analysis compared with a partial mitogenome gene. Thus, the complete mitogenome is used widely to study the phylogenetic relationships and species classification among teleosts [19,20,21]. To determine the precise phylogenetic inference of Polynemidae, there must be enough mitogenomic data. However, at present, there is a limited number of complete mitogenomes of Polynemidae species in the NCBI genebank.
Reconstructing the phylogenetic relationships between Polynemidae and its closely related species could help to infer the characteristics of their ancestors and follow the changing character states, which is important for the further exploration and utilization of threadfin germplasm resources. Polydactylus macrochir (Günther, 1867) is a large food and game fish which belongs to the family Polynemidae and is also named king threadfin. In this study, we sequenced the mitochondrial genome of P. macrochir and conducted genome characterization and phylogenetic analysis. This study will provide new insights regarding the classification of threadfins and will be helpful to resolve uncertainties of the phylogenetic position of Polynemidae.

2. Materials and Methods

2.1. Samples, DNA Extraction and Sequencing

One specimen of P. macrochir was purchased from the Fangchenggang local market, Guangxi, China. Muscle tissue was extracted and kept at 4 °C in a 2 mL centrifuge tube with 70% ethanol, a part of which was sent to Genepioneer Biotechnologies (Nanjing, China) for sequencing. Total genomic DNA was extracted using the MagPure Tissue DNA LQ Kit (Magen Biotechnology, Guangzhou, China). DNA purity was detected with 1.0% agarose gel. After that, the qualified library was sequenced using the Illumina Novaseq platform (San Diego, CA, USA), and the paired-end sequencing (PE) read length was 150 bp.

2.2. Genome Assembly and Annotation

fastp (v0.20.0, https://github.com/OpenGene/fastp, accessed on 20 October 2024) software was used to filter the original data and obtained clean data. To reduce the complexity of subsequent sequence assembly, the software bowtie2 v2.2.4 (http://bowtie-bio.sourceforge.net/bowtie2/index.shtml, accessed on 20 October 2024) was used to study the mitochondrial genome database built by the company, and the compared sequences were regarded as the mitochondrial genome sequences of the project samples. Then, the mt DNA sequence was assembled by SPAdes v3.10.1 software to obtain the seed sequence of the mitochondrial genome [22]. For a kmer iterative extend seed, if the result was a contig, the result was determined as a pseudo genome sequence. The sequence was aligned to a pseudo genome for genome correction. Annotations of the mitochondrial genome were performed in the Mitos2 web server [23] (parameters: E-value exponent = 5, maximum overlap = 100, ncRNA overlap = 100). The Mitos2 annotation results were compared with closely related species, and the final annotation results were obtained after manual correction. Mitochondrial gene structure maps were drawn using OGDRAW (https://chlorobox.mpimp-golm.mpg.de/OGDraw.html, accessed on 21 October 2024).

2.3. Codon Usage Analysis

Relative synonymous codon usage (RSCU) is thought to result from a combination of natural selection, mutation, and genetic drift; the numerical value is the ratio of the actual frequency of codon usage to the theoretical frequency of codon usage. A script wrote in Perl was used to filterUniq CDS (choose one of multiple copies of CDS) and perform the calculations.

2.4. Ka/Ks Value Analyses

To understand natural selection pressure in the evolution of the family Polynemidae, the homologous protein sequences between P. macrochir and other threadfins were obtained using BLASTN. Then, the shared protein-coding genes were aligned using MAFFT v7.427 [24]. The nonsynonymous (Ka) and synonymous (Ks) ratios (Ka/Ks) were calculated using KaKs_Calculator v2.0 [25].

2.5. Phylogenetic Analysis TimeTree Estimation

The mitochondrial genomes of 22 species were downloaded from GenBank (Table 1). The shared CDS was aligned using the MAFFT procedure. Maximum likelihood (ML): A maximum likelihood (ML) phylogenetic tree was conducted using RAxML v8.2.10 (https://cme.h-its.org/exelixis/software.html, accessed on 22 October 2024) (GTRGAMMA model) estimation with 1000 bootstrap replications. Bayesian inference (BI): The optimal nucleotide substitution model was calculated using jModelTestv2.1.10 (https://github.com/ddarriba/jmodeltest2, accessed on 22 October 2024), and then MrBayes v3.2.7a (http://nbisweden.github.io/MrBayes/, accessed on 22 October 2024) was used to establish a Bayesian inference (BI) phylogenetic tree; the parameters of MrBayes v3.2.7 software are based on the jModelTest v2.1.10 results. After inputting the sequence data, the constructed Bayesian inference topology (nwk format) was used as a baseline tree. Fossil records acquired from the TimeTree website (http://www.timetree.org, accessed on 24 October 2024) were used to calibrate the divergence times. We estimated the divergence times using PAML mcmctree (http://abacus.gene.ucl.ac.uk/software/paml.html, accessed on 24 October 2024).

3. Results

3.1. Mitogenomic Structure and Organization

In the present study, the mitogenome of P. macrochir (GenBank Accession No. PQ675801) was determined, with a total length of 16,738 bp. The complete length of the P. macrochir mitogenome is similar to those of the other sequenced Polynemidae species. It comprised thirteen protein-coding genes (PCGs), twenty-two transfer RNA genes (tRNAs), two ribosomal RNA genes (rRNAs), and one noncoding region (D-loop) (Figure 1). NAD6 and eight tRNAs (trnQ, trnA, trnN, trnC, trnY, trnS2, trnE, and trnP) were located on the light (L) strand, while the remaining genes including twelve PCGs, two rRNAs, and fourteen tRNAs, were encoded by the heavy (H) strand. The P. macrochir mitogenome had six overlapping regions, with the longest overlapping region (10) detected between the atp6 and cox3 genes (Table 2). Nucleotide composition analysis showed that the P. macrochir mitogenome was AT-biased (54.15%). The PCGs, tRNAs, and rRNAs exhibited an AT content similar to that of the total mitogenomes. CR had the highest A + T content. All the AT skews in the mitogenome, tRNAs, rRNAs, and Dloop were positive, while the AT skew of the PCGs was negative. The GC skews of the mitogenome, PCGs, rRNAs, and Dloop were negative, while the GC skew of the tRNAs was positive. In addition, the GC skews for the complete mitogenomes and the PCGs were strongly negative, with values of −0.286 and −0.329, respectively (Table 3).

3.2. Protein-Coding Genes and Codon Usage

The total length of P. macrochir PCGs was 11,447 bp, accounting for 68.39% of the whole mitogenome. The largest PCG was nad5, with a length of 1839 bp, and the shortest PCG was atp8, with a length of 1839 bp. All the PCGs started with the regular codon ATG, except for cox1, which started with GTG. The termination codon varied across the PCGs. nad6 terminated with the TAG stop codon. nad2 terminated with the incomplete stop codon TA. cox2, nad3, and nad4 used an incomplete T stop codon. The other PCGs shared the same complete stop codon TAA (Table 2).
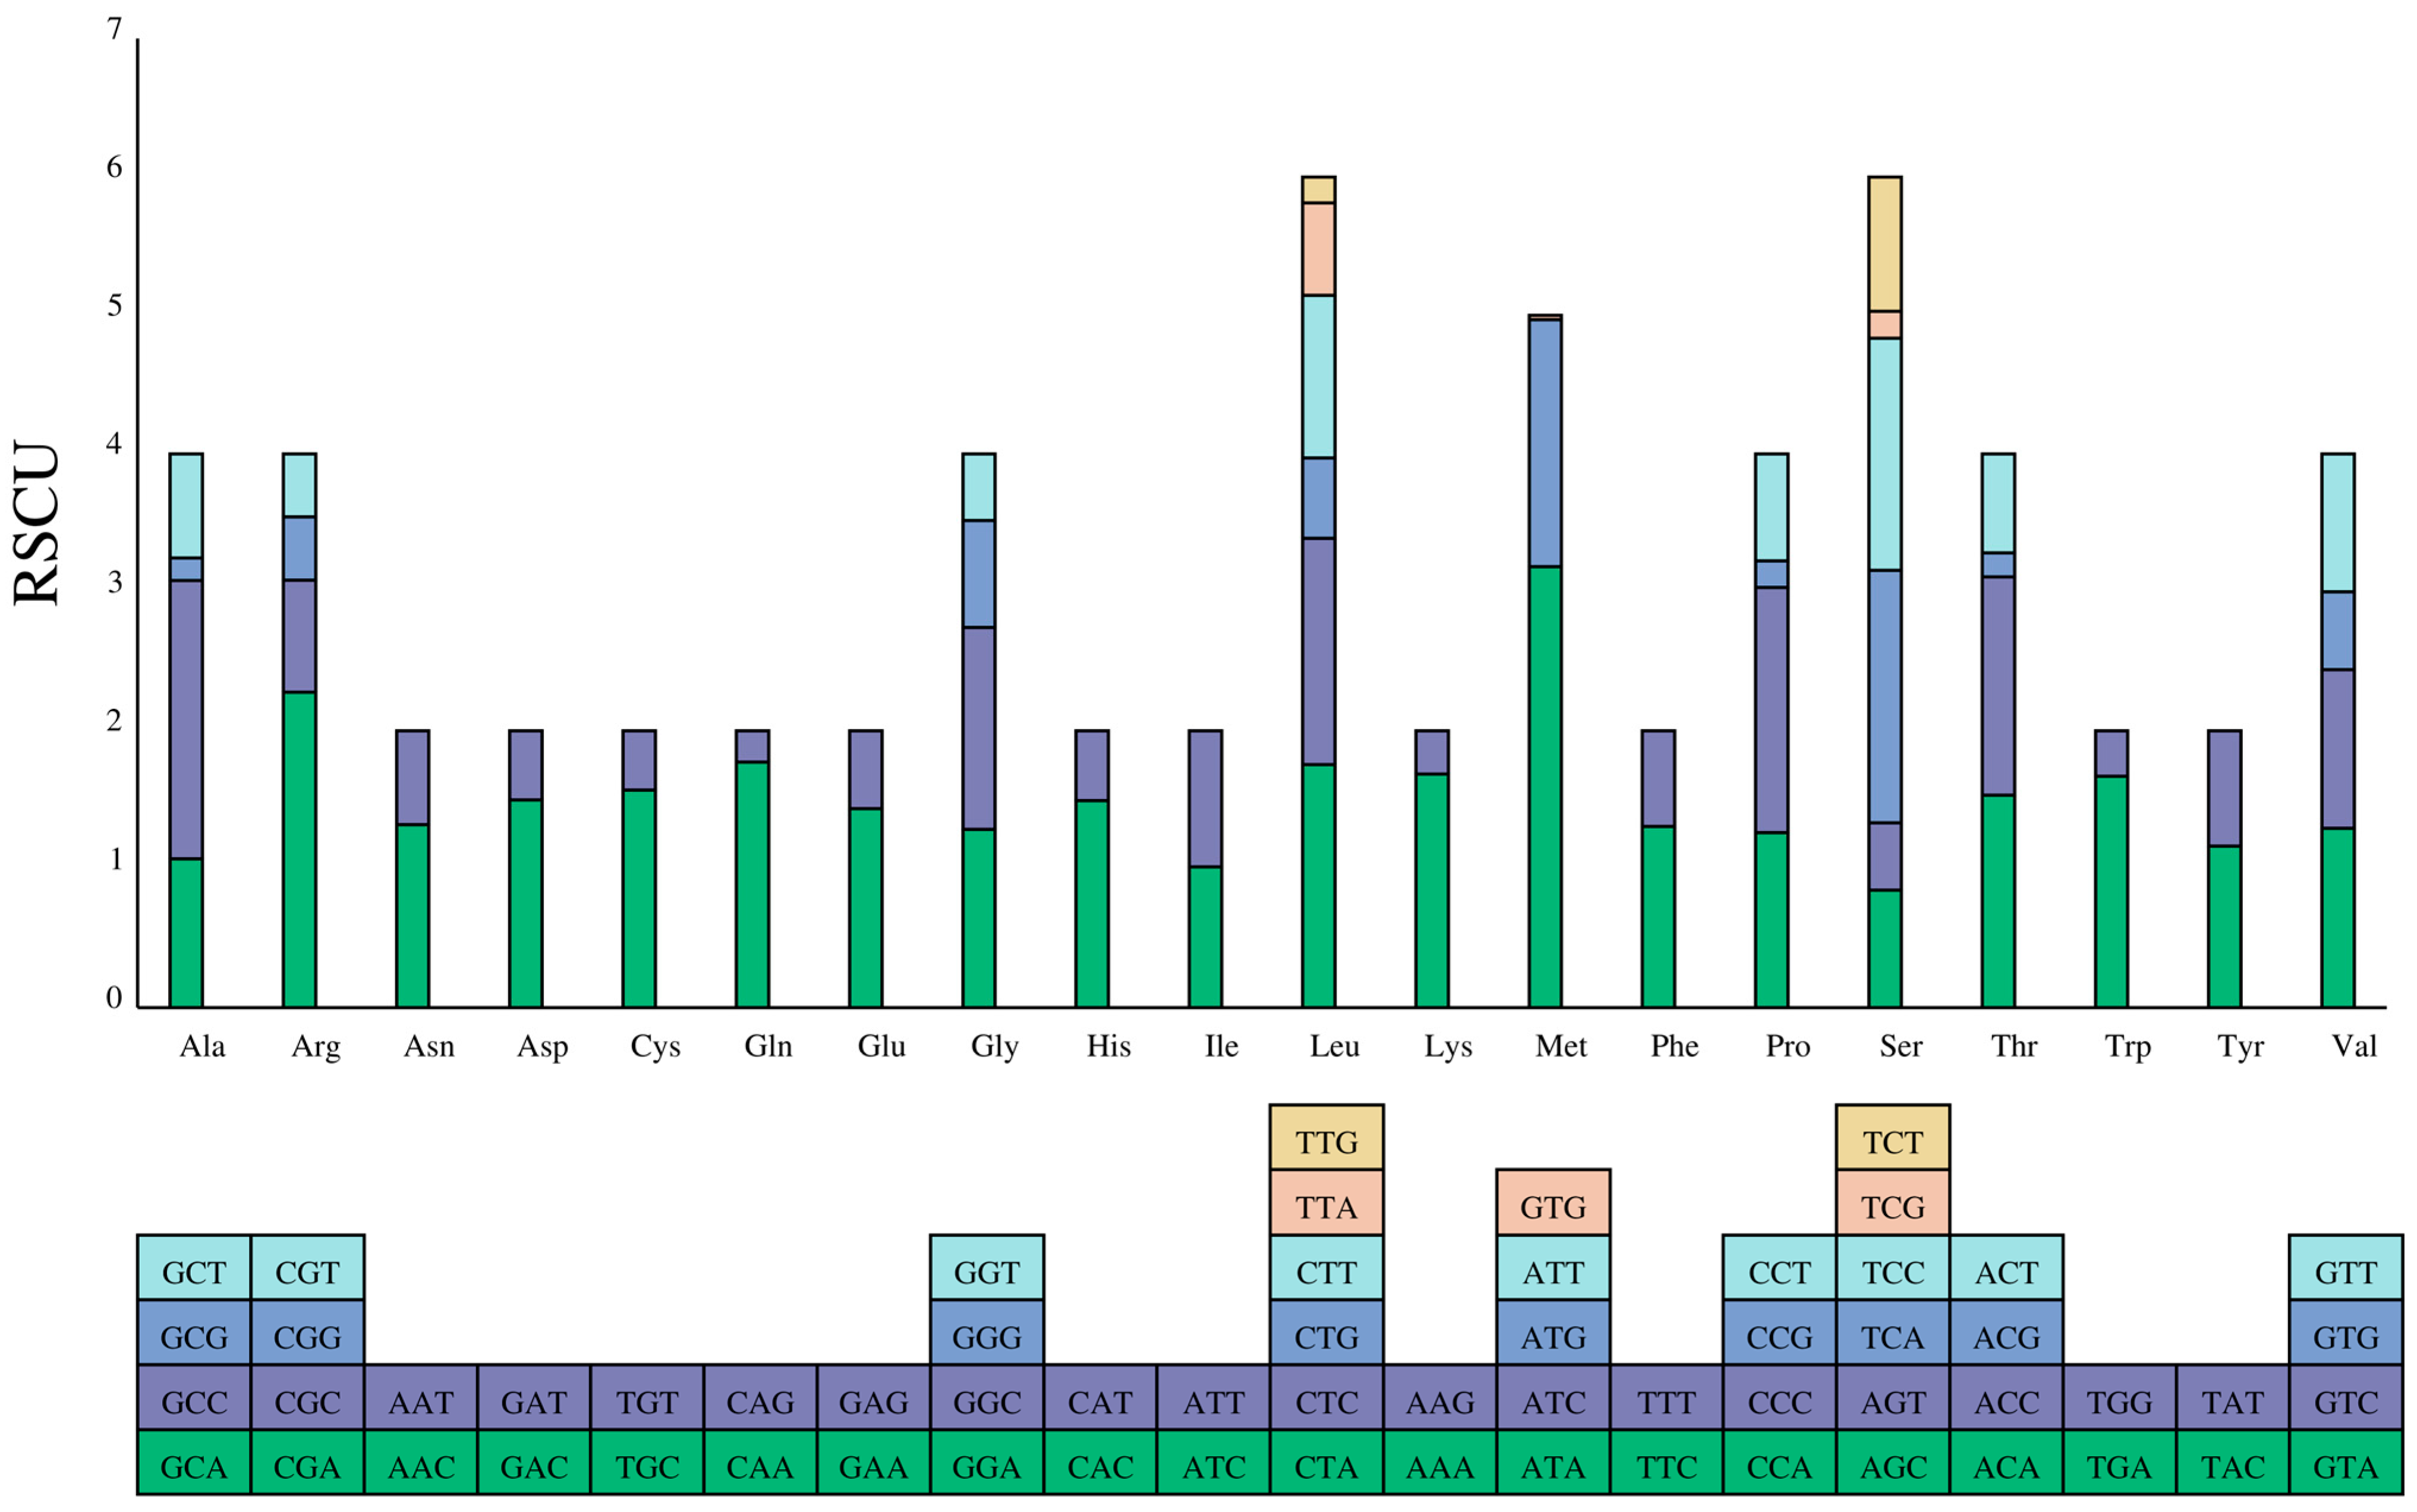
The relative synonymous codon usage (RSCU) values of the PCGs are revealed in Figure 2. There were 30 codons with RSCU  >  1 (Supplementary Materials). The number of codons ending with the A base was fourteen, with one codon ending with U. Similarly, there were fourteen codons ending with C and one codon ending with G. The results also showed that serine and leucine were encoded by six codons with greater codon abundance compared to the other amino acids.

3.3. Ka/Ks Value Analyses

To evaluate the selective pressures of the PCGs, we detected nonsynonymous (Ka) and synonymous (Ks) substitution rates. It was shown that the ka/ks ratios of all the PCGs were less than one. The Ka/Ks ratio was the lowest in cox1 (Figure 3, Supplementary Materials).

3.4. Phylogenetic Analysis and TimeTree Estimation

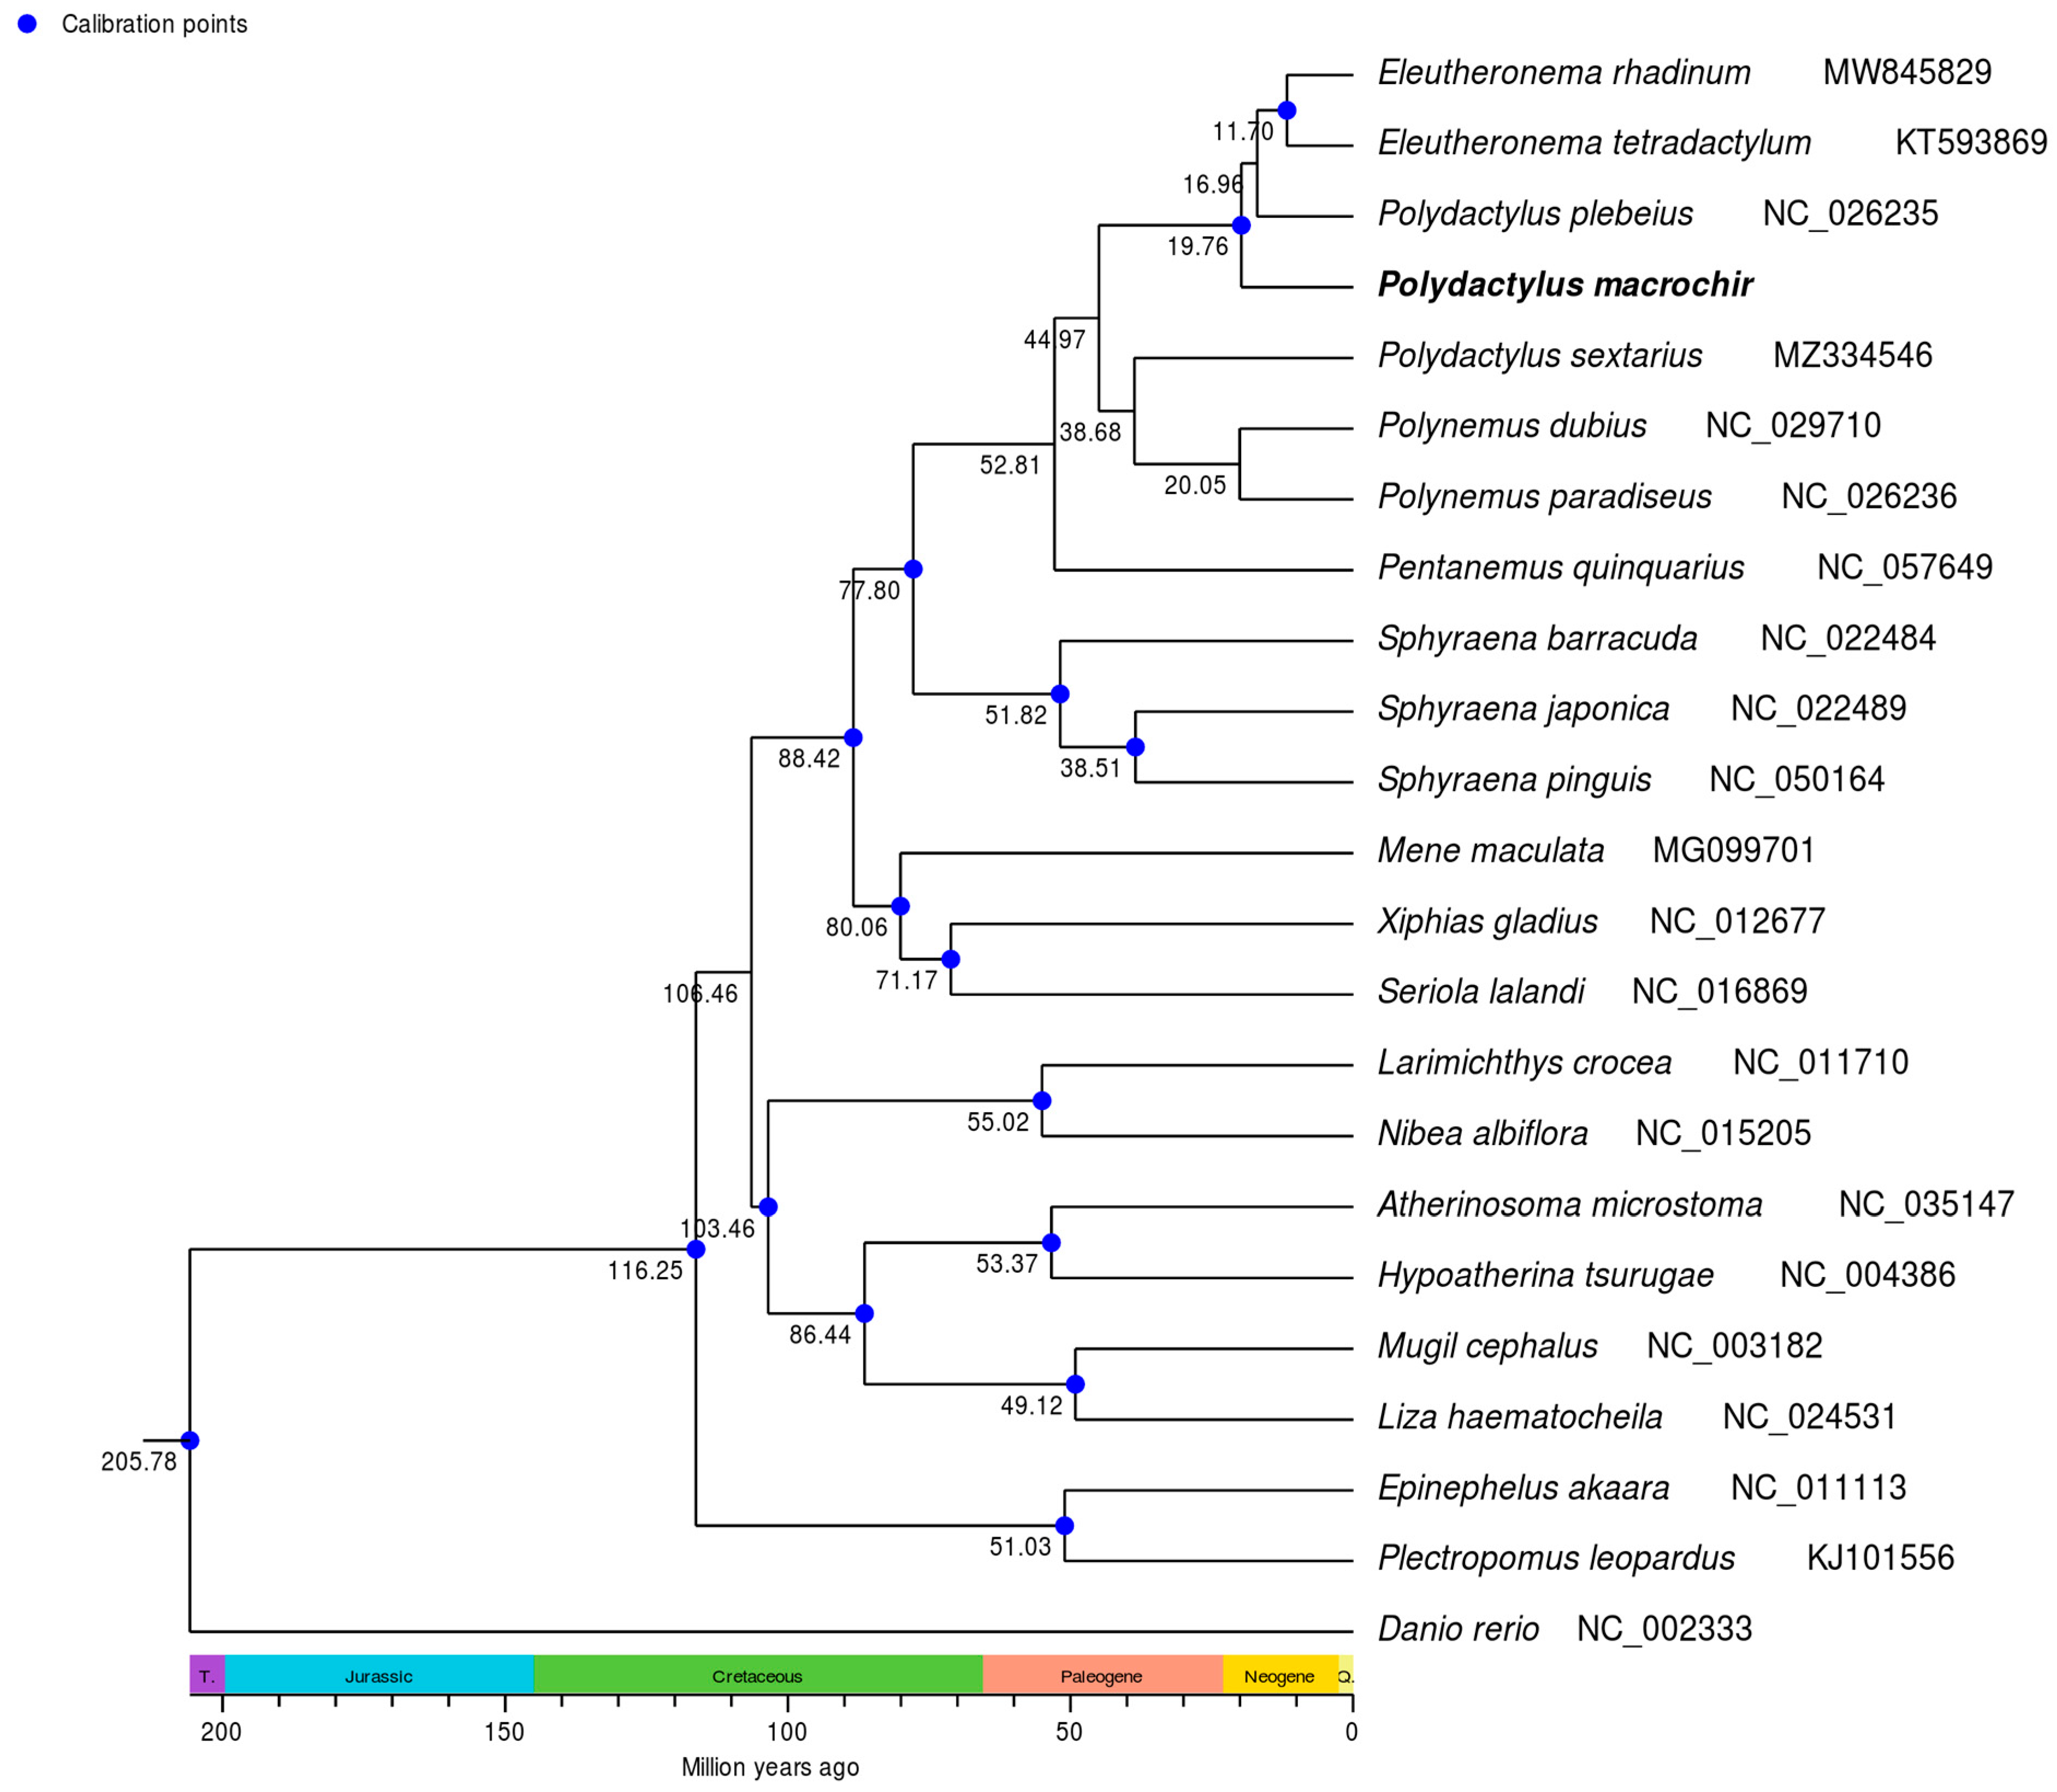
To find the position of P. macrochir among the 22 other species, a phylogenetic tree was constructed using maximum likelihood (ML) and Bayesian inference (BI) based on the coding sequence. It is shown that the ML trees and the BI trees share a similar topological structure (Figure 4 and Figure 5). As an outgroup, Danio rerio was distinct from the other fish species. The remaining fish species were grouped into two major clades. Eight polynemid species formed a well-supported monophyletic cluster. P. macrochir and the monophyletic cluster consists of Eleutheronema tetradactylum and Polydactylus plebeius, forming a sister group. Polynemidae formed a sister cluster with the clade of Sphyraenidae with a high bootstrap support value (100%). Then, (Polynemidae + Sphyraenidae) and (Menidae + Xiphiidae + Carangidae) were a sister lineage. The other representative species from the different families display distinct monophyletic clustering patterns. According to TimeTree analyses, the most recent common ancestor (MRCA) of Polynemidae was traced back to about 52.81 million years ago (MYA), while six species within Polynemidae diverged from 11.70 MYA to 20.05 MYA (Figure 6).

4. Discussion

The mitochondrial genome of P. macrochir has a total length of 16,738 bp, which is within the range of those of the other seven sequenced mitogenomes of threadfins. A typical set of 37 genes like that of other vertebrates [26], containing 13 PCGs, 22 tRNAs, 2 rRNAs, and 1 noncoding CR, was detected in this study. In terms of gene arrangement, P. macrochir was consistent with the other sequenced related species [16]. Both of these results indicate that P. macrochir was conserved. The nucleotide composition of the P. macrochir mitogenome was rich in A  +  T (54.15%), with a slightly positive AT skew (0.049), while the GC skew was moderately negative (−0.286). The overlapping and intergenic regions, which are commonly observed in other species, were both present in the mitogenome of P. macrochir. The length of the overlapping and intergenic regions between adjacent genes varied with the species lineage. All the PCGs started with typical ATN codons, except for cox1, initiated by GTG. In P. macrochir, TAA was the most common codon used as a stop codon, while the TAG terminating codon was used once, with the remaining incomplete T and TA codons. Atypical initiation codons and incomplete terminating codons have also been reported in the mitogenomes of other fish species [27].
As we know, the RSCU usually reflects the preference for codon usage [28]. In P. macrochir, the PCGs were more prone to use A and C than T and G at the third codon, which is different from Epinephelidae [29]. This bias in the usage of codons may provide hints to understand the evolutionary history of P. macrochir.
The analysis of nonsynonymous (Ka) and synonymous (Ks) substitution rates within miogenome PCGs provides evidence for studying natural selection and local adaption [30]. In this study, the Ka/Ks ratio of all the PCGs was much less than 1, indicating strong negative selection among the selected species. Mitochondrial PCGs play a crucial role in oxygen utilization and energy metabolism, which are vital for the survival and development of an organism. The low Ka/Ks ratio of all the PCGs ensure their functional conservation, reflecting the evolutionary strategy for ecological niche adaptation.
The previous studies did not resolve the uncertainties of the Polynemidae phylogenetic position. In this study, we reconstructed a phylogenetic tree for P. macrochir and 22 other species based on 13 PCGs from the mitochondrial genome. The same topologies were generated by both BI and ML analyses. P. macrochir and another seven species of Polynemidae were clustered into a clade with high nodal support values, validating the monophyly of the family Polynemidae. Within Polynemidae, P. macrochir and the other Polydactylus species cannot form a monophyletic group. The present results emphasize the need to revise the genus Polydactylus in accordance with the monophyletic principle. Therefore, more mitogenomes of the genus Polydactylus need to be sequenced to reconstruct the true phylogenetic tree. It was also shown that Polynemidae and Sphyraenidae are sister groups. Furthermore, the sister group relationships between (Polynemidae + Sphyraenidae) and (Menidae + Xiphiidae + Carangidae) were robustly supported. These results conflicted with the earlier studies which proposed that polynemids are closer to Mugilidae, Sphyraenidae, Atherinidae, and Phallostethoidei; Mugilidae and Sphyraenidae; or Sciaenidae according to different phenotypic analyses [6,7,8,9,10]. Morphological convergence was a primary source of error in phylogenetic reconstruction, and it was also difficult to assess trait homology among the taxa. Morphology inference based on different data partitions usually generated different topologies [31], which also happened in reconstructing the phylogenetic placement of Polynemidae. The alternative hypotheses for the phylogenetic placement of Polynemidae based on molecular analyses, such as Polynemidae grouped with Menidae and Lactariidae [12], Polynemidae and Menidae as a sister lineage [11], and Polynemidae + Menidae as a sister group of Sphyraenidae [15], are also in conflict with the present study. These phylogenetic analyses based on a single gene or combination of some genes were not powerful enough to build robust phylogenetic inference when compared with mitogenome-based analysis. Recently, the sister group relationship between Polynemidae and Pleuronectiformes was supported by molecular and morphological data [13,14]. In this study, the relationship between Polynemidae and Pleuronectiformes was not involved, which should be resolved by future research. According to the present results, we tend to locate Polynemidae in Perciformes and do not support setting the independent Order Polynemiformes [16]. Polynemidae and Sphyraenidae clustered together as a monophyletic group might form a new suborder of Perciformes, but we are in need of more evidence. The estimation of divergence time displayed that Polynemidae and Sphyraenidae diverged from the most recent common ancestor in the late Cretaceous at 77.80 MYA. Threadfins may originate in the Paleogene at 52.81 MYA. Some species of Polynemida may have undergone accelerated diversification during the Neogene period. This enhances our understanding of the phylogenetic relationships and speciation of Polynemidae. In future studies, improved taxon sampling and genome data are necessary to resolve phylogenetic incongruence, and what is important is the integration of molecular and morphology datasets to estimate the full evolutionary history of Polynemidae.

5. Conclusions

In this study, the complete mitogenome of P. macrochir was sequenced and analyzed. The mitochondrial genome had a total size of 16,738 bp and had conserved gene contents and arrangement. The PCGs tended to use A and C rather than T and G at the third codon. All of the PCGs underwent purifying selection. Phylogenetic analysis revealed that Polynemidae was clustered into a monophyletic group, being a sister group to Sphyraenidae. Threadfins may have originated in the Paleogene at 52.81 MYA. Some species of Polynemida may have undergone accelerated diversification during the Neogene period. These results provide valuable information for future studies on the phylogenetic relationships and speciation of Polynemidae.

Supplementary Materials

The following supporting information can be downloaded at: https://www.mdpi.com/article/10.3390/genes16010088/s1, Table S1: ka/ks value list and relative synonymous codon usage (RSCU) of P. macrochir.

Funding

This study was funded by the Science and Technology Planning Project of Guangdong Province (2017A020208001).

Institutional Review Board Statement

The animal study protocol was approved by the Institutional Animal Care and Use Committee of the Institute of Hydrobiology, Chinese Academic of Sciences (protocol code: 2022/LL/036; date of approval: 25 September 2022).

Informed Consent Statement

Not applicable.

Data Availability Statement

The data presented in this study are available in NCBI GenBank (Accession number: PQ675801).

Conflicts of Interest

The author declares no conflicts of interest.

References

  1. Motomura, H. Treadfns of the World (Family Polynemidae): An Annotated and Illustrated Catalogue of Polynemid Species Known to Date; Food & Agriculture Organization: Rome, Italy, 2004. [Google Scholar]
  2. Presti, P.; Johnson, G.D.; Datovo, A. Anatomy and evolution of the pectoral filaments of threadfins (Polynemidae). Sci. Rep. 2020, 10, 17751. [Google Scholar] [CrossRef]
  3. Fricke, R.; Eschmeyer, W.; Fong, J. Eschmeyer’s Catalog of Fishes: Genera/Species by Family/Subfamily; California Academy of Sciences: San Francisco, CA, USA, 2022. [Google Scholar]
  4. Ou, Y.J.; Xie, M.J.; Li, J.E.; Wen, J.F.; Zhou, H.; Liu, Q.Q. First maturation and mass seedling propagation of cultured Eleutheronema tetradactylum in Guangdong Province. S. China Fish. Sci. 2017, 13, 97–104. (In Chinese) [Google Scholar]
  5. Niu, Y.Y.; Ou, Y.J.; Lan, J.N.; Wen, J.F.; Li, J.E.; Li, J.W.; Zhou, H. Structure and early development of gill tissue in artificially cultured Eleutheronema tetradactylum. S. China Fish. Sci. 2020, 16, 108–114. (In Chinese) [Google Scholar]
  6. Gosline, W.A. Systematic position and relationships of the percesocine fishes. Pac. Sci. 1962, 16, 207–217. [Google Scholar]
  7. Rosen, D.E. The relationships and taxonomic position of the halfbeaks, killifishes, silversides, and their relatives. Bull. Am. Mus. Nat. Hist. 1964, 127, 217–268. [Google Scholar]
  8. Johnson, D.G. Percomorph phylogeny: Progress and problems. Bull. Mar. Sci. 1993, 52, 3–28. [Google Scholar]
  9. Kang, S.; Imamura, H.; Kawai, T. Morphological evidence supporting the monophyly of the family Polynemidae (Teleostei: Perciformes) and its sister relationship with Sciaenidae. Ichthyol. Res. 2017, 65, 29–41. [Google Scholar] [CrossRef]
  10. Presti, P.; Johnson, G.D.; Datovo, A. Facial and gill musculature of polynemid fishes, with notes on their possible relationships with sciaenids (Percomorphacea: Perciformes). J. Morphol. 2020, 281, 662–675. [Google Scholar] [CrossRef] [PubMed]
  11. Mirande, J.M. Combined phylogeny of ray-ffnned fishes (Actinopterygii) and the use of morphological characters in large-scale analyses. Cladistics 2017, 33, 333–350. [Google Scholar] [CrossRef]
  12. Sanciangco, M.D.; Carpenter, K.E.; Betancur-R, R. Phylogenetic placement of enigmatic percomorph families (Teleostei: Percomorphaceae). Mol. Phylogenetics Evol. 2015, 94, 565–576. [Google Scholar] [CrossRef] [PubMed]
  13. Betancur-R, R.; Broughton, R.E.; Wiley, E.O.; Carpenter, K.; López, J.A.; Li, C.; Holcroft, N.I.; Arcila, D.; Sanciangco, M.; Cureton Ii, J.C.; et al. The tree of life and a new classification of bony fishes. PLoS Curr. 2013, 5, 23653398. [Google Scholar] [CrossRef] [PubMed]
  14. Hughes, L.C.; Ortí, G.; Huang, Y.; Sun, Y.; Baldwin, C.C.; Thompson, A.W.; Arcila, D.; Betancur-R, R.; Li, C.; Becker, L.; et al. Comprehensive phylogeny of rayffnned ffshes (Actinopterygii) based on transcriptomic and genomic data. Proc. Natl. Acad. Sci. USA 2018, 115, 6249–6254. [Google Scholar] [CrossRef] [PubMed]
  15. Girard, M.G.; Davis, M.P.; Smith, W.L. The phylogeny of Carangiform fishes: Morphological and genomic investigations of a new fish clade. Copeia 2020, 108, 265–298. [Google Scholar] [CrossRef]
  16. Zhong, L.Q.; Wang, M.H.; Li, D.M.; Tang, S.K.; Chen, X.H. Mitochondrial genome of Eleutheronema rhadinum with an additional non-coding region and novel insights into the phylogenetics. Front. Mar. Sci. 2021, 8, 746598. [Google Scholar] [CrossRef]
  17. Taanman, J.W. The mitochondrial genome: Structure, transcription, translation and replication. Biochim. Biophys. Acta Bioenerg. 1999, 1410, 103–123. [Google Scholar] [CrossRef]
  18. Moritz, C.; Dowling, T.E.; Brown, W.M. Evolution of animal mitochondrial DNA: Relevance for population biology and systematics. Annu. Rev. Ecol. Syst. 1987, 18, 269–292. [Google Scholar] [CrossRef]
  19. Wang, C.; Ye, P.; Liu, M.; Zhang, Y.; Feng, H.; Liu, J.; Zhou, H.; Wang, J.; Chen, X. Comparative Analysis of Four Complete Mitochondrial Genomes of Epinephelidae (Perciformes). Genes 2022, 13, 660. [Google Scholar] [CrossRef]
  20. Gao, J.; Li, C.; Yu, D.; Wang, T.; Lin, L.; Xiao, Y.; Wu, P.; Liu, Y. Comparative mitogenome analyses uncover mitogenome features and phylogenetic implications of the parrotfishes (Perciformes: Scaridae). Biology 2023, 12, 410. [Google Scholar] [CrossRef] [PubMed]
  21. Yang, L.M.; Xue, J.F.; Zhao, X.M.; Ding, K.; Liu, Z.W.; Wang, Z.S.; Chen, J.B.; Huang, Y.K. Mitochondrial genome characteristics reveal evolution of Acanthopsetta nadeshnyi (Jordan and Starks, 1904) and phylogenetic relationships. Genes 2024, 15, 893. [Google Scholar] [CrossRef]
  22. Bankevich, A.; Nurk, S.; Antipov, D.; Gurevich, A.A.; Dvorkin, M.; Kulikov, A.S.; Lesin, V.M.; Nikolenko, S.I.; Pham, S.; Prjibelski, A.D.; et al. SPAdes: A new genome assembly algorithm and its applications to single-cell sequencing. J. Comput. Biol. 2012, 19, 455–477. [Google Scholar] [CrossRef]
  23. Bernt, M.; Donath, A.; Jühling, F.; Externbrink, F.; Florentz, C.; Fritzsch, G.; Pütz, J.; Middendorf, M.; Stadler, P.F. MITOS: Improved de novo metazoan mitochondrial genome annotation. Mol. Phylogenet. Evol. 2013, 69, 313–319. [Google Scholar] [CrossRef]
  24. Katoh, K.; Rozewicki, J.; Yamada, K.D. MAFFT online service: Multiple sequence alignment, interactive sequence choice and visualization. Brief. Bioinform. 2019, 20, 1160–1166. [Google Scholar] [CrossRef] [PubMed]
  25. Wang, D.; Zhang, Y.; Zhang, Z.; Zhu, J.; Yu, J. KaKs_Calculator 2.0: A Toolkit incorporating γ-series methods and sliding window strategies. Genom. Proteom. Bioinform. 2010, 8, 77–80. [Google Scholar] [CrossRef]
  26. Montaña-Lozano, P.; Moreno-Carmona, M.; Ochoa-Capera, M.; Medina, N.S.; Boore, J.L.; Prada, C.F. Comparative genomic analysis of vertebrate mitochondrial reveals a differential of rearrangements rate between taxonomic class. Sci. Rep. 2022, 12, 5479. [Google Scholar] [CrossRef]
  27. Ke, Z.; Zhou, K.; Hou, M.; Luo, H.; Li, Z.; Pan, X.; Zhou, J.; Jing, T.; Ye, H. Characterization of the Complete Mitochondrial Genome of the Elongate Loach and Its Phylogenetic Implications in Cobitidae. Animals 2023, 13, 3841. [Google Scholar] [CrossRef] [PubMed]
  28. Gun, L.; Yumiao, R.; Haixian, P.; Liang, Z. Comprehensive analysis and comparison on the codon usage pattern of whole Mycobacterium tuberculosis coding genome from different area. Biomed. Res. Int. 2018, 2018, 3574976. [Google Scholar] [CrossRef] [PubMed]
  29. Kundu, S.; Kang, H.E.; Kim, A.R.; Lee, S.R.; Kim, E.B.; Amin, M.H.F.; Andriyono, S.; Kim, H.W.; Kang, K. Mitogenomic Characterization and Phylogenetic Placement of African Hind, Cephalopholis taeniops: Shedding Light on the Evolution of Groupers (Serranidae: Epinephelinae). Int. J. Mol. Sci. 2024, 25, 1822. [Google Scholar] [CrossRef] [PubMed]
  30. Yang, Z.H.; Nielsen, R. Estimating synonymous and nonsynonymous substitution rates under realistic evolutionary models. Mol. Biol. Evol. 2000, 17, 32–43. [Google Scholar] [CrossRef] [PubMed]
  31. Keating, J.N.; Garwood, R.J.; Sansom, R.S. Phylogenetic congruence, conflict and consilience between molecular and morphological data. BMC Ecol. Evol. 2023, 23, 30. [Google Scholar] [CrossRef] [PubMed]
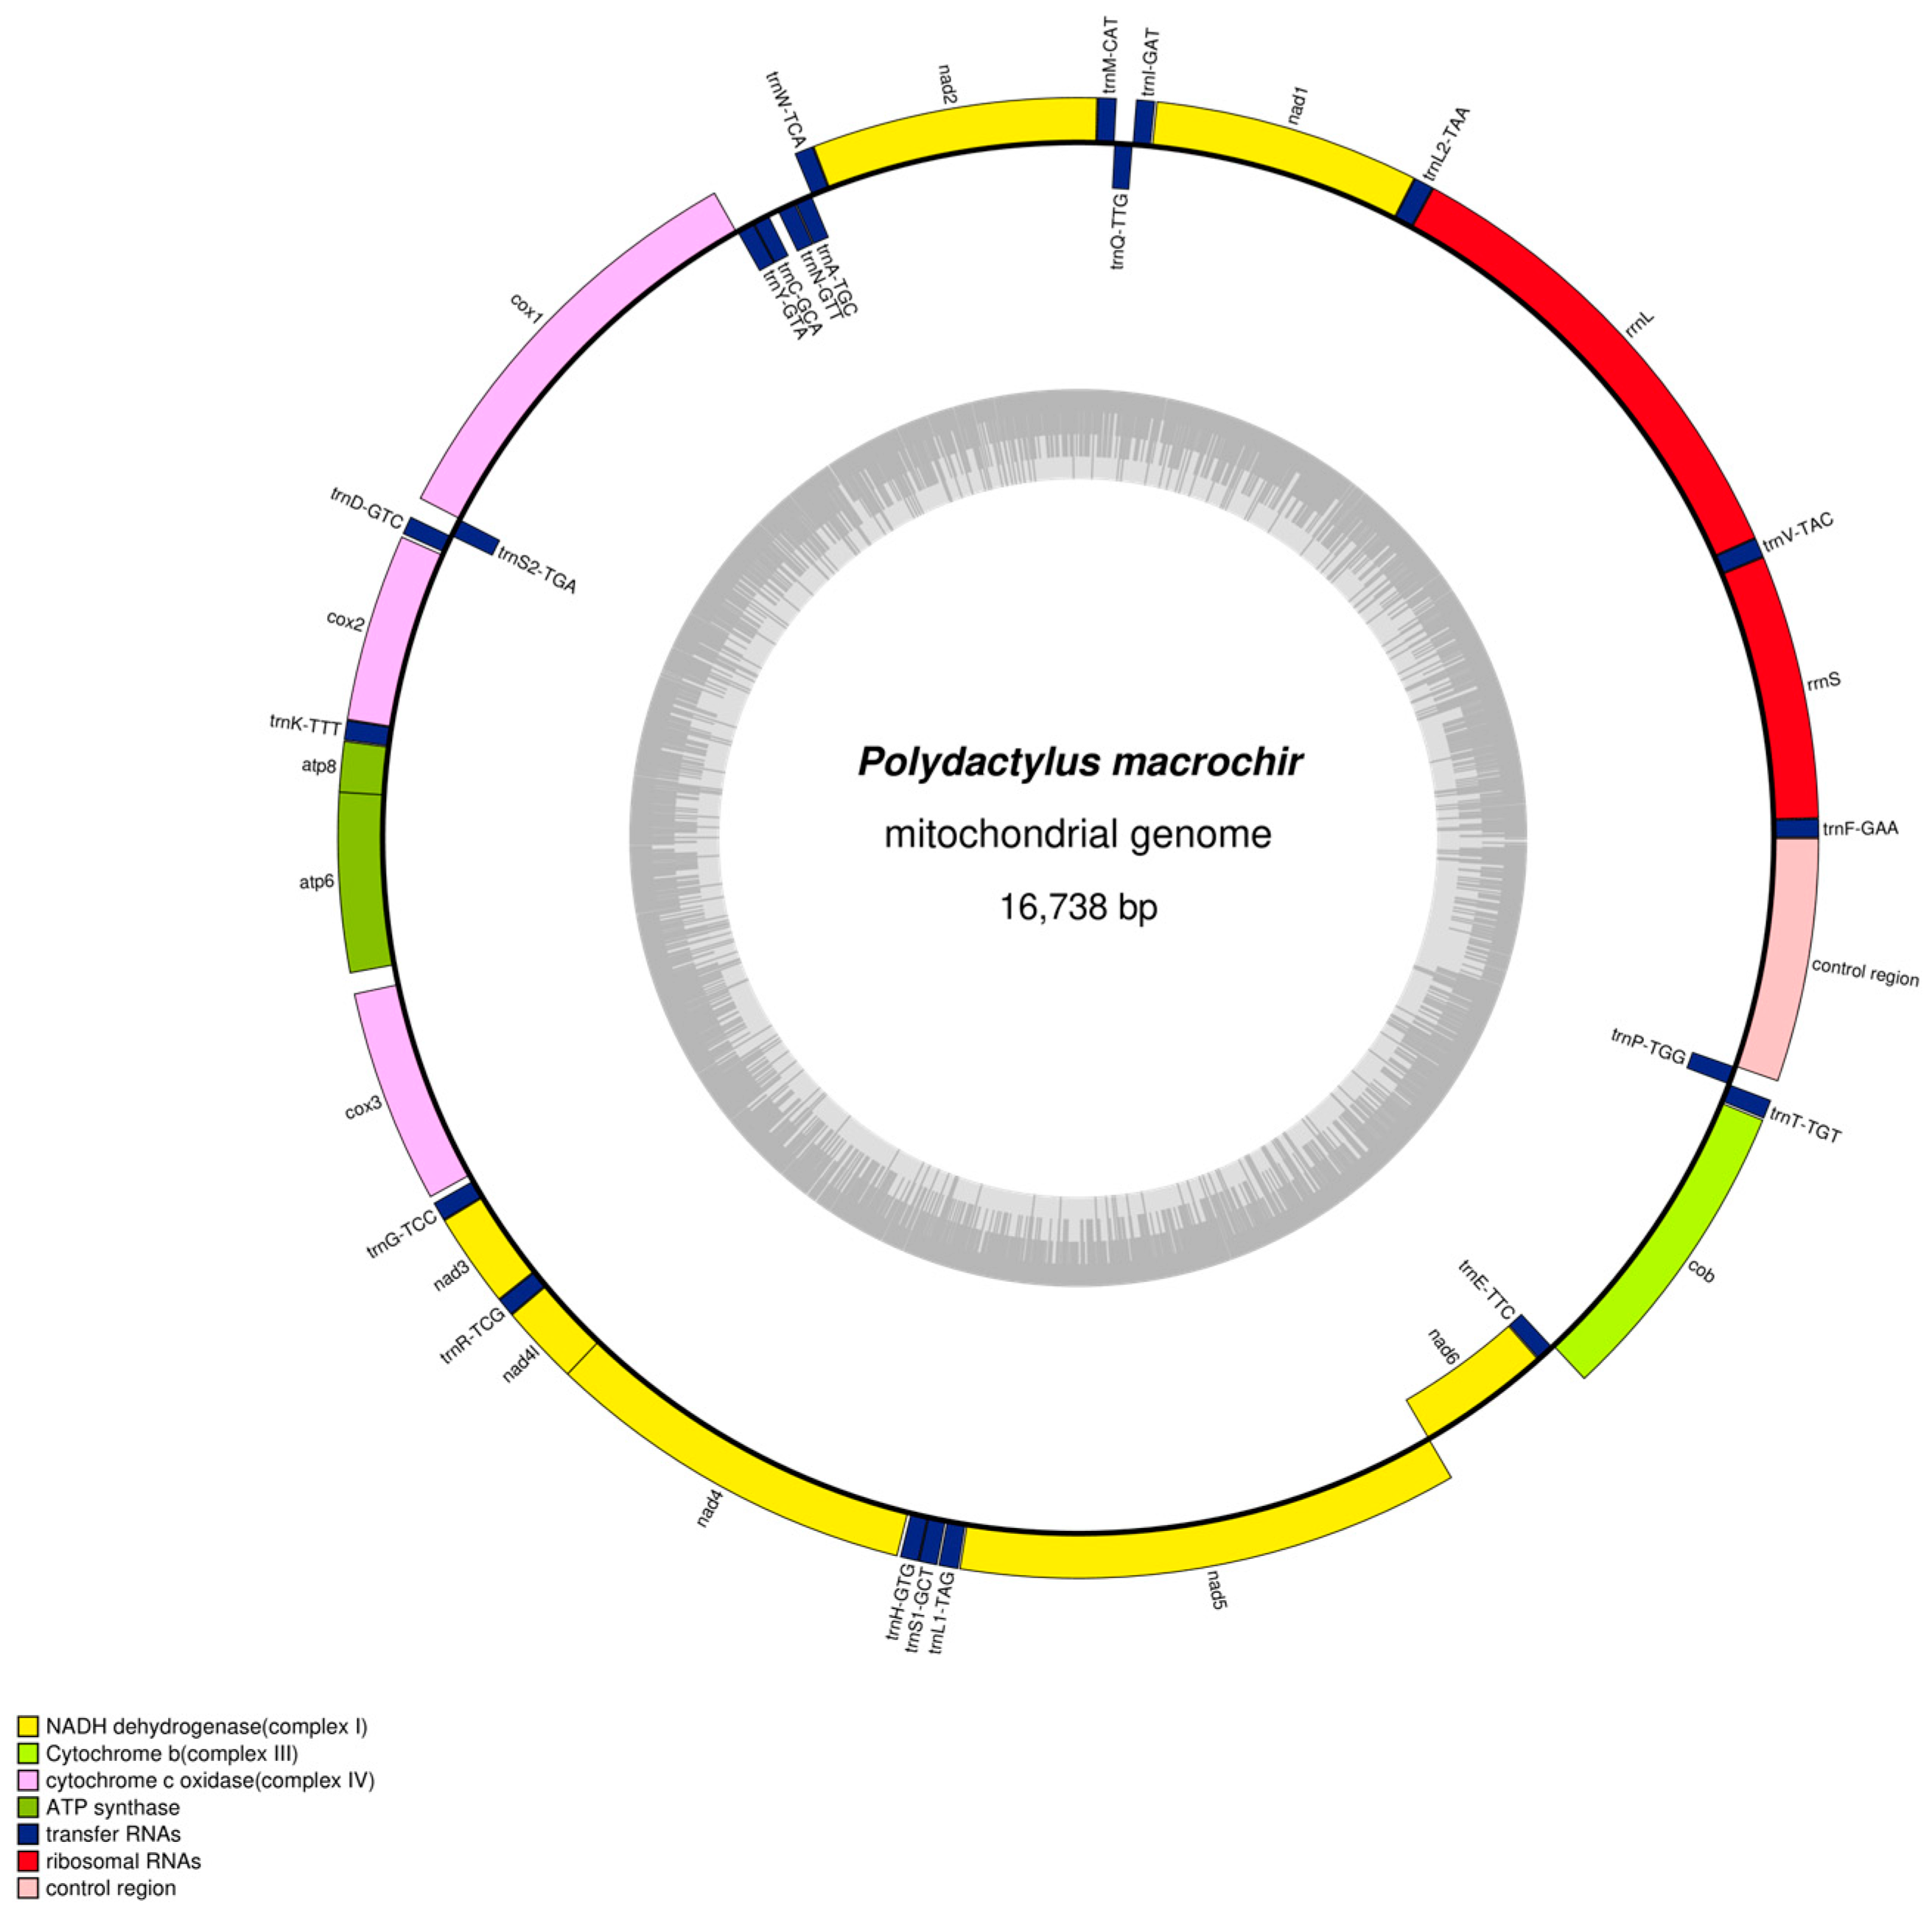
Figure 1. Mitochondrial genome map of P. macrochir.
Genes 16 00088 g001
Figure 2. Relative synonymous codon usage (RSCU) in the mitogenome of P. macrochir. (The y-axis represents the usage frequency of the corresponding amino acid codons in 13 PCGs. The different colors represent different codons in the amino acid).
Genes 16 00088 g002
Figure 3. Ka/Ks values for 13 PCGs of P. macrochir compared to other threadfins chose in this study.
Genes 16 00088 g003
Figure 4. ML phylogenetic trees based on the nucleotide datasets for 13 PCGs from the mitogenomes of 23 species (Polynemidae, Sphyraenidae, Xiphiidae, Carangidae, Menidae, Sciaenidae, Atherinidae, Serranidae, Mugilidae, and Danionidae). P. macrochir was sequenced in this study. The bootstrap values are overlaid with each node.
Genes 16 00088 g004
Figure 5. BI phylogenetic trees based on the nucleotide datasets for 13 PCGs from the mitogenomes of 23 species (Polynemidae, Sphyraenidae, Xiphiidae, Carangidae, Menidae, Sciaenidae, Atherinidae, Serranidae, Mugilidae, and Danionidae). P. macrochir was sequenced in this study. The bootstrap values are overlaid with each node.
Genes 16 00088 g005
Figure 6. Divergence time estimation of threadfins and other fish species (Polynemidae, Sphyraenidae, Xiphiidae, Carangidae, Menidae, Sciaenidae, Atherinidae, Serranidae, Mugilidae, and Danionidae). P. macrochir was sequenced in this study. Numbers at nodes indicate estimated age.
Genes 16 00088 g006
Table 1. Species attribution and accession number.
OrderFamilyGenusSpeciesSize (bp)Accession No.
PerciformesPolynemidaeEleutheronemaEleutheronema rhadinum16,718MW845829.1
Eleutheronema tetradactylum16,491KT593869.1
PentanemusPentanemus quinquarius16,708NC_057649.1
PolydactylusPolydactylus sextarius16,841MZ334546.1
Polydactylus plebeius16,765NC_026235.1
PolynemusPolynemus paradiseus16,710NC_026236.1
Polynemus dubius16,555NC_029710.1
SphyraenidaeSphyraenaSphyraena pinguis16,620NC_050164.1
Sphyraena
barracuda
16,707NC_022484.1
Sphyraena japonica16,760NC_022489.1
XiphiidaeXiphiasXiphias gladius16,520NC_012677.1
CarangidaeSeriolaSeriola lalandi16,532NC_016869.1
MenidaeMeneMene maculata16,733MG099701.1
SciaenidaeLarimichthysLarimichthys crocea16,466NC_011710.1
NibeaNibea albiflora16,499NC_015205.1
AtheriniformesAtherinidaeAtherinosomaAtherinosoma microstoma16,573NC_035147.1
HypoatherinaHypoatherina tsurugae16,566NC_004386.1
SerranidaeEpinephelusEpinephelus akaara16,795NC_011113.1
PlectropomusPlectropomus leopardus16,754KJ101556.1
MugiliformesMugilidaeMugilMugil cephalus16,685NC_003182.1
PlanilizaLiza haematocheila16,822NC_024531.1
CypriniformesDanionidaeDanioDanio rerio16,596NC_002333.2
Table 2. General features of mitogenome of P. macrochir.
Position Codon
GeneStandFromToSizeIntergenic LengthStartStop
trnFH170700
rrnSH7110379670
trnVH10381110730
rrnLH1111285317430
trnL2H28542927740
nad1H292839029750ATGTAA
trnIH39073976704
trnQL3976404671−1
trnMH4046411469−1
nad2H4115516010460ATGTA-
trnWH51615231710
trnAL52335301691
trnNL53035375731
trnCL541454796638
trnYL54805549700
cox1H5551710115511GTGTAA
trnS2L71027173720
trnDH71747242690
cox2H725279426919ATGT--
trnKH79438016740
atp8H801882061891ATGTAA
atp6H81768859684−31ATGTAA
cox3H8933971878673ATGTAA
trnGH974298137223
nad3H981410,1623490ATGT--
trnRH10,16310,231690
nad4lH10,23210,5282970ATGTAA
nad4H10,52211,8961375−7ATGT--
trnHH11,90611,974699
trnS1H11,97512,043690
trnL1H12,04812,120734
nad5H12,12413,96218393ATGTAA
nad6L13,95914,480522−4ATGTAG
trnEL14,48214,551701
cobH14,5561569811434ATGTAA
trnTH15,70315,774724
trnPL15,77415,84572−1
D-loopH15,84616,7388930
Table 3. Nucleotide composition and skewness values of P. macrochir mitogenome.
Polydactylus_MacrochirSize(bp)A%T%G%C%A + T%G + C%AT-SkewGC-Skew
Mitogenome16,73828.425.7516.3629.4954.1545.850.049−0.286
PCGs11,44725.627.7115.6531.0353.3246.68−0.039−0.329
tRNAs155727.4926.5923.8322.0954.0845.920.0170.038
rRNAs271031.5122.7720.9224.854.2845.720.161−0.085
Dloop89335.7231.0214.2219.0466.7433.260.07−0.145
Disclaimer/Publisher’s Note: The statements, opinions and data contained in all publications are solely those of the individual author(s) and contributor(s) and not of MDPI and/or the editor(s). MDPI and/or the editor(s) disclaim responsibility for any injury to people or property resulting from any ideas, methods, instructions or products referred to in the content.