Abstract
Background: The codon preference of chloroplast genomes not only reflects mutation patterns during the evolutionary processes of species but also significantly affects the efficiency of gene expression. This characteristic holds significant scientific importance in the application of chloroplast genetic engineering and the genetic improvement of species. Chloranthus, an ancestral angiosperm with significant economic, medicinal, and ornamental value, belongs to the basal angiosperms. However, the codon usage patterns among Chloranthus species have remained unclear. Methods: To investigate codon usage bias and its influencing factors in Chloranthus chloroplast genomes, we utilized CodonW, CUSP, and SPSS software to analyze the chloroplast genomes of seven Chloranthus species. Results: In this study, we reported and characterized the complete chloroplast genome of the Chinese endemic species Chloranthus angustifolius. The phylogenetic tree based on the whole chloroplast genomes showed that C. angustifolius is sister to Chloranthus fortunei, and the genus Chloranthus is divided into two major clades, consistent with previous studies. Our results revealed that the GC content at different codon positions across all seven Chloranthus species was less than 50%, with GC1 > GC2 > GC3. Additionally, the average effective number of codons (ENC) values exceeded 45. A total of 10 shared optimal codons were identified, nine of which end with A or U. PR2-plot, ENC-plot, and neutrality plot analyses indicated that natural selection primarily influenced codon usage bias in the chloroplast genomes of Chloranthus. Conclusions: We newly obtained the chloroplast genome of C. angustifolius and proposed that natural selection played a key role in codon usage patterns in Chloranthus species. These findings contribute to our understanding of evolutionary history and genetic diversity within this genus.
1. Introduction
Codons play a crucial role in the transmission of genetic information between nucleic acids and proteins in organisms, with most amino acids being encoded by at least two synonymous codons [1]. Codon usage bias (CUB) refers to the preferential and non-random usage of synonymous codons [2]. Influenced by various factors such as mutation, natural selection, genome size, codon position within genes, mRNA folding, protein structure, and tRNA abundance, CUB not only differs among populations within species, families, or kingdoms, but also varies among genes within an organism [3,4]. CUB can impact life processes such as gene transcription and protein translation and folding, reflecting the origin of species or genes and their adaptability to the environment [5]. The analysis of codon usage bias provides valuable insights into the evolutionary processes that shape gene sequences and expression patterns, and helps us to understand how species adapt to their environments and how genes function within organisms [6,7,8].
Chloroplasts function as the primary sites for photosynthesis in green plants and are semi-autonomous organelles endowed with their own genomes and protein synthesis machinery [9]. The chloroplast genome is of moderate size, structurally conserved, and contains a wealth of genetic information. By comparing and analyzing the chloroplast genomes of different species, we can gain insights into the phylogenetic relationships among plant species and explore their evolutionary mechanisms [10,11,12]. Furthermore, compared to nuclear gene transformation, chloroplast gene transformation offers advantages such as high expression efficiency of foreign genes in chloroplasts, site-specific integration, absence of position effects, and genetic stability [13,14]. In the process of protein coding in plant chloroplast genomes, there is a widespread phenomenon of CUB. Previous studies have shown that during long-term evolution, the codon preference of species is influenced by multiple factors such as base mutations and natural selection. These factors jointly determine the pattern of codon usage and further affect the expression efficiency of exogenous genes in chloroplasts [15,16]. Additionally, there are significant differences in codon preference among different species. Therefore, by studying the codon preference of chloroplast genomes, the expression level of exogenous genes in chloroplasts can be optimized, which is of great significance for promoting the application of chloroplast genetic engineering and genetic improvement of species [17,18].
The genus Chloranthus (Chloranthaceae), as one of the basal angiosperm lineages, comprises 13 species and 5 varieties, and is distributed from Asian tropical to temperate regions, with a diversity center in China [19,20,21,22,23,24]. The species are perennial herbs or shrubs with high ornamental values, such as Chloranthus spicatus (Thunb.) Makino. Eight of them are used as Chinese traditional herbal medicines, with the roots or rhizomes being the main medicinal parts [19]. Recently, secondary metabolites, such as terpenes, amides, sterides, and lignans, have been isolated from the plants of this genus, and modern pharmacological studies have shown that these chemical constituents can be used for anti-tumor, antibacterial, anti-inflammatory, antioxidant, neuroprotection, and other activities [25,26,27,28]. Further, the phylogenetic relationships among this genus have been resolved. For example, Kong et al. (2002) constructed the phylogenetic tree of Chloranthus and deem that this genus can be divided into two major clades: one clade containing Chloranthus erectus, C. spicatus, Chloranthus serratus, Chloranthus henryi, Chloranthus sessilifolius, and Chloranthus oldhamii, and the other comprising C. angustifolius, C. fortunei, Chloranthus nervosus, and Chloranthus japonicus. [20]. Zhang et al. (2015) employed ITS and four chloroplast regions to support the two clades division [23]. Yao et al. (2023) obtained the new chloroplast genome of C. nervosus and also revealed the recognition of the two clades with the highest supporting values [29]. However, there is still a lack of information on the codon usage patterns among Chloranthus species.
The aims of this study were to confirm the phylogenetic position of C. angustifolius and reveal the codon usage characteristics of the chloroplast genome coding regions in Chloranthus. For these purposes, we first sequenced and annotated the complete chloroplast genome of C. angustifolius, and then collected chloroplast genomes of six other Chloranthus species to reveal the codon usage bias among this genus. Finally, we reconstructed the phylogeny of this genus based on 86 protein-coding genes (CDSs) and the whole chloroplast genome, and compared the topology from relative synonymous codon usage (RSCU) values. This study conducted a systematic and comparative analysis of codon usage characteristics in Chloranthus for the first time, which sheds new light in understanding the evolution of this genus and provides a scientific basis for the codon optimization of exogenous genes and the improvement of their expression efficiency in future chloroplast genetic engineering applications within this genus.
2. Materials and Methods
2.1. Sampling, DNA Extraction, Sequencing, Chloroplast Genome Assembly, and Annotation
The samples were collected from Daozhen County, Guizhou Province, China (28°51′57.45″ N, 107°36′32.27″ E), and cultivated in Anshan Normal University. The voucher specimen (accession no. ZJS_2021086) was deposited in the specimen room of Anshan Normal University (https://www.asnc.edu.cn/, Contact: Ji-Si Zhang, E-mail: zhangjisi@asnc.edu.cn). Total genomic DNA was extracted from silica gel-dried leaves using the modified CTAB method [30] and the Illumina paired-end (PE) library was prepared and sequenced in Nanjing Novogene Biotechnology Co., Ltd., Nanjing, China.
In total, 4 Gb of 150-bp paired-end raw reads were generated and used for chloroplast genome assembly. The quality of raw sequence reads was assessed in FastQC v0.11.9 [31] and the adapters and low-quality reads were filtered using Trimmomatic v0.39 [32]. The clean reads were assembled by GetOrganelle v1.5 [33], and the assembled genomes were checked and visualized in Bandage v0.7.1 [34]. Finally, we obtained the high-quality and complete plastomes. The chloroplast genome of C. angustifolius was sequenced to obtain 13,699,315 raw reads. After filtering, 13,630,820 clean reads were obtained, with an effective rate of 99.5%. The average coverage depth was higher than 1000×, which exceeded the required average sequencing depth of 100× for sequence assembly.
The chloroplast genome of C. angustifolius was annotated used GeSeq [35] and Geneious v9.0.5 (http://www.geneious.com/) with C. japonicus (NC_026565) as reference. The annotated complete chloroplast genome of C. angustifolius was deposited in GenBank (accession number MW581013).
2.2. Phylogenetic Analysis
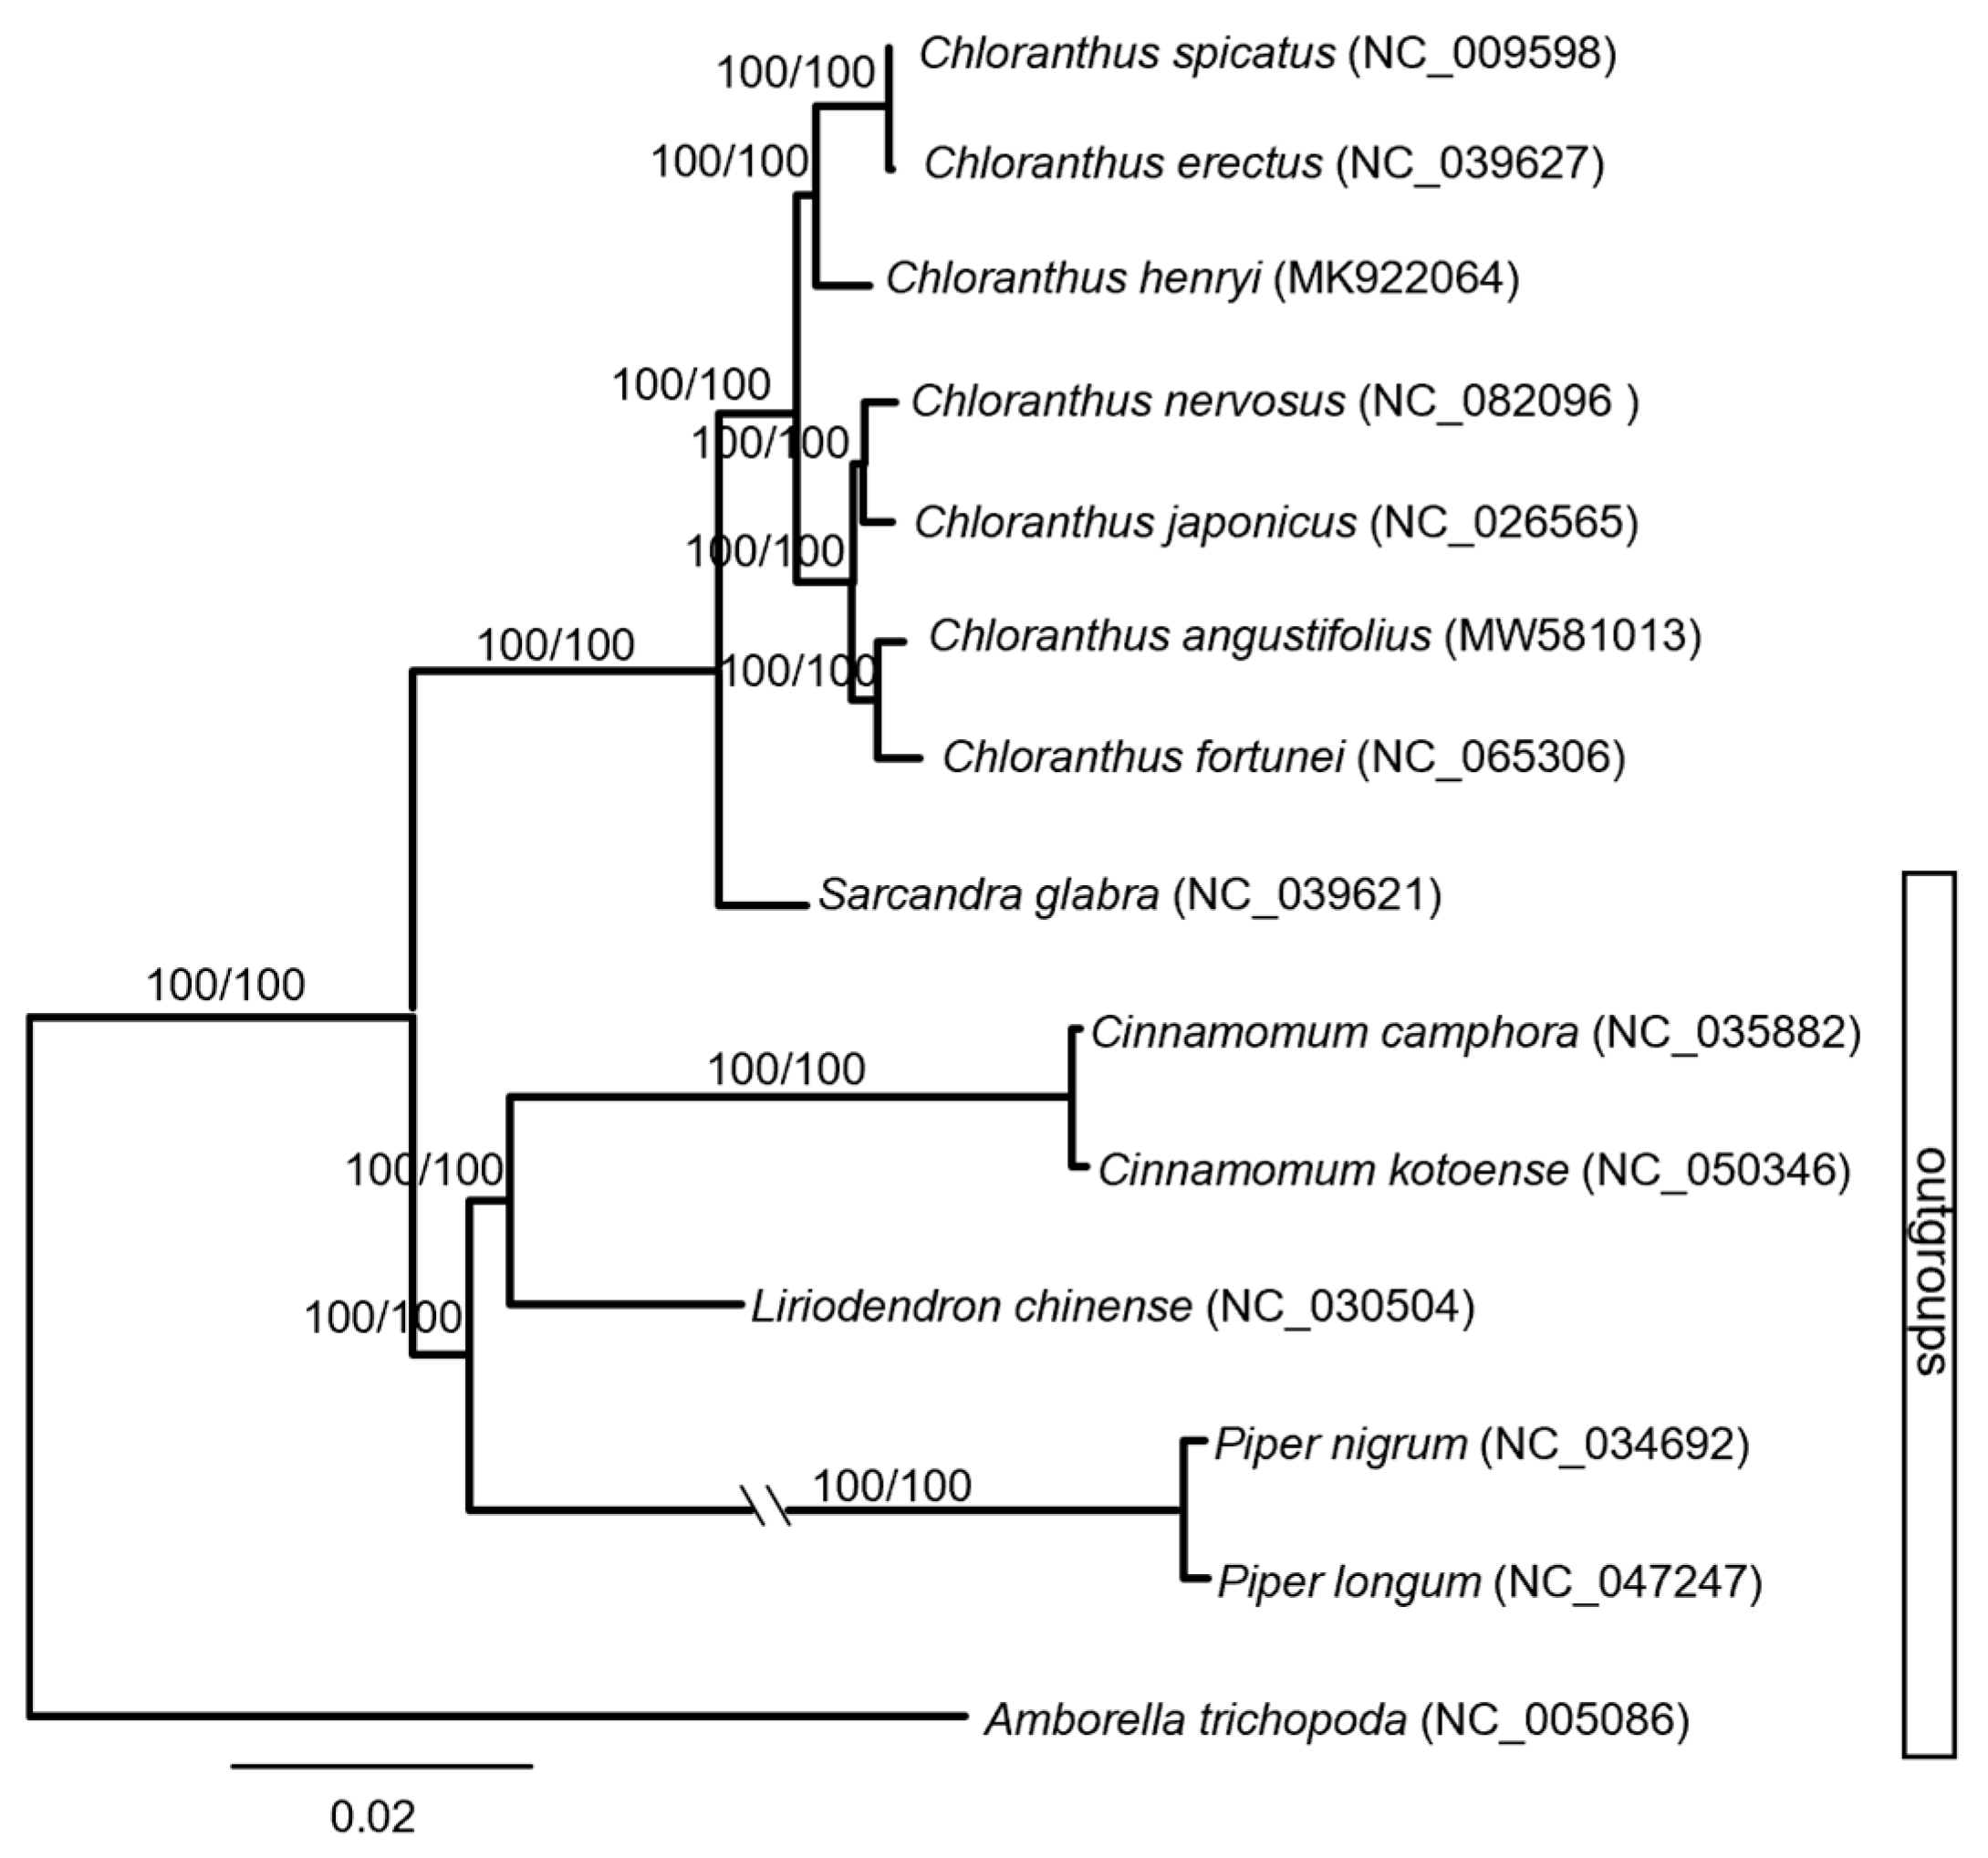
To determine the phylogenetic position of C. angustifolius, another six complete chloroplast genomes of Chloranthus were downloaded from GenBank, including C. erectus, C. fortunei, C. henryi, C. japonicus, C. nervosus, and Chloranthus spicauts. Seven species (Sarcandra glabra, Cinnamomum camphora, Cinnamomum kotoense, Liriodendron chinense, Piper nigrum, Piper longum, and Amborella trichopoda) from basal angiosperm were selected as outgroups according to APG IV [36]. All sequences were aligned with MAFFT v7.409 [37]. The maximum likelihood tree and maximum parsimony were reconstructed using RAxML 8.2.12 [38] and PAUP v.4.0b10 [39], respectively. For the ML analyses, nodal support on the ML tree was evaluated by the rapid BS (1000 replicates). For MP analysis, heuristic searches were conducted with 1000 replicates of random addition, with one tree held at each step during stepwise addition, tree-bisection-reconnection (TBR) branch swapping, MulTrees in effect, and steepest descent off. Bootstrapping was conducted with 1000 replicates with 10 random taxon additions and heuristic search options.
2.3. Calculation of Parameters Related to Codon Usage Bias
Sequences with a length greater than 300 bp were selected for subsequent analysis based on annotations, ensuring that the extracted CDS initiated with the start codon ATG and terminated with the stop codons TAA, TAG, or TGA, and that no stop codons appeared prematurely within the sequences. In this study, 51 protein-coding genes were selected and analyzed for the codon usage bias in the Chloranthus chloroplast.
Using CodonW1.4.2 software, we calculated parameters such as the effective number of codons (ENC), and relative synonymous codon usage (RSCU) for the protein-coding sequences in the chloroplast genome of Chloranthus [40,41]. Additionally, we used the CUSP online software (http://www.bioinformatics.nl/emboss-explorer/, accessed on 1 November 2024) to analyze and tally the A, T, G, and C content at the third position of each codon (A3, T3, G3, C3), as well as the GC content at the first (GC1), second (GC2), and third (GC3) positions of the codons, the overall GC content (GCall), and the G + C content at the third position of synonymous codons (GC3S). Pearson correlation was conducted using IBM SPSS Statistics 29.
2.4. Neutrality Plot Analysis
Using GC12 (the average of GC1 and GC2) as the ordinate and GC3 as the abscissa, a corresponding scatter plot was drawn. When the slope of the regression curve is close to 1, it indicates that the gene is significantly influenced by mutational pressure; when the slope is close to 0, selection pressure is considered to be the main driving force behind codon usage bias [32,33,34,35,36,37,38,39,40,41,42,43,44].
2.5. ENC-Plot Analysis
If the usage frequency of synonymous codons is solely determined by base mutations, then ENCexp = 2 + GC3S + 29/[GC3S2 + (1 − GC3S)2], and a standard curve is plotted. Using the GC3 of each gene as the abscissa and the actual ENC value as the ordinate, a scatter plot is drawn for each gene to perform an effective number of codons plotting (ENC-plot) analysis. The scatter plot can be used to determine the causes of codon usage bias [45].
2.6. Parity Rule 2 (PR2) Bias Plot Analysis
The PR2-plot is utilized to assess the balance of mutations between the third-position nucleotides G/C and A/T across codons. In this plot, the x-axis represents the ratio of G3/(G3 + C3), while the y-axis represents the ratio of A3/(A3 + T3). The central point (0.5, 0.5) signifies equal frequencies of G = C and A = T, indicating that codon usage bias at this point is predominantly shaped by mutation pressure. Vectors extending from the center to individual data points in the plot illustrate both the direction and magnitude of deviation from mutational equilibrium for each gene [46,47].
2.7. Identification of Optimal Codons
The effective number of codons (ENC) values of 51 protein-coding genes in Chloranthus were sorted and the top 10% of genes were selected to construct a high-expression gene pool, while selecting the bottom 10% to construct a low-expression gene pool. The relative synonymous codon usage (RSCU) and ΔRSCU values were calculated for both pools. An RSCU greater than 1 indicates that the codon is a high-frequency codon. Codons with a ΔRSCU greater than or equal to 0.08 are defined as high-expression codons. Codons that meet both of these criteria are referred to as optimal codons [48].
3. Results
3.1. Chloroplast Genome Characters of C. angustifolius
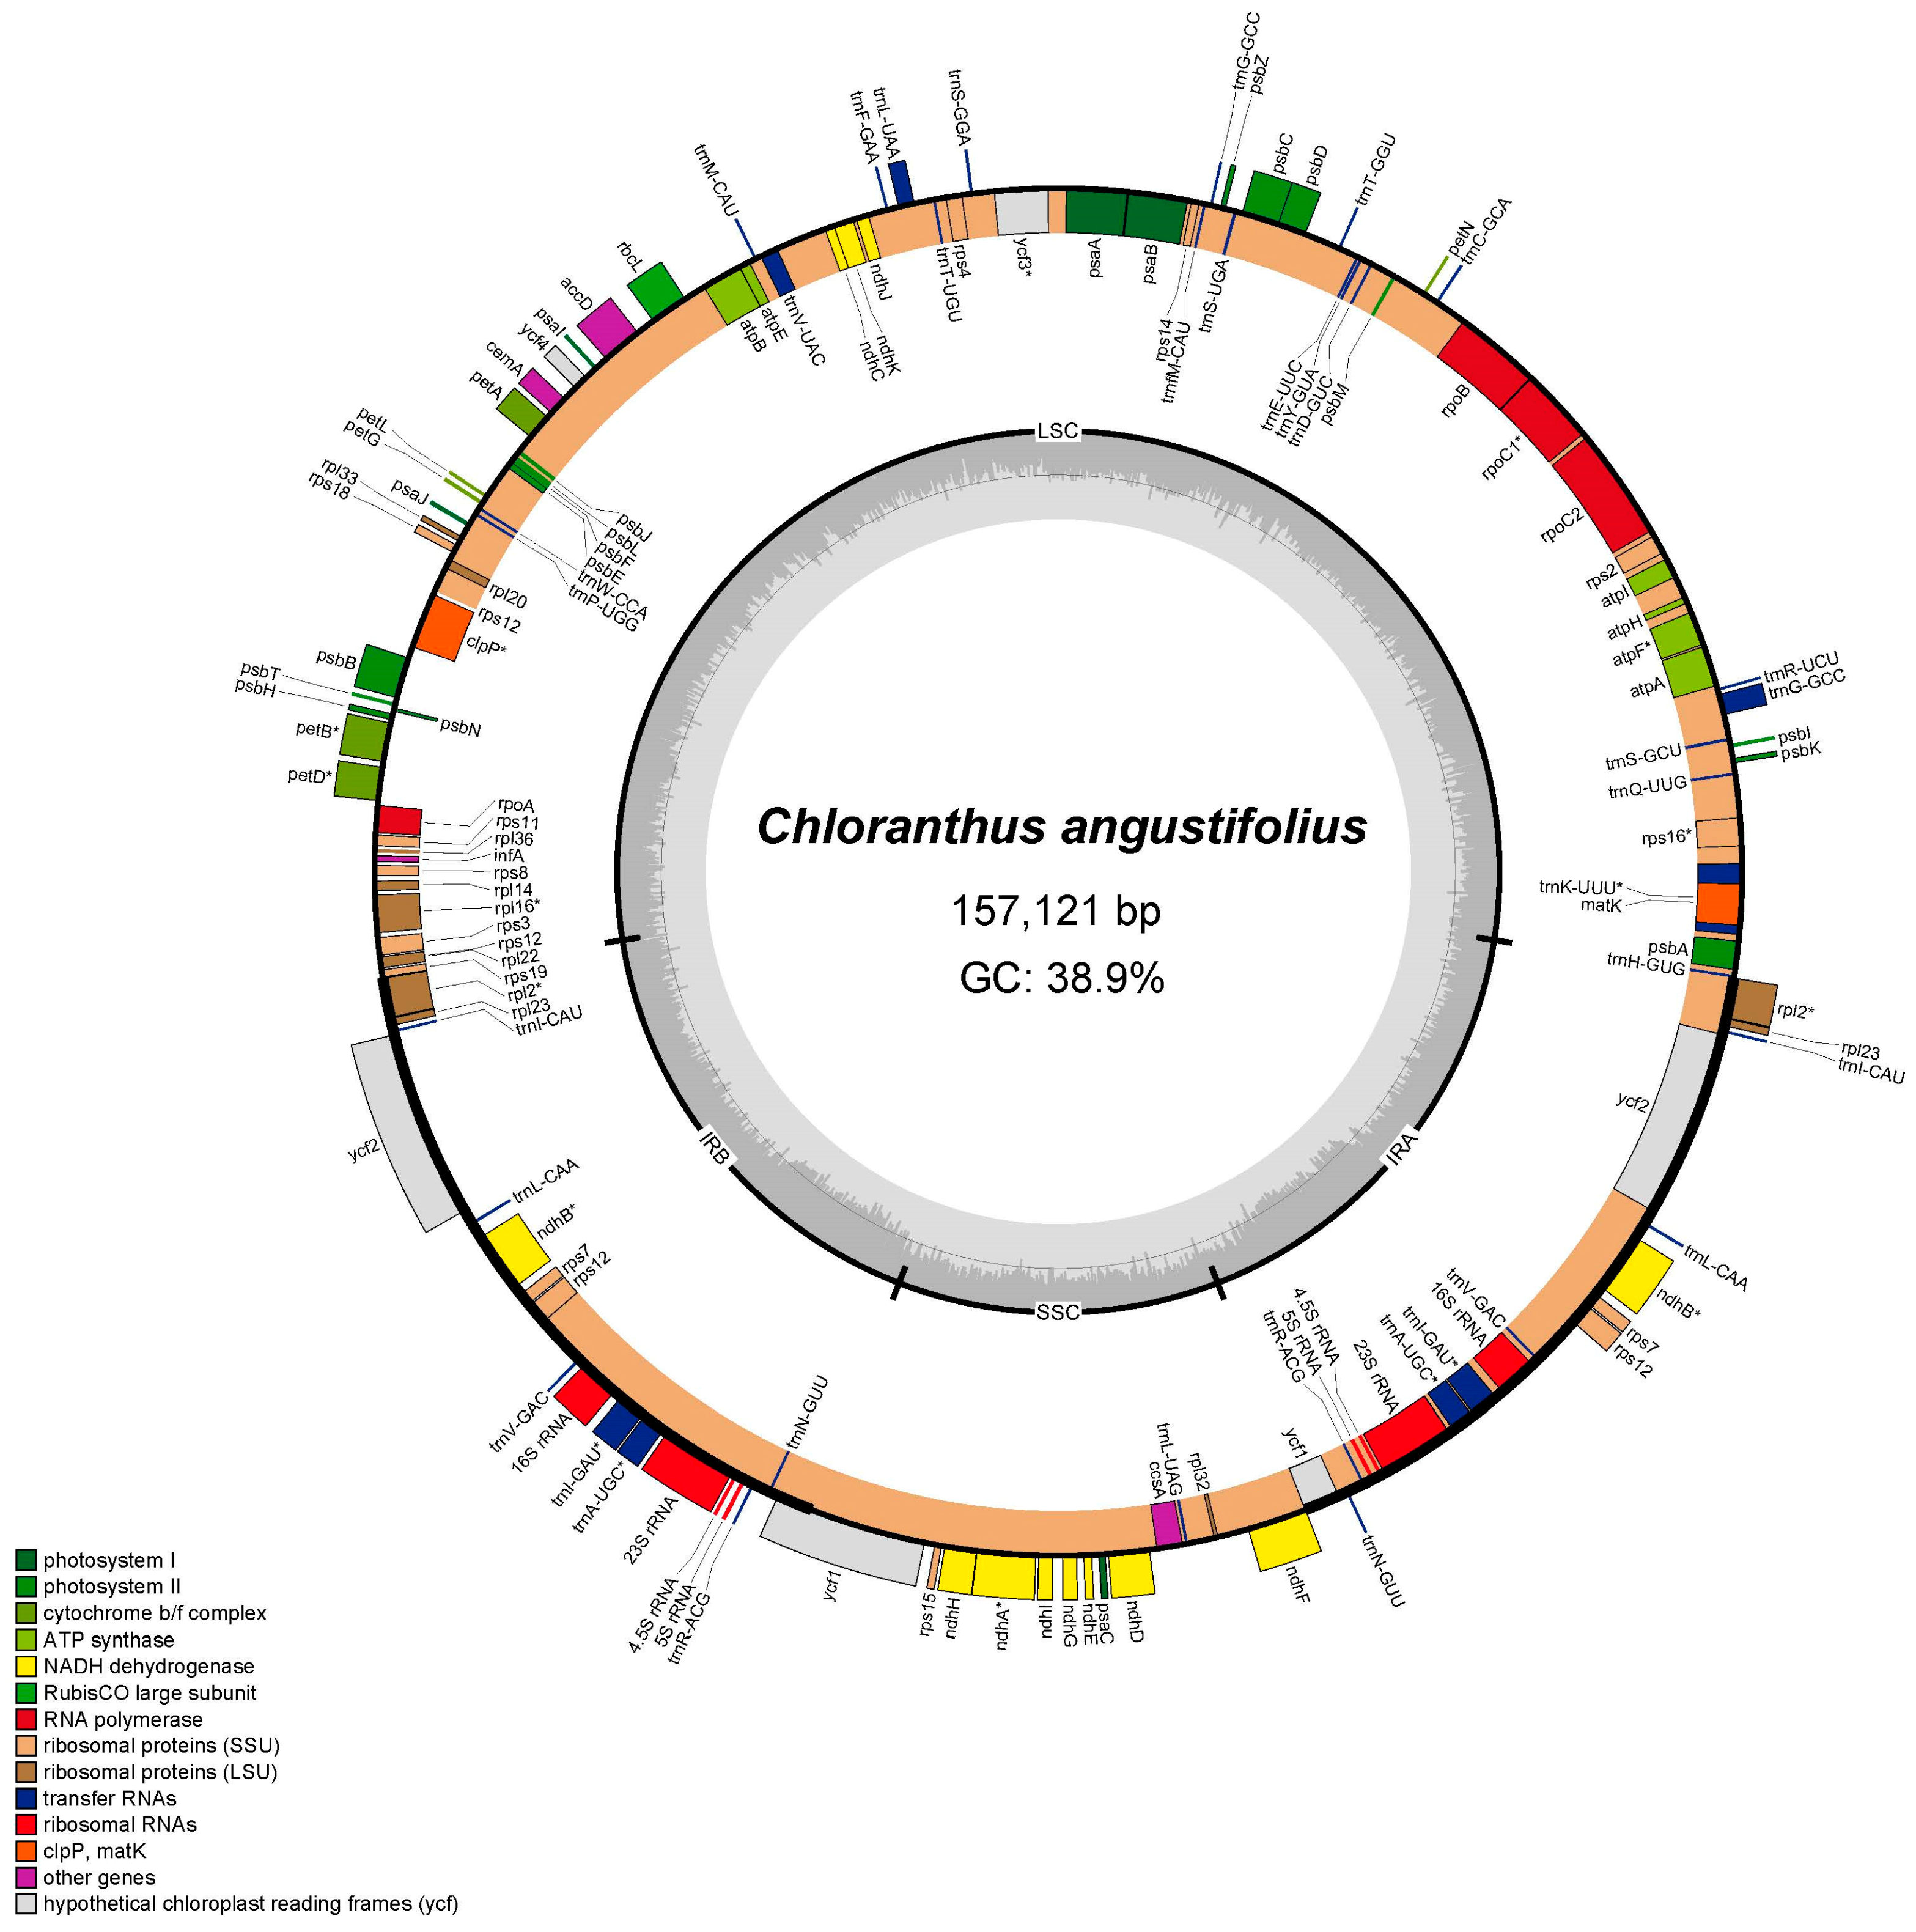
The complete chloroplast genome of C. angustifolius is a typical quadripartite structure and the length is 157,121 bp, with a small single-copy region (SSC) of 18,473 bp, a large single-copy region (LSC) of 86,350 bp, and a pair of inverted repeat regions (IRs) of 26,149 bp (Figure 1). There are 131 genes annotated, including 86 CDSs, 37 transfer RNA (tRNAs) genes, and eight ribosomal RNA (rRNAs) genes. Among the 131 genes, 76 were related to self-replication, including 11 genes related to the large subunit of the ribosome and 14 related to the small subunit of the ribosome. A total of 43 genes were involved in photosynthesis, including 6 related to ATP synthase, 12 to NADH dehydrogenase, 6 to the cytochrome b/f complex, 5 to the PS I system, 14 to the PS II system, and 1 associated with Rubisco. Additionally, 12 genes were annotated as having other (infA, clpP, ccsA, accD, cemA, and matK) or unknown functions (ycf1, ycf2, ycf3, and ycf4). Fourteen genes had a single intron (atpF, ndhA, ndhB, petB, petD, rpl2, rpl16, rpoC1, rps12, trnA-UGC, trnI-GAU, trnK-UUU, trnL-UAA, and trnV-UAC), while clpP and ycf3 contained two introns (Table S1).

Figure 1.
Chloroplast genome map of C. angustifolius. Genes located in the outer circle are transcribed in a counterclockwise direction, while those within the inner circle are transcribed clockwise. The dark gray shading in the inner circle indicates regions of high GC content, whereas the light gray shading represents areas with higher AT content.
3.2. Phylogenetic Analysis
Maximum parsimony (MP) and maximum likelihood (ML) trees were constructed based on the whole chloroplast genome (Figure 2). The monophyly of the genus Chloranthus had been well supported (MP-BS = 100%, ML-BS = 100%). The seven species sampled here were mainly divided into two major clades with the highest supporting values (MP-BS = 100%, ML-BS = 100%). C. erectus, C. spicatus, and C. henryi were well supported as a clade (MP-BS = 100%, ML-BS = 100%), and C. erectus and C. spicatus were sisters (MP-BS = 100%, ML-BS = 100%). The other four species formed another clade with the highest supporting values (MP-BS = 100%, ML-BS = 100%). Within this clade, C. angustifolius and C. fortunei formed a subclade, and C. nervosus and C. japonicus formed another subclade.

Figure 2.
Phylogenetic tree of Chloranthus based on the complete chloroplast genome.
3.3. Calculation of Parameters Related to Codon Usage Bias
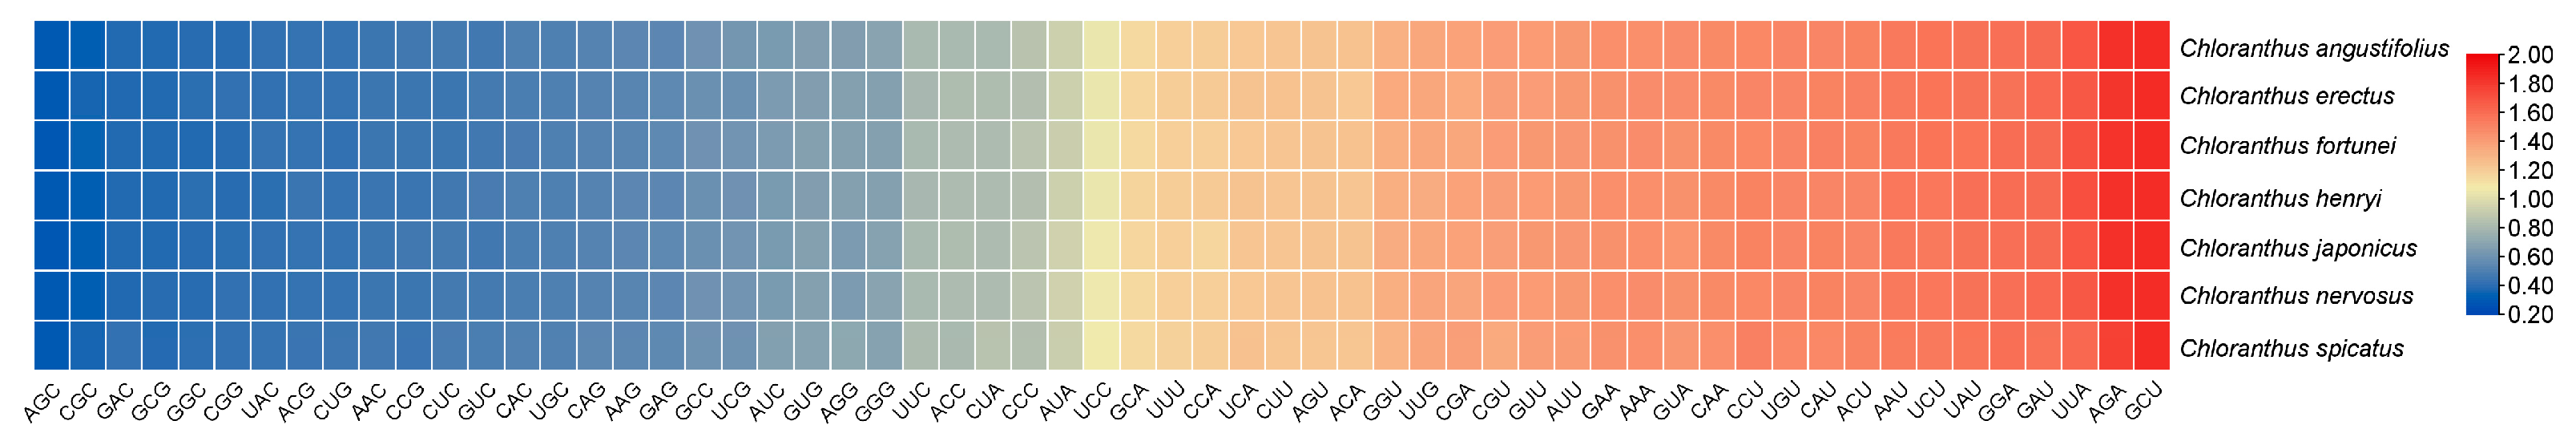
The codon usage bias of CDSs within Chloranthus is shown in Figure 3. There are 30 preferred codons (RSCUS > 1), 2 non-preferred codons (RSCU = 1), and 27 less used codons (RSCU < 1). The preferred codons generally ended in A or U, except for UUG.
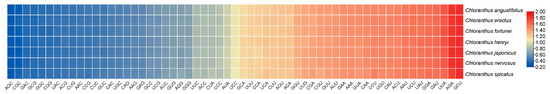
Figure 3.
Heat map of codon usage bias in the plastomes of seven Chloranthus species under RSCU values.
The 51 selected protein-coding sequences from the seven Chloranthus chloroplasts are presented in Table S2. The GC distribution pattern was generally consistent in all the seven species. The GC content (GCall) of C. erectus and C. henryi was 39.2%, and the GCall of the other species (C. angustifolius, C. nervosus, C. spicatus, C. japonicas, and C. fortunei) was 39.3% (Table 1). The GC contents of the first, second, and third positions in the codons were all less than 50%, with the highest at the first position (47.43%), the lowest at the third position (30.07%), and uniformly 40.30% at the second position. The average ENC values of Chloranthus ranged from 46.23 to 46.32.

Table 1.
Basic parameters of codon usage bias of chloroplast genome in Chloranthus.
To determine the key factors influencing codon usage bias, the correlation analysis of base composition parameters was conducted for the chloroplast genomes of seven Chloranthus species. The results showed that there was no significant correlation between GC1, GC2, and GC3 pairwise (Table 2 and Table S3). Specifically, the effective number of codons (ENC) showed a significant positive correlation with the codons number in all the seven species. Moreover, the ENC had a significant negative correlation with the GC2 content in C. erectus, C. henryi, and C. fortunei, while having a significant positive correlation with the GC3 content in C. japonicus, C. erectus, and C. henryi. These results indicated that the base composition similarity is relatively low at different positions of the chloroplast genome in Chloranthus species.
Table 2.
Correlation analysis of codon parameters in Chloranthus species.
3.4. Neutrality Plot Analysis
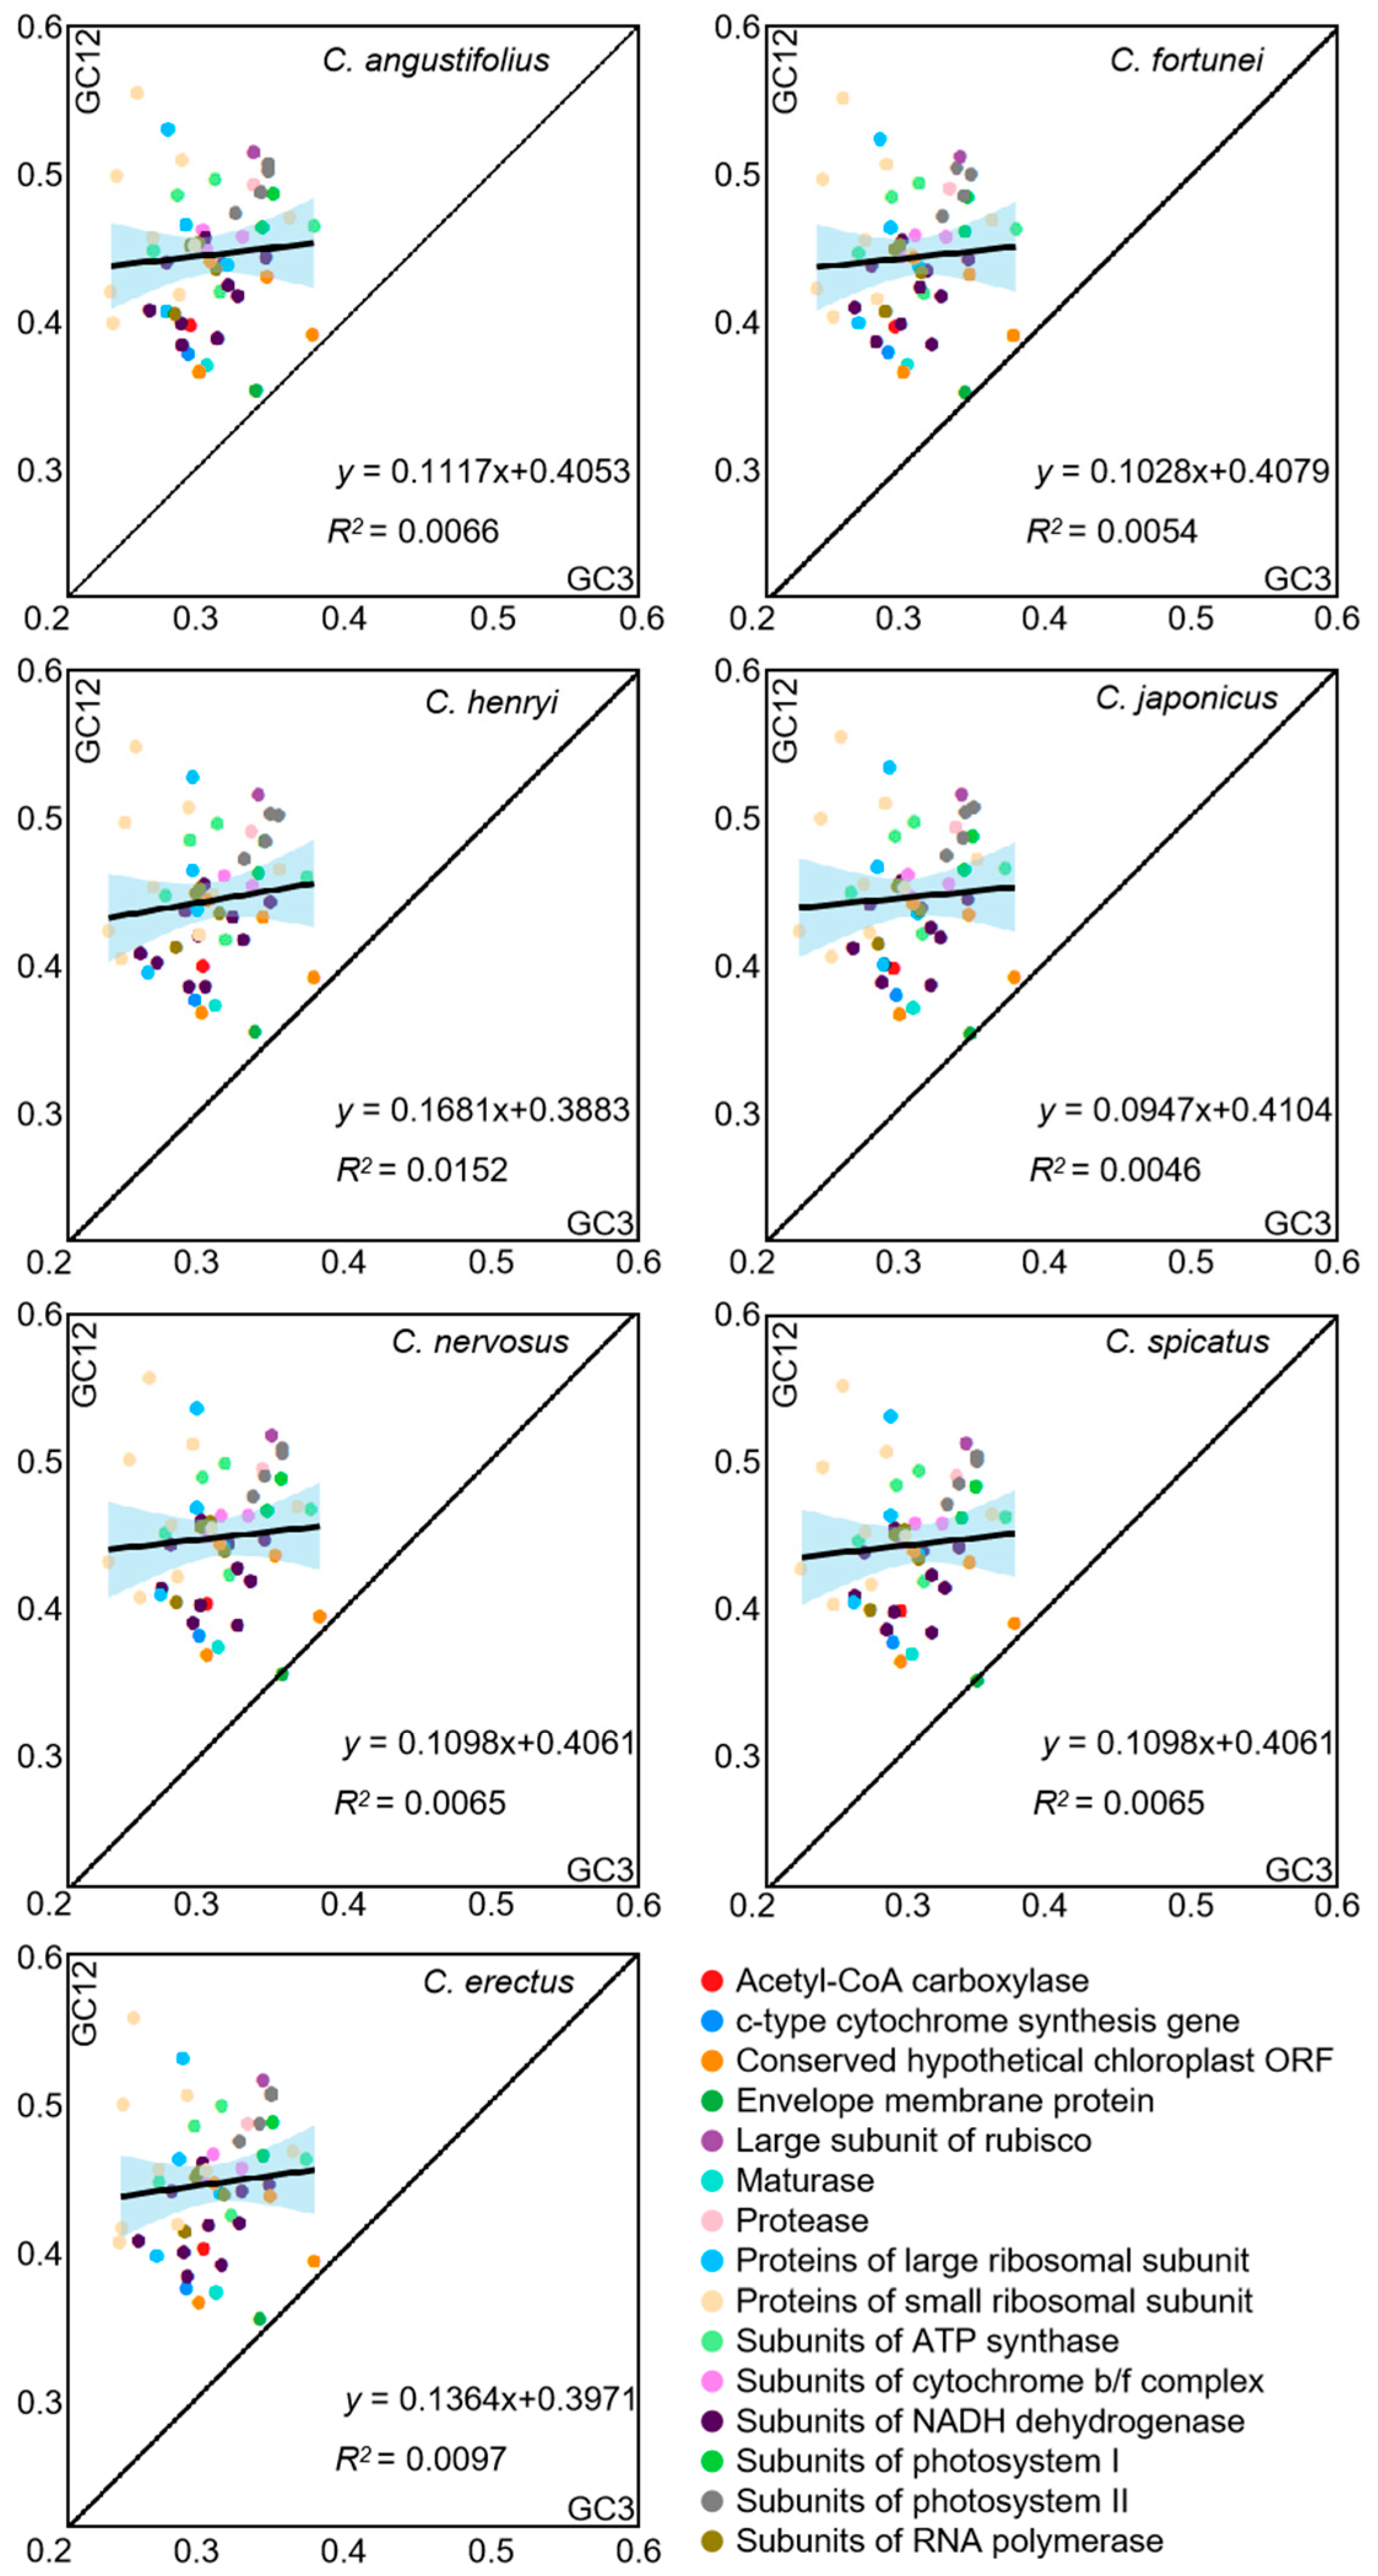
To reflect the extent to which natural selection and mutational pressure influence codon bias, neutrality plot analysis between GC12 and GC3 was carried out in the chloroplast genome of Chloranthus (Figure 4). The majority of genes were distributed above the diagonal, with only a few genes (cemA and ycf2) lying along the diagonal. The slope ranges from 0.0947 to 0.1681, and R2 ranges from 0.0046 to 0.0152, which indicated significant differences in base content at different positions and a weak correlation between GC12 and GC3. The influence of mutation on codon usage patterns accounts for 0.0947 to 0.1681, while the influence of selective pressure on codon usage patterns accounts for 0.8319 to 0.9053. This result showed that the codon preference in the chloroplast genomes of Chloranthus species is primarily influenced by selective pressure.
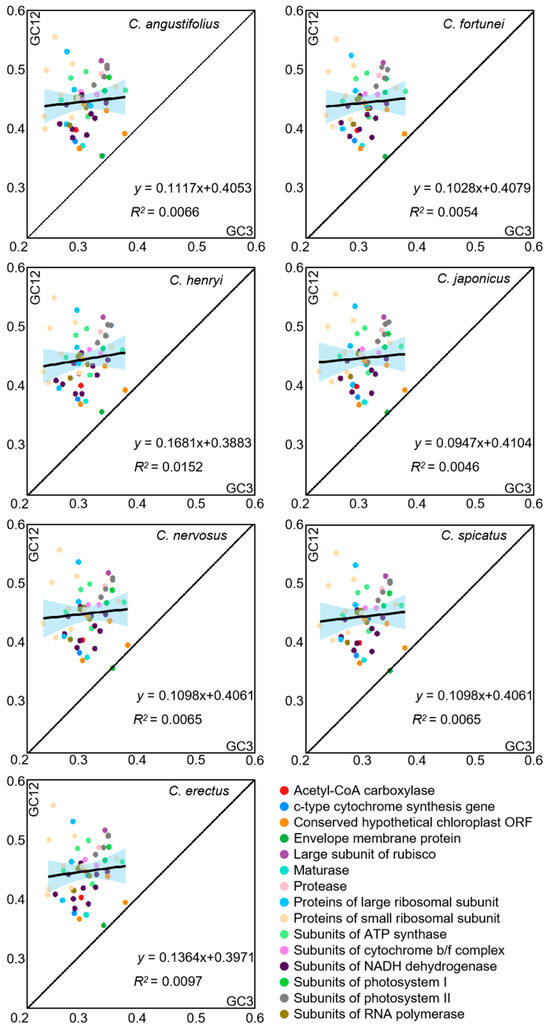
Figure 4.
Neutrality plot of chloroplast CDSs in different species. The black line in the plot illustrates the correlation trend, with the corresponding equation displayed at the bottom of the graph.
3.5. ENC-Plot Analysis
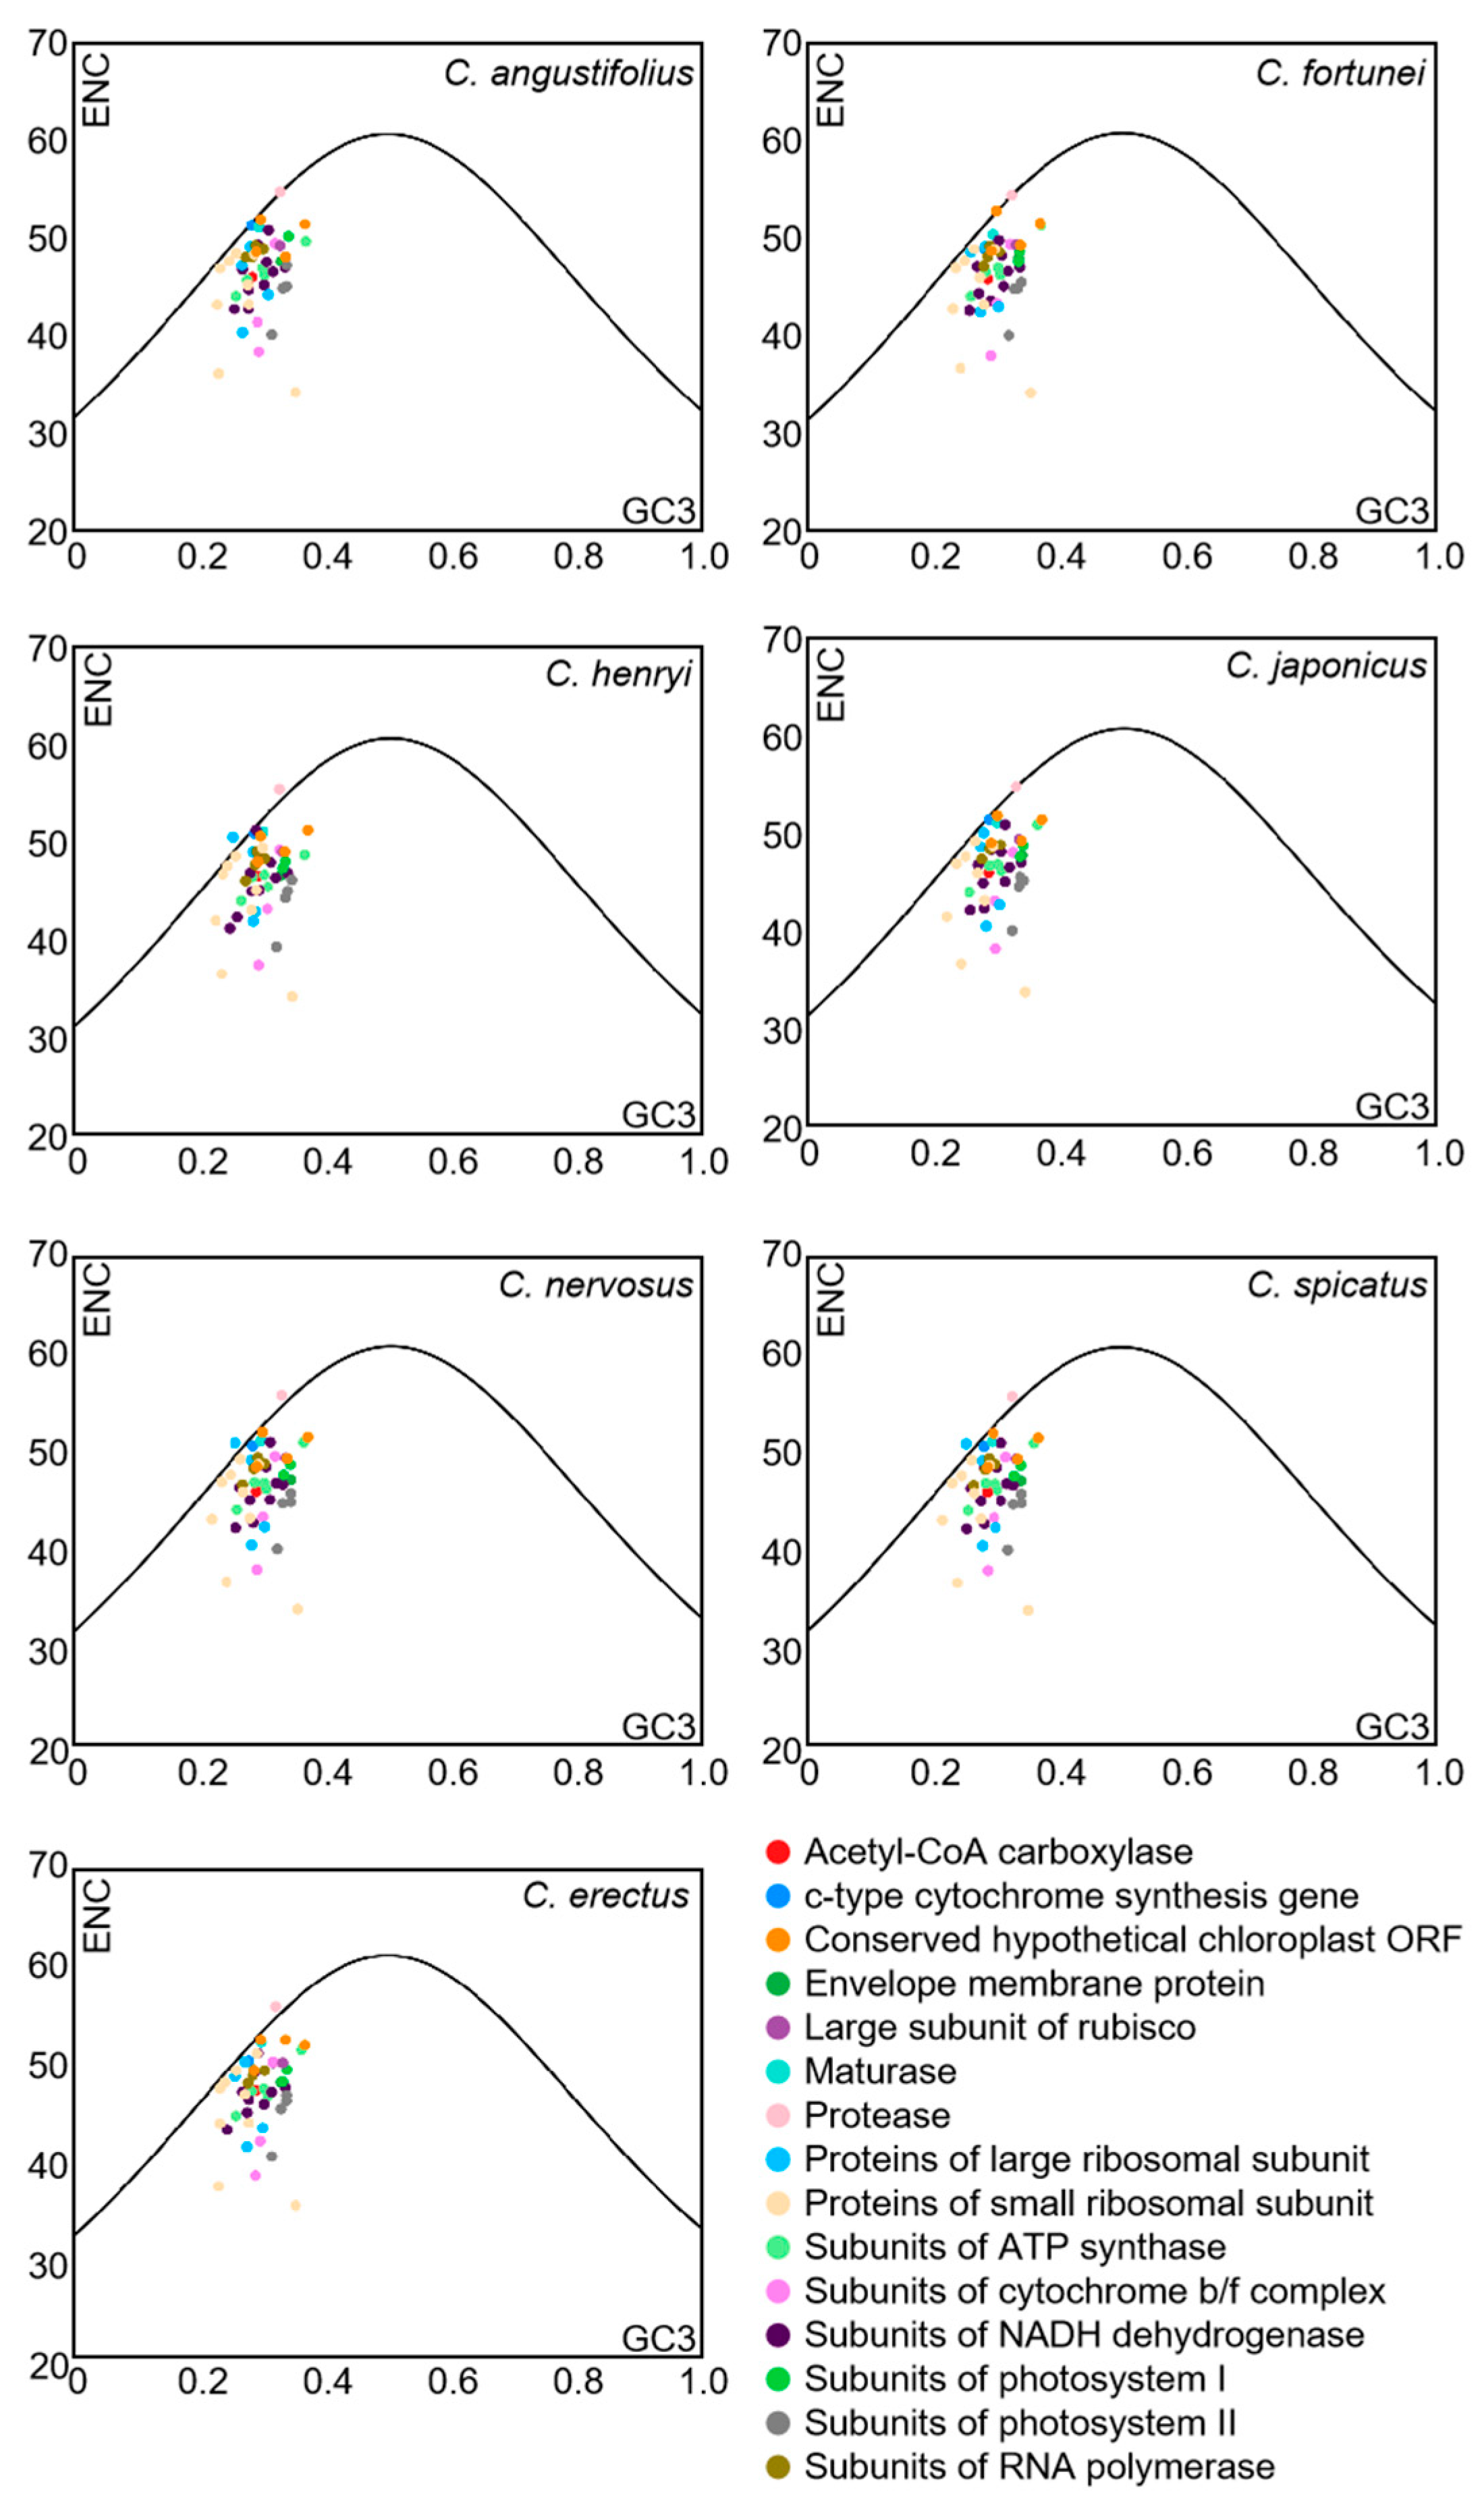
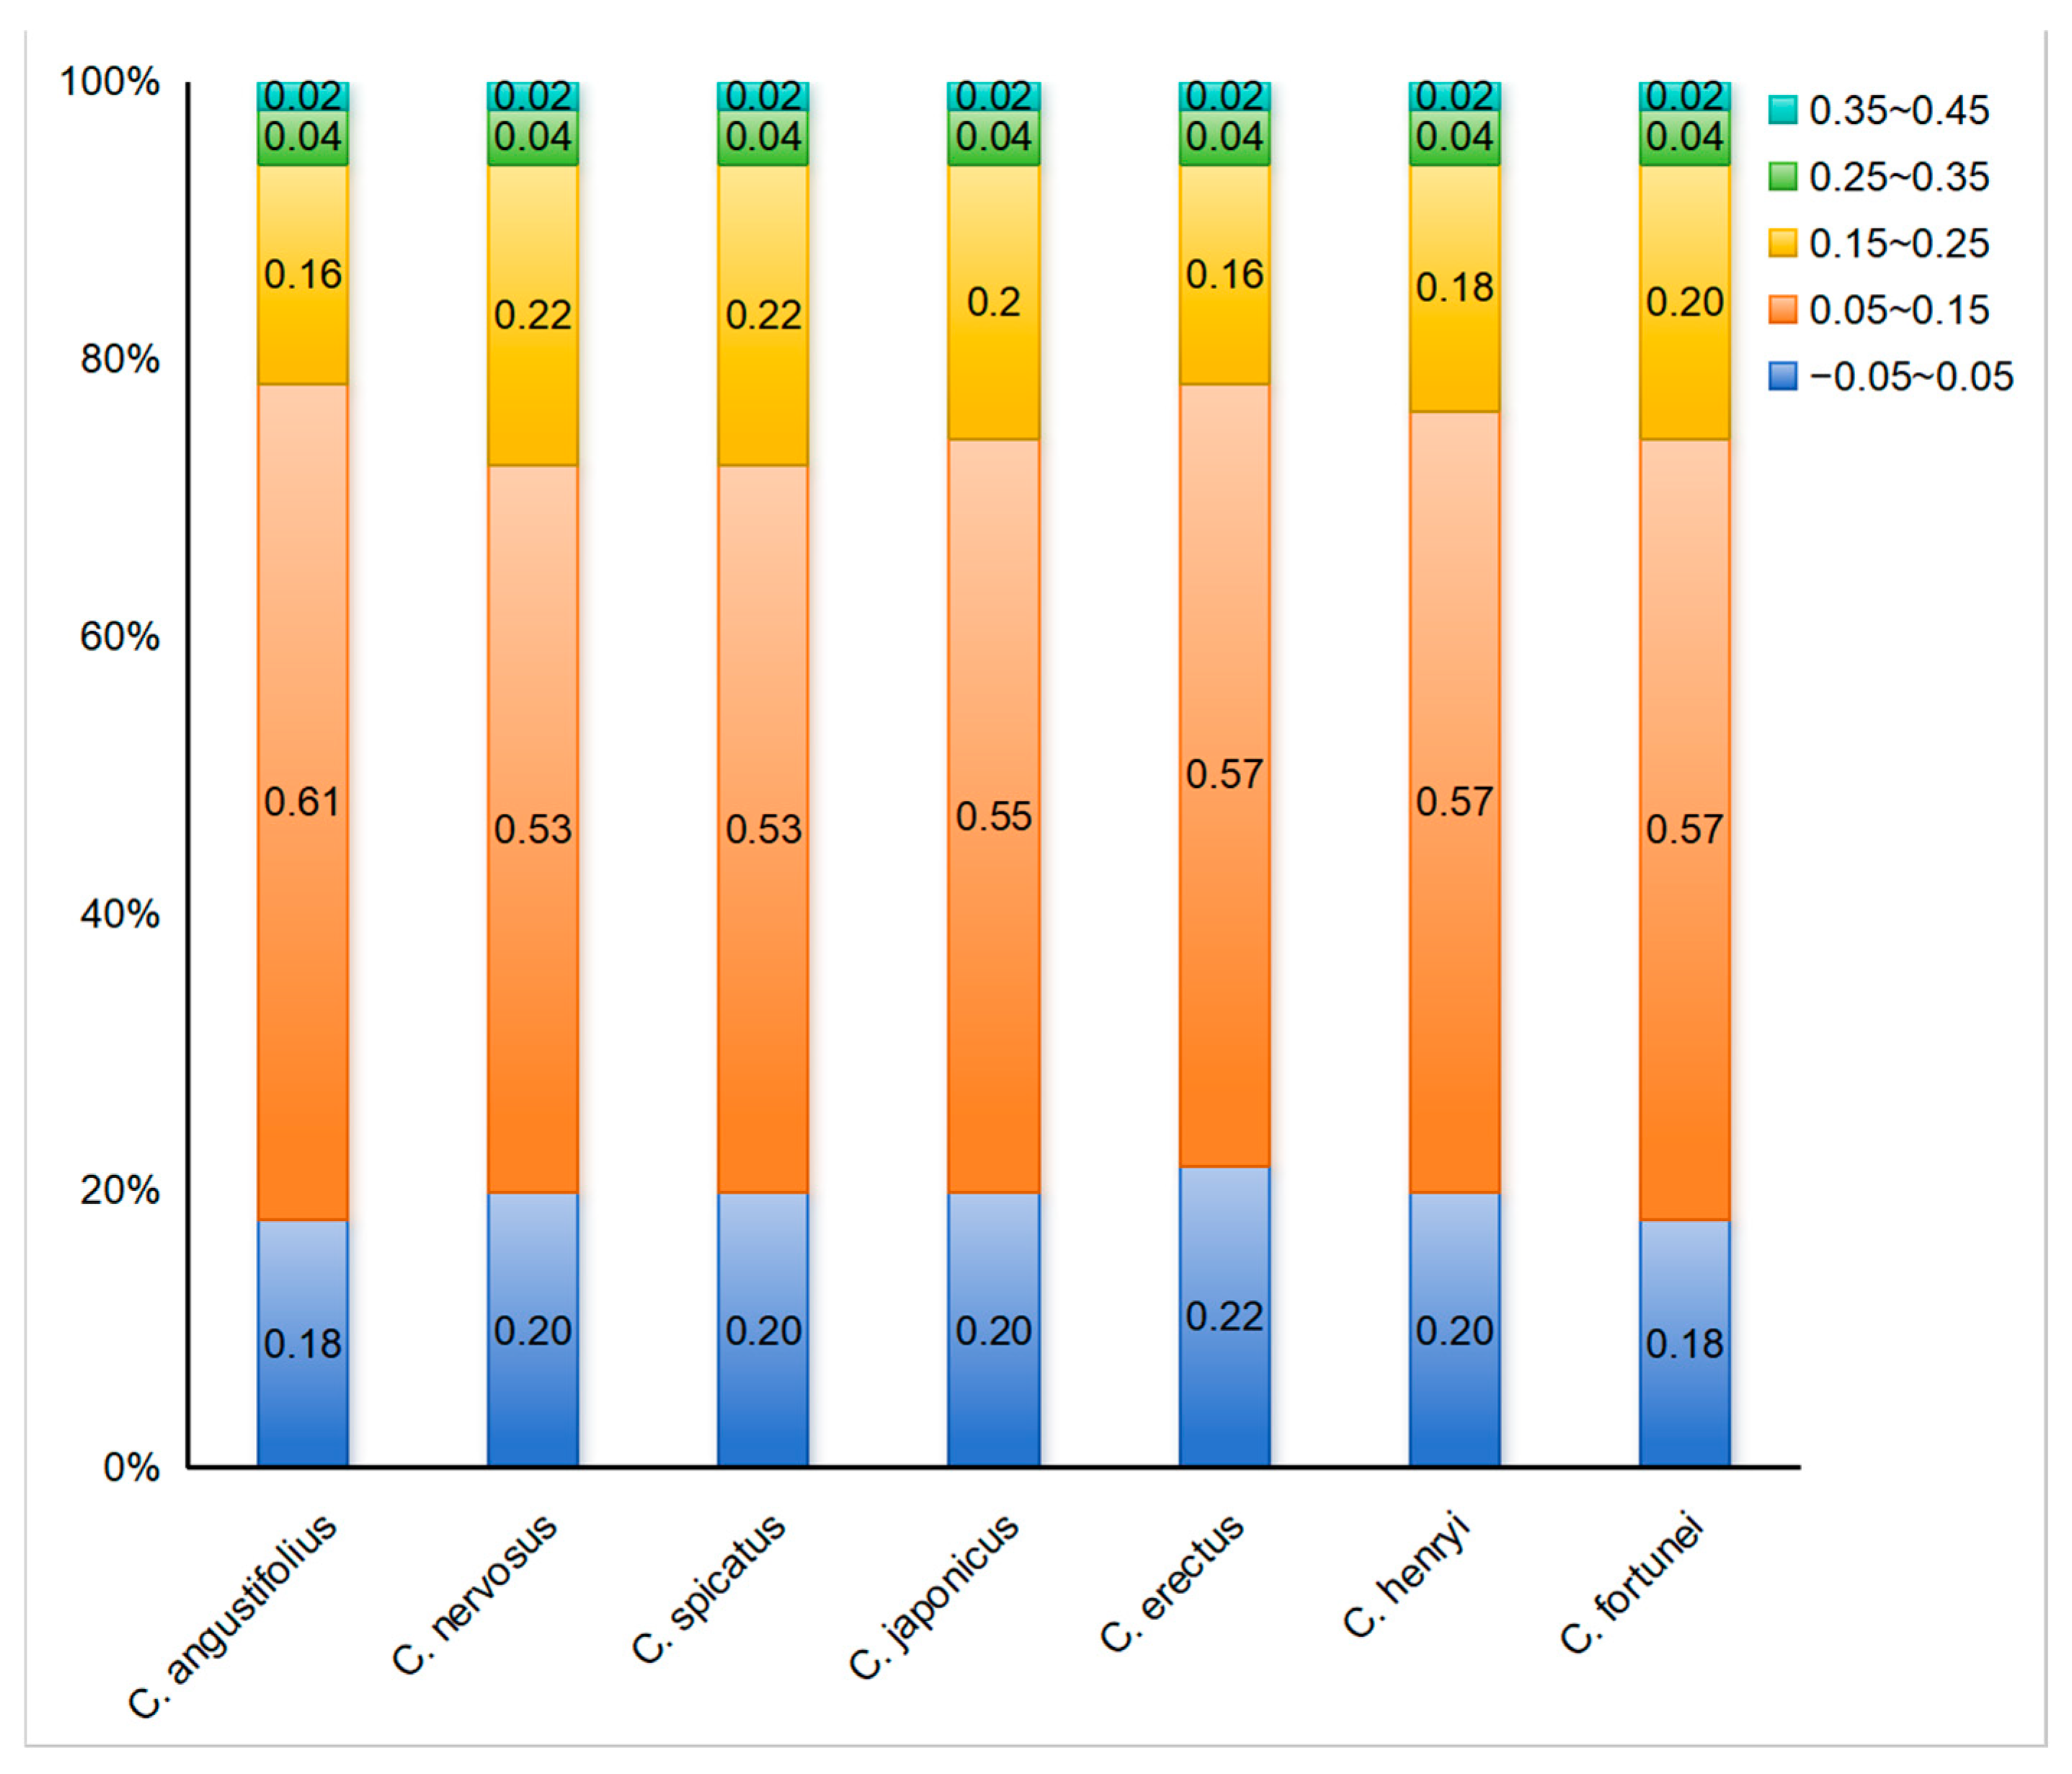
To further reflect the influence of mutation or selective pressure on codon usage preference, the ENC-plot analysis was employed to indicate the magnitude of the difference between ENCobs and ENCexp. The ENC-plot graphs of the chloroplast-encoded genes of the seven Chloranthus species were similar, with most genes located below the standard curve, indicating a significant deviation between ENCobs and ENCexp for the majority of the genes (Figure 5). Additionally, there were 9–11 genes with ENC ratios distributed between −0.05 and 0.05, accounting for 18%–22% of the 51 selected CDSs (Figure 6), and ENCobs was relatively close to ENCexp. There were 40–42 genes with ENC ratios outside the range of −0.05 to 0.05, accounting for 78% to 82% of the 51 selected CDSs. For these genes, there was a significant deviation between ENCobs and ENCexp, which indicated that their codon preference was more influenced by natural selection. These results suggested that the codon usage preference in the chloroplast genomes of Chloranthus species was less influenced by mutation and more influenced by natural selection.
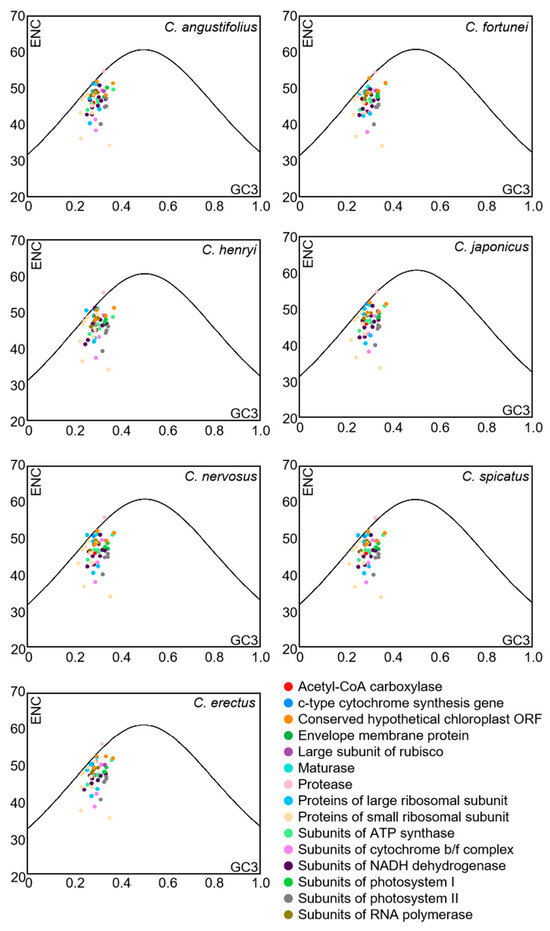
Figure 5.
ENC-plot analysis of chloroplast CDSs in Chloranthus species. If a data point is significantly distant from the standard curve, this indicates that the codon usage bias of chloroplast coding sequences is predominantly influenced by natural selection.
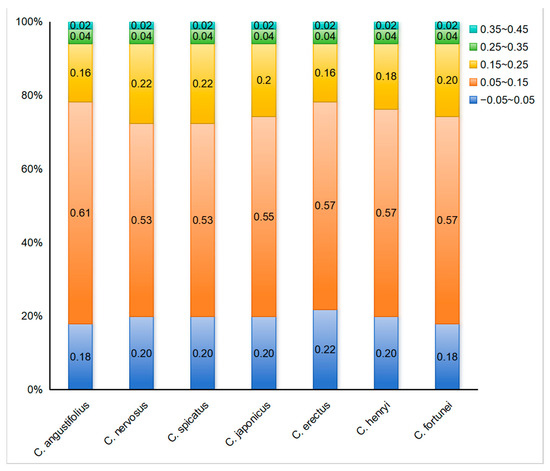
Figure 6.
Distribution of ENC ratio frequency in Chloranthus. If codon usage bias is predominantly influenced by mutational pressure, then the ENC ratio of most genes should fall within the range of −0.05 to 0.05.
3.6. Parity-Rule 2 (PR2) Bias Plot Analysis
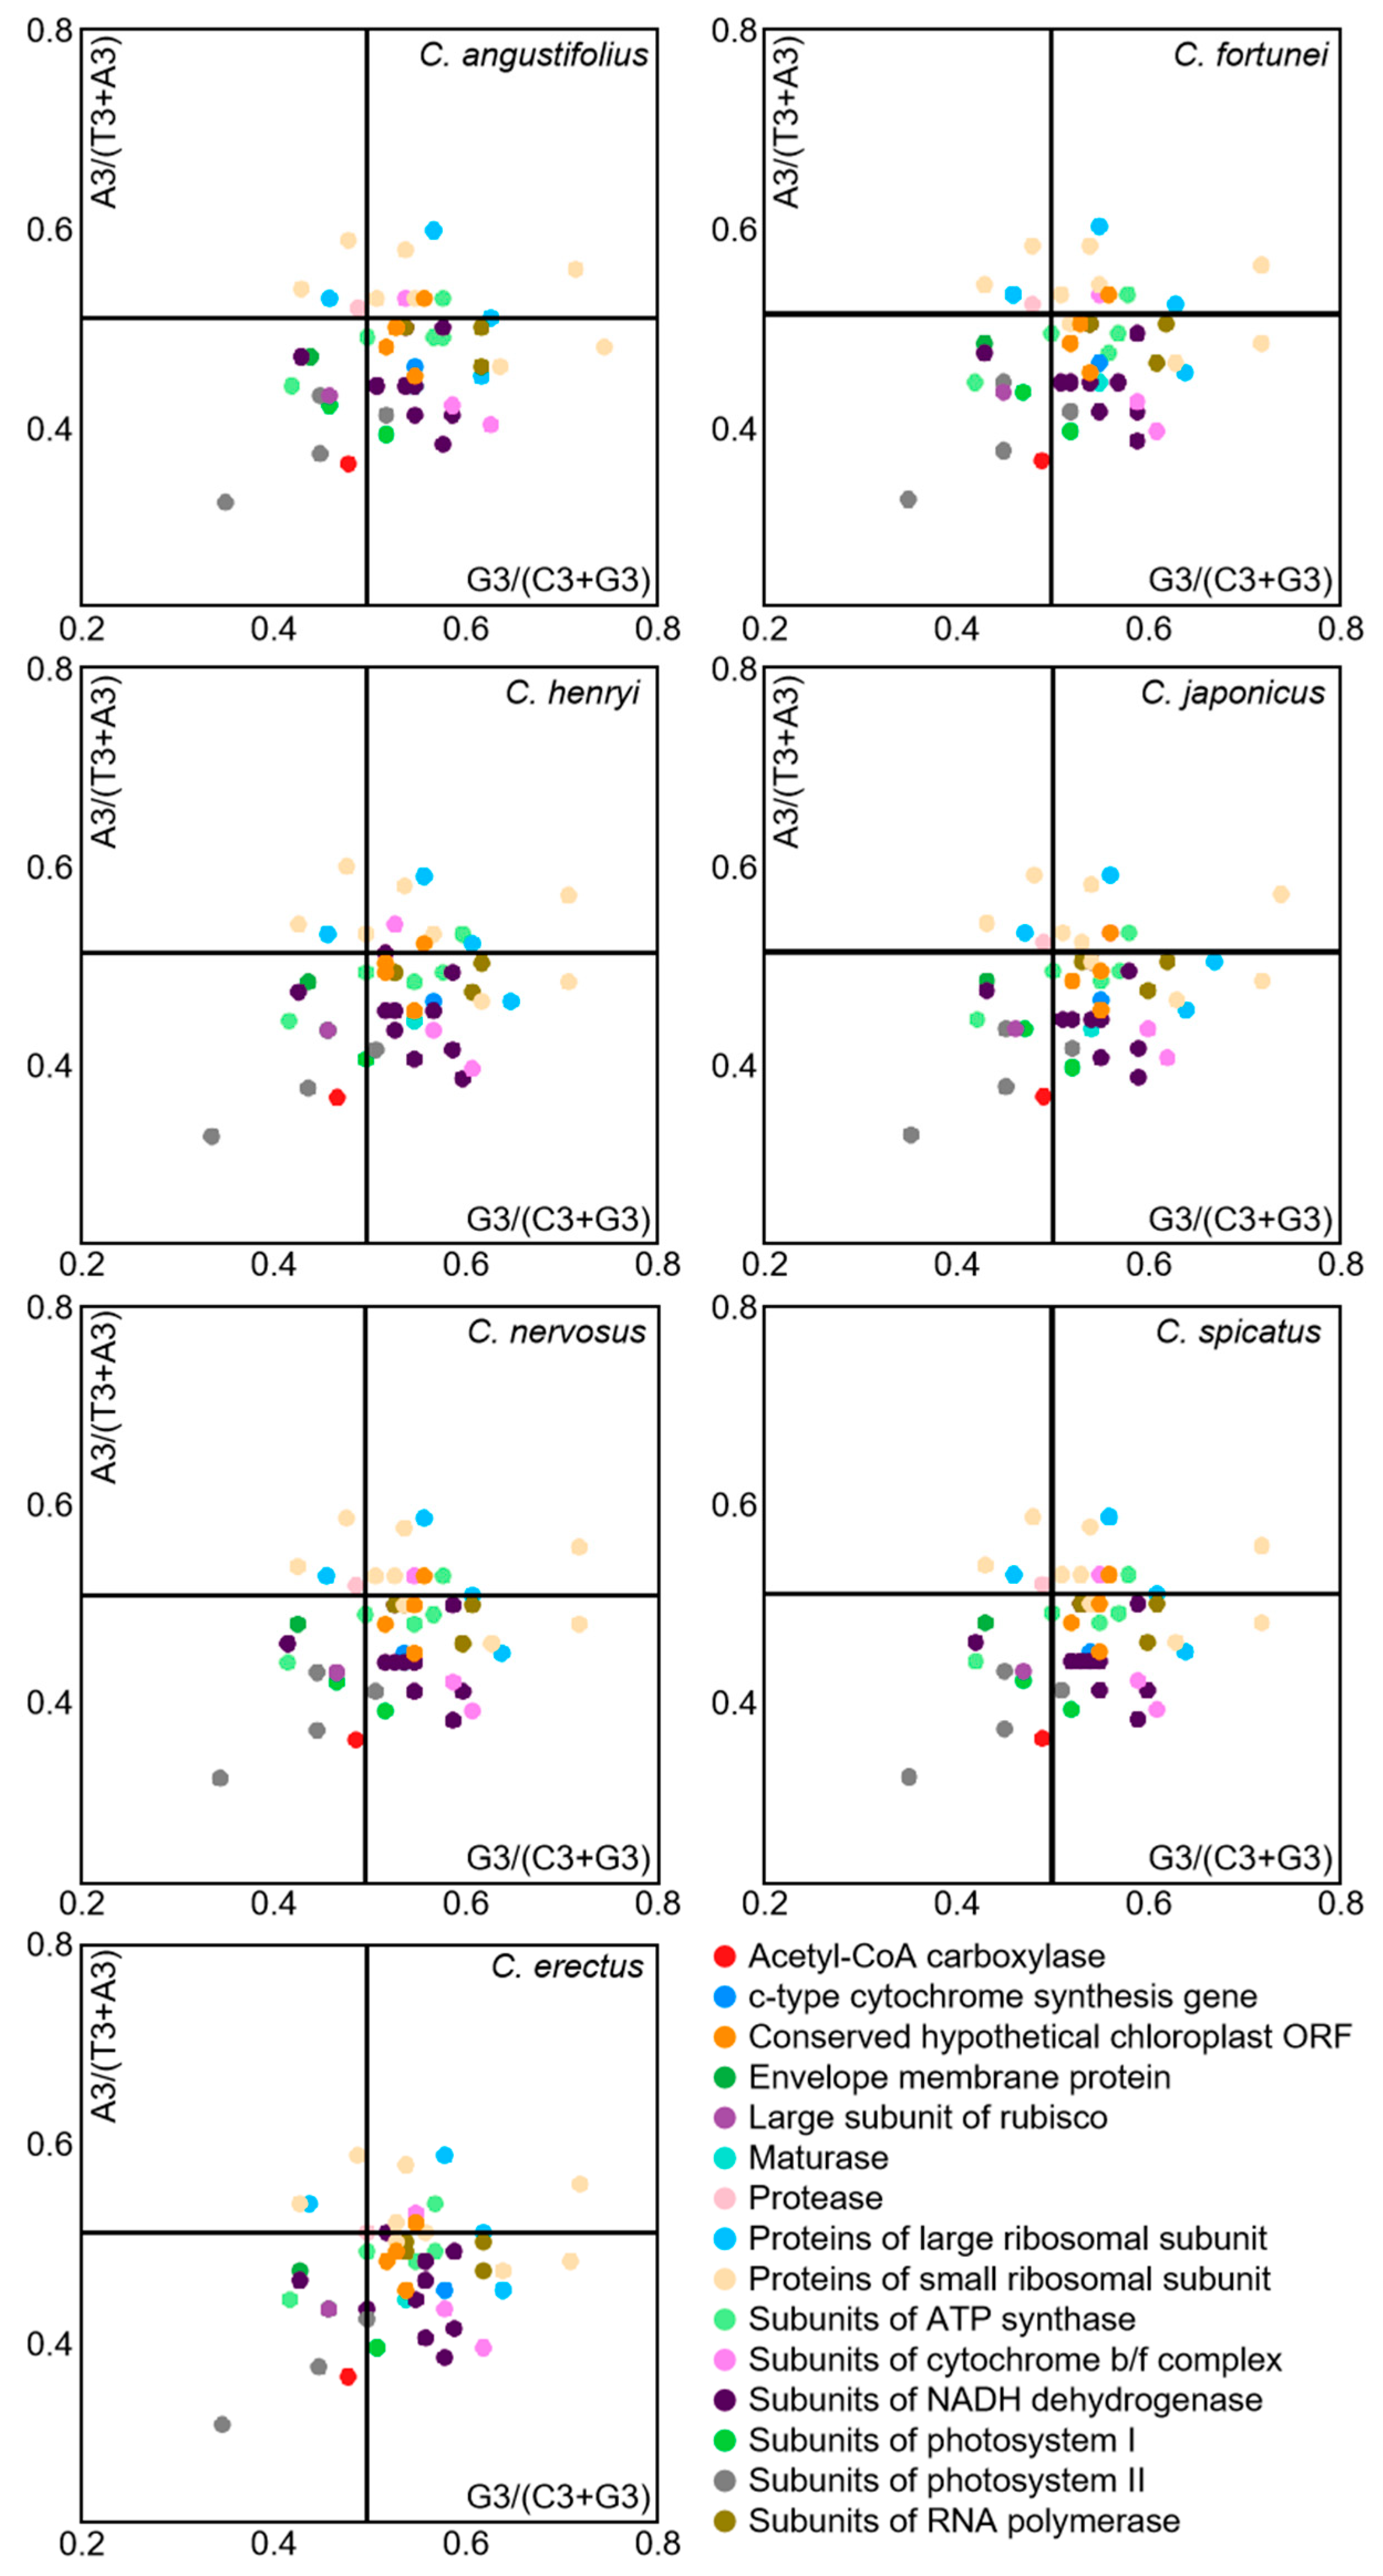
Under the sole effect of mutational pressure, the randomness of mutations makes the probability of the third position base in a codon being A/T or C/G equal. However, when influenced by natural selection pressure, the usage frequencies of A/T or G/C become unequal. Codon preference analyses in the chloroplast genome of Chloranthus were conducted through PR2-plot graphing (Figure 7). The scatter distribution in the four regions of the PR2-plot were uneven, with most genes located in the lower half of the plot, particularly with the highest number of genes located in the lower right quadrant. This observation indicated that the usage frequency of the third base U is higher than that of A, and the usage frequency of G is higher than that of C. Moreover, the third base of codons in the chloroplast genome of Chloranthus exhibits a certain preference in selection, which is influenced by a combination of selective pressure and other factors, with natural selection being the primary factor.
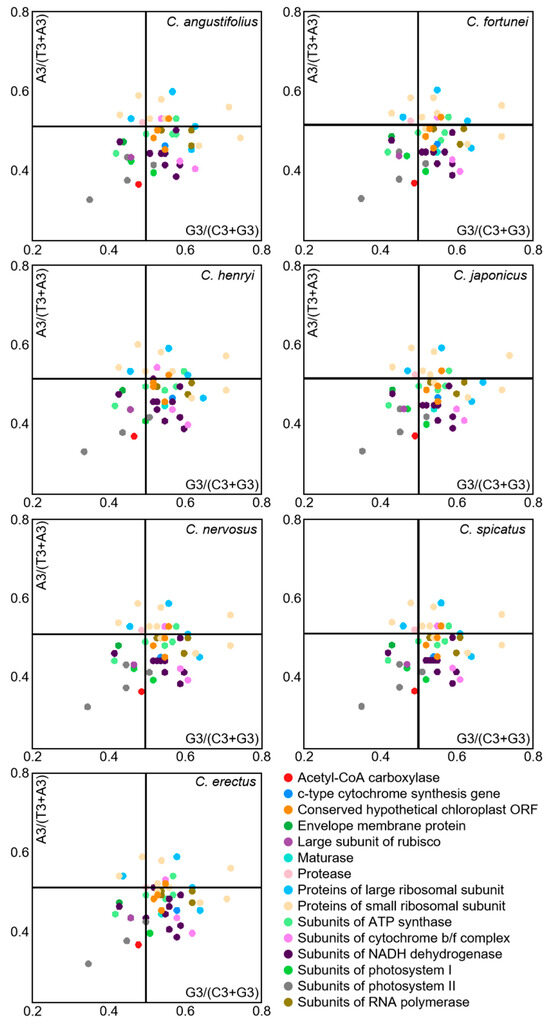
Figure 7.
PR2-plot analysis of chloroplast CDSs in Chloranthus species. The GC bias is plotted on the x-axis, while the AT bias is plotted on the y-axis.
3.7. Identification of Optimal Codons
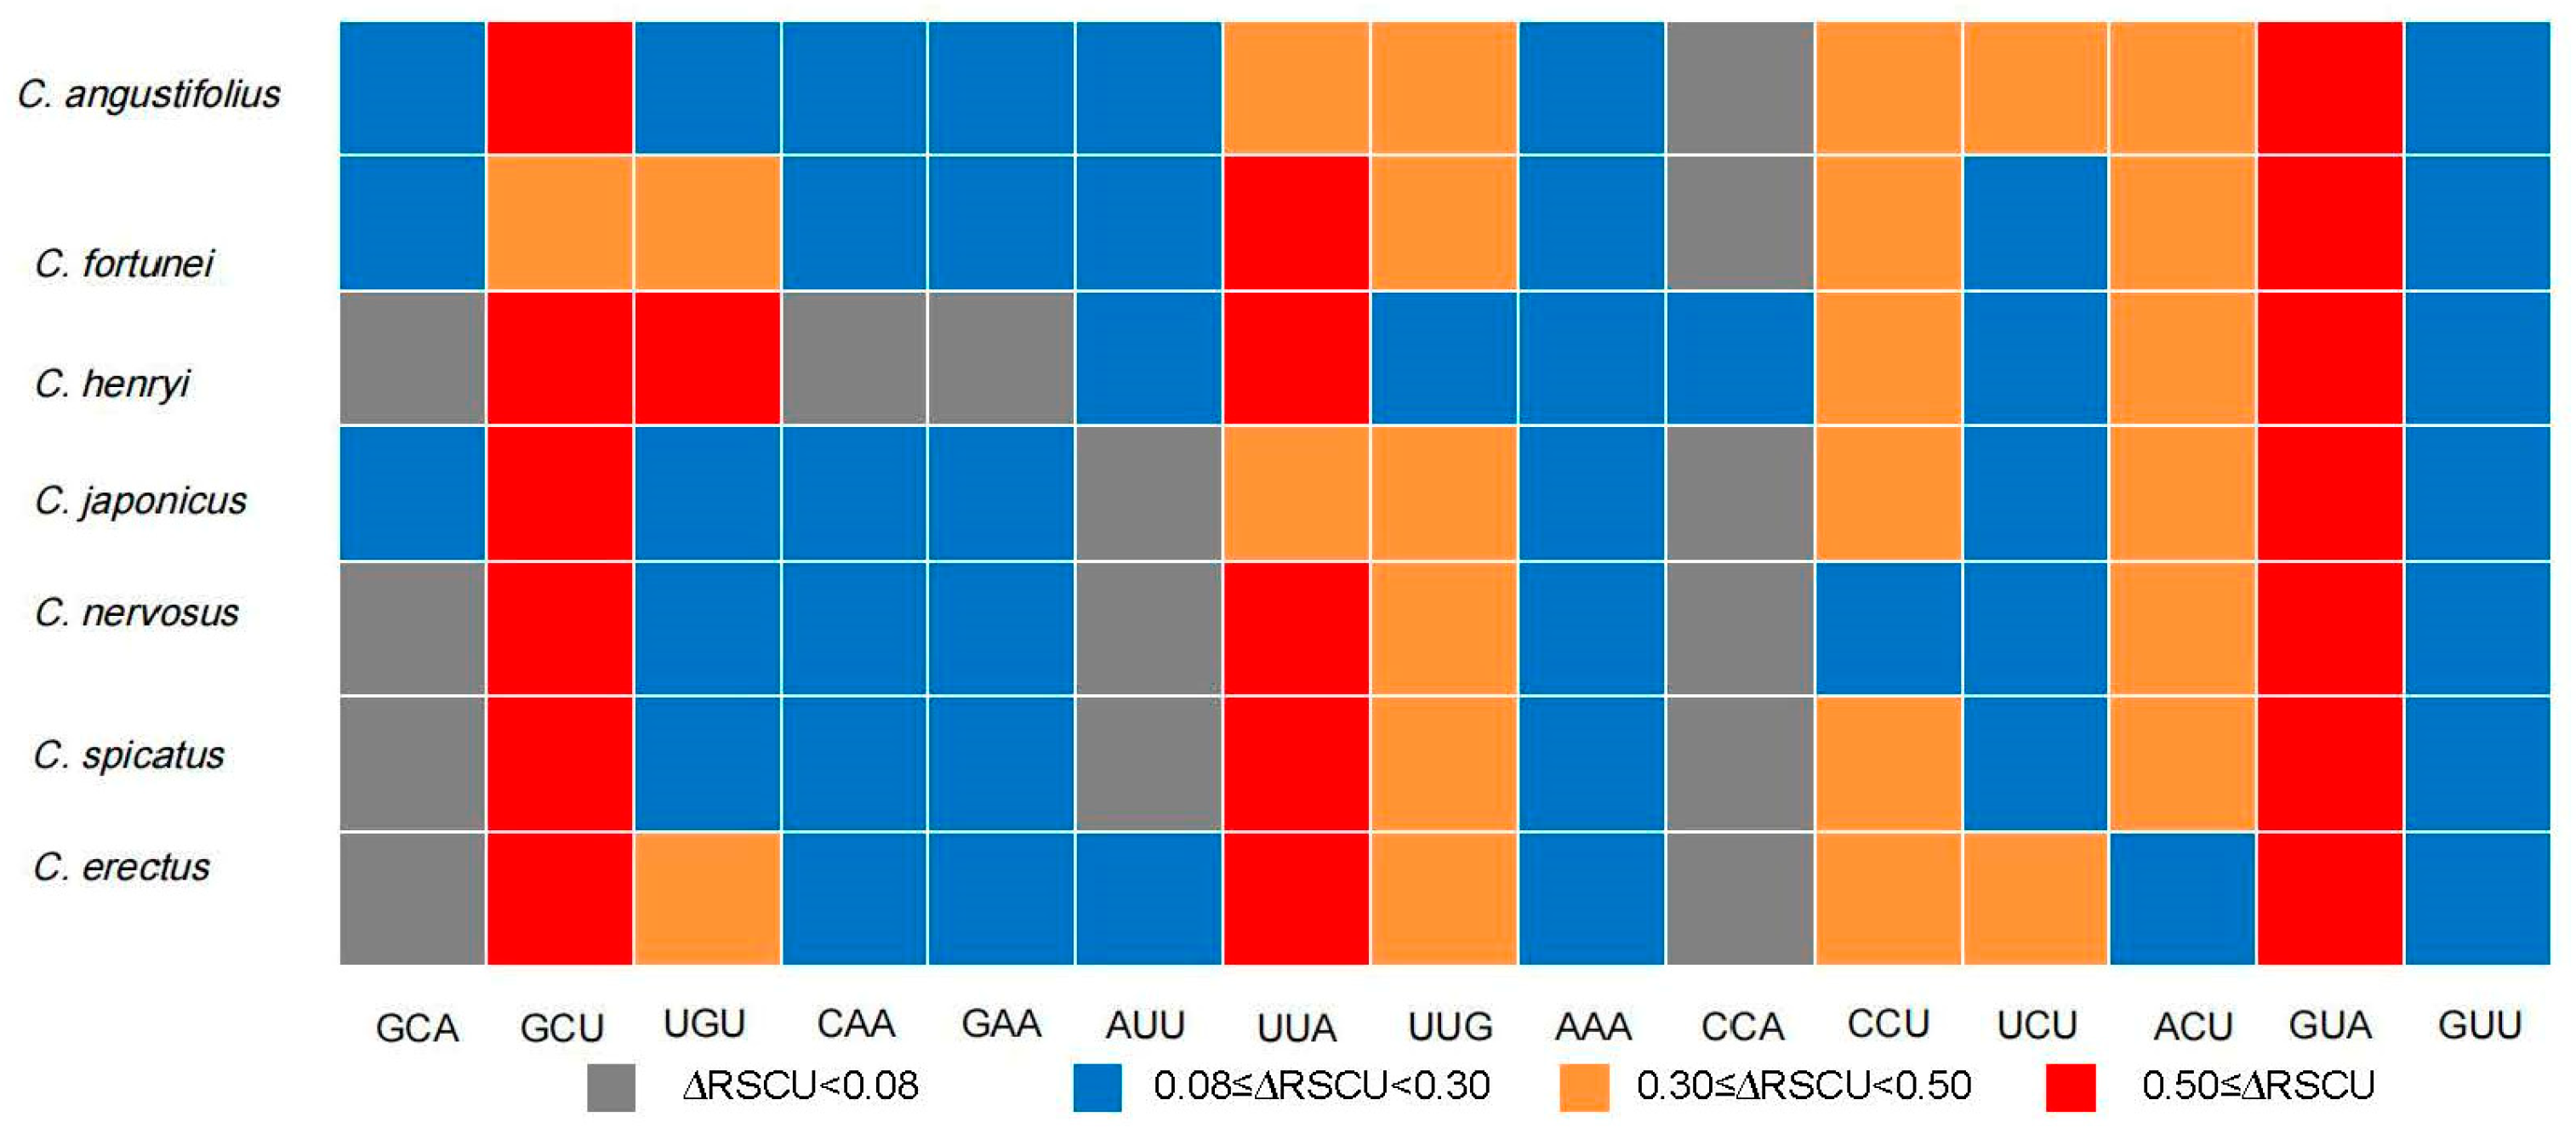
The 51 protein-coding genes in the chloroplast genome of Chloranthus were analyzed as a whole. By constructing high-expression and low-expression gene pools, the RSCU values for these two gene pools were calculated separately. The results showed that the optimal codon number of chloroplast genomes in Chloranthus ranged from 12 to 14 (Figure 8). Among them, C. angustifolius and C. fortunei had the highest number of optimal codons, while C. henryi, C. nervosus, and C. spicatus had the lowest number of optimal codons. The shared optimal codons in the chloroplast genomes of the Chloranthus species are GCU, UGU, UUA, UUG, AAA, CCU, UCU, ACU, GUA, and GUU (Figure 8). Moreover C. henryi had one unique optimal codon of CCA, which encoded proline. Among the shared optimal codons, only GUA encoding valine had an ∆RSCU greater than 0.5 in all of the species (Table S4). Excluding UUG, there was a preference for optimal codons ending with A/U bases in Chloranthus.
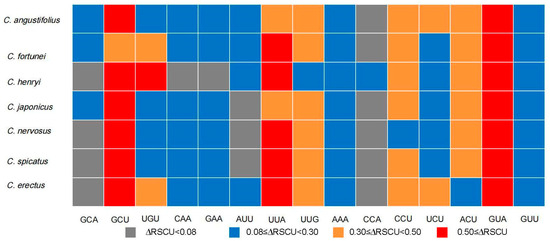
Figure 8.
Optimal codons used in the chloroplast genomes of Chloranthus.
4. Discussion
4.1. The Chloroplast Characters and Phylogenetic Relationships Among Chloranthus
In this study, we newly obtained a chloroplast genome of C. angustifolius. Combined with the six published chloroplast genomes of this genus, we found that the chloroplast genome sizes of the seven species ranged between 157,063bp (C. fortunei) and 158,758 bp (C. spicatus), with a variation of 1695 bp. Additionally, 131 genes were annotated in the chloroplast genomes of all seven species, comprising 86 CDSs, 37 tRNAs, and 8 rRNAs, with 39.2–39.3% GC contents. These results implied that the chloroplast genome sequences and GC contents within the genus Chloranthus are conserved. The high conservatism of plastome has also been observed in other angiosperm genera [48,49].
The phylogenetic tree showed that C. angustifolius and C. fortunei were clustered together with the highest supporting values (Figure 2), which is completely consistent with the results of Yao et al. [29]. Also, based on chloroplast genomes, the division of Chloranthus species into two major clades is well supported (Figure 2), and these results are similar with the phylogenetic results of Kong et al. [20] and Zhang et al. [23].
4.2. Natural Selection Plays a Key Role in the Codons Usage of Chloranthus
The preference for synonymous codon usage is shaped by a combination of factors, including natural selection and base mutation. According to the neutral theory of molecular evolution, the impact of natural selection and base mutations on the third base of codons in an organism’s genome is mostly neutral or nearly neutral [50]. In this study, our results showed that the proportion of A/T bases in the chloroplast genomes was higher than that of G/C (Table 1; Figure 3 and Figure 7), indicating a preference for using A/U bases in codons. Previous studies have shown that the GC content at the third position of codons (GC3) can serve as an important indicator for assessing codon usage preference [51]. Furthermore, the overall GC content of codons and the GC content at each of the three codon positions in Chloranthus species were all less than 50%, and they exhibited a trend of GC1 > GC2 > GC3 (Table 1), which indicated an uneven distribution of codons with a preference for A/U termination [51]. The results were consistent with patterns found in most angiosperms [52]. The analysis of the ENC values in seven species showed that all of them were greater than 45 (Table 1), suggesting a relatively weak codon usage bias in the genus Chloranthus [41,53,54]. Additionally, there was no significant correlation between the ENC values and GC1 and GC3 (Table 2 and Table S3), which was mainly influenced by the base composition at the second position (GC2) and the length of the chloroplast gene sequence. Considering the differential usage among the three base positions, it is inferred that the codon preference characteristics of the chloroplast genomes of these seven Chloranthus species are more influenced by natural selection pressure than by mutation (Figure 4, Figure 5 and Figure 6) [42,43,55,56]. A previous study proposed that codons usage bias in Delphinium grandiflorum was shaped by natural selection [57]. Therefore, the codon bias in plants can be affected by various factors, which may differ among species. The codon usage results of Chloranthus species here are consistent with the other angiosperms, such as Nymphaea [58], Theaceae [59], Asteraceae [60], and Solanaceae [61]. The above results collectively indicate that the codon usage frequency in the chloroplast genome of the Chloranthus genus is relatively consistent with that of most dicotyledonous plants, suggesting an absence of significant specific changes during its long-term evolution, which may contribute to its relatively weak codon usage bias.
4.3. Optimal Codons Offers New Insights for Chloroplast Genetic Engineering in Chloranthus
Codon usage frequency is commonly employed to compare the codon selection preferences among different species, serving as a valuable reference for optimizing the heterologous expression of target genes [62,63]. Based on the RSCU values (RSCU > 1 and ∆RSCU ≥ 0.8) of codons in the chloroplast genomes of seven Chloranthus species, 10 high-frequency codons (GCU, UGU, UUA, UUG, AAA, CCU, UCU, ACU, GUA, and GUU) were identified for the shared optimal codons, with 9 ending in A/U (Figure 8). The result of a preference for codons ending in A or U is consistent with more eudicot plants [64], such as primitive angiosperm groups Magnoliaceae [65] and Nymphaea [58]. Furthermore, the optimal codons in plant chloroplast genomes can significantly enhance the accuracy and efficiency of amino acid translation, thereby promoting gene expression. Through our analysis of codon preference and determination of optimal codons in the Chloranthus chloroplast genome, this study provides a valuable reference for optimizing exogenous genes to improve their expression efficiency within the Chloranthus chloroplast.
5. Conclusions
In this study, we newly sequenced the chloroplast genome of C. angustifolius, which was found to be sister to C. fortunei with the highest support values. Our analysis of codon usage revealed a tendency for Chloranthus species to prefer codons ending in A or U within their chloroplast genomes, and ten high-frequency codons were identified within Chloranthus species. These findings provide a critical reference for optimizing codon usage and enhancing the expression efficiency of exogenous genes in future chloroplast engineering efforts within this genus. Additionally, the neutrality plot, PR2 bias plot, and ENC-plot collectively indicated that natural selection is the predominant force shaping codon usage patterns. This study offers a preliminary yet comprehensive examination of codon usage patterns and influencing factors in Chloranthus species. However, the relatively small sample size of seven Chloranthus species may not fully capture the diversity within the genus and the analysis was limited to chloroplast genomes, and further studies incorporating nuclear and mitochondrial genomes could provide a more comprehensive understanding of codon usage bias in Chloranthus.
Supplementary Materials
The following supporting information can be downloaded at: https://www.mdpi.com/article/10.3390/genes16020186/s1, Table S1: List of gene contents in C. angustifolius; Table S2: The CDS numbers in the chloroplast genome of Chloranthus species; Table S3: The p-value of codon parameters in Chloranthus species. Table S4: Optimal codons in chloroplast genomes of seven Chloranthus species.
Author Contributions
Conceptualization, data curation, original draft preparation, J.Z. and M.F.; Investigation, funding acquisition, supervision, writing—review and editing, J.Z. All authors have read and agreed to the published version of the manuscript.
Funding
This research was supported by funding from Liaoning Key Laboratory of Development [LZ202301].
Institutional Review Board Statement
Not applicable.
Informed Consent Statement
Not applicable.
Data Availability Statement
The chloroplast genome sequence supporting this study has been uploaded to GenBank (National Center for Biotechnology Information) with the accession number MW581013. The associated BioProject, SRA, and Bio-Sample numbers are PRJNA692276, SRR13447375, and SAMN17319709, respectively. Additional materials supporting the results of this article are included in the Supplementary Files.
Conflicts of Interest
The authors declare no conflict of interest.
References
- Li, N.; Li, Y.; Zheng, C.; Huang, J.; Zhang, S. Genome-wide comparative analysis of the codon usage patterns in plants. Genes Genom. 2016, 38, 723–731. [Google Scholar] [CrossRef]
- Iriarte, A.; Lamolle, G.; Musto, H. Codon usage bias: An endless tale. J. Mol. Evol. 2021, 89, 589–593. [Google Scholar] [CrossRef] [PubMed]
- Chakraborty, S.; Yengkhom, S.; Uddin, D.A. Analysis of codon usage bias of chloroplast genes in Oryza species. Planta 2020, 252, 67. [Google Scholar] [CrossRef]
- Tyagi, S.; Kabade, P.G.; Gnanapragasam, N.; Singh, U.M.; Singh Gurjar, A.K.; Rai, A.; Sinha, P.; Kumar, A.; Singh, V.K. Codon usage provide insights into the adaptation of rice genes under stress condition. Int. J. Mol. Sci. 2023, 24, 1098. [Google Scholar] [CrossRef]
- Fages-Lartaud, M.; Hundvin, K.; Hohmann-Marriott, M.F. Mechanisms governing codon usage bias and the implications for protein expression in the chloroplast of Chlamydomonas reinhardtii. Plant J. 2022, 112, 919–945. [Google Scholar] [CrossRef] [PubMed]
- Romero, H.; Zavala, A.; Musto, H. Codon usage in Chlamydia trachomatis is the result of strand-specific mutational biases and a complex pattern of selective forces. Nucl. Acid. Res. 2000, 28, 2084–2090. [Google Scholar] [CrossRef] [PubMed]
- Duret, L. tRNA gene number and codon usage in the C. elegans genome are co-adapted for optimal translation of highly expressed genes. Trends Genet. 2000, 16, 287–289. [Google Scholar] [CrossRef] [PubMed]
- Xu, C.; Cai, X.-N.; Chen, Q.-Z.; Zhou, H.-X.; Cai, Y.; Ben, A.-L. Factors affecting synonymous codon usage bias in chloroplast genome of Oncidium Gower Ramsey. Evol. Bioinform. 2011, 7, 271–278. [Google Scholar] [CrossRef]
- Dobrogojski, J.; Adamiec, M.; Luciński, R. The chloroplast genome: A review. Acta Physiol. Plant. 2020, 42, 98. [Google Scholar] [CrossRef]
- Green, B.R. Chloroplast genomes of photosynthetic eukaryotes. Plant J. 2011, 66, 34–44. [Google Scholar] [CrossRef] [PubMed]
- Daniell, H.; Lin, C.-S.; Yu, M.; Chang, W.-J. Chloroplast genomes: Diversity, evolution, and applications in genetic engineering. Genome Biol. 2016, 17, 134. [Google Scholar] [CrossRef]
- Daniell, H.; Jin, S.; Zhu, X.-G.; Gitzendanner, M.A.; Soltis, D.E.; Soltis, P.S. Green giant-a tiny chloroplast genome with mighty power to produce high-value proteins: History and phylogeny. Plant Biotechnol. J. 2021, 19, 430–447. [Google Scholar] [CrossRef] [PubMed]
- Li, Y.-T.; Dong, Y.; Liu, Y.-C.; Yu, X.-Y.; Yang, M.-S.; Huang, Y.-R. Comparative analyses of Euonymus chloroplast genomes: Genetic structure, screening for loci with suitable polymorphism, positive selection genes, and phylogenetic relationships within Celastrineae. Front. Plant Sci. 2021, 11, 593984. [Google Scholar] [CrossRef] [PubMed]
- Hao, J.; Liang, Y.; Ping, J.; Li, J.; Shi, W.; Su, Y.; Wang, T. Chloroplast gene expression level is negatively correlated with evolutionary rates and selective pressure while positively with codon usage bias in Ophioglossum vulgatum L. BMC Plant Biol. 2022, 22, 580. [Google Scholar] [CrossRef] [PubMed]
- Quax, T.E.F.; Claassens, N.J.; Söll, D.; van der Oost, J. Codon Bias as a Means to Fine-Tune Gene Expression. Mol. Cell. 2015, 59, 149–161. [Google Scholar] [CrossRef]
- Bhattacharyya, D.; Uddin, A.; Das, S.; Chakraborty, S. Mutation pressure and natural selection on codon usage in chloroplast genes of two species in Pisum L. (Fabaceae: Faboideae). Mitochondrial DNA Part A. 2019, 30, 664–673. [Google Scholar] [CrossRef]
- Wu, S.-X.; Xu, L.-L.; Huang, R.; Wang, Q.-X. Improved biohydrogen production with an expression of codon-optimized hemH and lba genes in the chloroplast of Chlamydomonas reinhardtii. Bioresour. Technol. 2011, 102, 2610–2616. [Google Scholar] [CrossRef]
- Kwon, K.-C.; Chan, H.-T.; León, I.R.; Williams-Carrier, R.; Barkan, A.; Daniell, H. Codon Optimization to Enhance Expression Yields Insights into Chloroplast Translation. Plant Physiol. 2016, 172, 62–77. [Google Scholar] [CrossRef]
- Xia, N.; Jérémie, J. Chloranthaceae Blume. In Flora of China; Wu, Z.-Y., Raven, P.H., Hong, D.-Y., Eds.; Science Press: Beijing, China, 1999; Volume 4, pp. 132–138. [Google Scholar]
- Kong, H.-Z.; Chen, Z.-D.; Lu, A.-M. Phylogeny of Chloranthus (Chloranthaceae) based on nuclear ribosomal ITS and plastid trnL-F sequence data. Am. J. Bot. 2002, 89, 940–946. [Google Scholar] [CrossRef] [PubMed]
- Eklund, H.; Doyle, J.A.; Herendeen, P.S. Morphological phylogenetic analysis of living and fossil Chloranthaceae. Int. J. Plant Sci. 2004, 165, 107–151. [Google Scholar] [CrossRef]
- Hansen, D.R.; Dastidar, S.G.; Cai, Z.-Q.; Penaflor, C.; Kuehl, J.V.; Boore, J.L.; Jansen, R.K. Phylogenetic and evolutionary implications of complete chloroplast genome sequences of four early-diverging angiosperms: Buxus (Buxaceae), Chloranthus (Chloranthaceae), Dioscorea (Dioscoreaceae), and Illicium (Schisandraceae). Mol. Phylogenet. Evol. 2007, 45, 547–563. [Google Scholar] [PubMed]
- Zhang, Q.; Feild, T.S.; Antonelli, A. Assessing the impact of phylogenetic incongruence on taxonomy, floral evolution, biogeographical history, and phylogenetic diversity. Am. J. Bot. 2015, 102, 566–580. [Google Scholar] [CrossRef]
- Lu, Y.-B.; Jiang, Y.-L.; Qin, X.-M.; Zhang, Q. Morphological diversity and geographical distribution of Chloranthus in China. Guihaia 2020, 40, 31–43. [Google Scholar]
- Chen, F.-Y.; Bian, Y.-T.; Huang, W.-M.; Chen, Z.-C.; Shuang, P.-C.; Feng, Z.-G.; Luo, Y.-M. Research progress on chemical constituents from Chloranthus plants and their biological activities. China J. Chin. Mater. Med. 2021, 46, 3789–3796. [Google Scholar]
- Heo, J.-E.; Jin, J.-L.; Lee, Y.-Y.; Yunchoi, H.-S. Chemical Constituents of the Aerial Parts of Chloranthus japonicus Sieb. Nat. Prod. Sci. 2005, 11, 41–44. [Google Scholar]
- Li, C.-J.; Zhang, D.-M.; Luo, Y.-M. Studies on the chemical constituents from the roots of Chloranthus henryi. Acta Pharm. Sin. B 2005, 40, 525–528. [Google Scholar]
- Cao, C.-M.; Peng, Y.; Shi, Q.-W.; Xiao, P.-G. Chemical constituents and bioactivities of plants of Chloranthaceae. Chem. Biodivers. 2008, 5, 219–238. [Google Scholar] [CrossRef] [PubMed]
- Yao, S.-T.; Lu, Y.-B.; Zhang, Z.-J.; Li, C.; Wang, P.-F.; Qin, X.-M. The complete chloroplast genome of Chloranthus nervosus Collrtt ex Hemsl. 1890 (Chloranthaceae). Mitochondrial DNA B 2023, 8, 1224–1228. [Google Scholar] [CrossRef] [PubMed]
- Doyle, J.J.; Doyle, J.L. A rapid DNA isolation procedure for small amounts of fresh leaf tissue. Phytochem. Bull. 1987, 19, 11–15. [Google Scholar]
- Brown, J.; Pirrung, M.; McCue, L.A. FQC Dashboard: Integrates FastQC results into a web-based, interactive, and extensible FASTQ quality control tool. Bioinformatics 2017, 33, 3137–3139. [Google Scholar] [CrossRef] [PubMed]
- Bolger, A.M.; Lohse, M.; Usadel, B. Trimmomatic: A flexible trimmer for Illumina sequence data. Bioinformatics 2014, 30, 2114–2120. [Google Scholar] [CrossRef]
- Jin, J.-J.; Yu, W.-B.; Yang, J.-B.; Song, Y.; dePamphilis, C.W.; Yi, T.-S.; Li, D.-Z. GetOrganelle: A fast and versatile toolkit for accurate de novo assembly of organelle genomes. Genome Biol. 2020, 21, 241. [Google Scholar] [CrossRef] [PubMed]
- Wick, R.R.; Schultz, M.B.; Zobel, J.; Holt, K.E. Bandage: Interactive visualization of de novo genome assemblies. Bioinformatics 2015, 31, 3350–3352. [Google Scholar] [CrossRef] [PubMed]
- Tillich, M.; Lehwark, P.; Pellizzer, T.; Ulbricht-Jones, E.S.; Fischer, A.; Bock, R.; Greiner, S. GeSeq-versatile and accurate annotation of organelle genomes. Nucleic Acids Res. 2017, 45, 6–11. [Google Scholar] [CrossRef] [PubMed]
- Angiosperm Phylogeny Group; Chase, M.W.; Christenhusz, M.J.M.; Fay, M.F.; Byng, J.W.; Judd, W.S.; Soltis, D.E.; Mabberley, D.J.; Sennikov, A.N.; Soltis, P.S.; et al. An update of the Angiosperm Phylogeny Group classification for the orders and families of flowering plants: APG IV. Bot. J. Linn. Soc. 2016, 181, 1–20. [Google Scholar] [CrossRef]
- Katoh, K.; Toh, H. Parallelization of the MAFFT multiple sequence alignment program. Bioinformatics 2010, 26, 1899–1900. [Google Scholar] [CrossRef]
- Stamatakis, A. RAxML version 8: A tool for phylogenetic analysis and post-analysis of large phylogenies. Bioinformatics 2014, 30, 1312–1313. [Google Scholar] [CrossRef]
- Swofford, D.L. PAUP*: Phylogenetic Analysis Using Parsimony (*and Other Methods); Version 4.0b10.; Sinauer: Sunderland, Massachusetts, 2003. [Google Scholar]
- Lee, S.; Weon, S.; Lee, S.; Kang, C. Relative codon adaptation index, a sensitive measure of codon usage bias. Evol. Bioinform. 2010, 6, 47–55. [Google Scholar] [CrossRef] [PubMed]
- Wright, F. The ‘effective number of codons’ used in a gene. Gene 1990, 87, 23–29. [Google Scholar] [CrossRef]
- Nasrullah, I.; Butt, A.M.; Tahir, S.; Idrees, M.; Tong, Y. Genomic analysis of codon usage shows influence of mutation pressure, natural selection, and host features on Marburg virus evolution. BMC Evol. Biol. 2015, 15, 174. [Google Scholar] [CrossRef] [PubMed]
- Vicario, S.; Moriyama, E.N.; Powell, J.R. Codon usage in twelve species of Drosophila. BMC Evol. Biol. 2007, 7, 226. [Google Scholar] [CrossRef] [PubMed]
- Tao, P.; Dai, L.; Luo, M.; Tang, F.; Tien, P.; Pan, Z. Analysis of synonymous codon usage in classical swine fever virus. Virus Genes 2009, 38, 104–112. [Google Scholar] [CrossRef] [PubMed]
- Sueoka, N. Intrastrand parity rules of DNA base composition and usage biases of synonymous codons. J. Mol. Evol. 1995, 40, 318–325. [Google Scholar] [CrossRef] [PubMed]
- Sueoka, N. Translation-coupled violation of Parity Rule 2 in human genes is not the cause of heterogeneity of the DNA G+C content of third codon position. Gene 1999, 238, 53–58. [Google Scholar] [CrossRef]
- Sueoka, N. Near homogeneity of PR2-bias fingerprints in the human genome and their implications in phylogenetic analyses. J. Mol. Evol. 2001, 53, 469–476. [Google Scholar] [CrossRef] [PubMed]
- Bu, Y.; Wu, X.; Sun, N.; Man, Y.; Jing, Y. Codon usage bias predicts the functional MYB10 gene in Populus. J. Plant Physiol. 2021, 265, 153491. [Google Scholar] [CrossRef] [PubMed]
- Wang, Y.-F.; Wen, F.; Hong, X.; Li, Z.L.; Mi, Y.L.; Zhao, B. Comparative chloroplast genome analyses of Paraboea (Gesneriaceae): Insights into adaptive evolution and phylogenetic analysis. Front. Plant Sci. 2022, 13, 1019831. [Google Scholar] [CrossRef] [PubMed]
- Chen, J.-L.; Wang, F.; Zhao, Z.; Li, M.-H.; Liu, Z.-J.; Peng, D.-H. Complete chloroplast genomes and comparative analyses of three Paraphalaenopsis (Aeridinae, Orchidaceae) species. Int. J. Mol. Sci. 2023, 24, 11167. [Google Scholar] [CrossRef] [PubMed]
- Comeron, J.M.; Aguadé, M. An evalution of measures of synonymous codon usage bias. J. Mol. Evol. 1998, 47, 268–274. [Google Scholar] [CrossRef] [PubMed]
- Sablok, G.; Nayak, K.C.; Vazquez, F.; Tatarinova, T.V. Synonymous codon usage, GC(3), and evolutionary patterns across plastomes of three pooid model species: Emerging grass genome models for monocots. Mol. Biotechnol. 2011, 49, 116–128. [Google Scholar] [CrossRef]
- Ling, L.; Zhang, S.; Yang, T. Analysis of codon usage bias in chloroplast genomes of Dryas octopetala var. asiatica (Rosaceae). Genes 2024, 15, 899. [Google Scholar] [CrossRef] [PubMed]
- Ikemura, T. Correlation between the abundance of Escherichia coli transfer RNAs and the occurrence of the respective codons in its protein genes. J. Mol. Biol. 1981, 146, 1–21. [Google Scholar] [CrossRef] [PubMed]
- Hershberg, R.; Petrov, D.A. Selection on codon bias. Annu. Rev. Genet. 2008, 42, 287–299. [Google Scholar] [CrossRef] [PubMed]
- Palidwor, G.A.; Perkins, T.J.; Xia, X. A general model of codon bias due to GC mutational bias. PLoS ONE 2010, 5, e13431. [Google Scholar] [CrossRef] [PubMed]
- Duan, H.; Zhang, Q.; Wang, C.; Li, F.; Tian, F.; Lu, Y.; Hu, Y.; Yang, H.; Cui, G. Analysis of codon usage patterns of the chloroplast genome in Delphinium grandiflorum L. reveals a preference for AT-ending codons as a result of major selection constraints. Peer J. 2021, 9, e10787. [Google Scholar] [CrossRef]
- Sun, C.-Q.; Chen, F.-D.; Teng, N.-J.; Xu, Y.-C.; Dai, Z.-L. Comparative analysis of the complete chloroplast genome of seven Nymphaea species. Aquat. Bot. 2021, 170, 103353. [Google Scholar] [CrossRef]
- Wang, Z.-J.; Cai, Q.-W.; Wang, Y.; Li, M.-H.; Wang, C.-C.; Wang, Z.-X.; Jiao, C.-Y.; Xu, C.-C.; Wang, H.-Y.; Zhang, Z.-L. Comparative analysis of codon bias in the chloroplast genomes of Theaceae species. Front. Genet. 2022, 13, 824610. [Google Scholar] [CrossRef] [PubMed]
- Wang, Y.-H.; Wei, Q.-Y.; Xue, T.-Y.; He, S.-X.; Fang, J.; Zeng, C.-L. Comparative and phylogenetic analysis of the complete chloroplast genomes of 10 Artemisia selengensis resources based on high-throughput sequencing. BMC Genomics. 2024, 25, 561. [Google Scholar] [CrossRef] [PubMed]
- Sebastin, R.; Kim, J.; Jo, I.-H.; Yu, J.-K.; Jang, W.; Han, S.; Park, H.S.; AlGarawi, A.M.; Hatamleh, A.A.; So, Y.-S.; et al. Comparative chloroplast genome analyses of cultivated and wild Capsicum species shed light on evolution and phylogeny. BMC Plant Biol. 2024, 24, 797. [Google Scholar] [CrossRef]
- Kong, W.-Q.; Yang, J.-H. The complete chloroplast genome sequence of Morus cathayana and Morus multicaulis, and comparative analysis within genus Morus L. PeerJ. 2017, 8, e3037. [Google Scholar] [CrossRef] [PubMed]
- Wang, Z.-J.; Xu, B.-B.; Li, B.; Zhou, Q.-Q.; Wang, G.-Y.; Jiang, X.-Z.; Wang, C.-C.; Xu, Z.-D. Comparative analysis of codon usage patterns in chloroplast genomes of six Euphorbiaceae species. PeerJ. 2020, 8, e8251. [Google Scholar] [CrossRef]
- Wang, L.-J.; Roossinck, M.J. Comparative analysis of expressed sequences reveals a conserved pattern of optimal codon usage in plants. Plant Mol. Biol. 2006, 61, 699–710. [Google Scholar] [CrossRef]
- Ji, K.-K.; Song, X.-Q.; Chen, C.-G.; Li, G.; Xie, S.-Q. Codon usage profiling of chloroplast genome in Magnoliaceae. J. Agric. Sci. Technol. 2022, 22, 52–62. [Google Scholar]
Disclaimer/Publisher’s Note: The statements, opinions and data contained in all publications are solely those of the individual author(s) and contributor(s) and not of MDPI and/or the editor(s). MDPI and/or the editor(s) disclaim responsibility for any injury to people or property resulting from any ideas, methods, instructions or products referred to in the content. |
© 2025 by the authors. Licensee MDPI, Basel, Switzerland. This article is an open access article distributed under the terms and conditions of the Creative Commons Attribution (CC BY) license (https://creativecommons.org/licenses/by/4.0/).