Exploring Genomic Variants Related to Residual Feed Intake in Local and Commercial Chickens by Whole Genomic Resequencing
Abstract
:1. Introduction
2. Materials and Methods
2.1. Ethics Statement
2.2. Animals and Sample Collection
2.3. Genome Sequence Assembly and Data Analysis
2.4. SNP Detection and Function Annotation
2.5. SNP Validation by Sanger Sequencing
2.6. Association Analysis of the SNPs from Whole Genome Sequencing in the Validation Population of Cobb
2.7. Quantitative Reverse Transcription-PCR Validation of Expression of Candidate Genes
3. Results
3.1. Characteristics of Birds in High and Low Phenotypic Groups
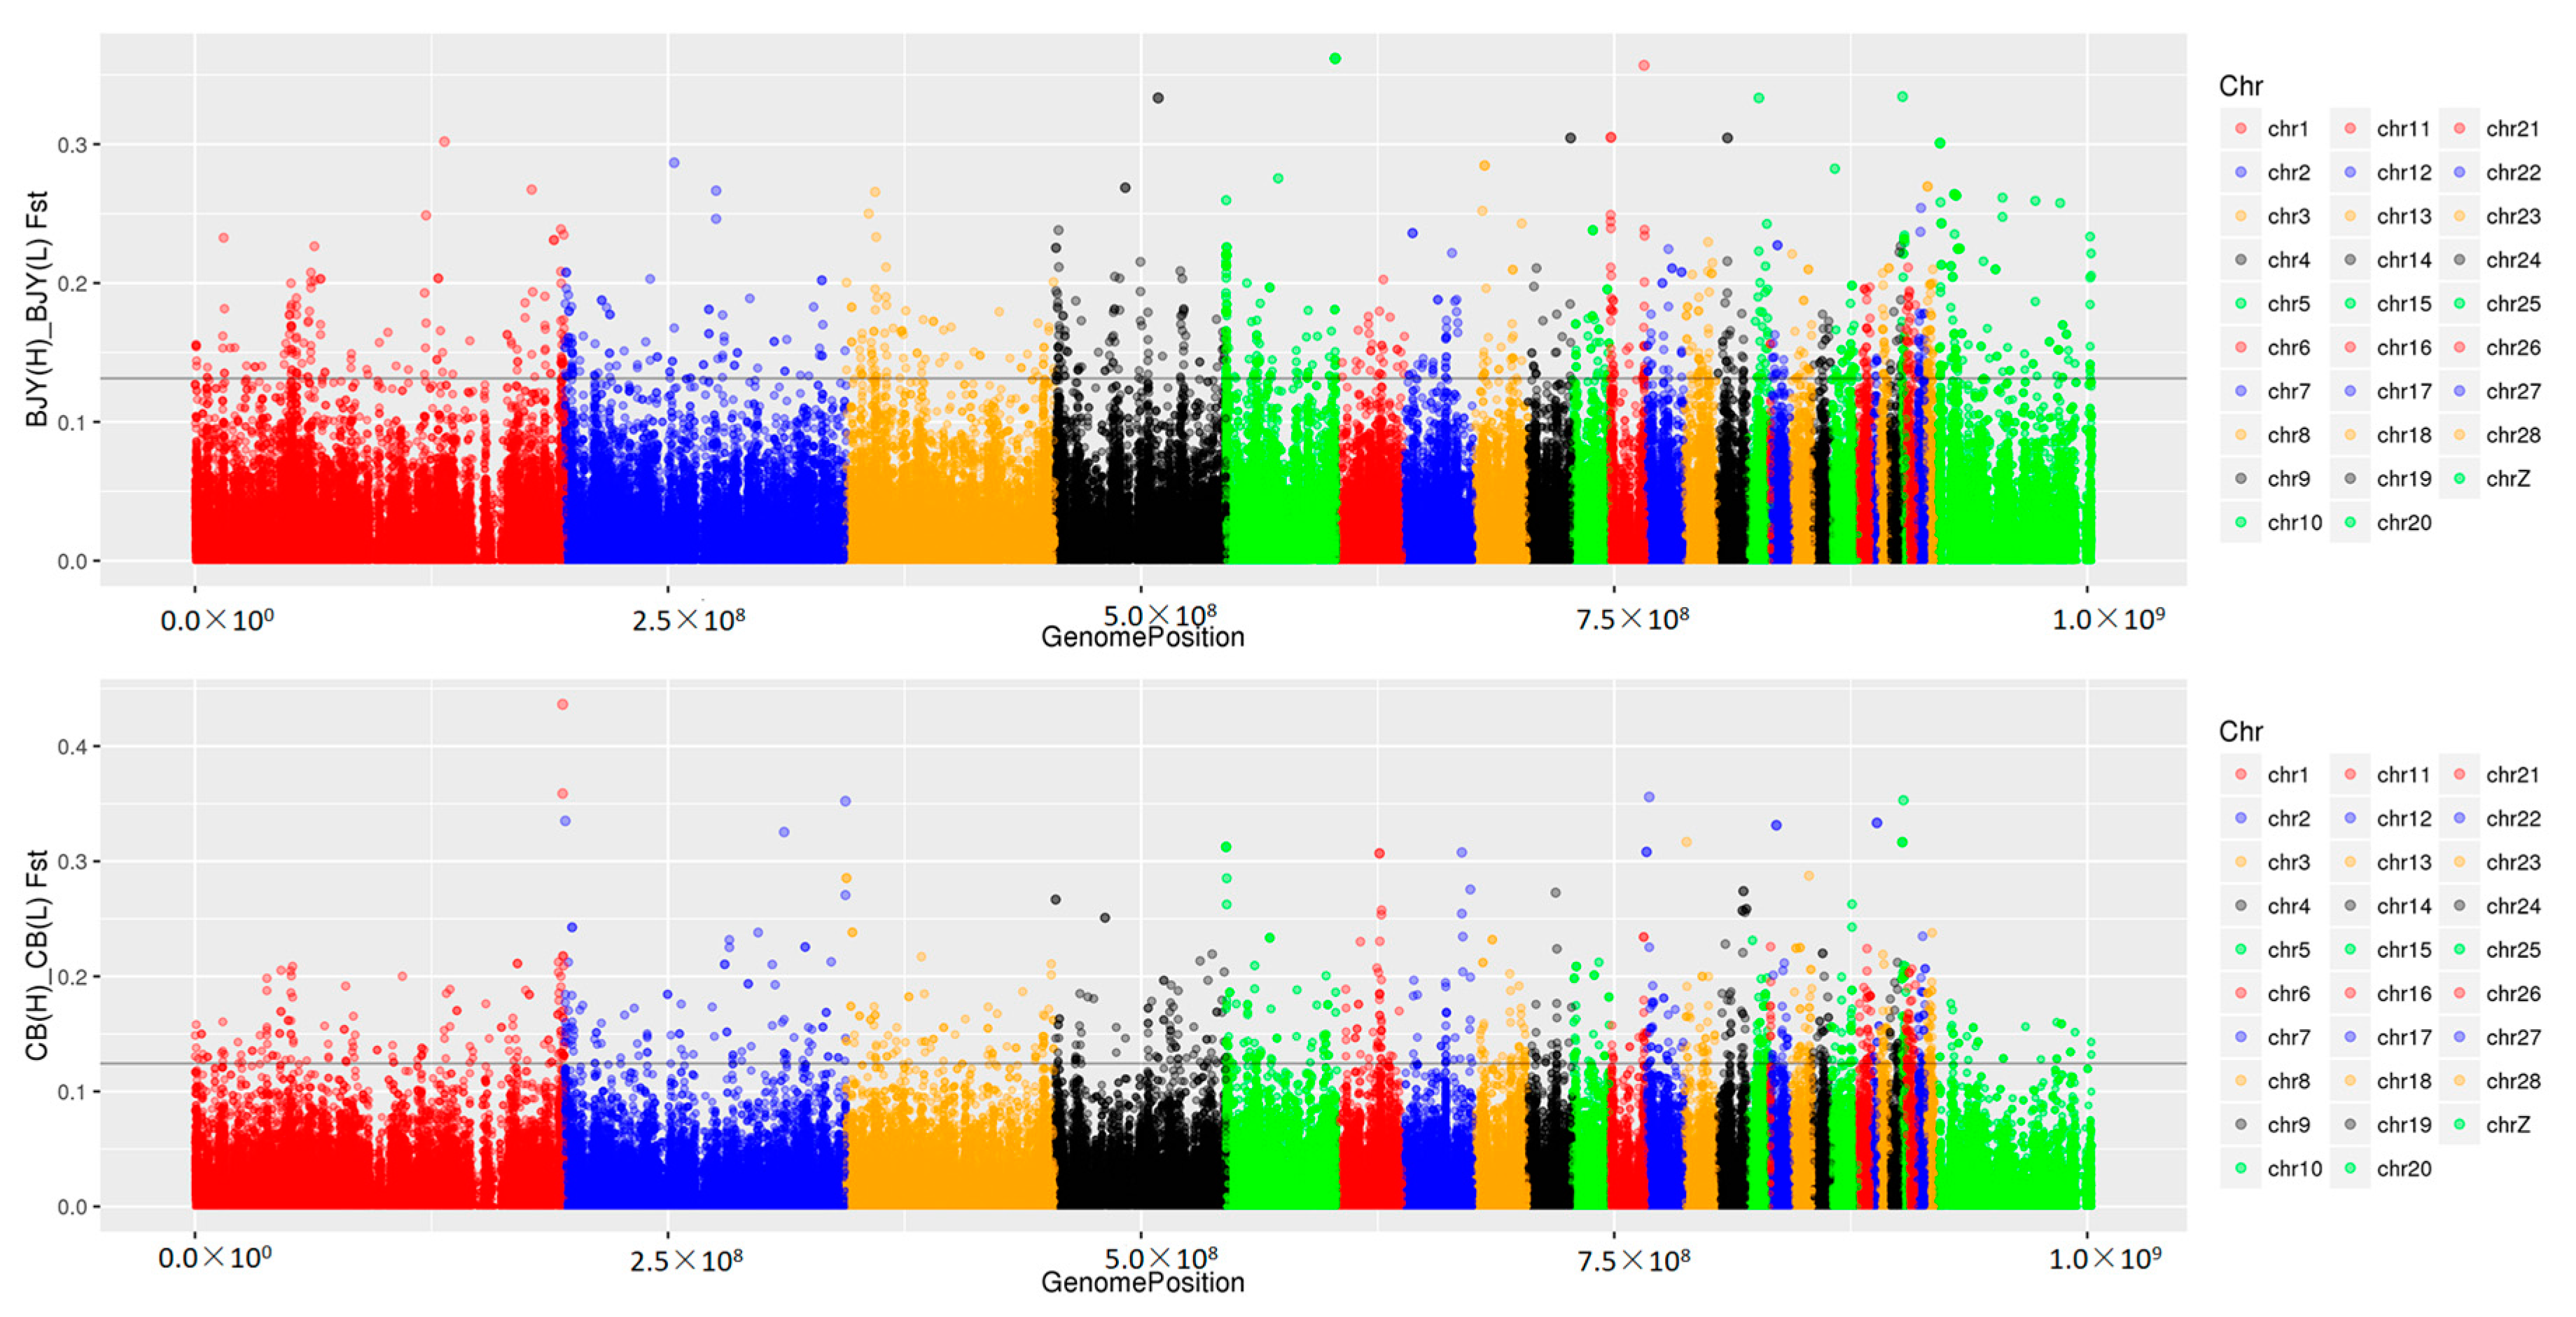
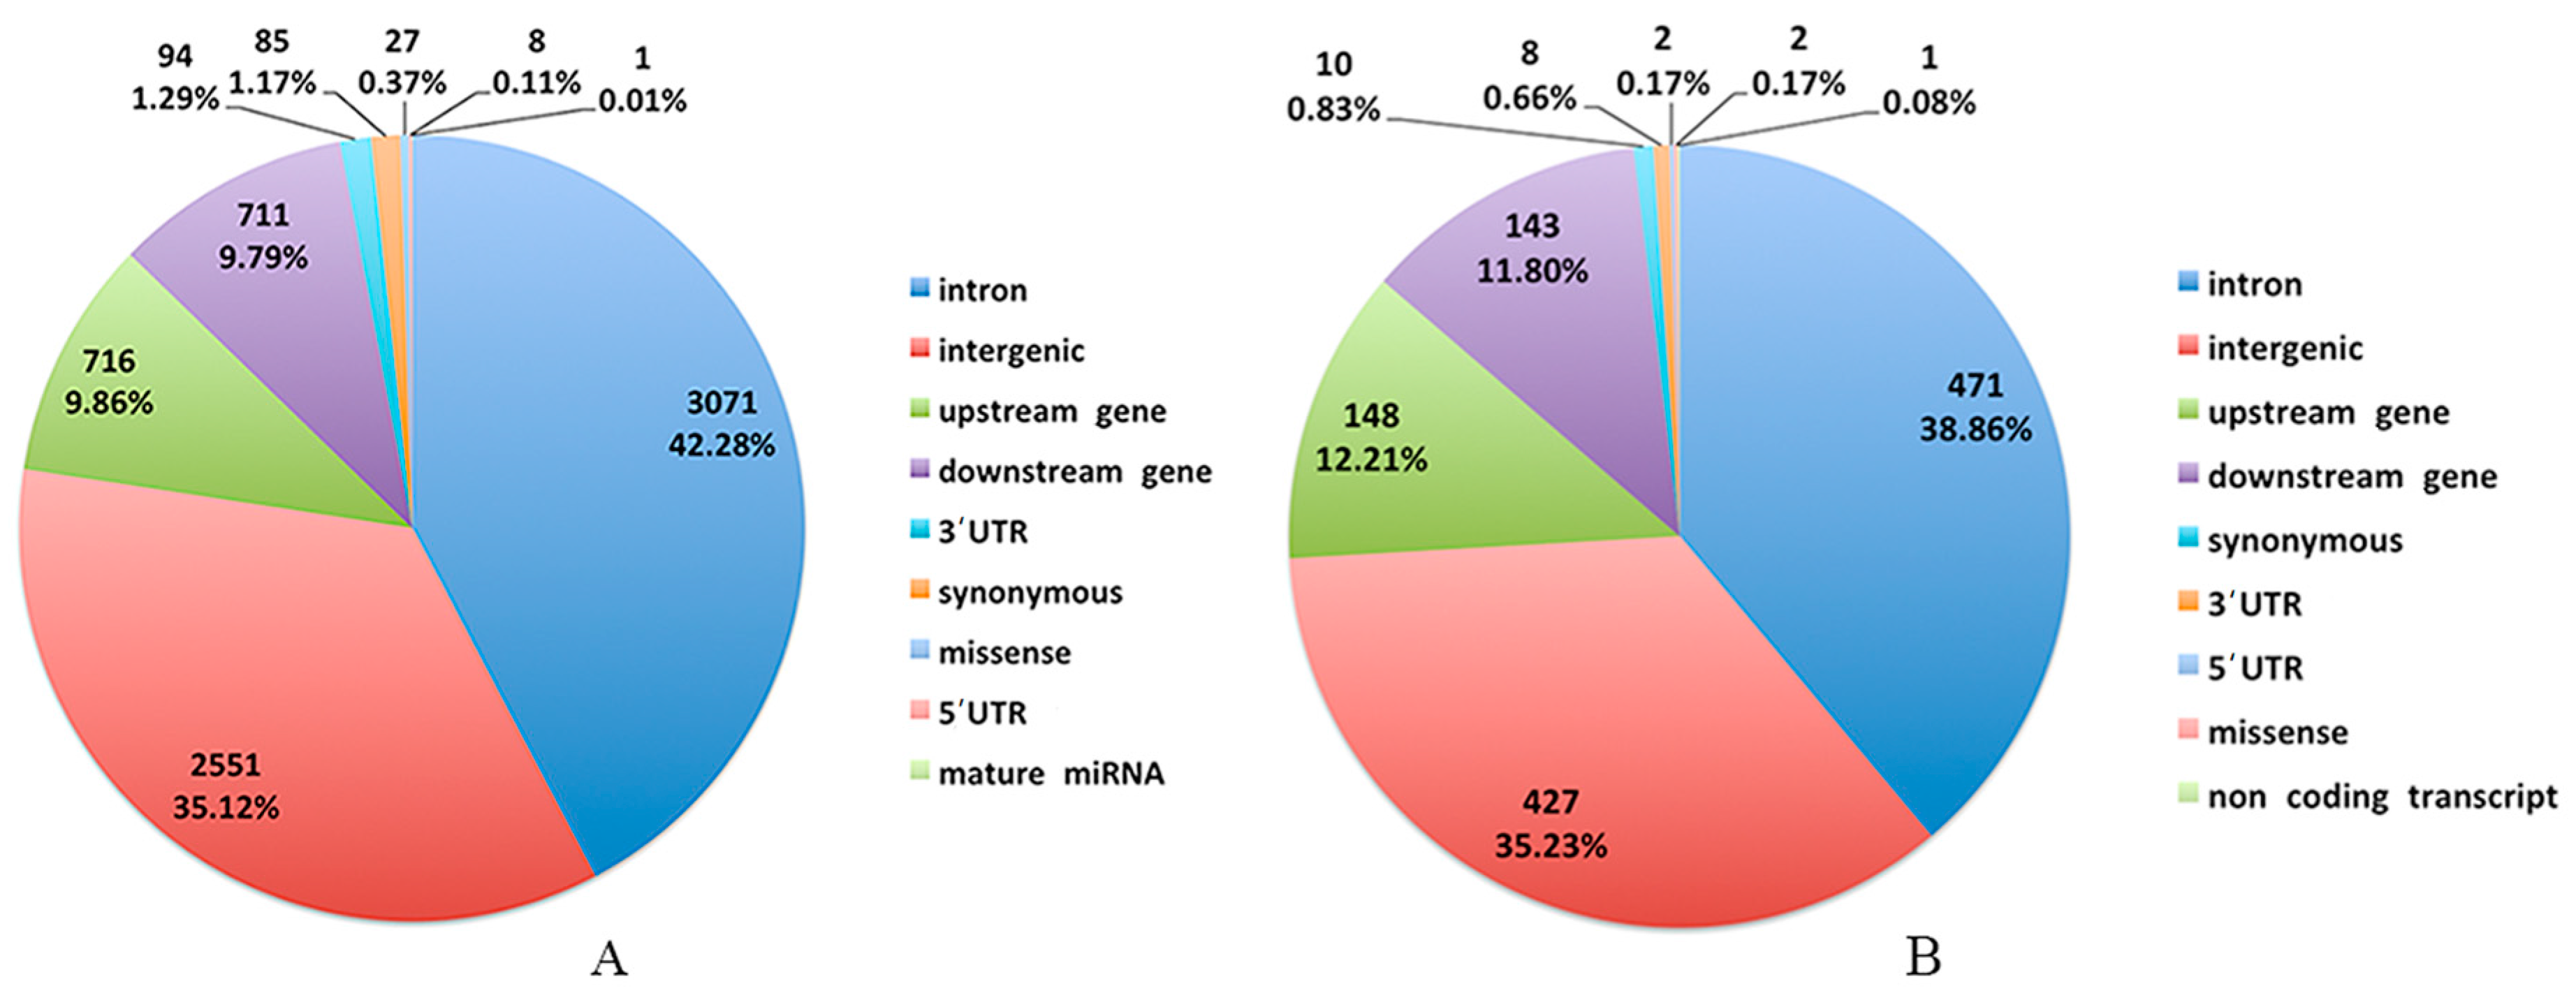
3.2. Genomic Variants Related to Residual Feed Intake in Beijing-You Chickens
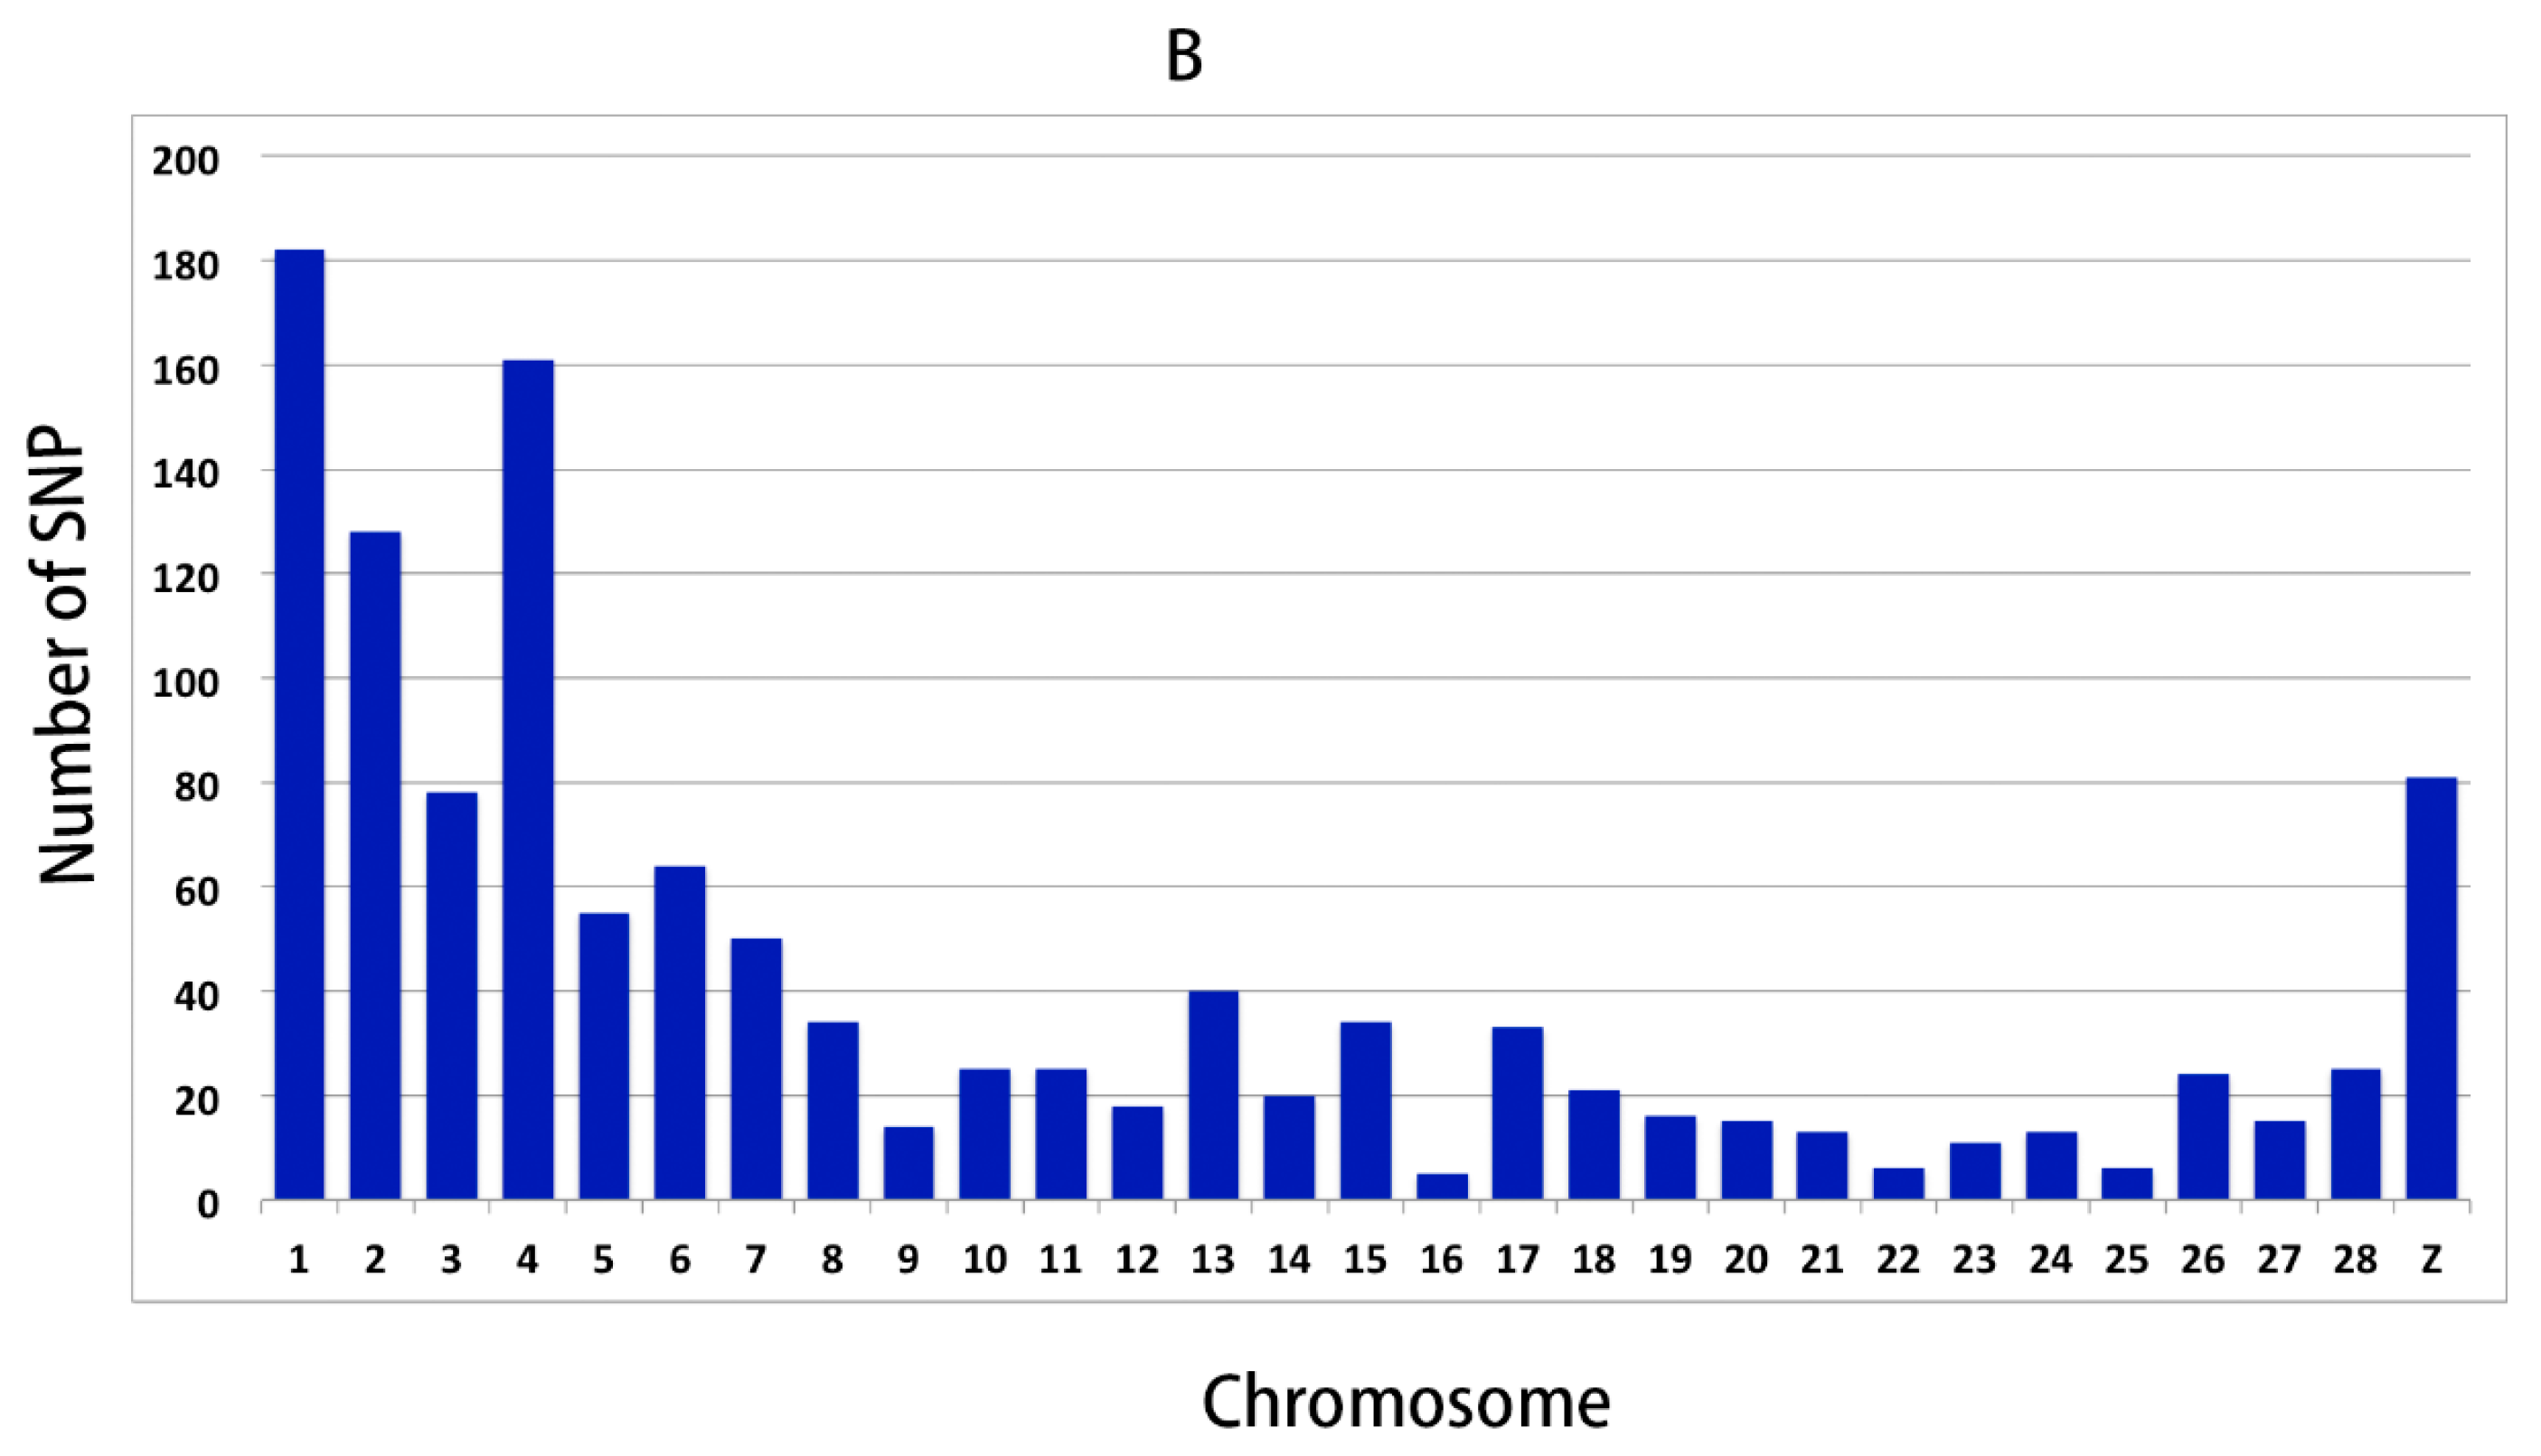
3.3. Genomic Variants Related to Residual Feed Intake in Cobb Chickens
3.4. Common Features of Both Breeds
3.5. SNP Validation
3.6. Association of the SNPs with the Breeding Value of RFI in the Cobb Population of 779
4. Discussion
5. Conclusions
Supplementary Materials
Acknowledgments
Author Contributions
Conflicts of Interest
References
- Ong, S.E. Whole proteomes as internal standards in quantitative proteomics. Genome Med. 2010, 2, 1–4. [Google Scholar] [CrossRef] [PubMed]
- Koch, R.M.; Swiger, L.A.; Chambers, D.; Gregory, K.E. Efficiency of feed use in beef cattle. J. Anim. Sci. 1963, 22, 486–494. [Google Scholar] [CrossRef]
- Lee, J. Molecular Basis of Feed Efficiency in Meat-Type Chickens. Ph.D. Thesis, University of Georgia, Athens, GA, USA, 2012. [Google Scholar]
- Do, D.N.; Ostersen, T.; Strathe, A.B.; Mark, T.; Jensen, J.; Kadarmideen, H.N. Genome-wide association and systems genetic analyses of residual feed intake, daily feed consumption, backfat and weight gain in pigs. BMC Genet. 2014, 15, 27. [Google Scholar] [CrossRef] [PubMed]
- Tizioto, P.C.; Coutinho, L.L.; Decker, J.E.; Schnabel, R.D.; Rosa, K.O.; Oliveira, P.S.N.; Souza, M.M.; Mourao, G.B.; Tullio, R.R.; Chaves, A.S.; et al. Global liver gene expression differences in nelore steers with divergent residual feed intake phenotypes. BMC Genom. 2015, 16, 242. [Google Scholar] [CrossRef] [PubMed] [Green Version]
- Jing, L.; Hou, Y.; Wu, H.; Miao, Y.X.; Li, X.Y.; Cao, J.H.; Brameld, J.M.; Parr, T.; Zhao, S.H. Transcriptome analysis of mrna and mirna in skeletal muscle indicates an important network for differential residual feed intake in pigs. Sci. Rep. 2015, 5. [Google Scholar] [CrossRef] [PubMed]
- Yi, G.Q.; Yuan, J.W.; Bi, H.J.; Yan, W.; Yang, N.; Qu, L.J. In-depth duodenal transcriptome survey in chickens with divergent feed efficiency using rna-seq. PLoS ONE 2015, 10, e0136765. [Google Scholar] [CrossRef] [PubMed]
- Xu, Z.; Ji, C.; Zhang, Y.; Zhang, Z.; Nie, Q.; Xu, J.; Zhang, D.; Zhang, X. Combination analysis of genome-wide association and transcriptome sequencing of residual feed intake in quality chickens. BMC Genom. 2016, 17, 594. [Google Scholar] [CrossRef] [PubMed]
- Santana, M.H.A.; Utsunomiya, Y.T.; Neves, H.H.R.; Gomes, R.C.; Garcia, J.F.; Fukumasu, H.; Silva, S.L.; Oliveira, G.A.; Alexandre, P.A.; Leme, P.R.; et al. Genome-wide association analysis of feed intake and residual feed intake in nellore cattle. BMC Genet. 2014, 15, 21. [Google Scholar] [CrossRef] [PubMed] [Green Version]
- Cui, H.X.; Liu, R.R.; Zhao, G.P.; Zheng, M.Q.; Chen, J.L.; Wen, J. Identification of differentially expressed genes and pathways for intramuscular fat deposition in pectoralis major tissues of fast-and slow-growing chickens. BMC Genom. 2012, 13, 213. [Google Scholar] [CrossRef] [PubMed]
- Li, H.; Durbin, R. Fast and accurate short read alignment with burrows–wheeler transform. Bioinformatics 2009, 25, 1754–1760. [Google Scholar] [CrossRef] [PubMed]
- Li, H.; Handsaker, B.; Wysoker, A.; Fennell, T.; Ruan, J.; Homer, N.; Marth, G.; Abecasis, G.; Durbin, R. The sequence alignment-map format and samtools. Bioinformatics 2009, 25, 2078–2079. [Google Scholar] [CrossRef] [PubMed]
- Koboldt, D.C.; Chen, K.; Wylie, T.; Larson, D.E.; Mclellan, M.D.; Mardis, E.R.; Weinstock, G.M.; Wilson, R.K.; Ding, L. Varscan: Variant detection in massively parallel sequencing of individual and pooled samples. Bioinformatics 2009, 25, 2283–2285. [Google Scholar] [CrossRef] [PubMed]
- Gilmour, A.R.; Gogel, B.J.; Cullis, B.R. Asreml User Guide Release 2.0; Vsn International Ltd.: Hemel Hempstead, UK, 2006. [Google Scholar]
- R Core team. R: A language and environment for statistical computing. Computing 2014, 14, 12–21. [Google Scholar]
- Sheppard, K.; Kinross, K.M.; Solomon, B.; Pearson, R.B.; Phillips, W.A. Targeting PI3 kinase/AKT/mTOR signaling in cancer. Crit. Rev. Oncog. 2012, 17, 69–95. [Google Scholar] [CrossRef] [PubMed]
- Matsuda, S.; Kobayashi, M.; Kitagishi, Y. Roles for PI3k/AKT/PTEN pathway in cell signaling of nonalcoholic fatty liver disease. ISRN Endocrinol. 2012, 2013. [Google Scholar] [CrossRef] [PubMed]
- Jackel-Cram, C.; Qiao, L.; Xiang, Z.; Brownlie, R.; Zhou, Y.; Babiuk, L.; Liu, Q. Hepatitis C virus genotype-3a core protein enhances sterol regulatory element-binding protein-1 activity through the phosphoinositide 3-kinase-Akt-2 pathway. J. Gen. Virol. 2010, 91, 1388–1395. [Google Scholar] [CrossRef] [PubMed]
- Han, C.; Wei, S.; He, F.; Liu, D.; Wan, H.; Liu, H.; Li, L.; Xu, H.; Du, X.; Xu, F. The regulation of lipid deposition by insulin in goose liver cells is mediated by the PI3k-AKT-mTOR signaling pathway. PLoS ONE 2015, 10, e0098759. [Google Scholar] [CrossRef] [PubMed]
- Hodakoski, C.; Hopkins, B.D.; Barrows, D.; Mense, S.M.; Keniry, M.; Anderson, K.E.; Kern, P.A.; Hawkins, P.T.; Stephens, L.R.; Parsons, R. Regulation of PTEN inhibition by the pleckstrin homology domain of P-REX2 during insulin signaling and glucose homeostasis. Proc. Natl. Acad. Sci. USA 2014, 111, 155–160. [Google Scholar] [CrossRef] [PubMed]
- Nakanishi, M.; Hata, K.; Nagayama, T.; Sakurai, T.; Nishisho, T.; Wakabayashi, H.; Hiraga, T.; Ebisu, S.; Yoneda, T. Acid activation of Trpv1 leads to an up-regulation of calcitonin gene-related peptide expression in dorsal root ganglion neurons via the Camk-CREB cascade: A potential mechanism of inflammatory pain. Mol. Biol. Cell 2010, 21, 2568–2577. [Google Scholar] [CrossRef] [PubMed]
- Ono, H.; Katagiri, H.; Funaki, M.; Anai, M.; Inukai, K.; Fukushima, Y.; Sakoda, H.; Ogihara, T.; Onishi, Y.; Fujishiro, M. Regulation of phosphoinositide metabolism, AKT phosphorylation, and glucose transport by PTEN (phosphatase and tensin homolog deleted on chromosome 10) in 3T3-L1 adipocytes. Mol. Endocrinol. 2001, 15, 1411–1422. [Google Scholar] [CrossRef] [PubMed]
- Lo, Y.T.; Tsao, C.J.; Liu, I.M.; Liou, S.S.; Cheng, J.T. Increase of PTEN gene expression in insulin resistance. Horm. Metab. Res. 2004, 36, 662–666. [Google Scholar] [CrossRef] [PubMed]
- Hosaka, T.; Biggs, W.H.; Tieu, D.; Boyer, A.D.; Varki, N.M.; Cavenee, W.K.; Arden, K.C. Disruption of forkhead transcription factor (FOXO) family members in mice reveals their functional diversification. Proc. Natl. Acad. Sci. USA 2004, 101, 2975–2980. [Google Scholar] [CrossRef] [PubMed]
- Matsumoto, M.; Han, S.; Kitamura, T.; Accili, D. Dual role of transcription factor FOXO1 in controlling hepatic insulin sensitivity and lipid metabolism. J. Clin. Investig. 2006, 116, 2464–2472. [Google Scholar] [CrossRef] [PubMed]
- Hossain, M.U.; Abu Zaffar Shibly, T.M.; Omar, F.T.Z.; Santona, U.S.; Hossain, M.J.; Khoka, M.S.H.; Keya, C.A.; Salimullah, M. Towards finding the linkage between metabolic and age-related disorders using semantic gene data network analysis. Bioinformation 2016, 12, 22. [Google Scholar] [CrossRef] [PubMed]
- Nath, A.; Chan, C. Genetic alterations in fatty acid transport and metabolism genes are associated with metastatic progression and poor prognosis of human cancers. Sci. Rep. 2016, 6, 18669. [Google Scholar] [CrossRef] [PubMed]
- Macfarlane, S.; Quigley, M.; Hopkins, M.; Newton, D.F.; Macfarlane, G. Polysaccharide degradation by human intestinal bacteria during growth under multi-substrate limiting conditions in a three-stage continuous culture system. FEMS Microbiol. Ecol. 1998, 26, 231–243. [Google Scholar] [CrossRef]
- Grubbs, J.K. Protein Profile and Reactive Oxygen Species Production in Mitochondria from Pigs Divergently Selected for Residual Feed Intake. Ph.D. Thesis, Iowa State University, Ames, IA, USA, 2012. [Google Scholar]
- Zhao, G.P.; Cui, H.X.; Liu, R.R.; Zheng, M.Q.; Chen, J.L.; Wen, J. Comparison of breast muscle meat quality in 2 broiler breeds. Poult. Sci. 2011, 90, 2355. [Google Scholar] [CrossRef] [PubMed]
- Altarejos, J.Y.; Goebel, N.; Conkright, M.D.; Inoue, H.; Xie, J.; Arias, C.M.; Sawchenko, P.E.; Montminy, M. The CREB1 coactivator CRTC1 is required for energy balance and fertility. Nat. Med. 2008, 14, 1112–1117. [Google Scholar] [CrossRef] [PubMed]
- Sheriff, S.; Chance, W.T.; Fischer, J.E.; Balasubramaniam, A. Neuropeptide Y treatment and food deprivation increase cyclic AMP response element-binding in rat hypothalamus. Mol. Pharmacol. 1997, 51, 597–604. [Google Scholar] [CrossRef] [PubMed]
- Mayr, B.; Montminy, M. Transcriptional regulation by the phosphorylation-dependent factor CREB. Nat. Rev. Mol. Cell Biol. 2001, 2, 599–609. [Google Scholar] [CrossRef] [PubMed]
- Herd, R.M.; Oddy, V.H.; Richardson, E.C. Biological basis for variation in residual feed intake in beef cattle. 1. Review of potential mechanisms. Aust. J. Exp. Agric. 2004, 44, 423–430. [Google Scholar] [CrossRef]
- Zhou, N.; Lee, W.R.; Abasht, B. Messenger RNA sequencing and pathway analysis provide novel insights into the biological basis of chickens’ feed efficiency. BMC Genom. 2015, 16, 195. [Google Scholar] [CrossRef] [PubMed]
- Suhr, F.; Gehlert, S.; Grau, M.; Bloch, W. Skeletal muscle function during exercise—Fine-tuning of diverse subsystems by nitric oxide. Int. J. Mol. Sci. 2013, 14, 7109–7139. [Google Scholar] [CrossRef] [PubMed]
- Etgen, G.J.; Fryburg, D.A.; Gibbs, E.M. Nitric oxide stimulates skeletal muscle glucose transport through a calcium/contraction- and phosphatidylinositol-3-kinase-independent pathway. Diabetes 1997, 46, 1915–1919. [Google Scholar] [CrossRef] [PubMed]
- Chen, G.C.; Turano, B.; Ruest, P.J.; Hagel, M.; Settleman, J.; Thomas, S.M. Regulation of Rho and Rac signaling to the actin cytoskeleton by paxillin during Drosophila development. Mol. Cell. Biol. 2005, 25, 979–987. [Google Scholar] [CrossRef] [PubMed]
- Luo, L.; Liao, Y.J.; Jan, L.Y.; Jan, Y.N. Distinct morphogenetic functions of similar small GTPases: Drosophila Drac1 is involved in axonal outgrowth and myoblast fusion. Genes Dev. 1994, 8, 1787–1802. [Google Scholar] [CrossRef] [PubMed]
- Takata, N.; Itoh, B.; Misaki, K.; Hirose, T.; Yonemura, S.; Okada, M. Non-receptor tyrosine kinase CSK-1 controls pharyngeal muscle organization in Caenorhabditis elegans. Genes Cells 2009, 14, 381–393. [Google Scholar] [CrossRef] [PubMed]

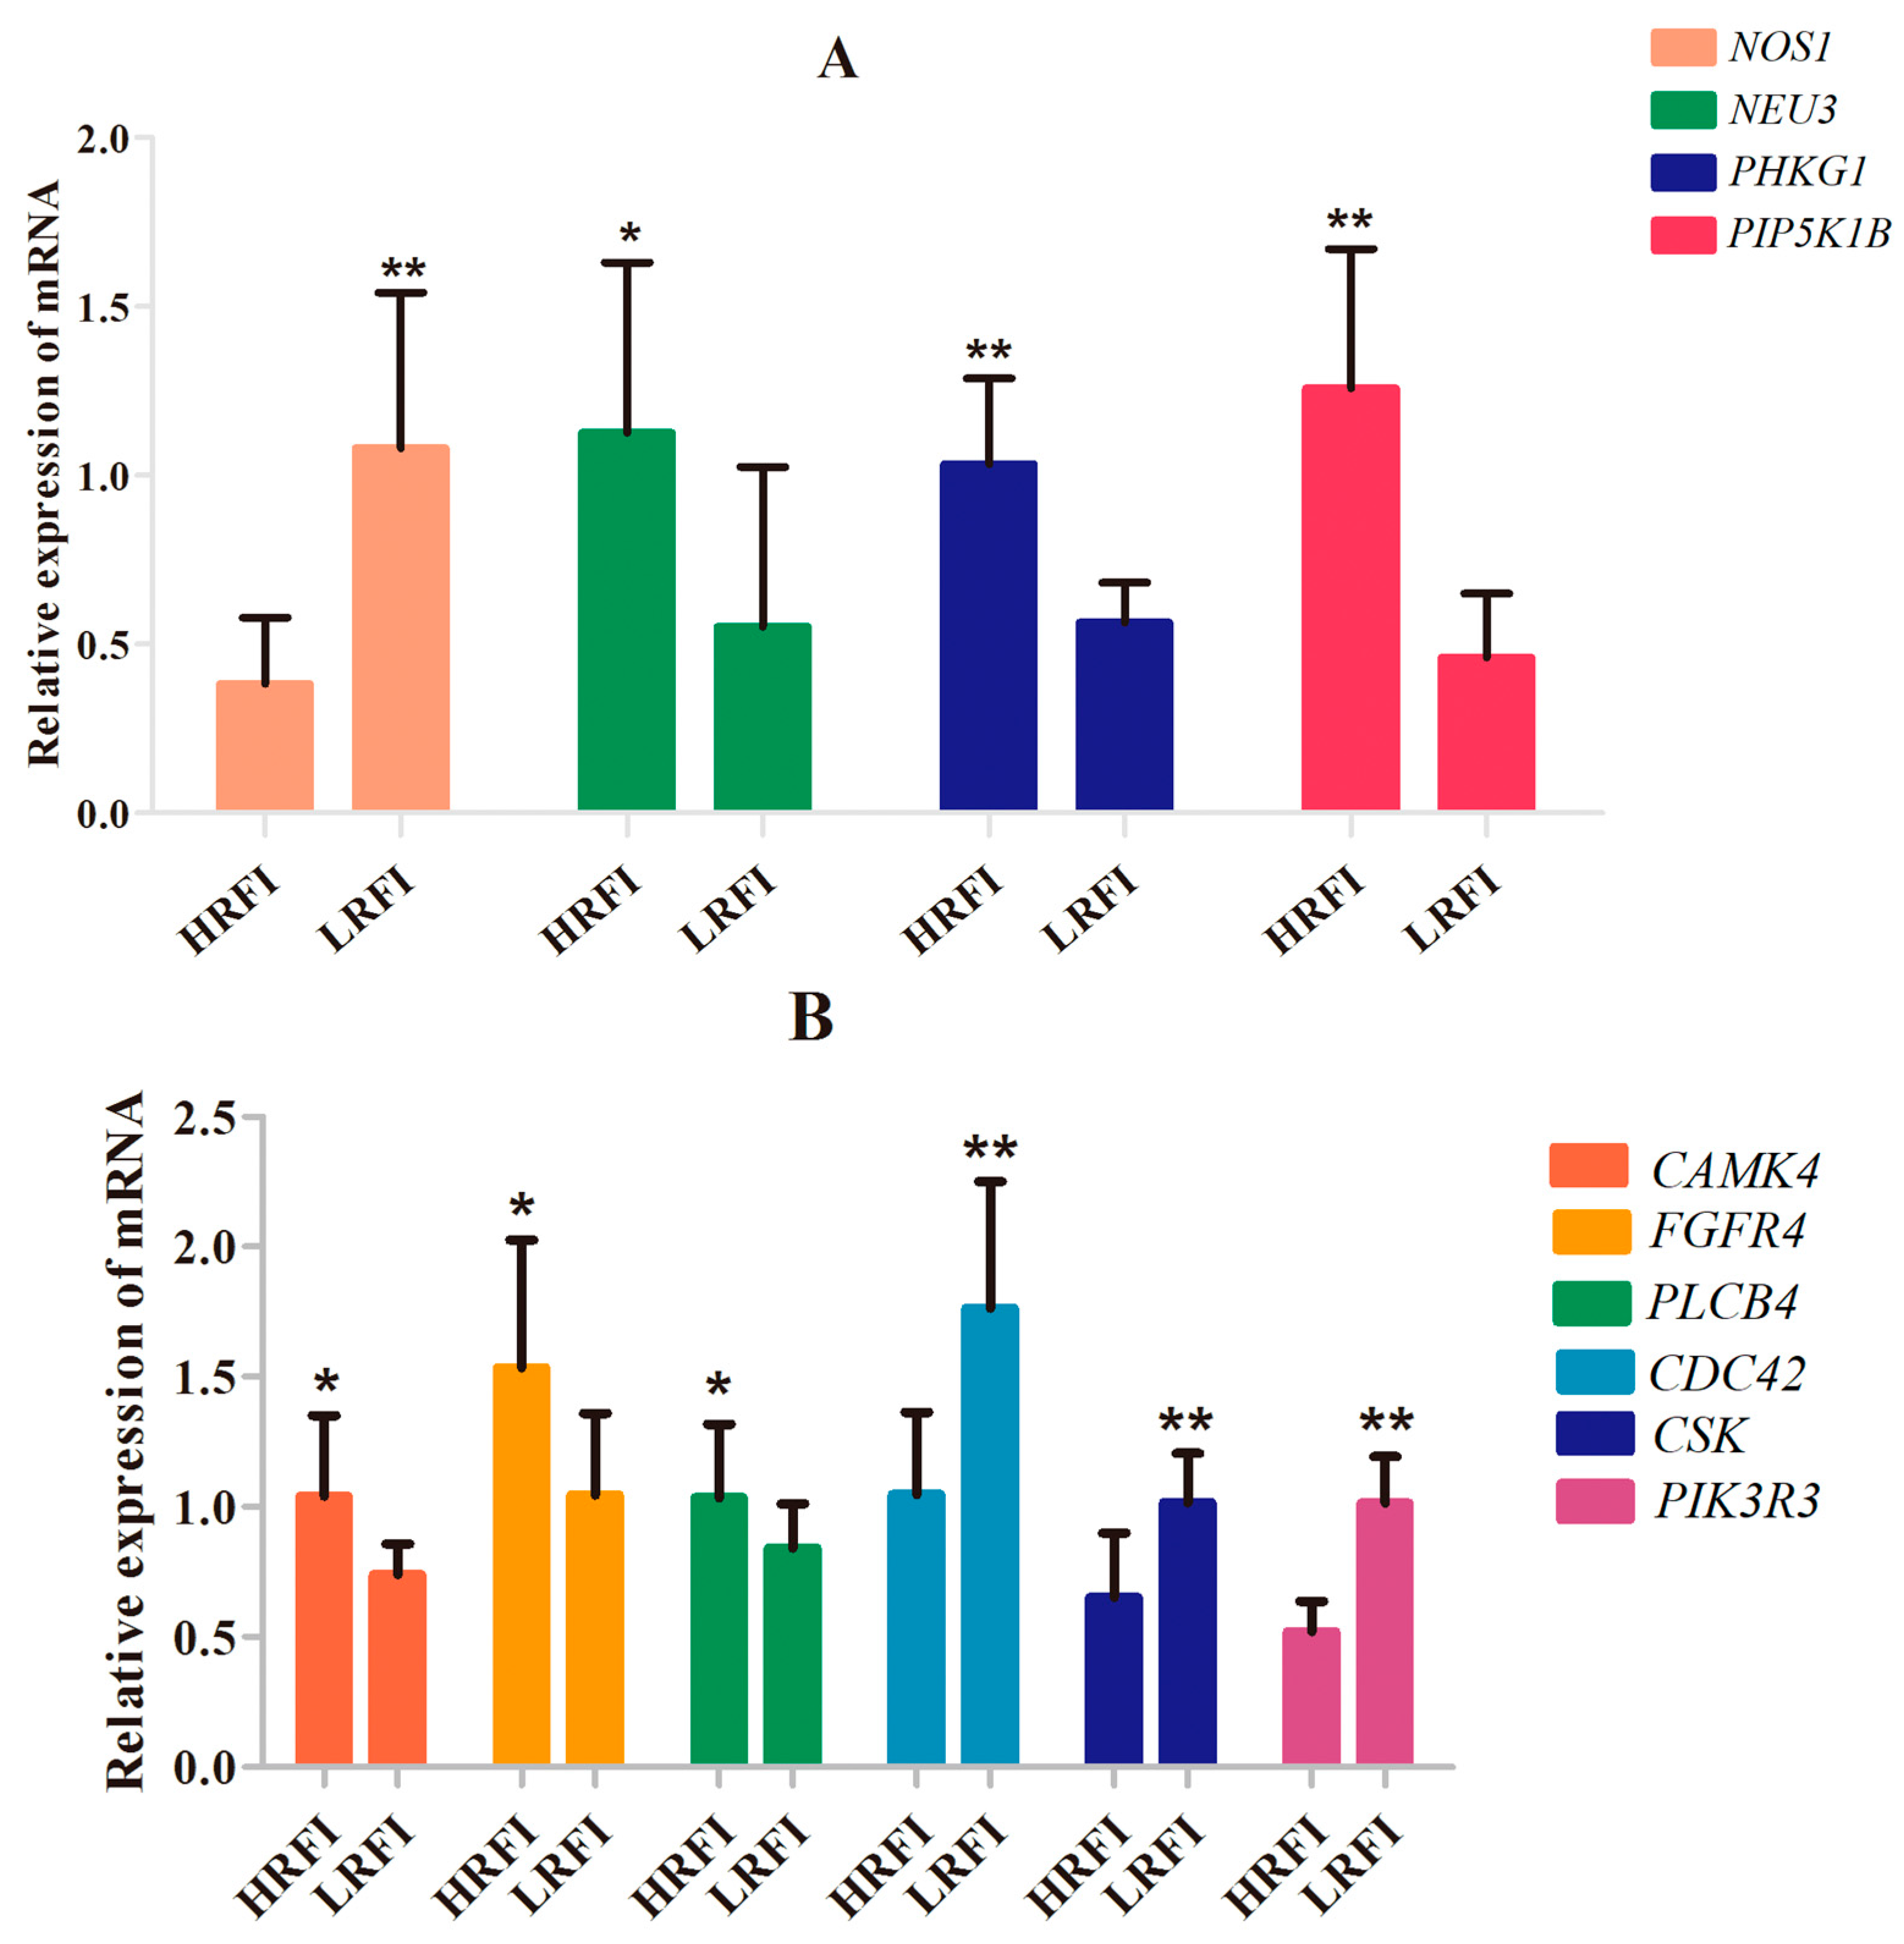
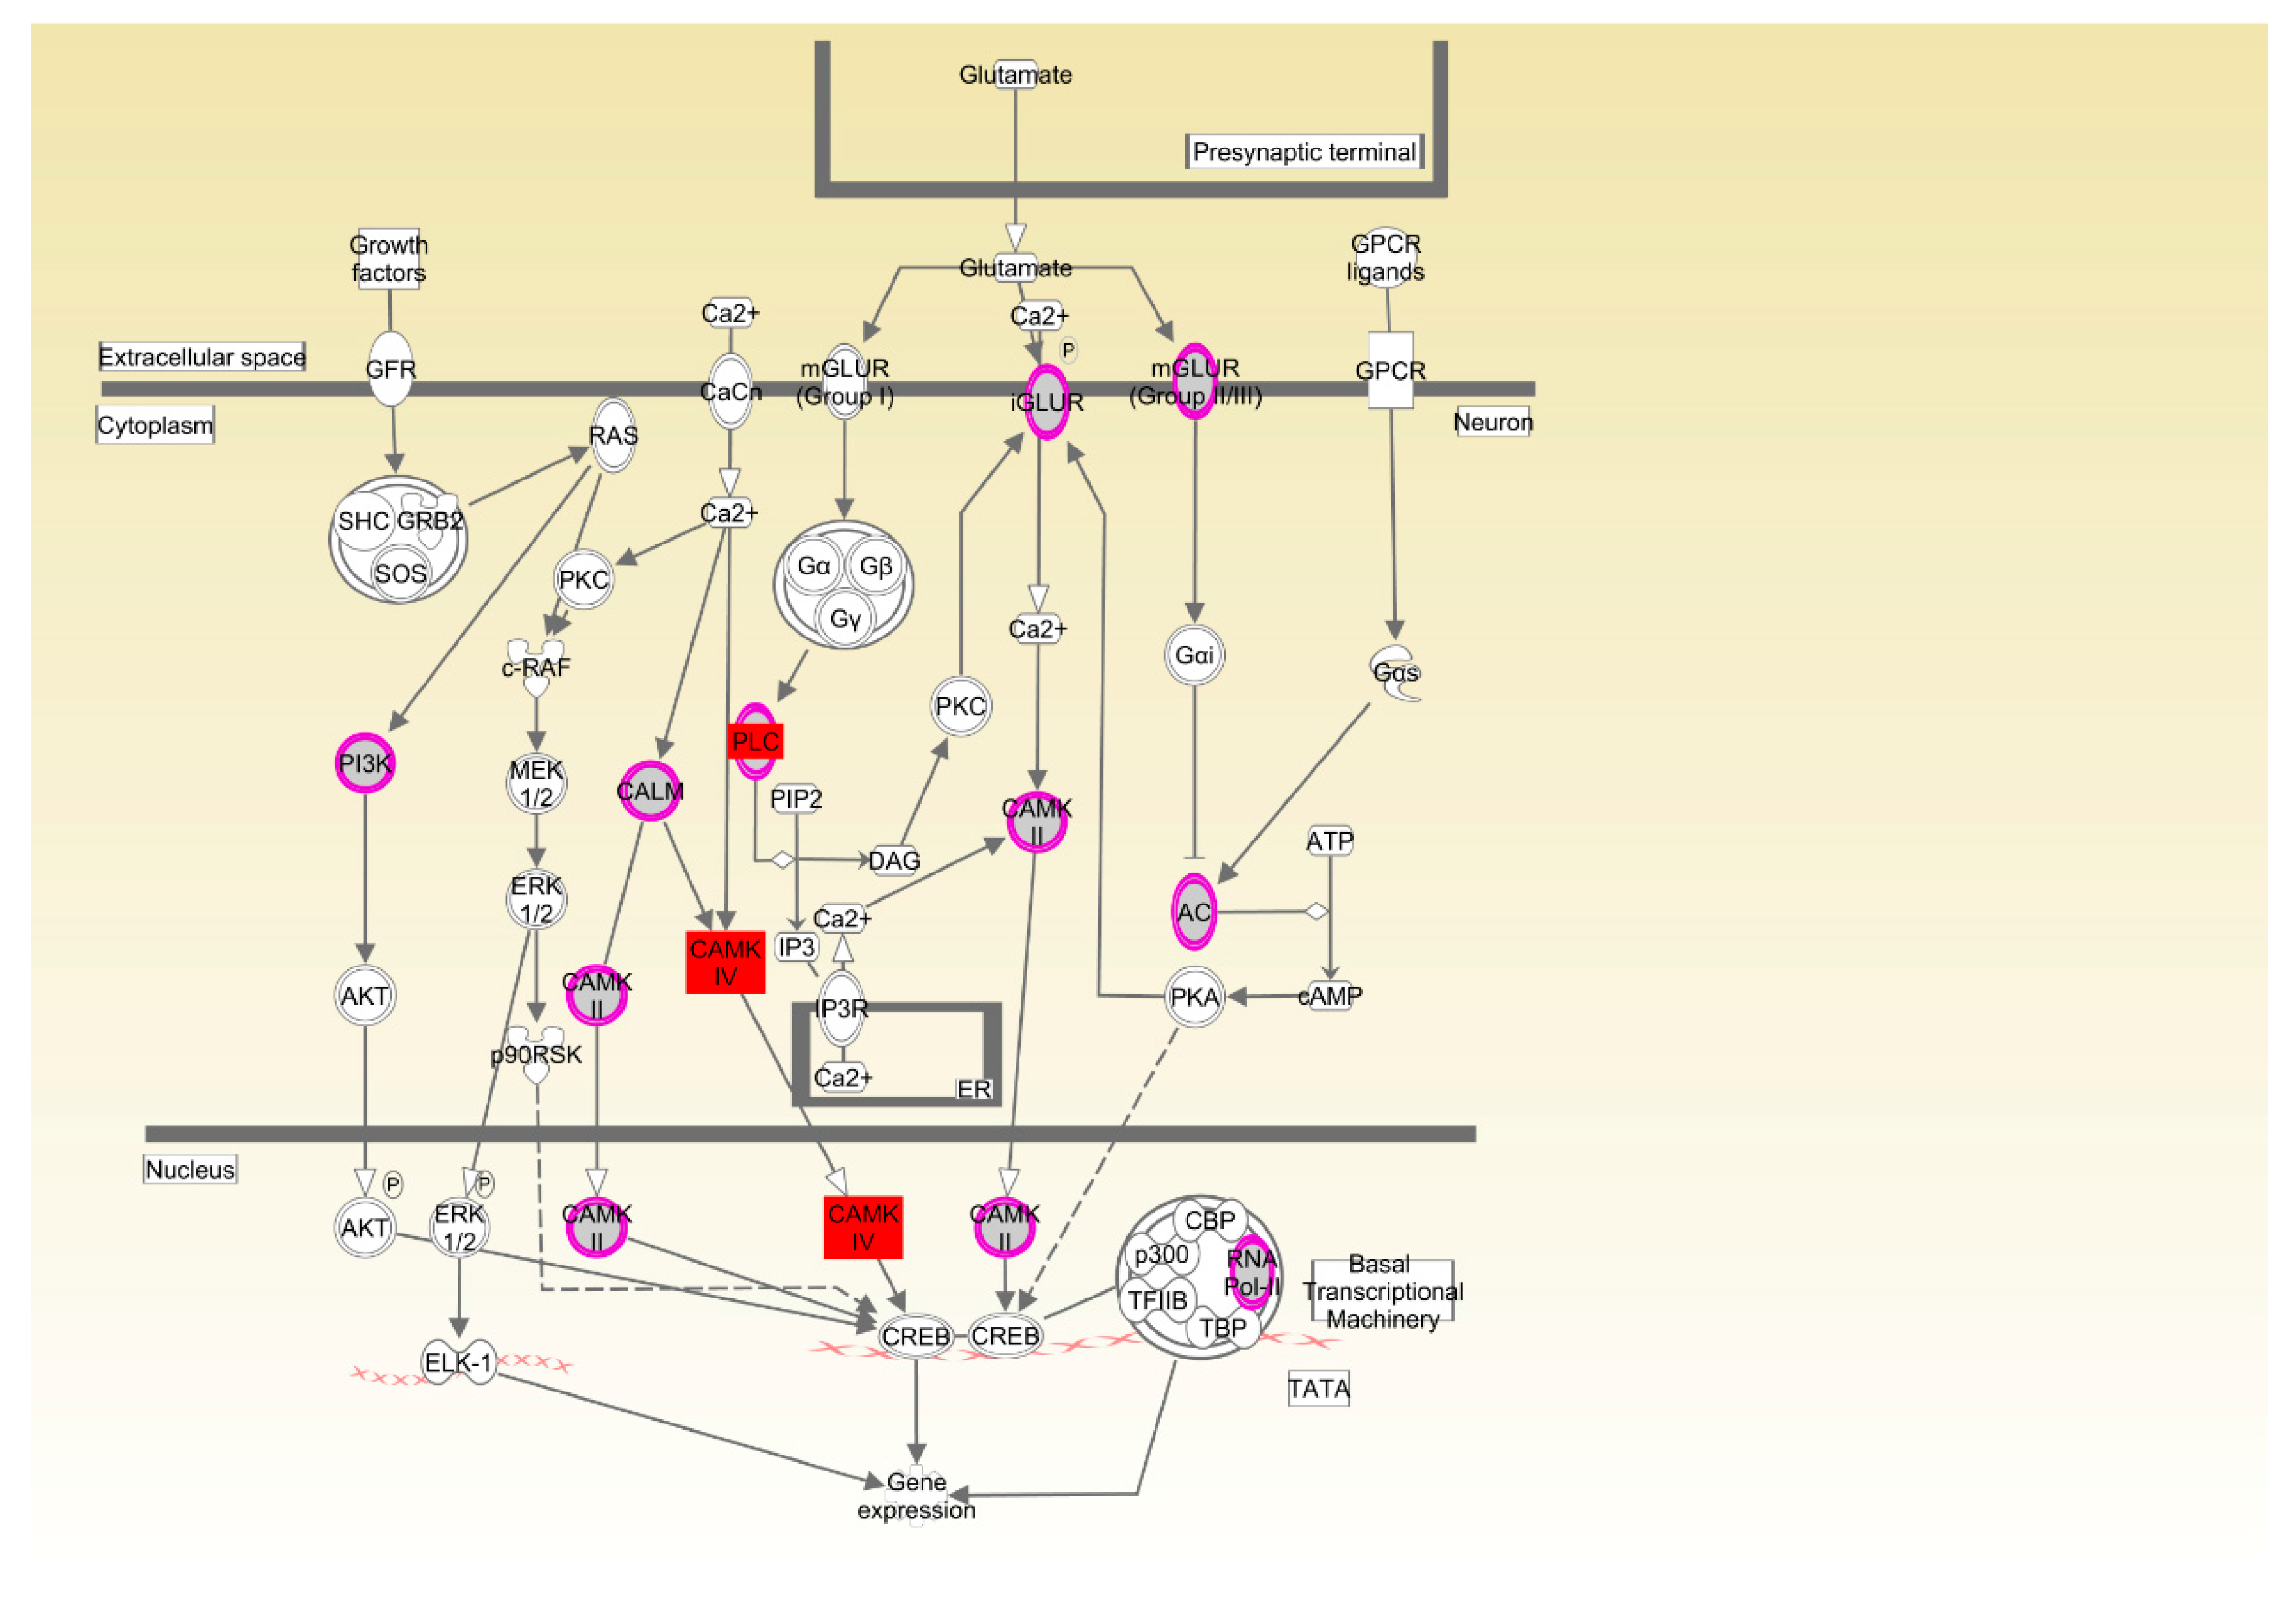
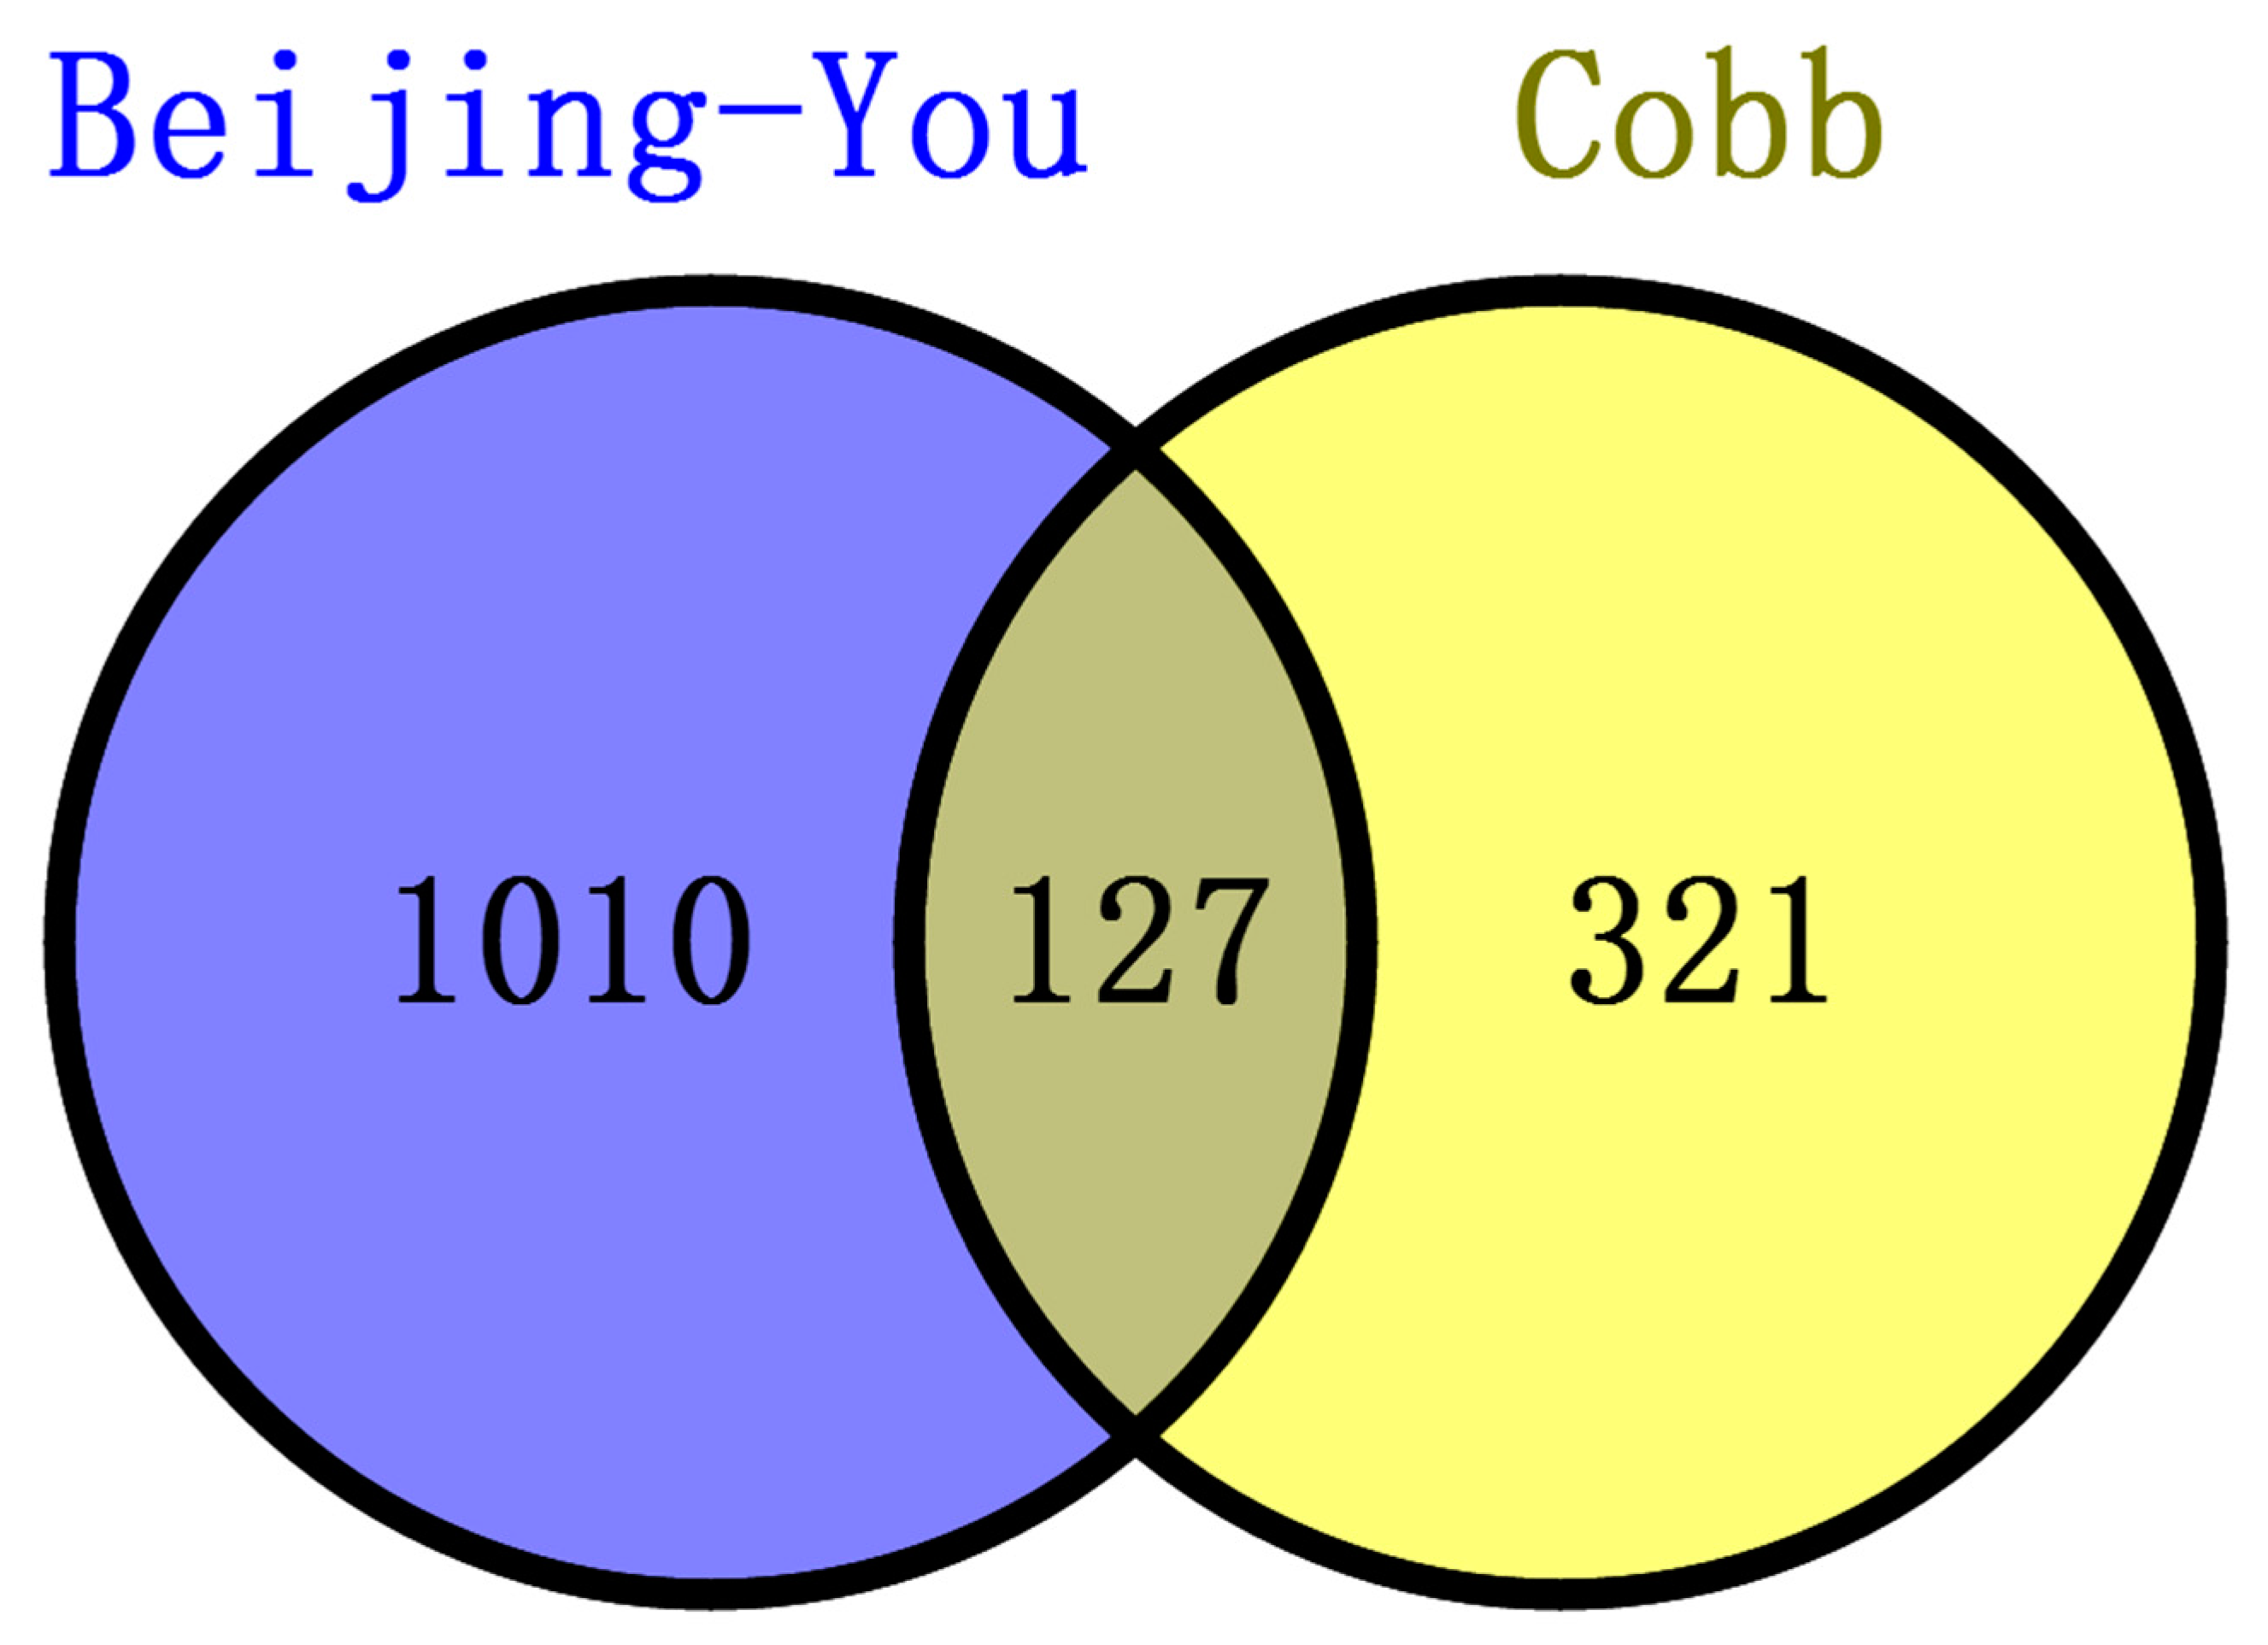
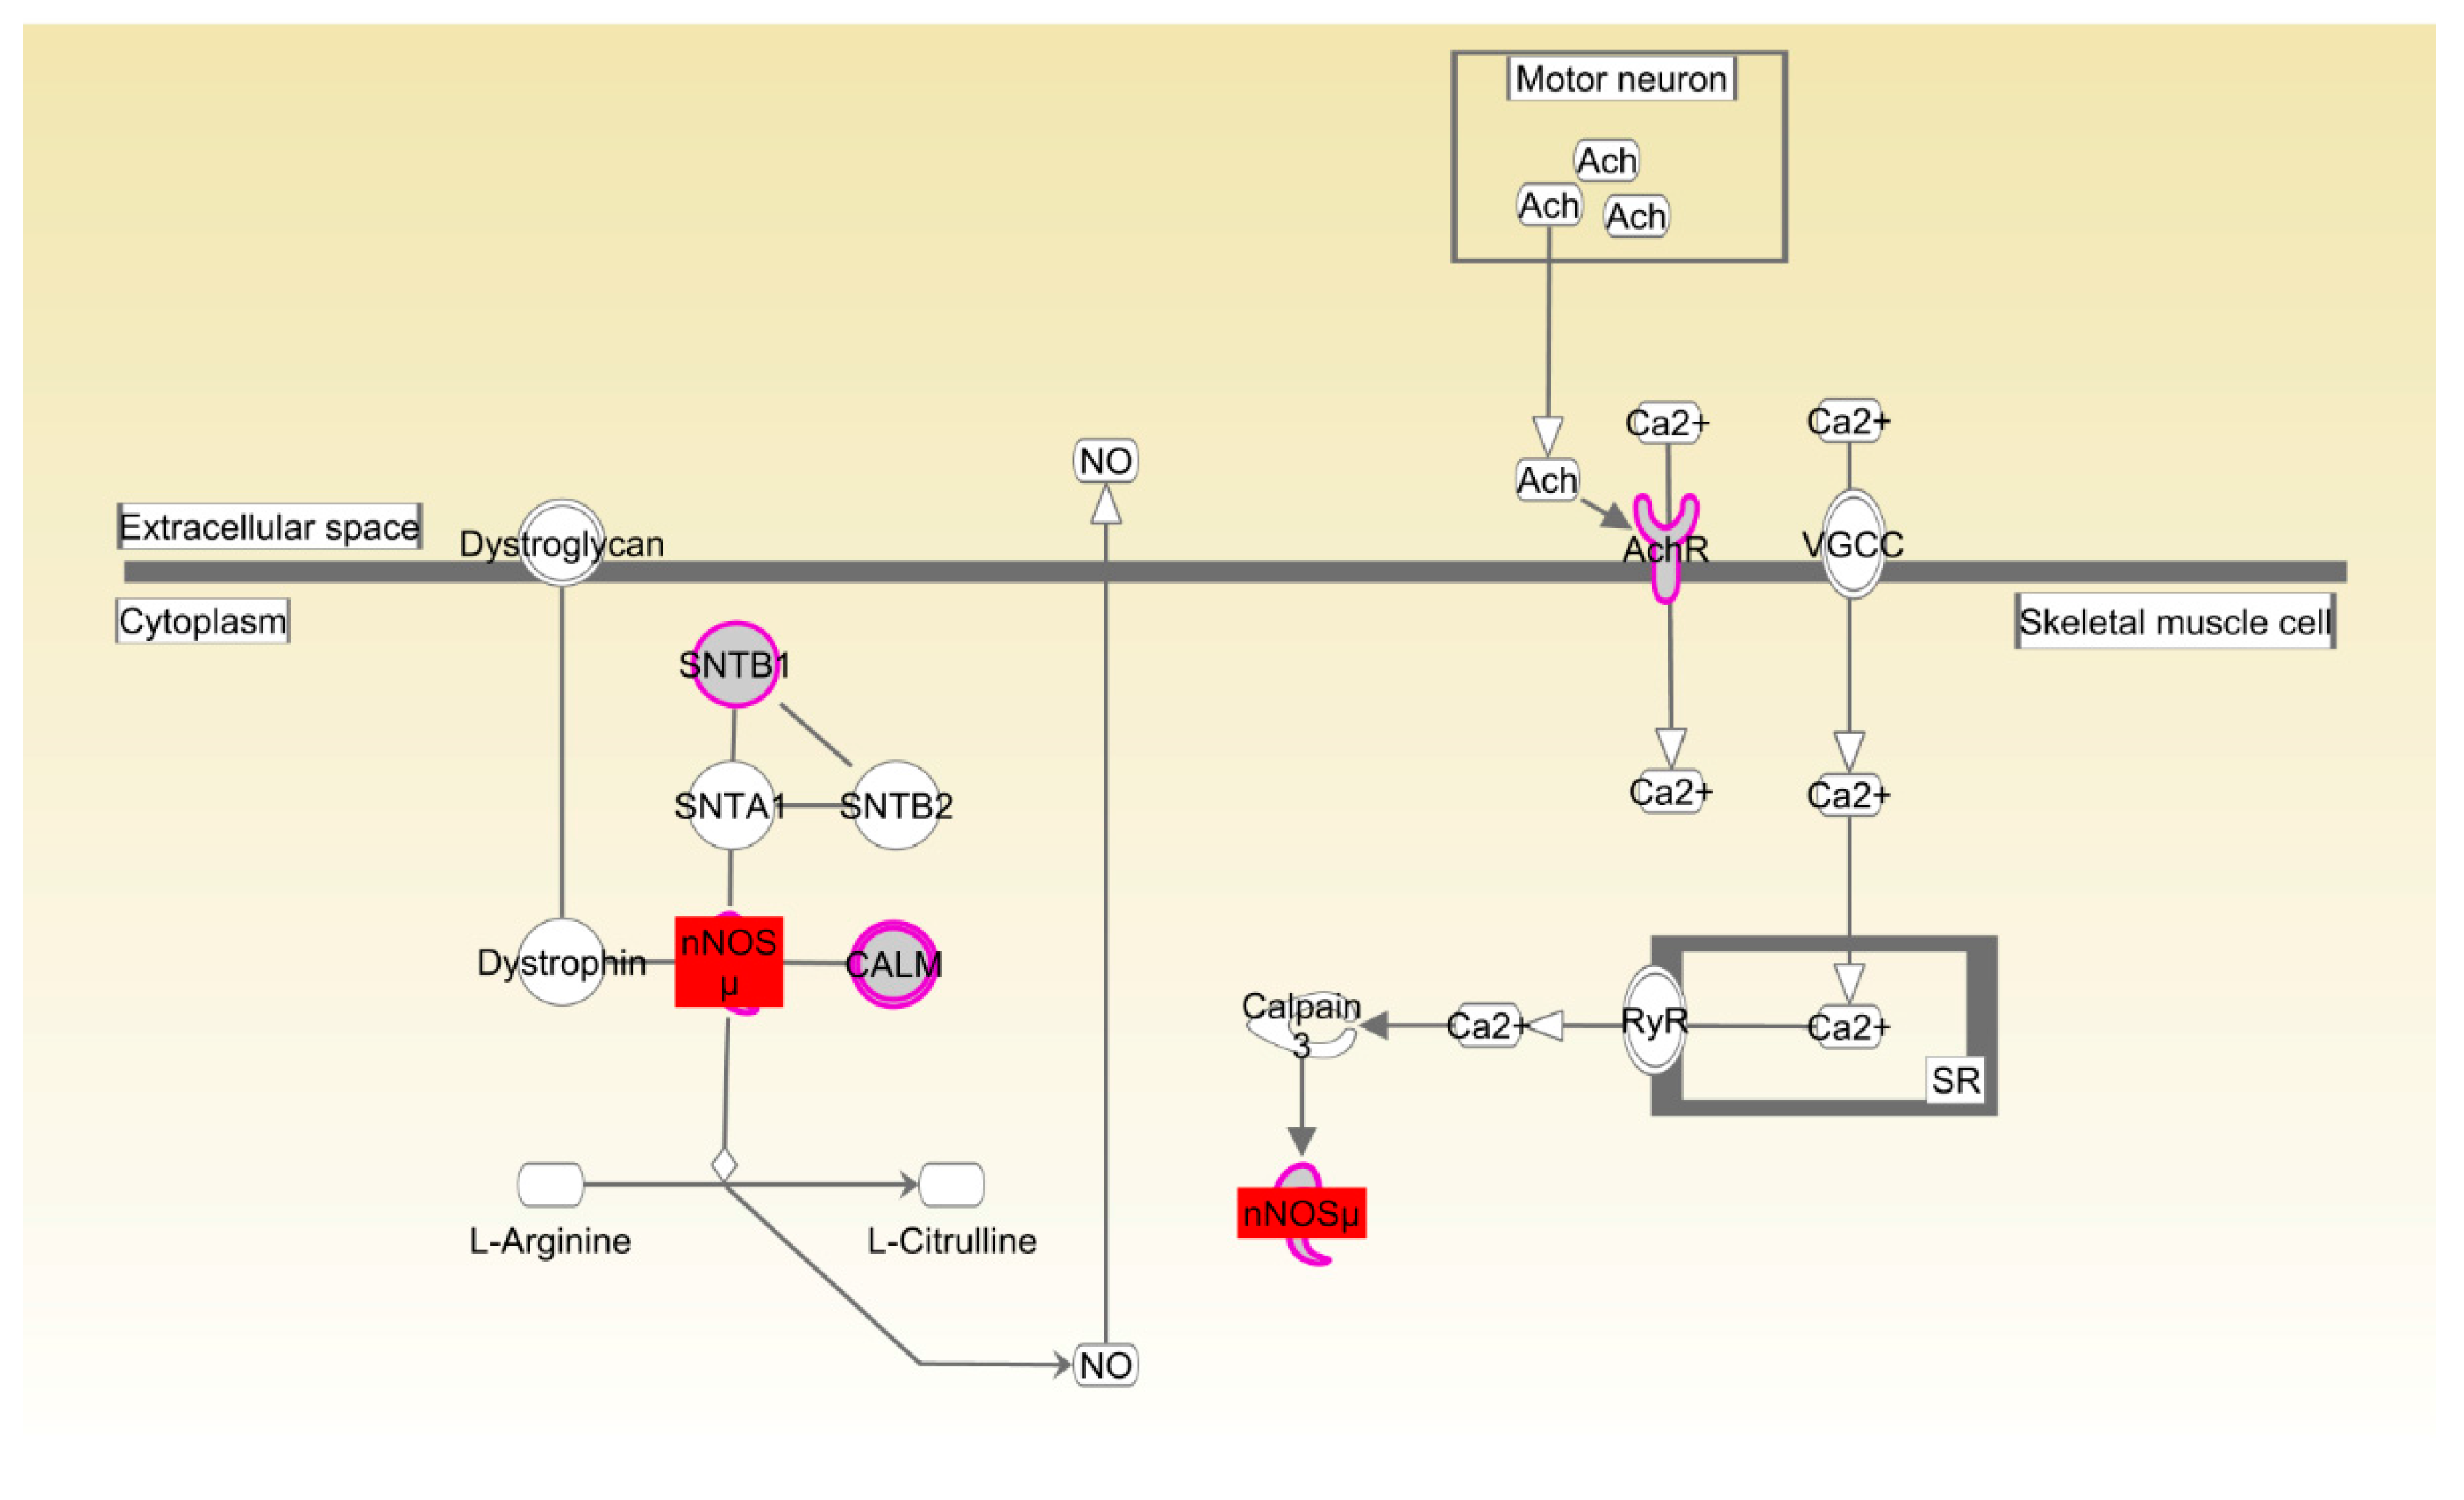
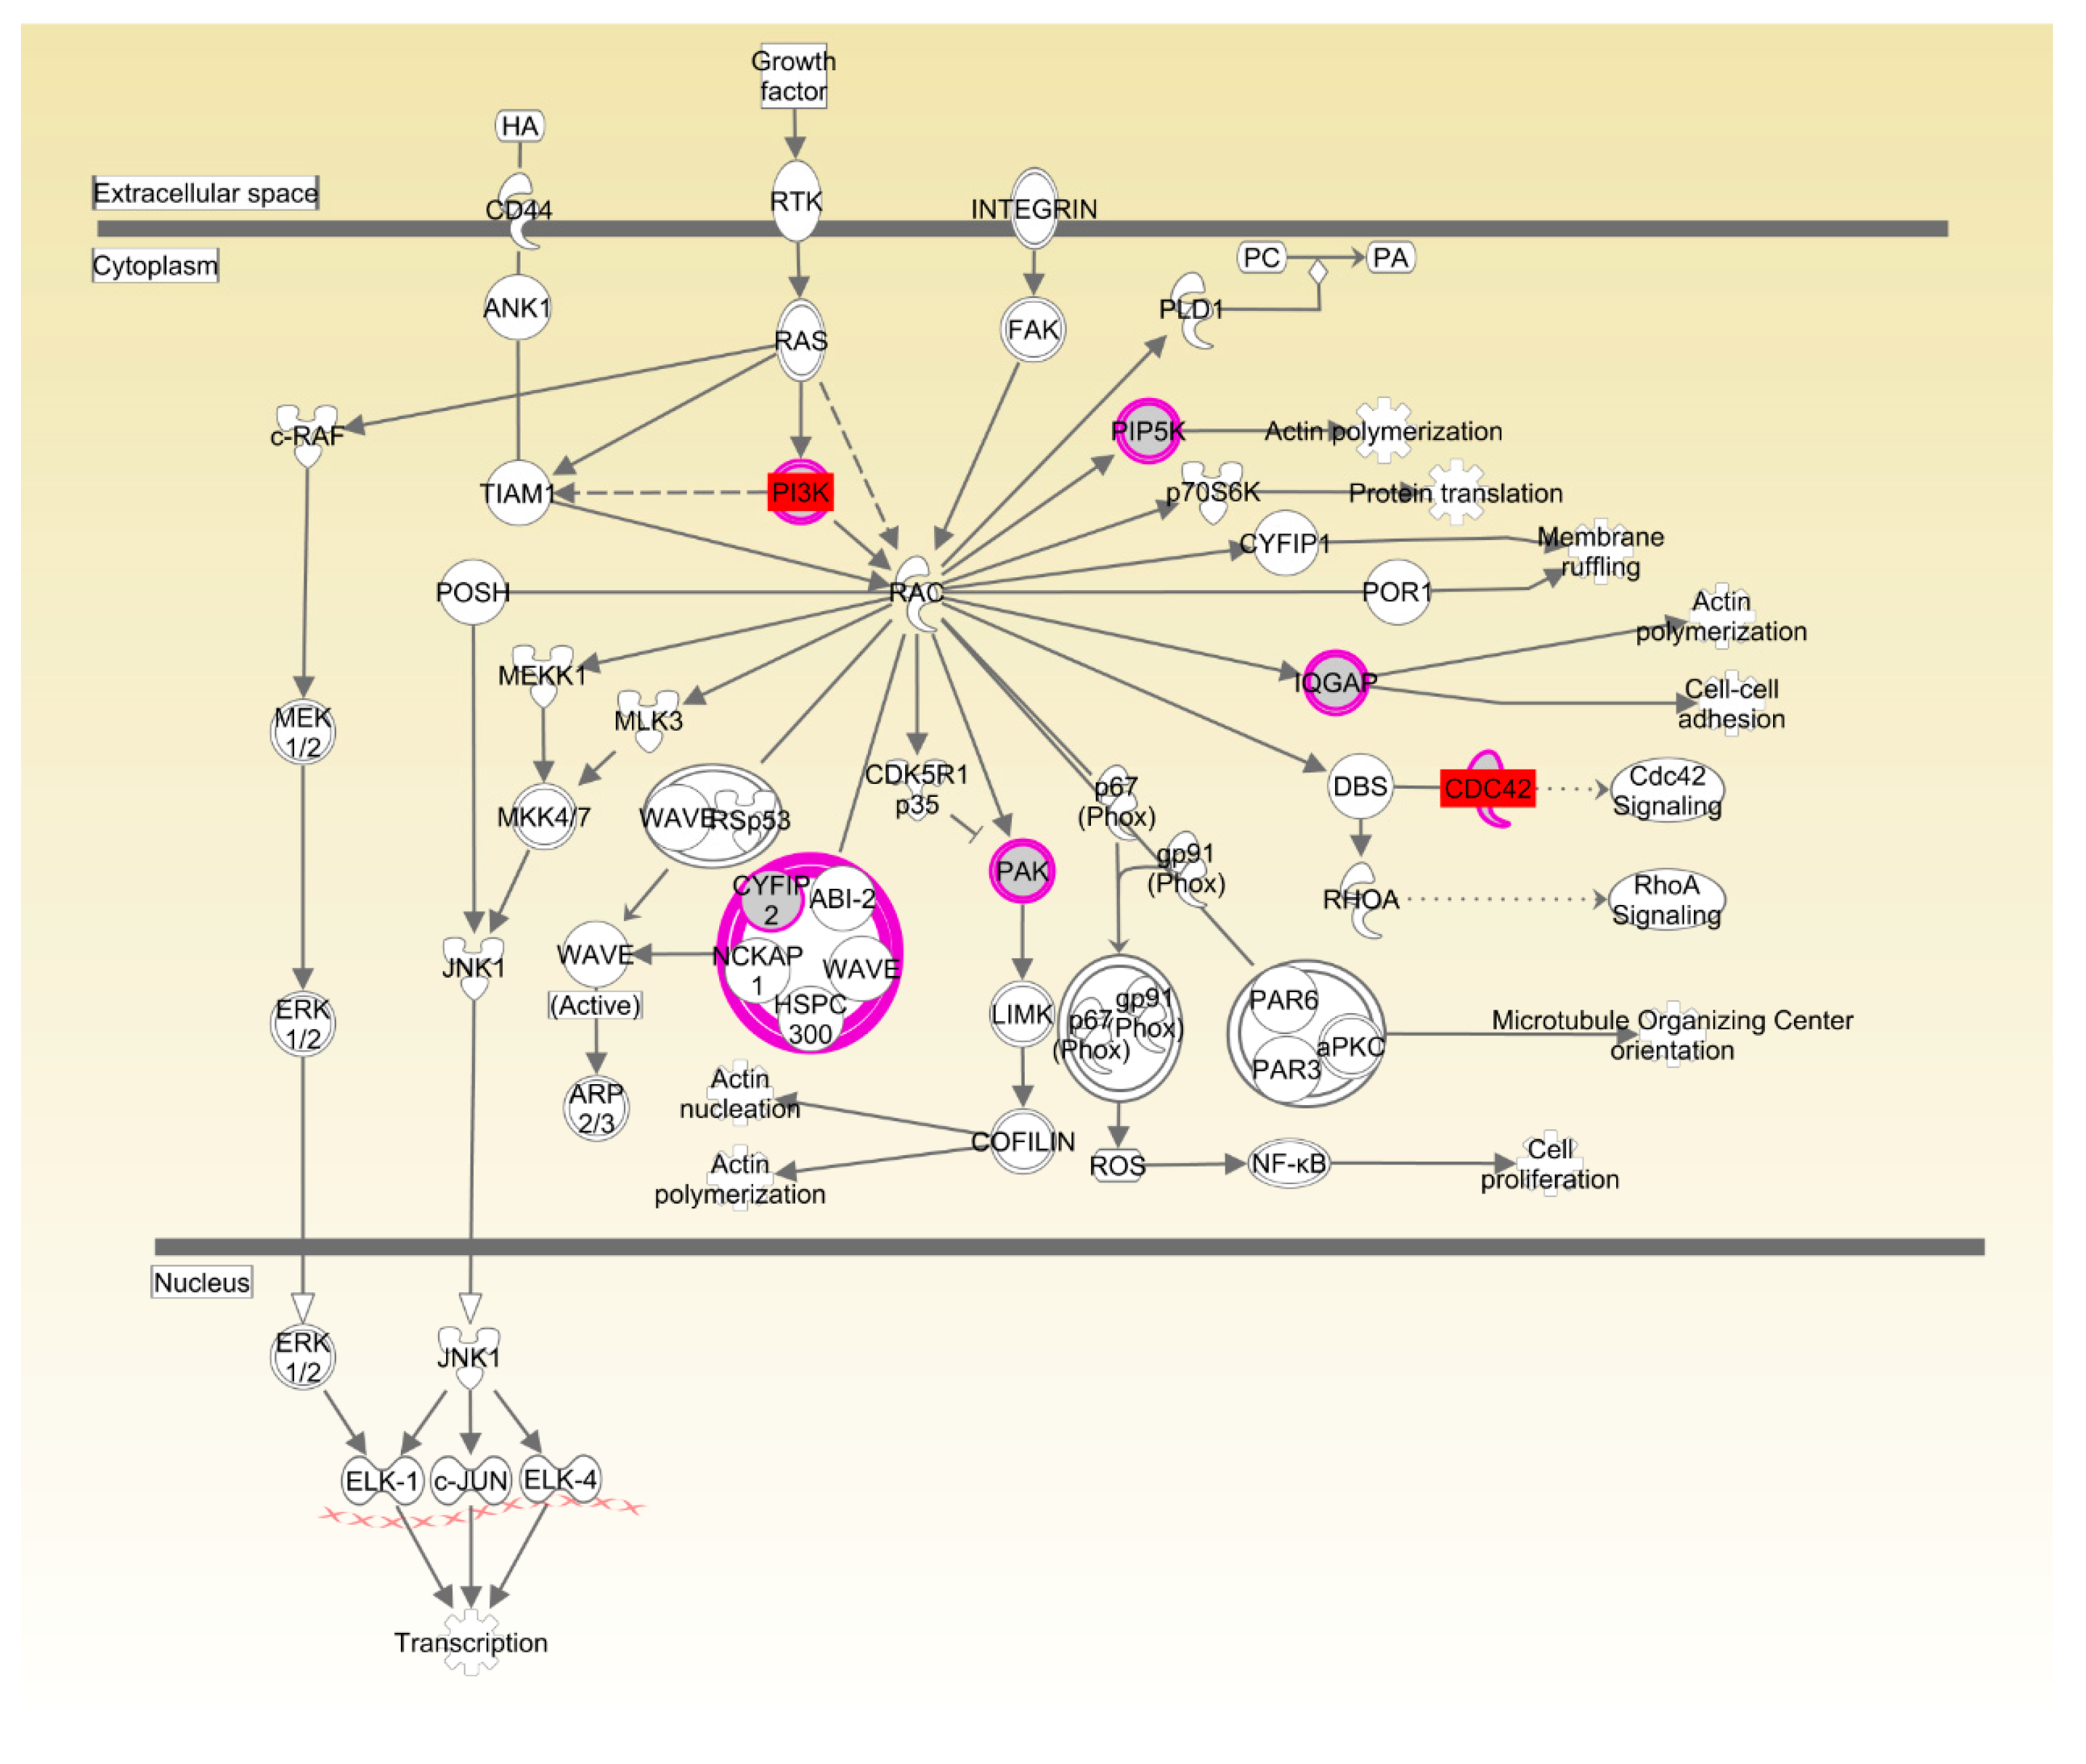
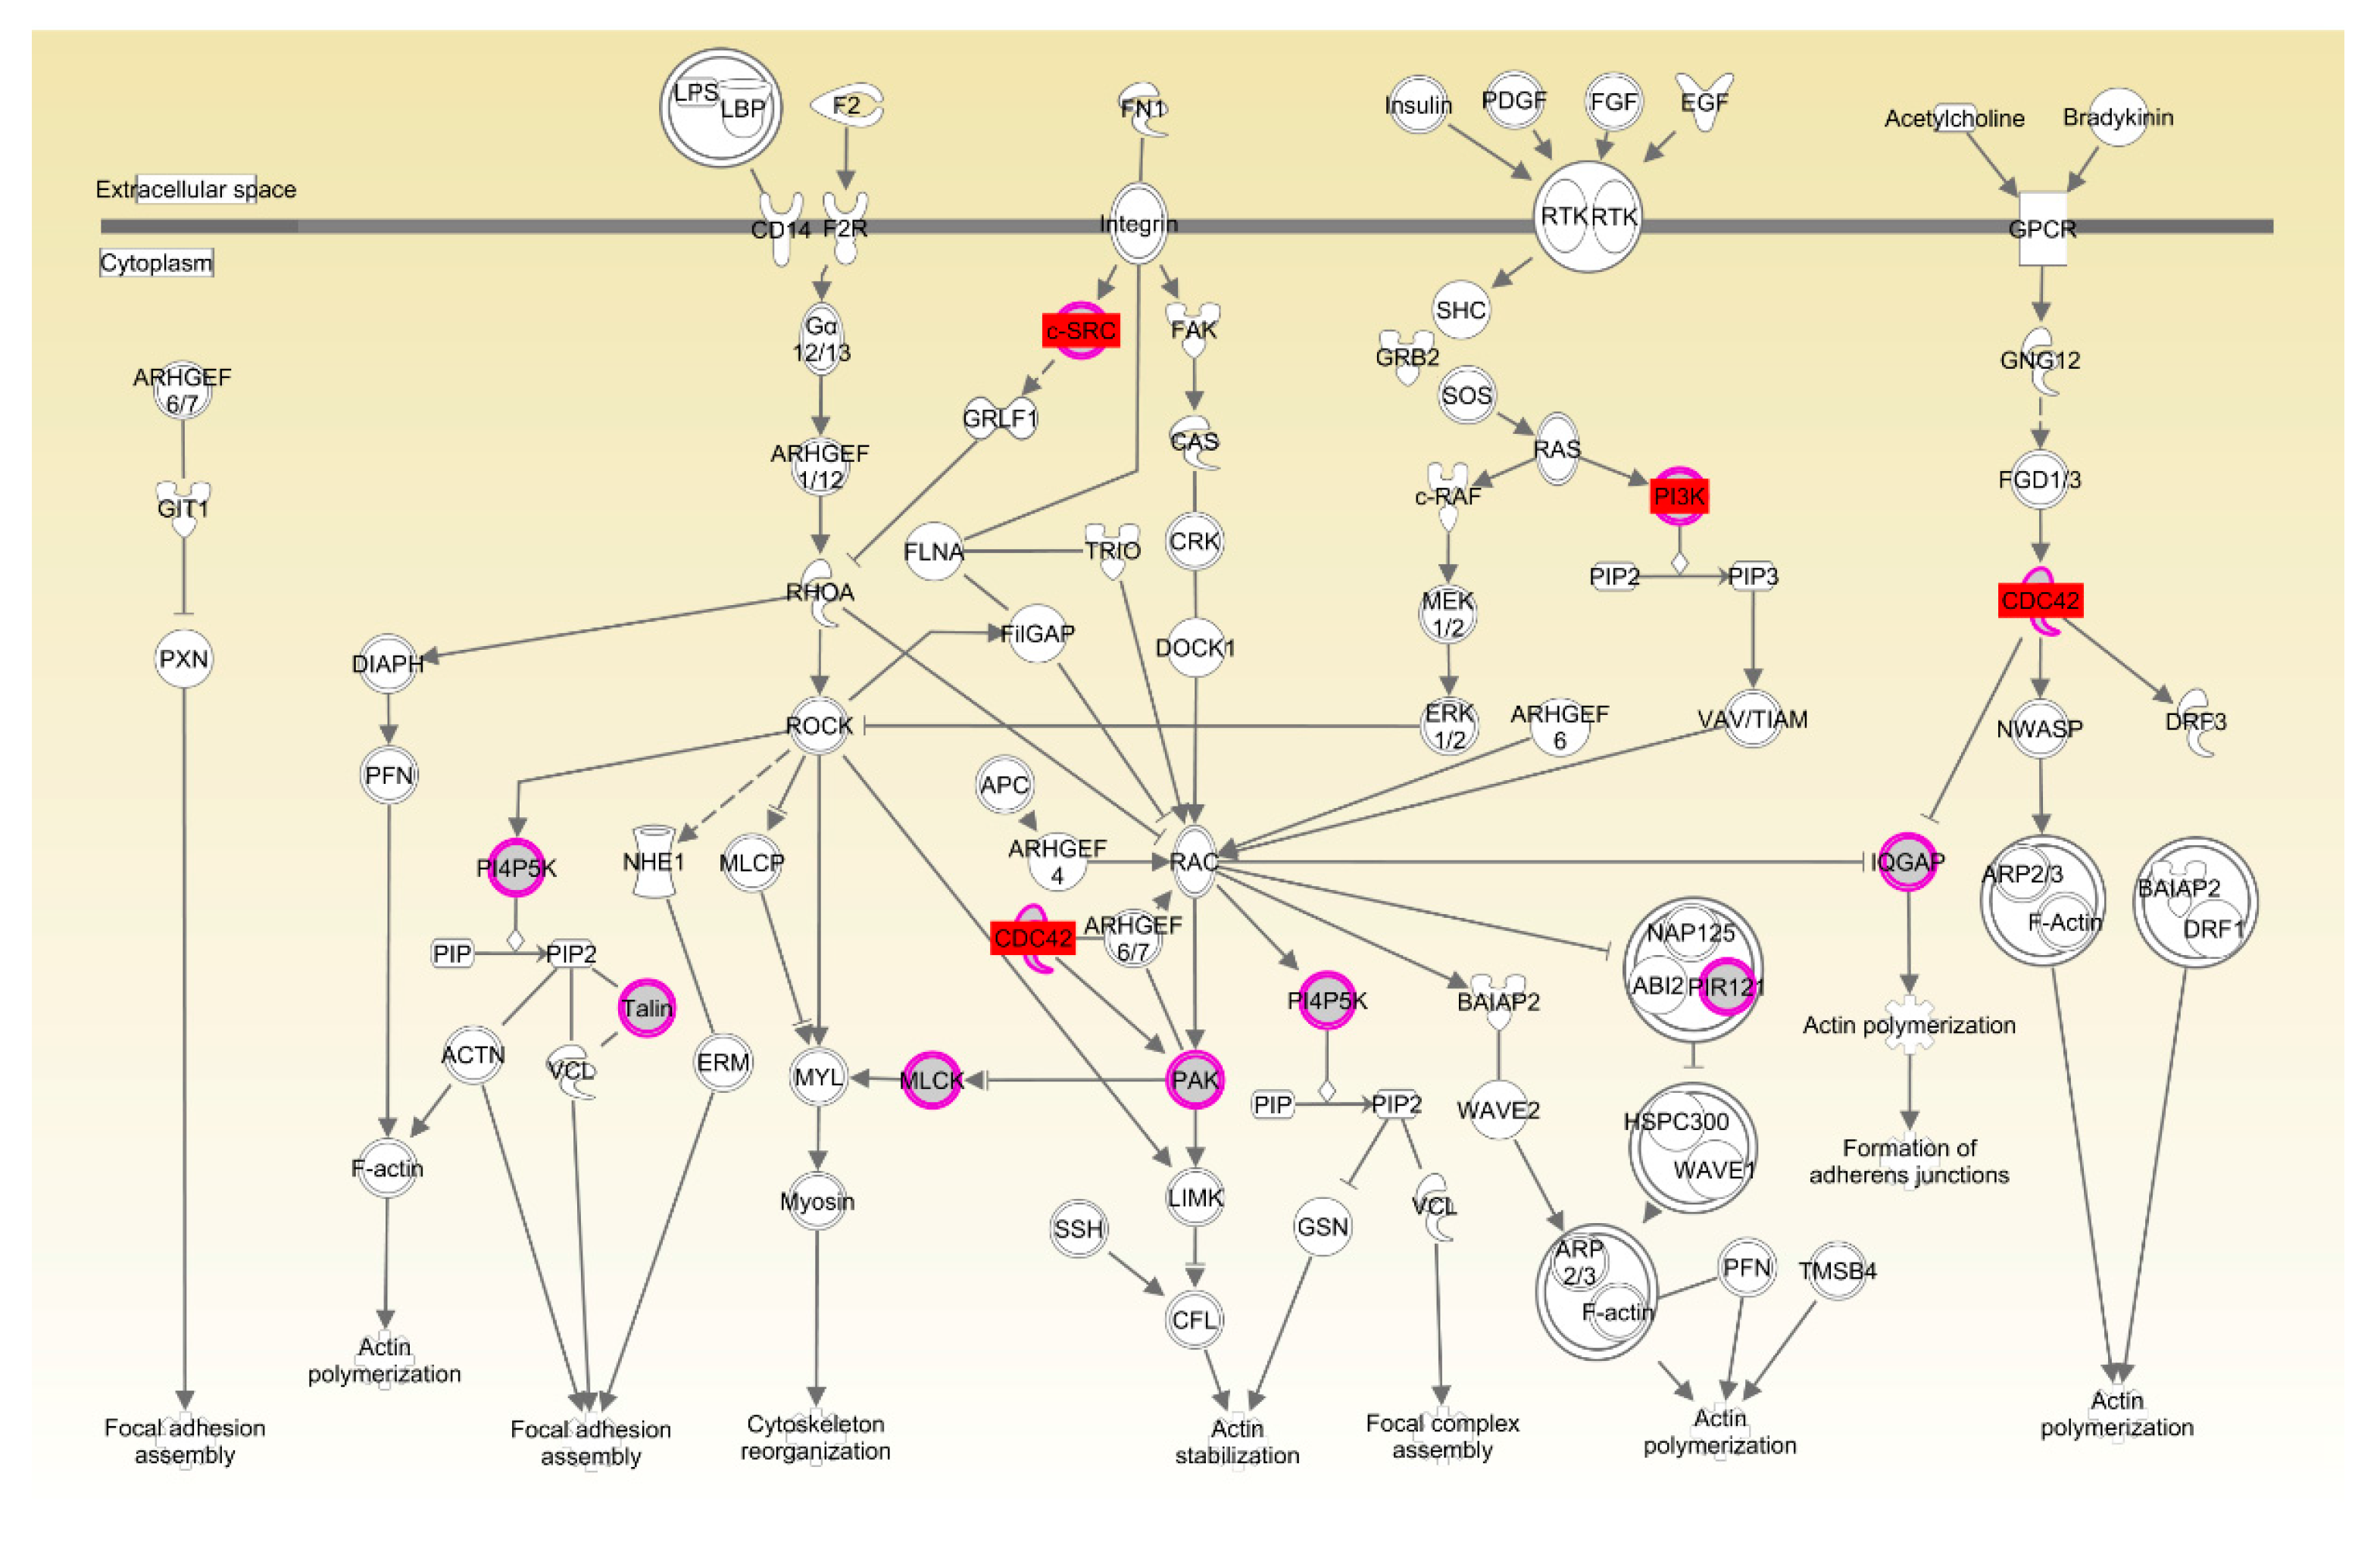
| Breed | Experimental Population | Family No. of the Population | Birds for High and Low RFI Group | Family No. of Sub-Group | No. of DNA Pools | Average Coverage/Pool |
|---|---|---|---|---|---|---|
| Beijing-You | 200 males | 75:153 (males:females) | 48 HRFI | 33:40 (males:females) | 3 | 20× |
| 200 females | 48 LRFI | 35:39 (males:females) | 3 | 20× | ||
| Cobb | 220 males | 64 (males) | 48 HRFI | 34 (males) | 3 | 20× |
| 48 LRFI | 28 (males) | 3 | 20× |
| Breed | Measurement | LRFI | HRFI | p-Value |
|---|---|---|---|---|
| Beijing-You | RFI (g) | −239.73 ± 74.97 | 300.67 ± 120.98 | <0.01 |
| DFI (g) | 88.34 ± 15.11 | 107.28 ± 16.43 | <0.01 | |
| Initial BW (g) | 820.58 ± 115.79 | 805.15 ± 95.36 | >0.05 | |
| Final BW (g) | 1364.38 ± 254.89 | 1357.27 ± 218.45 | >0.05 | |
| ADG (g) | 19.42 ± 5.49 | 19.54 ± 4.72 | >0.05 | |
| FCR | 4.70 ± 0.58 | 5.62 ± 0.63 | <0.01 | |
| Cobb | RFI (g) | −93.83 ± 7.29 | 104.09 ± 54.41 | <0.01 |
| DFI (g) | 141.12 ± 14.36 | 157.52 ± 6.11 | <0.01 | |
| Initial BW (g) | 1012.71± 66.78 | 1018.92 ± 58.71 | >0.05 | |
| Final BW (g) | 2109.06 ± 175.07 | 2139.08 ± 96.29 | >0.05 | |
| ADG (g) | 78.31 ± 11.22 | 80.01 ± 5.15 | >0.05 | |
| FCR | 1.82 ± 0.12 | 1.97 ± 0.05 | <0.01 |
| Breed | Name | p-Value | No. Genes |
|---|---|---|---|
| Beijing-You | Nervous system development and function | 2.28 × 10⁻²–3.54 × 10⁻⁷ | 134 |
| Tissue development | 2.52 × 10⁻²–3.54 × 10⁻⁷ | 269 | |
| Connective tissue development and function | 2.52 × 10⁻²–2.36 × 10⁻⁵ | 116 | |
| Skeletal and muscular system development and function | 2.32 × 10⁻²–2.36 × 10⁻⁵ | 111 | |
| Organismal development | 2.39 × 10⁻²–1.07 × 10⁻⁴ | 254 | |
| Cobb | Nervous system development and function | 2.86 × 10⁻²–3.27 × 10⁻⁴ | 69 |
| Tissue morphology | 2.86 × 10⁻²–3.27 × 10⁻⁴ | 47 | |
| Behavior | 2.86 × 10⁻²–8.17 × 10⁻⁴ | 9 | |
| Connective tissue development and function | 2.86 × 10⁻²–8.17 × 10⁻⁴ | 12 | |
| Skeletal and muscular system development and function | 2.86 × 10⁻²–8.17 × 10⁻⁴ | 17 |
| Breed | Name | p-Value | Overlap |
|---|---|---|---|
| Beijing-You | nNOS signaling in skeletal muscle cells | 2.18 × 10⁻³ | 44.4%, 4/9 |
| All-trans-decaprenyl diphosphate biosynthesis | 4.81 × 10⁻³ | 100.0%, 2/2 | |
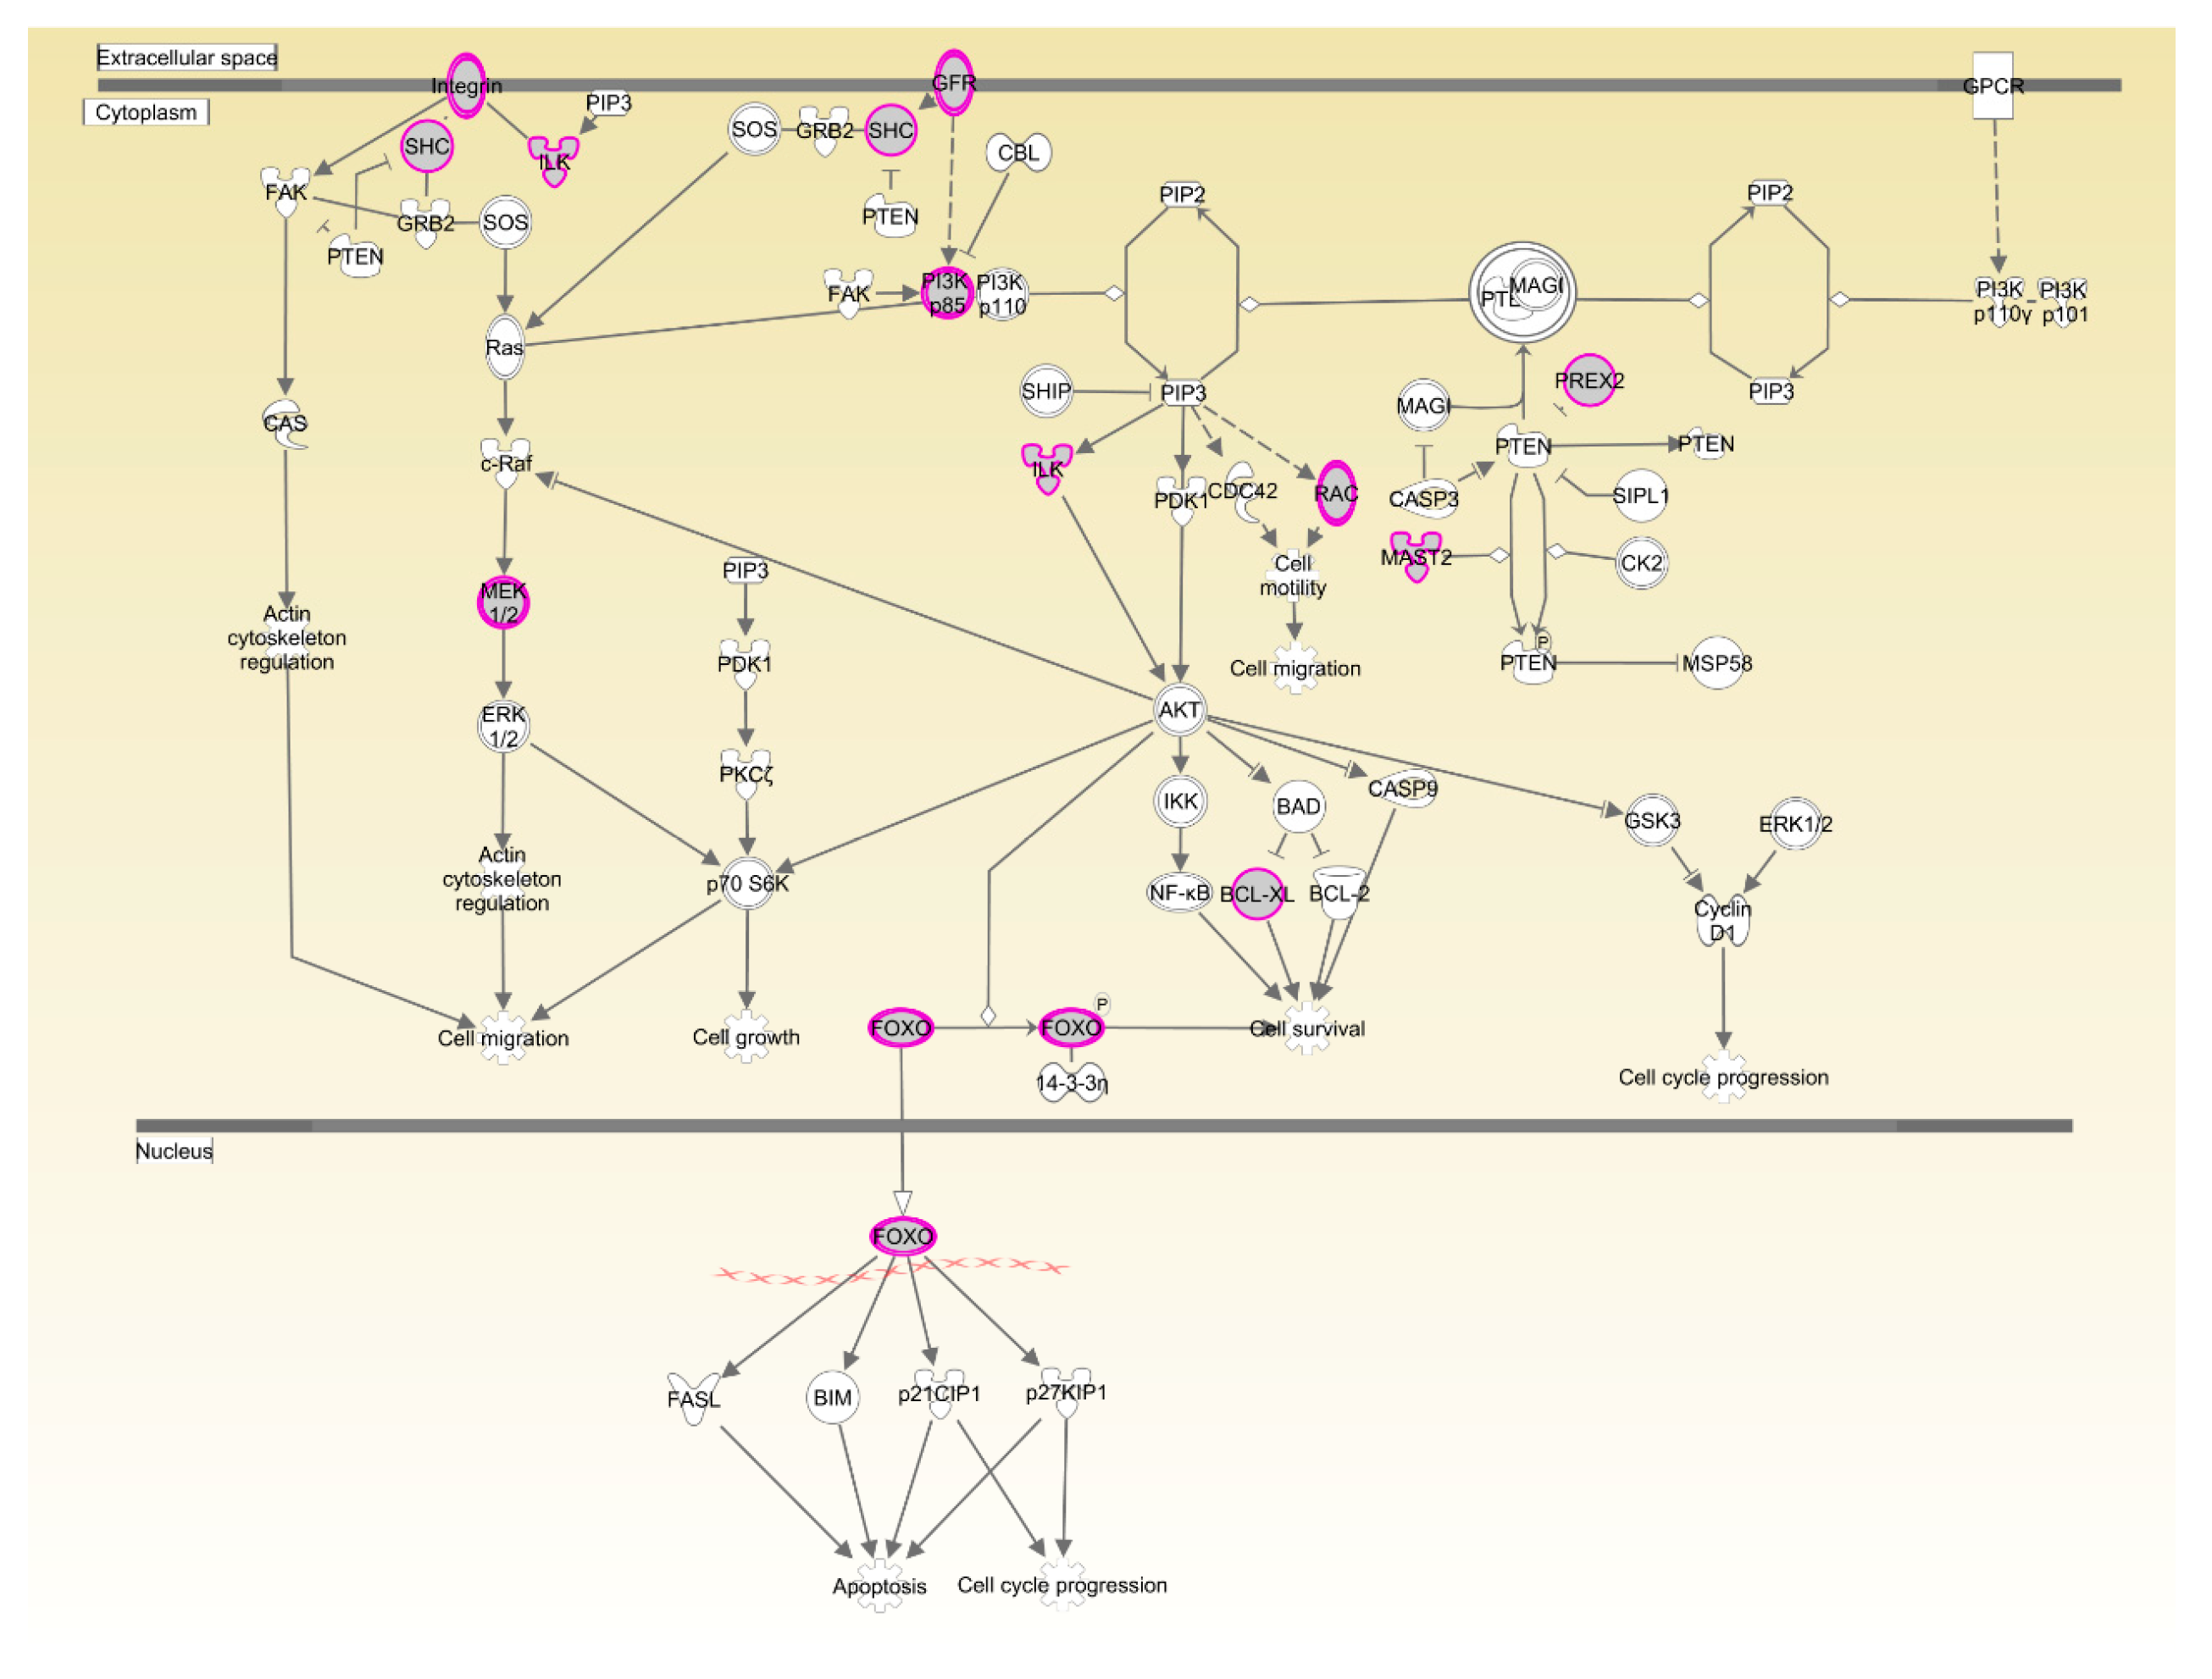
| PTEN signaling | 9.73 × 10⁻³ | 14.3%, 13/91 | |
| Small cell lung cancer signaling | 1.09 × 10⁻² | 15.9%, 10/63 | |
| CNTF signaling | 1.28 × 10⁻³ | 17.4%, 8/46 | |
| Cobb | CREB signaling in neurons | 3.68 × 10⁻³ | 7.8%, 10/128 |
| T cell receptor signaling | 6.38 × 10⁻³ | 9.1%, 7/77 | |
| Neuropathic pain signaling in dorsal horn neurons | 1.02 × 10⁻² | 8.3%, 7/84 | |
| Rac signaling | 1.37 × 10⁻² | 7.9%, 7/89 | |
| Actin cytoskeleton signaling | 1.42 × 10⁻² | 8.3%, 7/84 |
| GGA a | SNP | Position | p-Value | Candidate/Nearest Gene | Location b |
|---|---|---|---|---|---|
| 13 | rs317270265 | 12, 853, 825 | 8.12 × 10⁻⁶ | CANX | Downstream |
| 21 | rs14286155 | 6, 350, 615 | 3.06 × 10⁻⁵ | CDC42 | Intron |
| 2 | rs315791208 | 23, 470, 408 | 4.36 × 10⁻⁵ | GNG11 | Intron |
| 13 | rs317965159 | 10, 726, 350 | 0.000684 | CYFIP2 | Intron |
| 2 | rs315951802 | 56, 946, 139 | 0.001189 | ATP9B | Intron |
| 15 | - | 7, 489, 912 | 0.001298 | MN1 | Extron |
| 1 | rs15213482 | 25, 118, 696 | 0.001437 | TES | Intron |
| Z | rs312714432 | 7, 564, 759 | 0.002362 | FAM219A | Intron |
| 1 | rs14080181 | 468, 436 | 0.003409 | PPP6R2 | Intron |
| 1 | rs318069175 | 25, 124, 828 | 0.003993 | TES | Intron |
| 15 | rs15775634 | 7, 501, 967 | 0.004145 | MN1 | Intron |
| Z | - | 46, 332, 884 | 0.005222 | STARD4 | Upstream |
| 15 | rs314540962 | 7, 528, 893 | 0.005293 | PITPNB | Downstream |
| 1 | rs315382419 | 130, 499, 091 | 0.005896 | GABRG3 | Intron |
| 1 | rs317493245 | 130, 499, 100 | 0.006448 | GABRG3 | Intron |
| 6 | rs14588839 | 27, 221, 456 | 0.007046 | CCDC186 | Intron |
| 18 | - | 4, 638, 932 | 0.007055 | UNC13D, ENSGALG00000002278 | Downstream |
| 4 | - | 66, 157, 841 | 0.008525 | TXK, TEC | Upstream |
| 6 | - | 20, 250, 604 | 0.008611 | HHEX | Downstream |
| 10 | rs316109660 | 1, 504, 159 | 0.008684 | NEO | Intron |
| 7 | rs316483815 | 26, 455, 736 | 0.009332 | ADCY5 | Intron |
| 27 | rs14301531 | 1, 697, 235 | 0.011689 | PSMC5, FTSJ3, ENSGALG00000000293, SMARCD2 | Upstream, Extron, Downstream, Downstream |
| 7 | rs15872356 | 26, 615, 279 | 0.015109 | ADCY5 | Intron |
| 7 | rs315234262 | 26, 817, 253 | 0.019031 | MYLK | Intron |
| Z | - | 6, 813, 606 | 0.019644 | KIAA1328 | Intron |
| 20 | rs13633836 | 8, 919, 435 | 0.020108 | HAR1A | Upstream |
| Z | - | 6, 847, 225 | 0.02043 | KIAA1328 | Intron |
| 6 | rs312986238 | 27, 242, 319 | 0.020633 | TDRD1 | Upstream |
| 5 | - | 16, 429, 960 | 0.022312 | TPCN2 | Intron |
| 2 | rs15931222 | 28, 639, 260 | 0.024226 | BZW2 | Intron |
| 4 | rs315081661 | 12, 239, 357 | 0.024332 | USP12P1 | Downstream |
| 4 | - | 36, 460, 098 | 0.024731 | GRID2 | Intron |
| 4 | rs318158632 | 5, 122, 558 | 0.026111 | NOX1, ENSGALG00000006637, ENSGALG00000020303 | Upstream, Intron, Downstream |
| 26 | rs14300622 | 4, 106 ,086 | 0.027252 | SCUBE3 | Intron |
| 15 | rs14092096 | 7, 493, 037 | 0.029197 | MN1 | Intron |
| 3 | rs15269609 | 8, 547, 001 | 0.030645 | MSH2 | Intron |
| 4 | rs15588679 | 56, 165, 356 | 0.033439 | CAMK2D | Intron |
| 2 | rs313915675 | 39, 376, 196 | 0.034241 | CMC1 | Intron |
| 4 | rs16400807 | 45, 122, 907 | 0.034602 | NUDT9, ENSGALG00000010963 | Upstream |
| 6 | - | 20, 691, 988 | 0.039963 | BLNK | Intron |
| 4 | rs13523480 | 56, 160, 482 | 0.041005 | CAMK2D | Intron |
| 2 | - | 145, 118, 378 | 0.042982 | TRAPPC9 | Intron |
| 4 | - | 67, 677, 262 | 0.045337 | GRXCR1 | Intron |
| 2 | rs15067942 | 16, 967, 429 | 0.048495 | KIAA1217 | Intron |
| 3 | rs14316028 | 8, 484, 254 | 0.049147 | FAM179A, TEC | Upstream |
| 13 | rs313110716 | 3, 909, 846 | 0.049643 | SLIT3 | Intron |
| SNP | GGA | Position | N | Genotype | LSM ± SD | Additive Effect | Dominance Effect |
|---|---|---|---|---|---|---|---|
| rs15213482 | chr1 | 25, 118, 696 | 125 | AA | 35.02 ± 7.65 B | 14.41 | −10.70 |
| 330 | AG | 9.91 ± 4.69 A | |||||
| 320 | GG | 6.20 ± 4.76 A | |||||
| rs318069175 | chr1 | 25, 124, 828 | 318 | AA | 6.08 ± 4.79 A | −12.95 | −8.31 |
| 329 | AG | 10.72 ± 4.71 A | |||||
| 127 | GG | 31.98 ± 7.63 B | |||||
| - | chr2 | 145, 118, 378 | 276 | CC | 1.57 ± 5.14 A | −12.65 | 0.17 |
| 357 | TC | 14.39 ± 4.50 AB | |||||
| 141 | TT | 26.86 ± 7.18 B | |||||
| rs315791208 | chr2 | 23, 470, 408 | 166 | AA | −3.58 ± 6.62 A | −8.82 | 12.43 |
| 380 | AG | 17.67 ± 4.36 B | |||||
| 230 | GG | 14.05 ± 5.61 B | |||||
| rs313915675 | chr2 | 39, 376, 196 | 623 | AA | 9.67 ± 3.44 a | 10.14 | 29.01 |
| 123 | AC | 28.55 ± 7.72 b | |||||
| 27 | CC | −10.60 ± 16.47 a | |||||
| rs315951802 | chr2 | 56, 946, 139 | 64 | AA | −1.63 ± 10.68 a | −10.64 | −3.53 |
| 293 | AG | 5.49 ± 5.00 a | |||||
| 417 | GG | 19.66 ± 4.2 b | |||||
| rs318158632 | chr4 | 5, 122, 558 | 249 | AA | 14.44 ± 5.41 b | 8.36 | 11.93 |
| 362 | AG | 18.01 ± 4.50 b | |||||
| 167 | GG | −2.29 ± 6.59 a | |||||
| rs315081661 | chr4 | 12, 239, 357 | 215 | CC | 15.95 ± 5.82 b | 8.83 | 10.09 |
| 386 | TC | 17.21 ± 4.35 b | |||||
| 175 | TT | −1.71 ± 6.45 a | |||||
| - | chr5 | 16, 429, 960 | 246 | AA | 23.49 ± 5.46 b | 10.08 | −5.28 |
| 363 | AT | 8.13 ± 4.50 a | |||||
| 164 | TT | 3.33 ± 6.70 a | |||||
| rs316109660 | chr10 | 1, 504, 159 | 50 | AA | 32.29 ± 12.03 b | 7.97 | −20.56 |
| 325 | AG | 3.76 ± 4.72 a | |||||
| 400 | GG | 16.34 ± 4.27 b | |||||
| - | chr18 | 4, 638, 932 | 223 | CC | 23.67 ± 5.72 B | 10.90 | −1.90 |
| 361 | CG | 10.86 ± 4.48 AB | |||||
| 193 | GG | 1.86 ± 6.16 A | |||||
| - | chrZ | 46, 332, 884 | 133 | AA | 12.64 ± 7.68 AB | −2.78 | −20.25 |
| 145 | AG | −4.82 ± 7.53 A | |||||
| 497 | GG | 18.21 ± 3.90 B |
© 2018 by the authors. Licensee MDPI, Basel, Switzerland. This article is an open access article distributed under the terms and conditions of the Creative Commons Attribution (CC BY) license (http://creativecommons.org/licenses/by/4.0/).
Share and Cite
Liu, J.; Liu, R.; Wang, J.; Zhang, Y.; Xing, S.; Zheng, M.; Cui, H.; Li, Q.; Li, P.; Cui, X.; et al. Exploring Genomic Variants Related to Residual Feed Intake in Local and Commercial Chickens by Whole Genomic Resequencing. Genes 2018, 9, 57. https://doi.org/10.3390/genes9020057
Liu J, Liu R, Wang J, Zhang Y, Xing S, Zheng M, Cui H, Li Q, Li P, Cui X, et al. Exploring Genomic Variants Related to Residual Feed Intake in Local and Commercial Chickens by Whole Genomic Resequencing. Genes. 2018; 9(2):57. https://doi.org/10.3390/genes9020057
Chicago/Turabian StyleLiu, Jie, Ranran Liu, Jie Wang, Yonghong Zhang, Siyuan Xing, Maiqing Zheng, Huanxian Cui, Qinghe Li, Peng Li, Xiaoyan Cui, and et al. 2018. "Exploring Genomic Variants Related to Residual Feed Intake in Local and Commercial Chickens by Whole Genomic Resequencing" Genes 9, no. 2: 57. https://doi.org/10.3390/genes9020057
APA StyleLiu, J., Liu, R., Wang, J., Zhang, Y., Xing, S., Zheng, M., Cui, H., Li, Q., Li, P., Cui, X., Li, W., Zhao, G., & Wen, J. (2018). Exploring Genomic Variants Related to Residual Feed Intake in Local and Commercial Chickens by Whole Genomic Resequencing. Genes, 9(2), 57. https://doi.org/10.3390/genes9020057


