Atmosphere 2023, 14(4), 730; https://doi.org/10.3390/atmos14040730 - 18 Apr 2023
Cited by 2 | Viewed by 1905
Abstract
The available data on the impact of air pollution on acute exacerbations of chronic obstructive pulmonary disease (AECOPD) are inconsistent. We investigated the influence of air pollution on the number of severe AECOPD hospitalizations of non-infectious etiology in patients residing in Novi Sad,
[...] Read more.
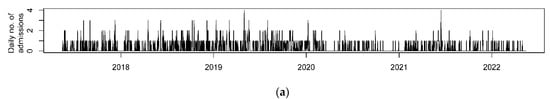
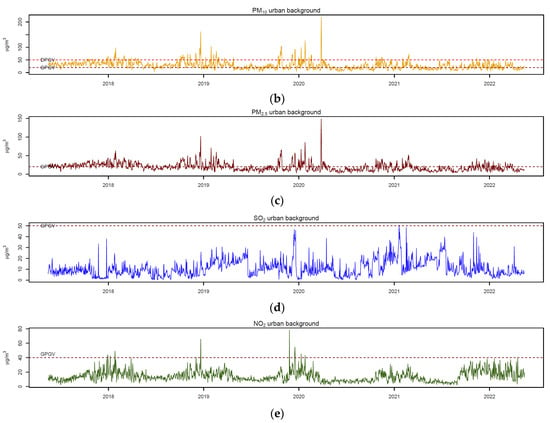
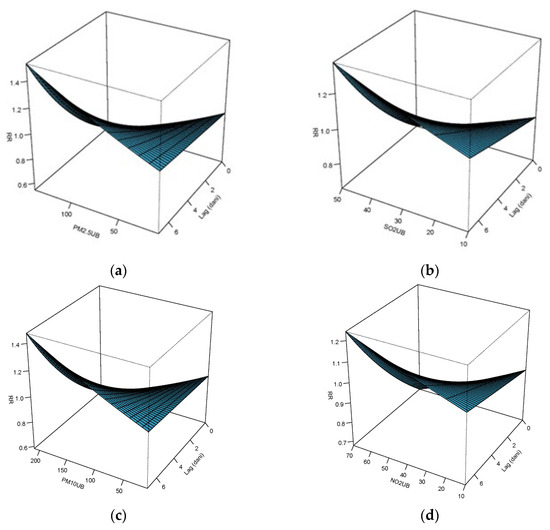
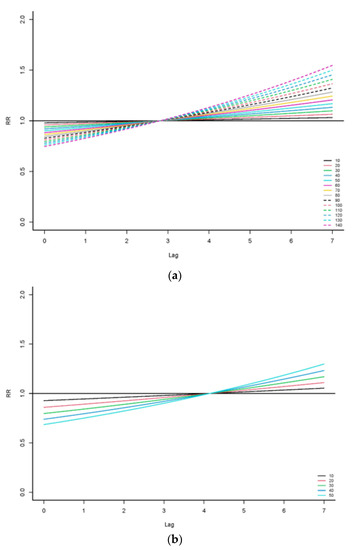
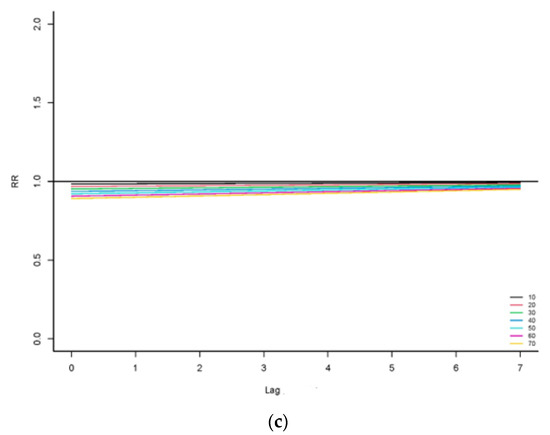
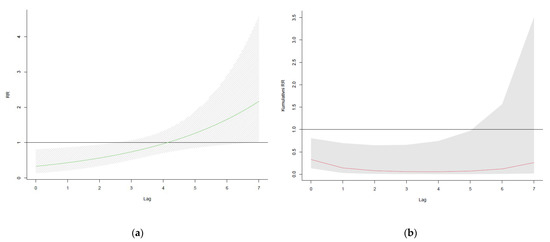
The available data on the impact of air pollution on acute exacerbations of chronic obstructive pulmonary disease (AECOPD) are inconsistent. We investigated the influence of air pollution on the number of severe AECOPD hospitalizations of non-infectious etiology in patients residing in Novi Sad, Serbia. In this time-series, we used a quasi-Poisson generalized linear model in conjunction with distributed lag non-linear models, after controlling for lag days, seasonal and long-term trends, and meteorological factors (air temperature and humidity), to estimate the relative risk (RR) of AECOPD hospitalization for each increase of 10 μg/m3 in the air pollutant concentration. A total of 552 AECOPD hospitalizations were registered during 2017–2022. With each 10 μg/m3 increase in the selected air pollutants’ concentration, the cumulative RR (lags0–7) in single-predictor models for AECOPD admission were 1.52 (95% CI 0.98–2.35) for PM10, 1.44 (95% CI 0.93–2.25) for PM2.5, 1.13 (95% CI 0.87–1.47) for SO2, and 0.99 (95% CI 0.69–1.42) for NO2. Similar results were found in multi-predictor models as well as in group analyses between smokers and non-smokers. In conclusion, no significant associations between exposure to air pollutants and the daily AECOPD admissions were found. There is an obvious need for additional research on the topic.
Full article
(This article belongs to the Special Issue Outdoor Air Pollution and Human Health (2nd Edition))
►
Show Figures
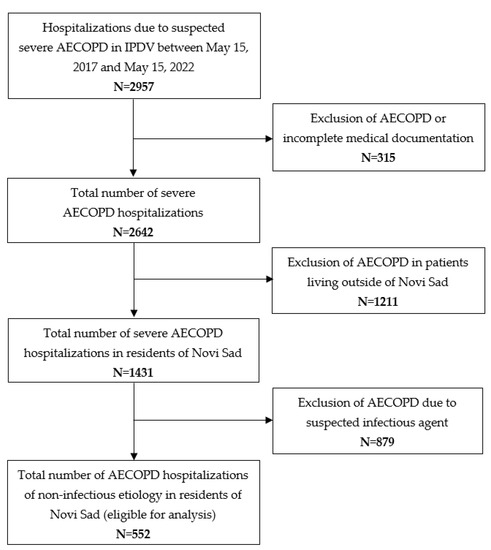
Figure 1


