Article

Glaciers Variation at ‘Shocking’ Pace in the Northeastern Margin of Tibetan Plateau from 1957 to 21st Century: A Case Study of Qiyi Glacier

1
School of Geography and Tourism, Shaanxi Normal University, Xi’an 711019, China
2
Department of Environment, Geology, and Natural Resources, Ball State University, Muncie, IN 47304, USA
3
College of Urban and Environmental Sciences, Northwest University, Xi’an 710027, China
*
Authors to whom correspondence should be addressed.
Atmosphere 2023, 14(4), 723; https://doi.org/10.3390/atmos14040723
Submission received: 13 March 2023 / Revised: 7 April 2023 / Accepted: 10 April 2023 / Published: 16 April 2023
(This article belongs to the Section Climatology)

Abstract

:
Accelerating glacier shrinkage is one of the most consequential of global warming. Yet, projections for the region remain ambiguous because of the tremendous spatial heterogeneity, especially in the Qilian Mountains, where glacier melt runoff is a vital water resource for the arid downstream area. To better understand glacier changes in this region, this study took regional representative Qiyi Glacier as an example and applied an enhanced distributed surface mass balance (SMB) model to glimpse the SMB variation and possible impacts on melt runoff under the RCP 4.5 and RCP 8.5 scenarios. Further, we combined a modified volume-scaling method to update the glacier geometry gradually to enhance long-term reliability. When forced with observed daily temperature and precipitation, the reconstructed glacier SMB, from 1957 through 2013, agrees well with the in situ observations. The result indicates an abrupt change for SMB from positive to negative in 1992 and subsequent mass accelerated loss after 2000. The increased summer air temperature and the pattern of large-scale atmospheric circulation shifts might both cause these changes. Using projected climate forcing from as many as 31 coupled GCMs from the CMIP 5 ensemble, the Qiyi Glacier is projected to undergo sustained SMB loss throughout the 21st century for both RCPs. By 2100, the Qiyi Glacier will lose ~25 m water equivalent (w.e.) for RCP 4.5 and ~37 m w.e. for RCP 8.5. Whereas the glacier area will shrink by 43% for RCP 4.5 and 54% for RCP 8.5 relative to 2013 glacier content, corresponding to the volume of the Qiyi Glacier will lose by 54% for RCP 4.5 and by 65% for RCP 8.5, accordingly. Simultaneously, the glacier terminus will experience extreme melts. The terminus elevation of the Qiyi Glacier will retreat from 4310 m a.s.l. in 2013 to 4810 m a.s.l. (RCP 4.5) and 4838 m a.s.l. (RCP 8.5) by the end of 2100, which will exceed the multi-year average ELA (4749 m) from 1957 to 2013. If the warming trends keep and glaciers melt like the Qiyi Glacier with this ‘shocking’ rate, it will raise the possibility of crippling, long-term water shortages for Hexi corridors.

1. Introduction

The glaciers in Tibet Plateau (TP) and adjacent regions are commonly named the “water towers” of Asia [1,2] as they play a vital role in the regional and global hydrological cycle [3], specifically in the drought-prone and semi-arid regions of northwest China. The discharge of meltwater from glaciers holds immense importance in preserving the fragile ecological balance and promoting sustainable socio-economic progress of the region [4]. According to previous studies, the glacier melt contributes about 22–40% to the local river runoff of western China. The contribution is even higher in some areas, e.g., Qilian Mountains [5]. Owing to their small scale and highly variable sensitivity to climate change [6], mountain glaciers show a worldwide trend of accelerating shrinkage due to the climate warming trend of the last several decades [1,7,8]. Glacier retreats are significantly worse in the arid-endorheic basin of the Qilian Mountains, which shows a general retreating trend since the Little Ice Age [4], and accelerated reduction since 1956 [9,10,11]. These changes have and will continue to profoundly affect the surrounding environment and endanger the oasis cities and terminal lakes in the most water-scarce region of the Hexi corridor, one of western China’s most significant ecological barriers and ecologically fragile areas.
Thus, glacier variation in the Qilian Mountains has long been the focus of attention of the Chinese government and the communities [10]. The Qiyi Glacier is regarded as a representative glacier in the region [5,12] and has been investigated since 1958, which is recognized as the first systemically studied glacier in China [13]. Studying this representative glacier could enable us to understand the glacier-climate interaction and provide a glimpse into future regional glacier variation and impacts. Unfortunately, until now, there are only several discretely single years of investigations completed in the 1970s, 1980s, 2000–2003, and 2011–2013 [12,14], leaving a significant knowledge gap in fully understanding the status of glacier variation. Moreover, earlier studies were mainly carried out in situ, such as on the ice formation process, surface mass balance, equilibrium-line altitude (ELA), area change, ice flow, and so on [9,11,15,16]. Notwithstanding, remote sensing and 3S methods currently have been adopted to monitor glaciers and their reflection on climate change [4,17]; however, their results still have significant uncertainties due to lower spatial resolution and limited time scale, particularly for small glaciers. Therefore, the observed glacier data are generally incomplete or inconsistent. It is necessary to reconstruct long-term glacier records to understand the changes over the years, especially the mass balance.
Several studies tried to use the SMB model to reconstruct the mass balance variation of the Qiyi Glacier (e.g., Wang et al. [12,13,18]). However, these models are commonly based on the empirical or the simplified degree-day method, which mostly does not take into account refreezing, insolation, the huge shading effect caused by topography, and geometry variation (e.g., surface extent and terminus elevation), and therefore, predict more negative mass change than observed [3,19]. The energy-mass balance model has proven good at finding the physical relationship between the climate and Qiyi glacier variation during warm seasons [20,21], but there is not enough data for modeling beyond a mass balance year up-to-date. In addition, compared to historical glacier mass balance variation, it is of greater interest to glacier variation in the future as mountain glaciers across the globe have demonstrated marked sensitivity to recent climatic changes and are predicted to undergo sustained mass depletion throughout the 21st century [6,8,19,22,23,24]. Notwithstanding significant advances in the energy-mass balance modeling of glacier variations, projecting future glacier changes in data-deficient mountain catchments remains a formidable task, given the unavailability or sparsity of requisite data for the model. Although recent studies have tried using the meteorological data and downscaled GCMs output of CMIP5, e.g., Liang et al. [25] and Duan et al. [26], the results are not conclusive as they do not take into account changes in glacier geometry due to ice flow or uncertainties in the climate forcing.
Models that effectively reproduce observations are required for reliable projections of glacier change in the future. Over the last few decades, the enhanced temperature-index methods, which consider solar radiation and hillside shading effects, have been developed and widely used to estimate glacier melt with sufficient accuracy for most purposes [3,27,28]. Theoretically, the temperature-index model is a simplified energy-mass balance model [27,29]. In some aspects, its performances are similar to those of the energy-mass balance model or even better than the energy-mass balance model [22,30], especially for the glacier projection [31]. Therefore, several more recent studies have applied the temperature-index approach to project glacier variations under different climate scenarios using Phase 5 of the Coupled Model Intercomparison Project (CMIP) database [3,23,32,33]. However, these studies adopt only a single or a minimal number of general circulation model (GCM) outputs. More recent studies have suggested that there are significant differences in climate projections among GCM models in CMIP5 [3,34], which will propagate fractional uncertainties of roughly 15% into the projection of SMB [35] or greater (e.g., 50% of the differences) [19]. Therefore, to accurately project the possible glacier variation, it is critical to utilize as many GCM models as possible to reflect the future reliability variation.
This study has applied a distributed enhanced temperature-index model (DETIM) to the Qiyi Glacier to reconstruct the SMB variation over the last several decades and analyze the response of glacier SMB to climate change. Then, the DETIM was forced with downscaled thirty-one good performance GCMs outputs in CMIP 5 to project the SMB variations under the representative concentration pathway (RCP) 4.5 and RCP 8.5 climate scenarios. The area, volume, and terminus elevation of the Qiyi Glacier are also assessed by combining an updated volume-area (V-A) scaling method with the DETIM to examine possible hypsometry changes in the mountainous areas of northeastern TP. This multi-model analysis of glacier SMB and extent simulations will significantly advance our understanding of the relationship between climate and glacier variations over the Qilian Mountains in the 21st century and promote assessing the impact of glacier shrinkage on the regional water availability in the Hexi Corridor.

2. Study Area

The Qilian Mountains (36–39 °N, 94–104 °E), located at the northeastern margin of the TP (Figure 1a), are in the transition zone between China’s northwest desert region and the alpine TP. The regional climate is controlled by westerly winds and affected by the Asian summer monsoons [4,9]. As the most representative alpine glacier in Qilian Mountains, the Qiyi Glacier (39°14′ N, 97°45′ E; No. 5Y437C18) is one of the cirque-valley glaciers located on the north slope of the western Qilian Mountains [13] and is the first investigated glacier in China. Based on the First Chinese Glacier Inventory, it had an area of about 2.895 km2 and a length of 3.8 km in 1956 [14], with the summit, mediate, and terminus altitudes of approximately 5145, 4720, and 4310 m, respectively [15]. With a gentle surface and without any debris cover or avalanche, this glacier is an ideal place for glacier modeling.
As one of the sub-continental mountain glaciers, the Qiyi Glacier is characterized by little precipitation and low temperature [13]. The annual precipitation is about 374 mm, and most of the precipitation occurs in the summer season, accounting for about 80% of the yearly precipitation [12]. The annual mean air temperature is about 5 °C, and temperatures only exist above zero in the summer. Thus, both ablation and accumulation occur during the summer season. In this study, we defined the winter season from October to May and the summer season from June to September. In 2011, two automatic weather stations (AWS) were built at 4220 m and 4700 m of the Qiyi Glacier, which provide a basic monthly temperature lapse rate and precipitation gradient for the glacier.

3. Data and Methods

3.1. Data Collection and Organization

The datasets employed in this study comprise fundamental geographic data, in situ measurements, national meteorological data, and climate projection datasets.

3.1.1. Qiyi Glacier Observations and Geometry

Annual and monthly mass balance data are collected from the previous works conducted during three intervals: 1974–1977, 1983–1988, and 2000–2003, as well as observations from recent years [5,13,15,18,20]. The spatial mass balance and ELA are provided by Pu et al. [15], Jiang et al. [20], and Wang et al. [13]. The initial glacier outline, area, and terminus in 1957 are obtained from the First Chinese Glacier Inventory (http://westdc.westgis.ac.cn/ (accessed on 4 July 2022)), based on the topographic maps and aerial photographs of glaciers taken in 1956 in the Qilian Mountains [14]. Discontinuous area variation is further collected from the published literature [15,36]. The depth of firn and snow is also gained from the published literature [20,37], and our investigation was conducted from 2014 to 2018.

3.1.2. Climate Data Collection and Reconstruction

The monthly tempera ture lapse rate and precipitation gradient were computed utilizing data collected from the two AWSs at 4220 m and 4700 m, as depicted in Figure 1c. However, due to limited data available from the AWSs, which is only accessible for 2011–2013, and a significant amount of missing data, four meteorological stations (listed in Table 1) surrounding the Qiyi Glacier were also incorporated in the analysis. Among them, the Tuole (TL) station is applied to prolong the climate forcing and drive model to simulate historical glacier mass balance variation since its monthly correlation with the Qiyi Glacier is higher than 0.91 for precipitation and 0.98 for air temperature [13,18]. In the study, we take a simple approach (similar to previous studies, e.g., Wang et al. [13]) to reconstruct the historical climate data. This method has taken into account the topography effect by using the observed temperature lapse rate (−0.60 °C per 100 m) and precipitation gradient (2.7 mm per 100 m) between the TL and Qiyi Glacier terminus [13]. Thus, it could significantly reduce the uncertainties. Other meteorological stations will further apply to analyze the response of glacier SMB to climate change. The Chinese National Meteorological Center (CNMC; http://data.cma.cn/site/index.html (accessed on 4 July 2022); Table 1) provided all meteorological station data.

3.1.3. Future Climate Forcing and Downscaling

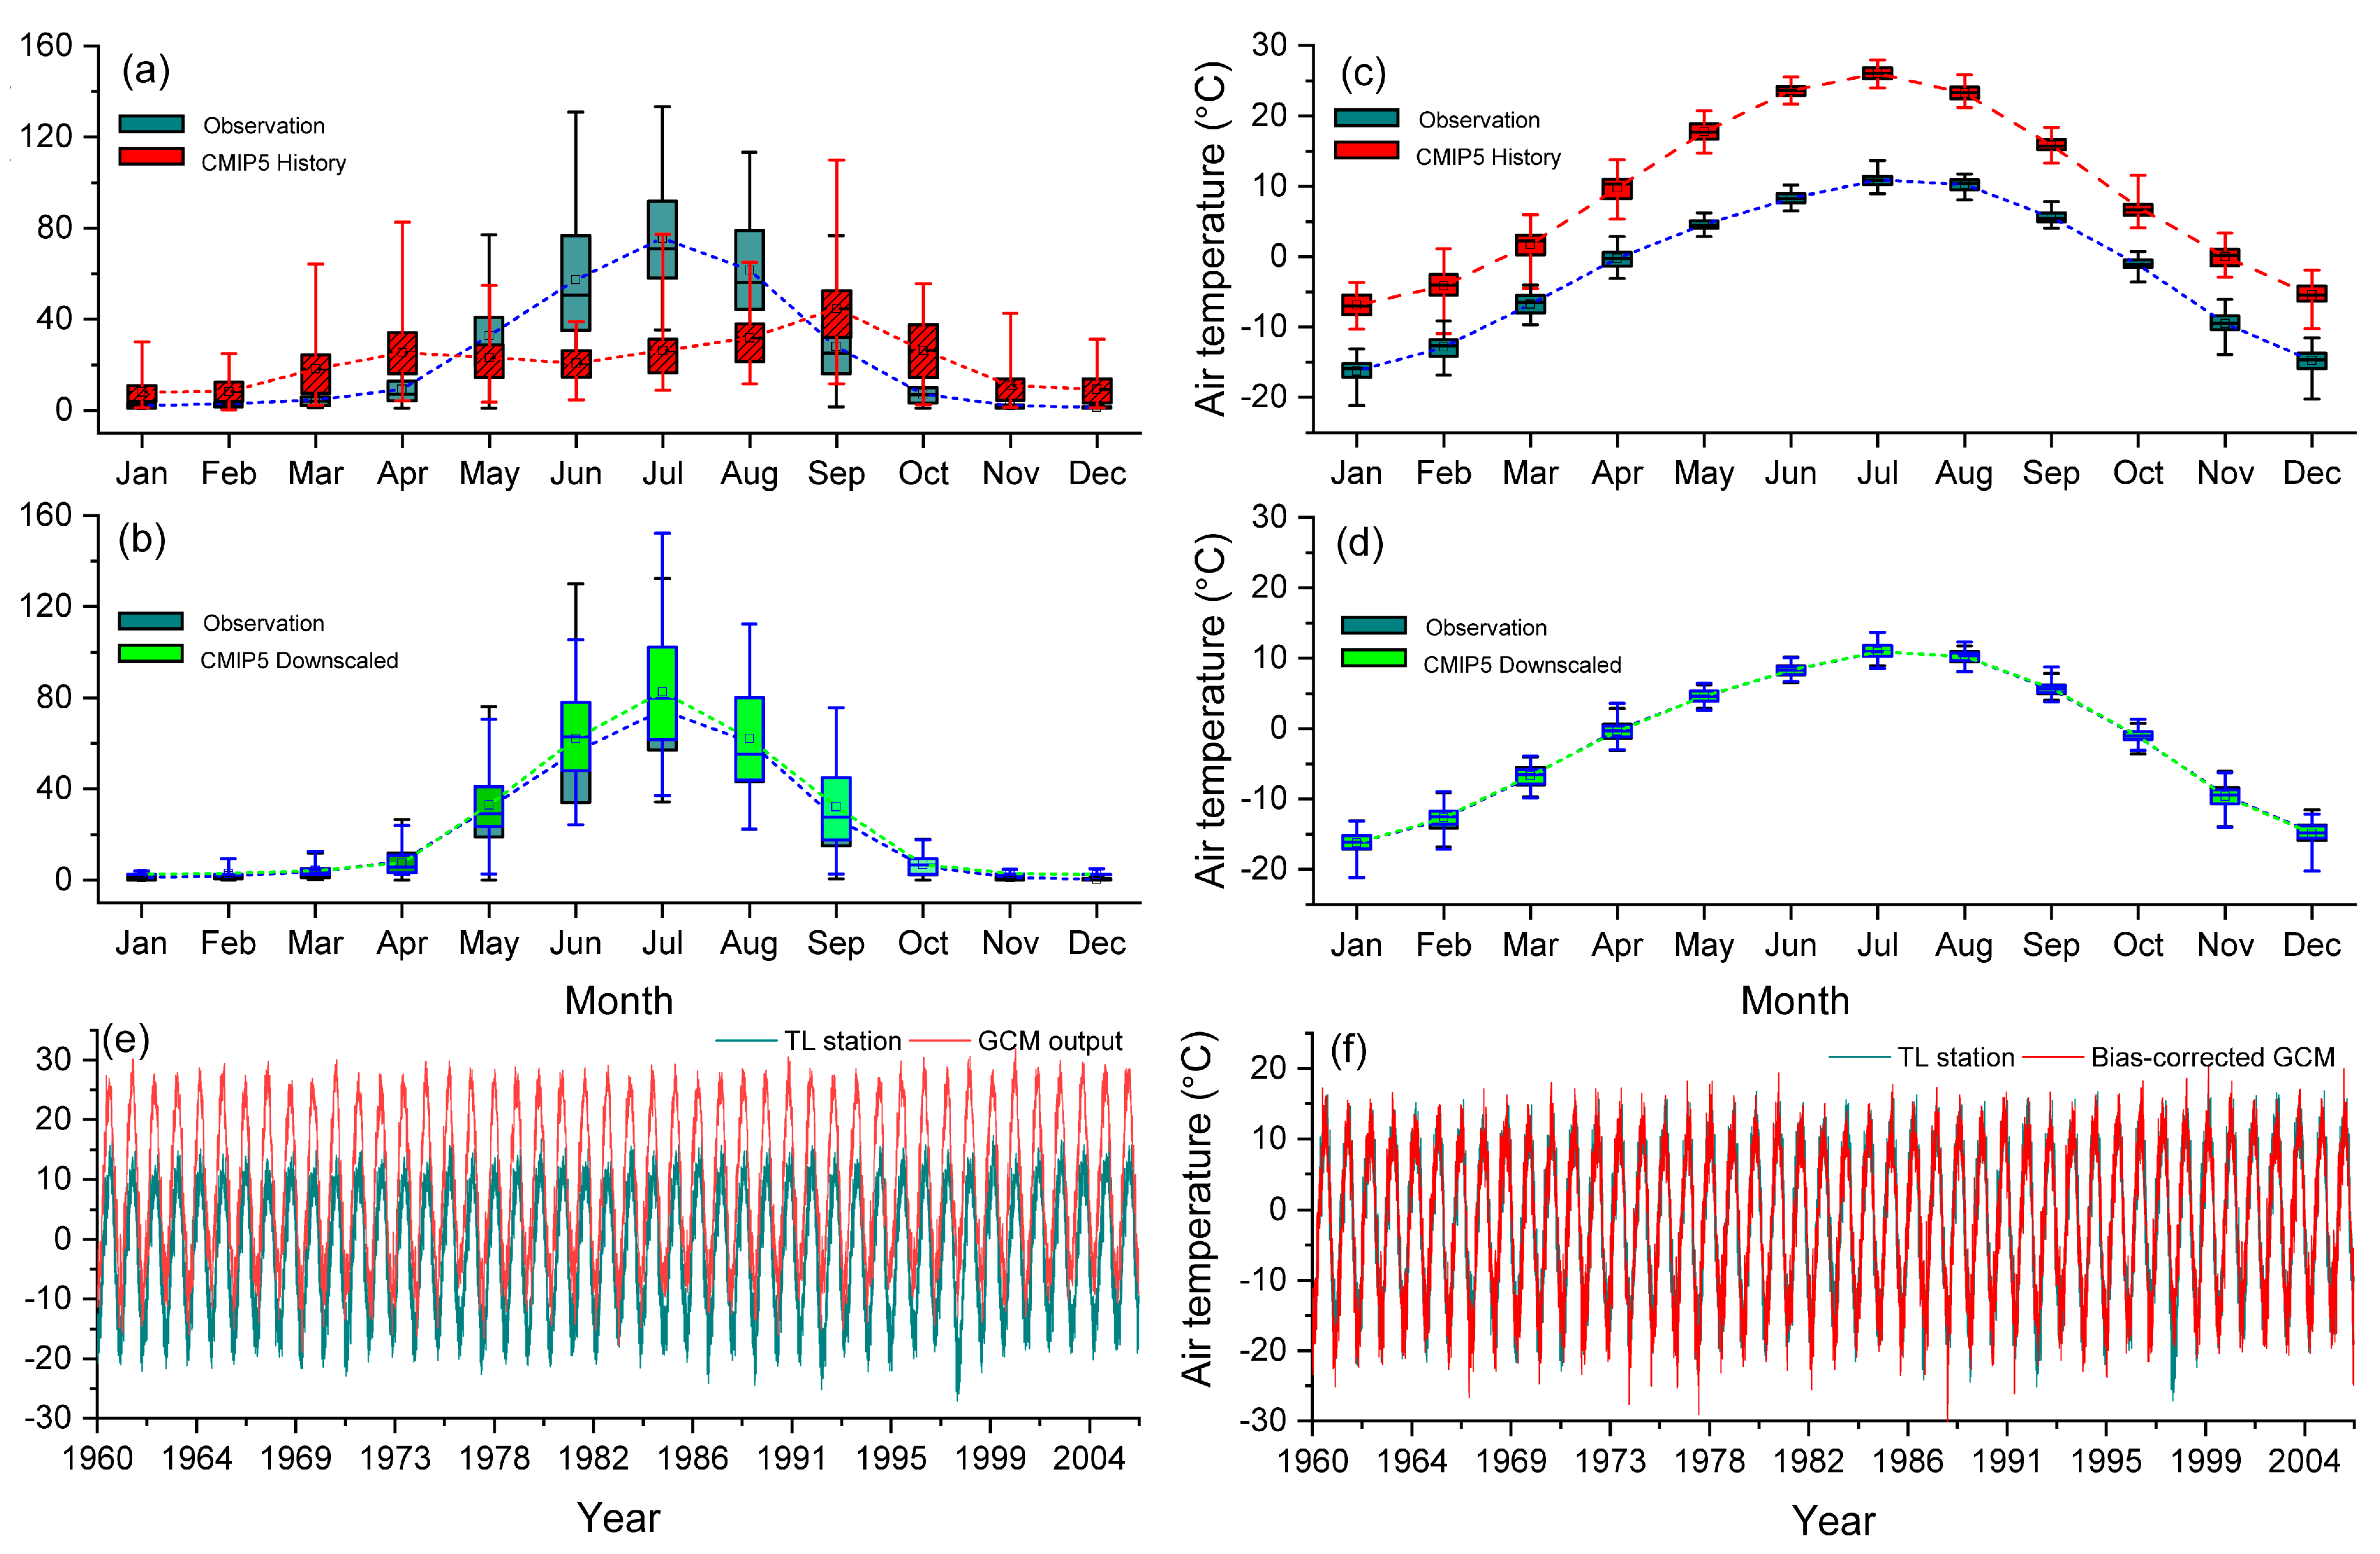
As reported by the latest studies, the state-of-art CMIP6 models do not necessarily perform better than the previous CMIP5 model in China [38]. Therefore, as many as 31 GCMs, with a higher performance from the CMIP 5 ensemble and containing both the RCP 4.5 and RCP 8.5 scenarios, were still used to project future SMB variation. Table 2 overviews the applied models and basic information about the experiments. The datasets were directly downloaded from the Earth System Grid Federation (ESGF) portal (https://esgf-node.llnl.gov/ (accessed on 4 July 2022)). Since the simulations of air temperature and precipitation show significant biases (Figure 2) due to systematic model errors or discretization, there are considerable uncertainties. This study applied a statistical downscaling method to downscale the GCMs data to the Qiyi Glacier.
We applied a three-step procedure to downscale the daily air temperature and precipitation. First, we obtained the four RCP 4.5 and 8.5 raw data values from the model closest to the TL station. Then the mean value from the different ensembles (for each model) was interpolated to the TL station by using the inverse distance weighting (IDW) technique (four grid points used; Equations (1) and (2)).
W j = 1 d j 2 1 d 1 2 + 1 d 2 2 + 1 d 3 2 + 1 d 4 2
v i ( t ) = j = 1 4 W j × v j ( t )
where d1, d2, d3, and d4 are the distances in CMIP5 GCM models between the station (vi) and the four nearest grid cells; vj is the variable value from the grids, and vi(t) is the sum of the weighted average for a given time t. Figure 2a,b compare raw CMIP5 data and TL station observations.
Afterward, we downscaled the RCP 4.5 and RCP 8.5 temperature and precipitation to the TL station by applying a “local-scaling” method [39,40]. The daily precipitation is downscaled as follows,
P d s ( x , t ) = P m o d ( x , t ) ( P o b s ) s e a ( P m o d ) s e a
where Pmod(x,t) refers to the CMIP5 monthly average precipitation (mm) for the grid incorporating a site x and at time t in monthly ‘sea’; (Pobs)sea and (Pmod)sea are the monthly means taken over the downscaled period. Here, we chose 1957–2013 as the baseline for downscaling. The air temperature is downscaled in the same way that precipitation is. However, the adjustment for temperature is additive [39]; therefore, the downscaled daily air temperature is given by,
T d s ( x , t ) = T m o d ( x , t ) + [ ( T o b s ) s e a ( T m o d ) s e a ]
where Tmod(x,t) refers to the CMIP5 monthly average air temperature (°C) for the grid at site x and at time t in season ‘sea’; (Tobs)sea and (Tmod)sea is the monthly mean taken over the reasonable period. We controlled the Pearson correlation coefficient higher than 0.91 for air temperature and 0.85 for precipitation between the TL station and raw data to obtain higher accuracy.
Finally, the temperature lapse rate and precipitation gradient accounting topography are applied to interpolate the downscaled data to the Qiyi Glacier terminus, just as we have performed during the historical period. Figure 3 depicts the climate forcing employed in the study.

3.1.4. Digital Elevation Models

All calculations and analyses detailed below were performed using the Advanced Spaceborne Thermal Emission and Reflection Radiometer Global Digital Elevation Model (ASTER GDEM; 30 m resolution; http://datamirror.csdb.cn/ (accessed on 4 July 2022)). Since ASTER GDEM is one of the most appropriate data sources for cryospheric applications and has proven to have the best performance in TP [41], the glacier topographic attributes (i.e., elevation, slope, curvature, and aspect) were directly derived from this DEM. The glacier surface condition (e.g., firn, snow, and debris depth), climate forcing (air temperature, precipitation, insolation, etc.) interpolation, as well as the clear-sky potential solar radiation and shading effects calculation, is also based on this GDEM grid (30 × 30 m).
Additionally, we implemented the Landsat TM/ETM+ images from the United States Geological Survey (USGS) EarthExplorer (http://glovis.usgs.gov(accessed on 4 July 2022)) to extract glaciers outliers and constrain the modeled glacier area change in recent years. The Spatial Analyst toolbox of ArcGIS 10.8 was utilized to process all collected data, which were subsequently projected onto the Universal Transverse Mercator coordinate system and referenced to the 1984 World Geodetic System.

3.2. Methods

3.2.1. Glacier Mass Balance Model Description

For each grid cell, the daily SMB is calculated by the following equations [42],
B = t [ ( 1 f ) M + P s ] d t
where B is the glacier surface mass balance in meter water equivalent (m w.e.); f refers to freezing meltwater infiltration in snow or the firn layer. Previous studies conducted at the TP have revealed that around 20% of meltwater is maintained at the snow-ice interface because of the refreezing [43]; hence, f was set to 0.2. Ps (m w.e.) denotes the accumulation of solid precipitation on the glacier, and t is the modeled period. M (m w.e.) is the ablation, and a DETIM was applied for the calculation developed by Hock [27]. DETIM has been widely used in reconstructing and projecting the mountain glacier ablation process [6,27,28], particularly in high-altitude areas with limited climate forcing [44]. Moreover, the shading effect is incorporated by implementing an algorithm to calculate the potential solar radiation [27]. Theoretically, a physical-based addition will improve mass-balance model performance [45]. The daily melt for Qiyi Glacier is calculated for either snow- or ice-covered grid cells by:
M = { ( F m + α s n o w ,   i c e   I )     F d e b T , T > 0   ° C 0 , T   0   ° C
where Fm (mm day−1 °C−1) is the melt factor; aice and asnow are the radiation factors (mm day−1W−1m2 °C−1) for ice and snow, respectively, and the asnow must be smaller or equal to the aice since the snow has a higher albedo than exposed ice; Fdeb is a multiplier variable for melt resistance under debris, and its value is 1 for all grid cells that are not debris-covered without any debris. T is the air temperature applied as an indicator for the dominant energetic melt process, including radiation and turbulent heat fluxes. I is the potential direct solar radiation calculated every day by using the method provided by Hock [27] as follows,
I = I 0 ( R m R ) 2 Ψ a ( P P 0 cos Z ) [ cos β cos Z + sin β sin Z cos ( φ s u n φ s l o p e ) ]
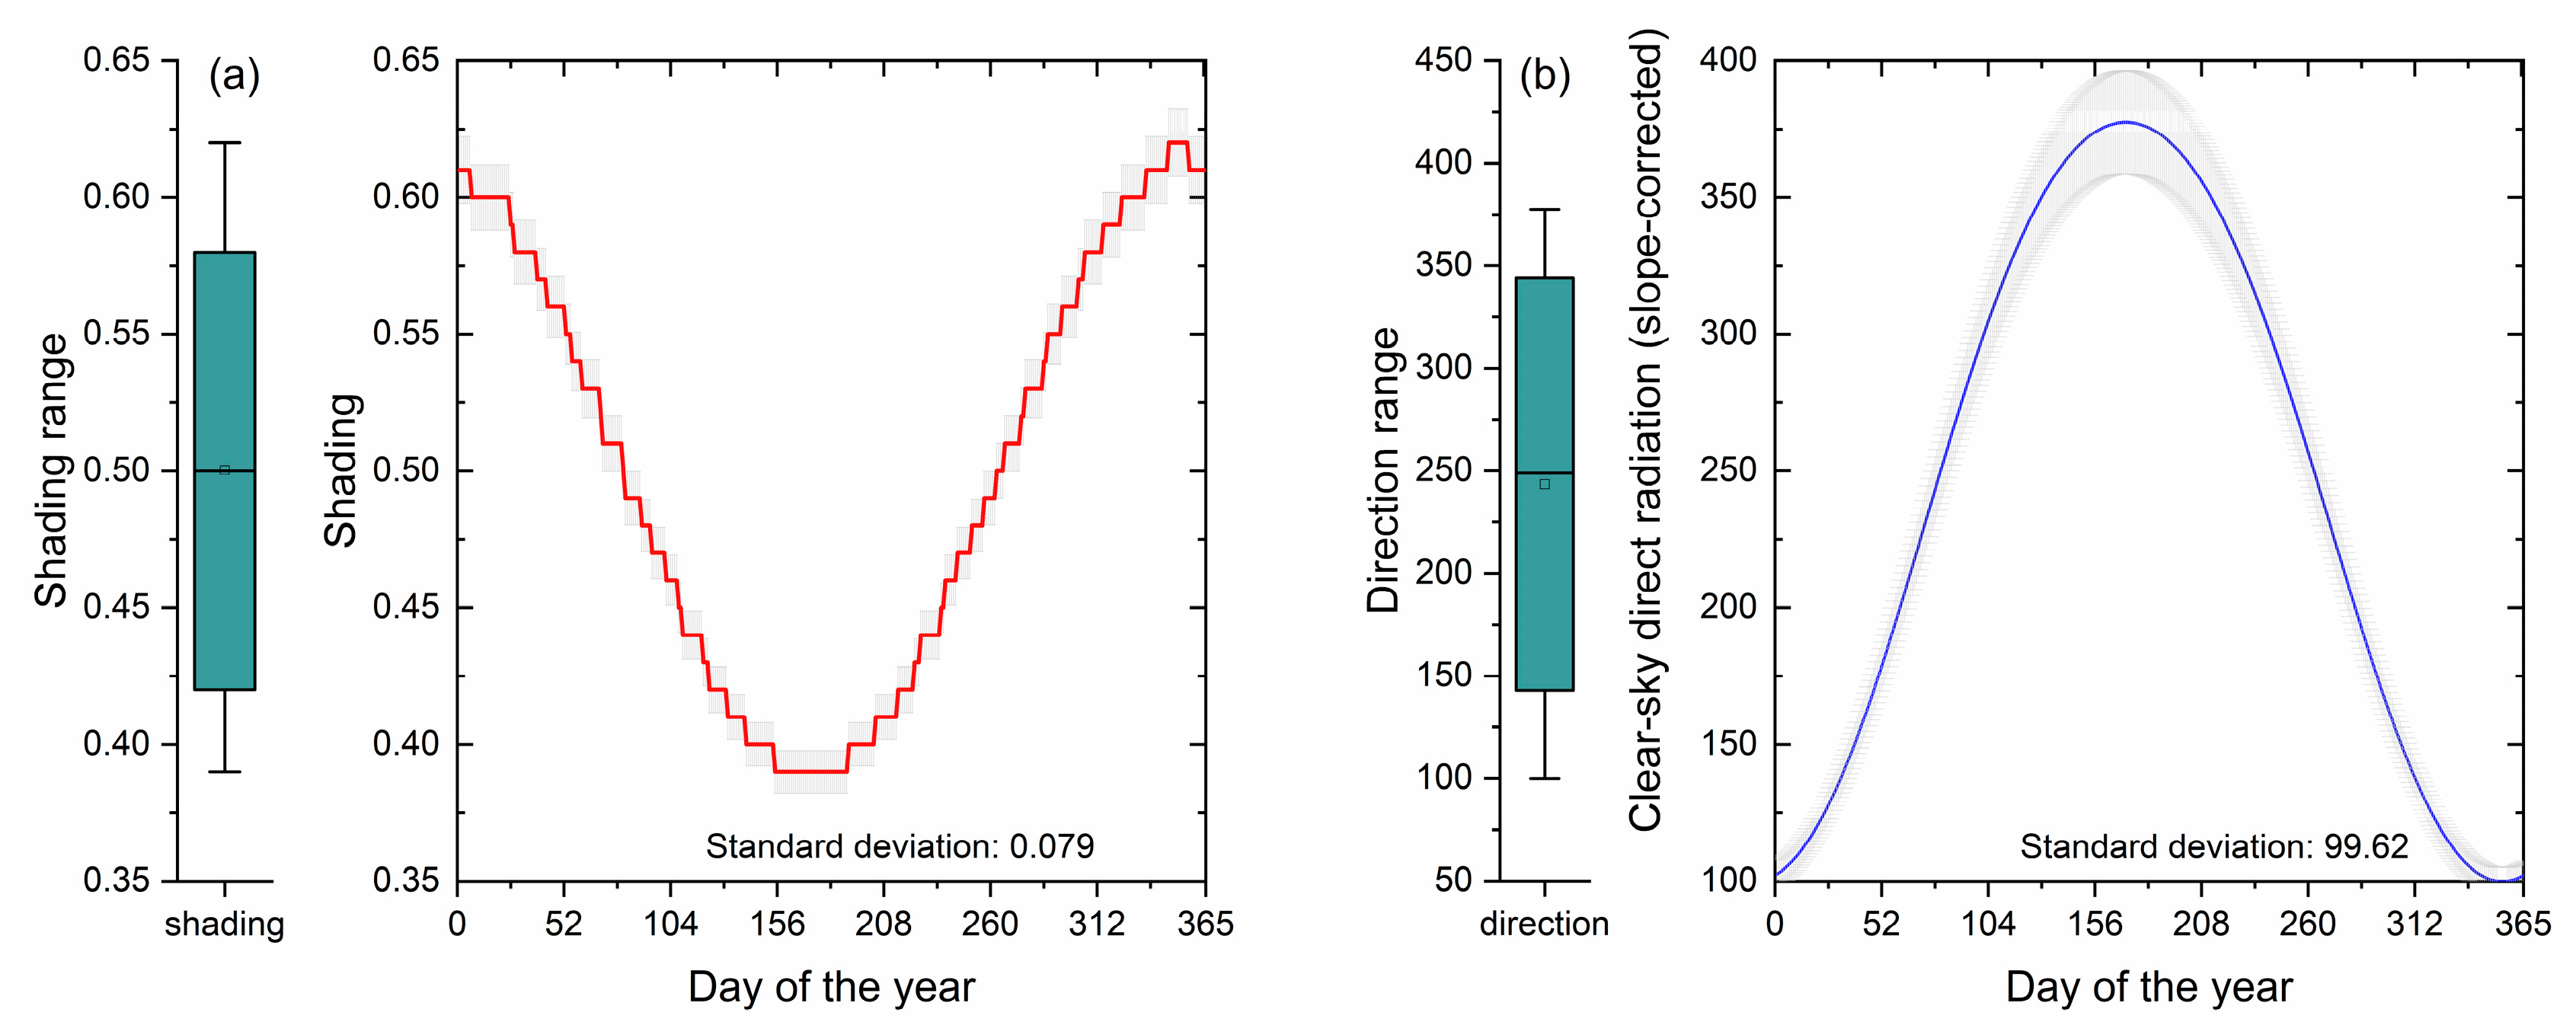
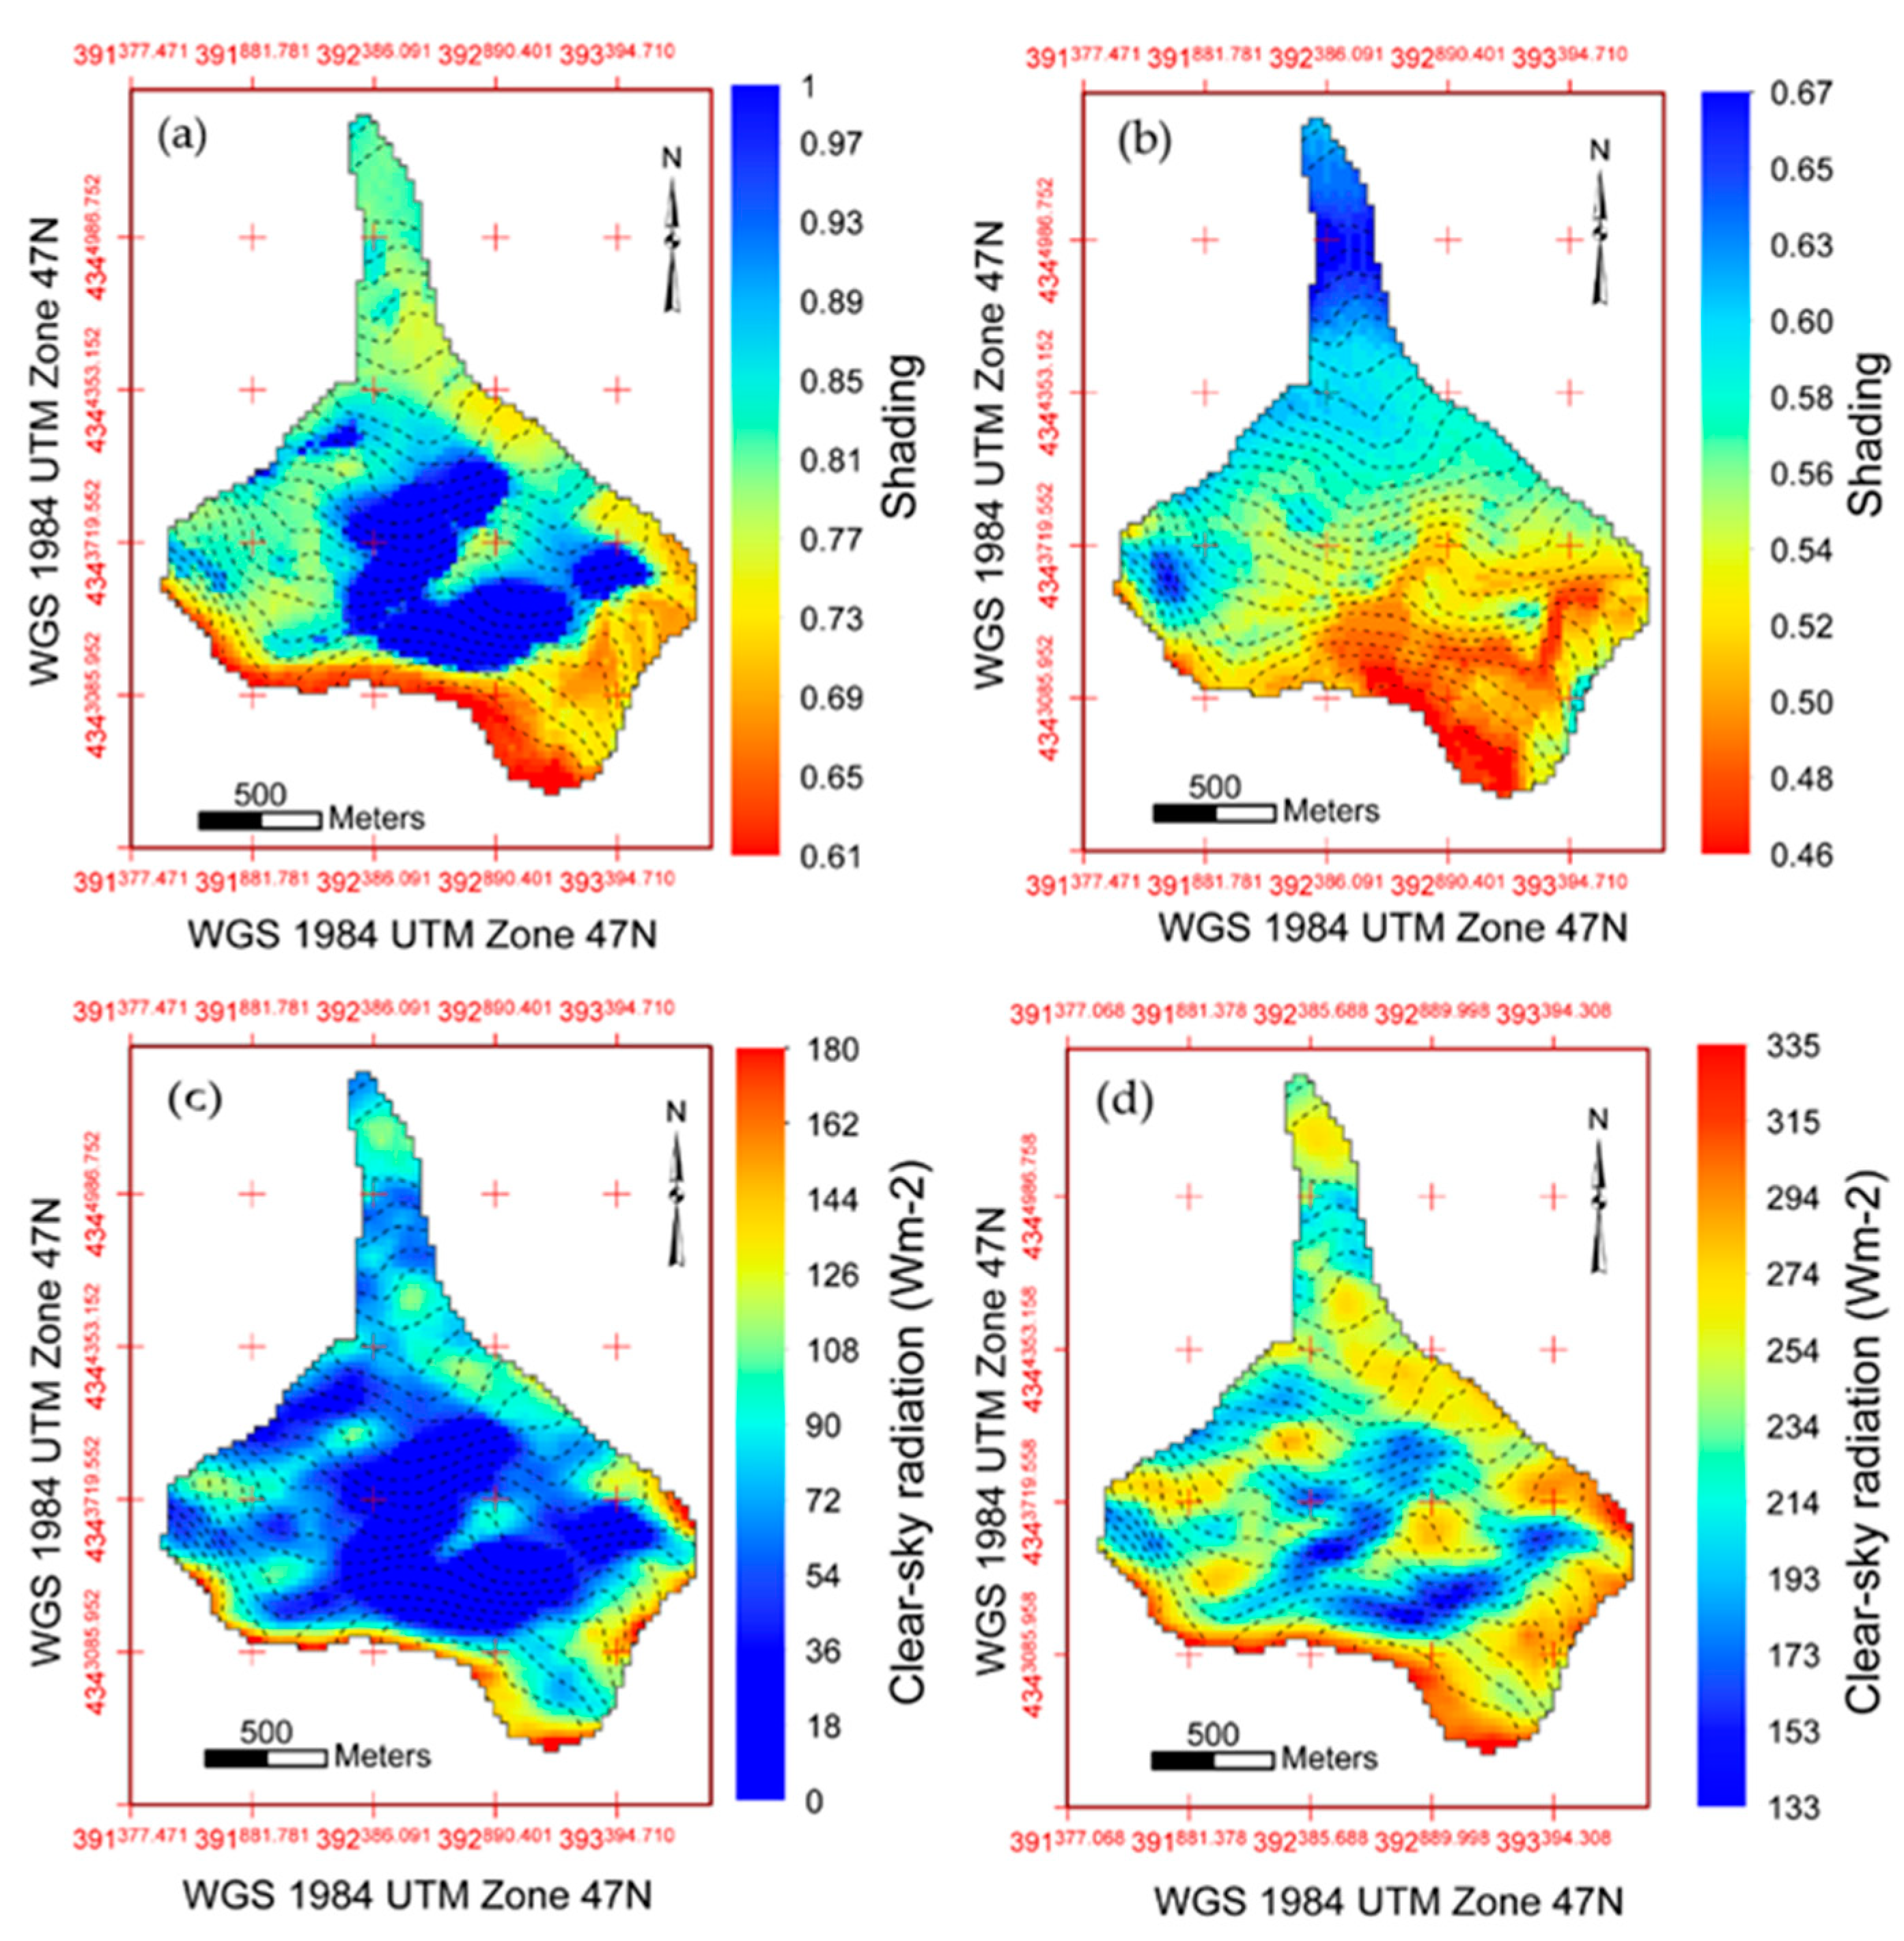
where I0 (I0 = 1362 W m−2) denotes the solar constant; (Rm/R) is the coefficient of determination factor of earth’s eccentricity; R is the instantaneous earth-sun distance; Rm is the mean earth-sun distance; Ψaa = 0.75) is the observed atmospheric clear-sky transmissivity [27]; P0 (P0 = 1013.25 hPa) is the standard atmospheric pressure; P (hPa) represents the atmospheric pressure at different latitude; Z refers to the local zenith angle, and β is the slope angle; φsun means the solar azimuth angle; φslope is the solar azimuth angle. Considering the geometry of the Qiyi Glacier, the daily radiation and shading from the adjacent mountains play an essential role in the glacier melt process (Figure 4 and Figure 5).
Accumulation is determined using a threshold temperature method and is assumed to be equal to solid precipitation [46]:
P s = { P t T < T s T 1 T T 1 T s P t T s T T r 0 T > T r
P r = P t P s
where Ps, Pr, and Pt are snowfall, rainfall, and total precipitation, respectively (m w.e.); and Ts and T1 are the solid and liquid precipitation threshold temperatures, with the value of −1.05 °C and 0.64 °C from the recent study conducted at Qilian Mountain [12,15], respectively.

3.2.2. Modified V-A Scaling Method

When modeling future variations, the area and ice volume reduction owing to glacier retreat should not be neglected [3,47]. The mass balance model computes the SMB and does not consider the dynamic changes in glacier geometry, which affects the size and elevation of the ablation and accumulation areas and accordingly causes the SMB to be more negative [19]. Theoretically, the most physically rigorous numerical ice-flow models could better simulate the variation of glacier geometry. However, precise information on the glacier surface and bed geometry is required. The Qiyi Glacier is unsuitable for this since data on its thickness is lacking. Instead, the simple V-A scaling method has been widely applied and recognized as an essential tool to address the glacier geometry change (i.e., area, volume, length, and terminus position) based on the modeled SMB [3,4,48,49]. Therefore, in this study, an enhanced V-A scaling law considering time lag [3] was coupled to a mass balance model to estimate the evolution of glacier area, volume, and terminus elevation.
(1)
Area and Volume calculation
The volume (V) and area (A) of the Qiyi Glacier at the start year are calculated as follows,
V 0 = c a ( A 0 ) ϒ
where A0 (A0 = 2.89 km2) is the glacier area in 1957, based on the glacier inventory derived from 1956 data [14]. Table 3 summarizes the general parameters used in recent studies to calculate glacier volume. Here, we applied the coefficients provided by Liu et al. [4], produced by the Qilian and Tienshan Mountain observation, and successfully applied them in TP [11,50]. The volume change (dV) and area change (dA) at each mass balance year (from 1 October to 30 September) are further computed by:
d V ( n + 1 ) = 1 / ρ A ( n ) B ( n )
d A ( n + 1 ) = 1 τ A ( ( V ( n + 1 ) c a ) 1 / γ A ( n ) )
where A(n) (km2) and B(n) (m w.e.) denote the glacier area and SMB in the nth year, respectively, and ρ (ρ = 900 kg m−3) refers to ice density. τA is a relaxation time-series scale that can be determined as follows:
τ A ( n ) = τ L ( n ) A ( n ) L ( n ) 2
where L(n) and τL represent glacier length (km) and the response time scale of glacier length in the nth year, the glacier length in the initial year is determined using the approach proposed by Marzeion et al. [3]:
L 0 = c L ( A 0 ) q
where q and cL represent scaling coefficients, the constant q = 1.43 and cL = 0.58 were obtained from Liu et al. (2003) [4]. The length changes dL during every mass balance year are calculated as:
d L ( n + 1 ) = 1 τ L ( ( V ( n + 1 ) c L ) 1 / q - L ( n ) )
where L(t) is the length of the glacier at the initial mass balance year, and τL is a relaxation time scale and can be determined by:
τ L ( n ) = V ( n ) A ( n ) P r s ( n )
(2)
Terminus elevation change
The retreat and advance of a glacier occur initially at the lowest elevation (terminus), as evidenced by studies of glacier spatial changes from 1999 to 2004 in the Western Himalayas [51]. Thus, in this study, we adopted an approach similar to that used by Marzeion et al. [3] and Zhao et al. [52] to predict the glacier terminus evolution, assuming a linear increase of the terminus elevation Zmin (m a.s.l.) with reducing glacier length L. When the glacier retreats, we directly remove grid cells nearby the glacier terminal from the glacier surface cells, thus obtaining a new glacier terminus elevation and updating the new glacier boundary for the following year. In contrast, we added grid cells to the glacier surface grid from the original DEM when the glacier advances. The terminus elevation in the (n + 1)st year, zmin(n + 1), was determined by,
z min ( n + 1 ) = z max ( n + 1 ) + L ( n + 1 ) L ( n ) ( z min ( n ) z max ( n ) )
where zmax(n + 1) signifies the glacier’s highest elevation in the (n + 1)st year, which is determined by identifying the ASTER GDEM highest elevation inside the glacier border and is assumed constant throughout the model process. L(n + 1) is the (n + 1)st-year glacier length, and L(n) is the glacier’s length in the n year.

4. Results

4.1. Glacier SMB Model Calibrations and Validation

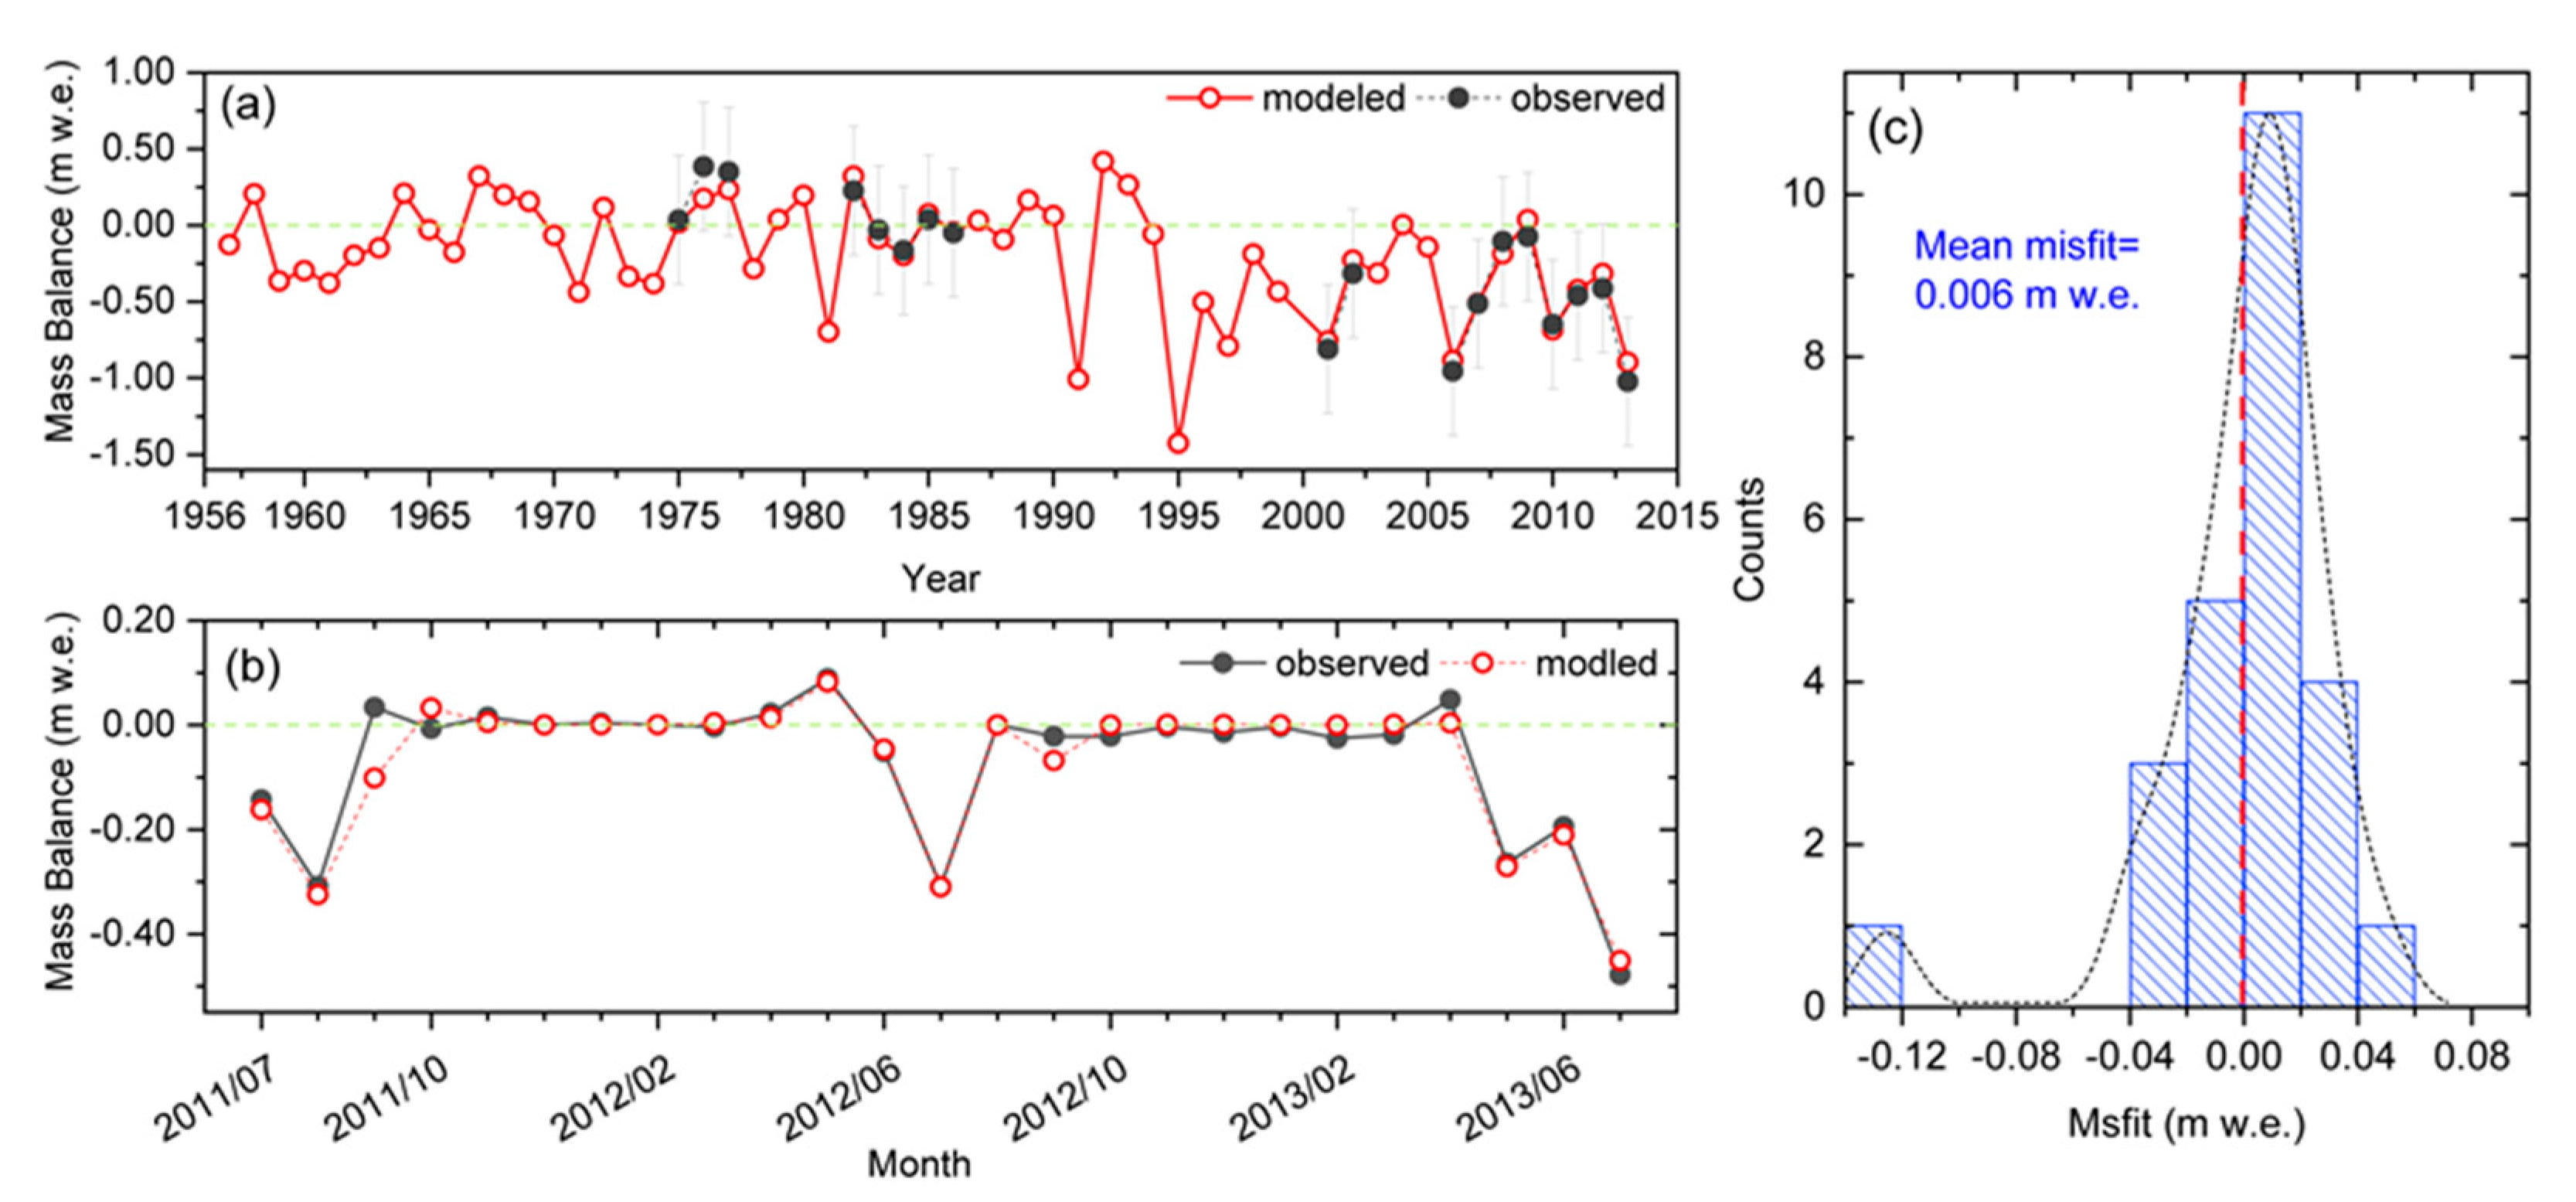
The modeled glacier-wide SMB is evaluated by the independent, observed monthly mass balance and annual mass balance data (Figure 6). To ensure that the validation is independent of the calibration, validation is only performed with the annual mass balances from 1974–1976, 1984–1988, 2003–2004, and 2007–2010, which do not temporally overlap with the monthly mass balances used for calibration from 2011 to 2013. In addition, to better calibrate the model, daily air temperature and precipitation at every grid cell are further determined by using different monthly lapse rates (λT) and gradient (λP) based on the two AWSs on the glacier surface (listed in Table 4). Owing to the empirical character of the DETIM, the site-specific parameters fm, αice, and αsnow in Equation (6) are optimized using a Monte Carlo algorithm. The final parameters used in this study are presented in Table 5.
As shown in Figure 6b, the modeled monthly mass balance agrees well with the observations during 2011–2013 (R2 = 0.96, p < 0.001; Misfit = 0.0006 m w.e.). The modeled annual mass balance variation also correlates with the observed values (Figure 6a). The simulated mean yearly and monthly mass balance was −0.242 m w.e. Furthermore, −0.072 m w.e., which was close to the observed values of −0.252 m w.e. Furthermore, −0.066 m w.e., respectively. To assess the SMB model’s performance further, here we applied the coefficient of determination (R), Nash-Sutcliffe efficiency coefficient (NSE), and Root Mean Square Error (RMSE). The methods are defined as follows,
R = [ i = 1 n ( o i o ¯ ) ( s i s ¯ ) i = 1 n ( o i o ¯ ) 2 i = 1 n ( s i s ¯ ) 2 ] 2
N S E = 1 i = 1 n ( s i - o i ) 2 i = 1 n ( o i - o ¯ ) 2
where si and oi denote the ith simulation and observation, respectively; s ¯ and ō are the simulations, and observation means values, respectively; n is the time series length.
The results show that the RMSE between the annual mass balance is 0.087, whereas the NSE and R are 0.96 and 0.005, respectively. Altogether, the model compares well with observations and offers possibilities for studying glacier SMB on Qiyi Glacier both historically and into the future based on the climate projection.

4.2. The Temporal Variation of Reconstructed Mass Balance during 1957–2013

As shown in Figure 7, the annual glacier-wide SMB of Qiyi Glacier exhibited a relatively positive trend from 1957–1991 and a significant negative trend from 1992 to 2013 in the reconstructed mass balance series. Summer mass balance varies roughly twice as much as winter mass balance across the reconstrued period as compared to the two seasons in the mass balance year, indicating that the ablation processes vary more strongly during mass balance years than winter mass accumulation. During the positive period, the glacier-wide mass balance fluctuated between ± 0.50 m w.e. with a linear rate of 0.004 m w.e. a−1 (p < 0.01). Moreover, three periods are distinguished in the positive stages of the reconstructed SMB series.
Period I (1957–1969), the mass balance dramatically increased with a linear rate of 0.032 m w.e. a−1 (p < 0.05), indicating the response of Qiyi Glacier to the global air temperature decreasing and precipitation increasing began in the late 1950s. Period II (1970–1979), although the mass balance was still positive with a rate of 0.027 m w.e.a−1 (p < 0.01), the increase rate began to slow down at this stage. However, the maximum mass gained during the mid-1970s was captured by both reconstructed and observed series [13,15], dominated by the relatively cold climate during these years. In Period III (1980–1991), the mass balance remained slightly positive with a rate of 0.008 m w.e. a−1 (p < 0.05), but the increasing rate is substantially lower than in Periods I and II, revealing the glacier has approximately entered a state of zero equilibrium. From Periods I to III, the increasing trend of SMB gradually slows down. Meanwhile, the glacier SMB experienced a strongly positive, relatively higher positive, and slightly positive stage. Furthermore, finally, the mass balance trend abruptly shifted from positive to strongly negative since 1992.
During the SMB negative trend stage, Period IV (1992–2013) is characterized by a strongly negative SMB with a linear rate of −0.0129 m w.e. a−1 (p < 0.001), which is near to the mean rate of global SMB −0.013 m w.e. a−1 during last several decades [34,53]. Seasonal mass balance variations indicate that this result is due to the higher summer ablation, which most likely could not be compensated by the summer and winter mass accumulation. Most noticeably, the summer SMB during this period is three times higher than that of 1957–1991. On the contrary, the winter mass balance was nearly similar to the positive periods from 1957 to 1991. Over the whole modeled period, 1994/1995 was the year with the most negative SMB of the Qiyi Glacier, which was approximately −1.426 m w.e. After that year, even though the trend of SMB seems to return to increase again, the values remained negative and never shifted back to the positive again. Since 2010, the decreasing trend has gradually accelerated with a high decreasing rate of −0.15 m w.e. a−1 (p < 0.01) and is expected to keep losing at a much higher rate in future scenarios.

4.3. The Mass Balance Distribution and ELA Variation during 1957–2013

4.3.1. Mass Balance Distribution of Qiyi Glacier

The mass balance at each 30 m grid cell is determined using the reconstructed air temperature and precipitation from 1957 to 2013 and the SMB model. This process makes it possible to determine the ELA, the accumulation area ratio (AAR), and the mass balance gradient from the gridded data sets.
As Figure 8 shows, there are noticeable changes in the fluctuation of net mass balance between the ablation and accumulation area. The most negative mass balance primarily happens in the terminus of Qiyi Glacier. The SMB model generally reproduces the higher mass balance gradients in the ablation area and relatively lower mass gradients in the accumulation area (Figure 9a). Furthermore, the reduced spread of SMB in modeled results reveals that the effects of snowdrift and avalanches do not exist in the Qiyi Glacier, which agrees well with the previous in situ measurements [15]. From Period I to IV, the glacier SMB gradient is dramatically increased in the ablation area, particularly during Period IV. By contrast, the gradient of SMB in the accumulation area seems likely to remain constant throughout the overall modeled period. It further confirms that the melt mainly occurs at the terminus of the Qiyi Glacier, similar to findings in several earlier studies for other regions in the TP (e.g., Berthier et al., [51]; Marzeion et al. [3]; Zhao et al. [52]).
Glacier-wide SMB is an essential and direct indicator of total mass change, making it helpful for hydrology and sea-level change applications [7,23]. As Figure 8 shows, from 1957 to 2013, the SMB has switched from 0.23 m w.e. (Period I) to −0.26 m w.e. (Period IV), while the AAR has decreased from 62.44% in Period I to 45.74% in Period IV. From this aspect, the glacier has shifted from a relatively stable state to a dramatic recession phase. Since then, glacier retreat has become the dominant trend on the Qiyi Glacier.

4.3.2. Variations of ELA on Qiyi Glacier

ELA represents the elevational zone on the glacier, where annual ablation equals annual accumulation when the glacier is in a steady state. Theoretically, the ELA is a quantity controlled by the climate and glacier aspect. It is undisturbed by the glacier dynamics, extent, or even hypsometry, instead revealing an essentially unfiltered climate signal [28,54]. The ELA is a direct and extremely sensitive indicator of the glacier response to climate change since its position is strictly determined by air temperature, solar radiation, and solid precipitation distribution [13]. In the Qilian Mountain ranges, glaciers are almost “summer accumulation” type, and the melt primarily occurs in the lowermost part of the ablation zone [47,55], e.g., the terminus. As suggested by the previous studies, the ablation process mainly depends on the summer temperature [12,13]. Therefore there is reason to believe that ELA evolution is also principally affected by the warm-season air temperature increasing.
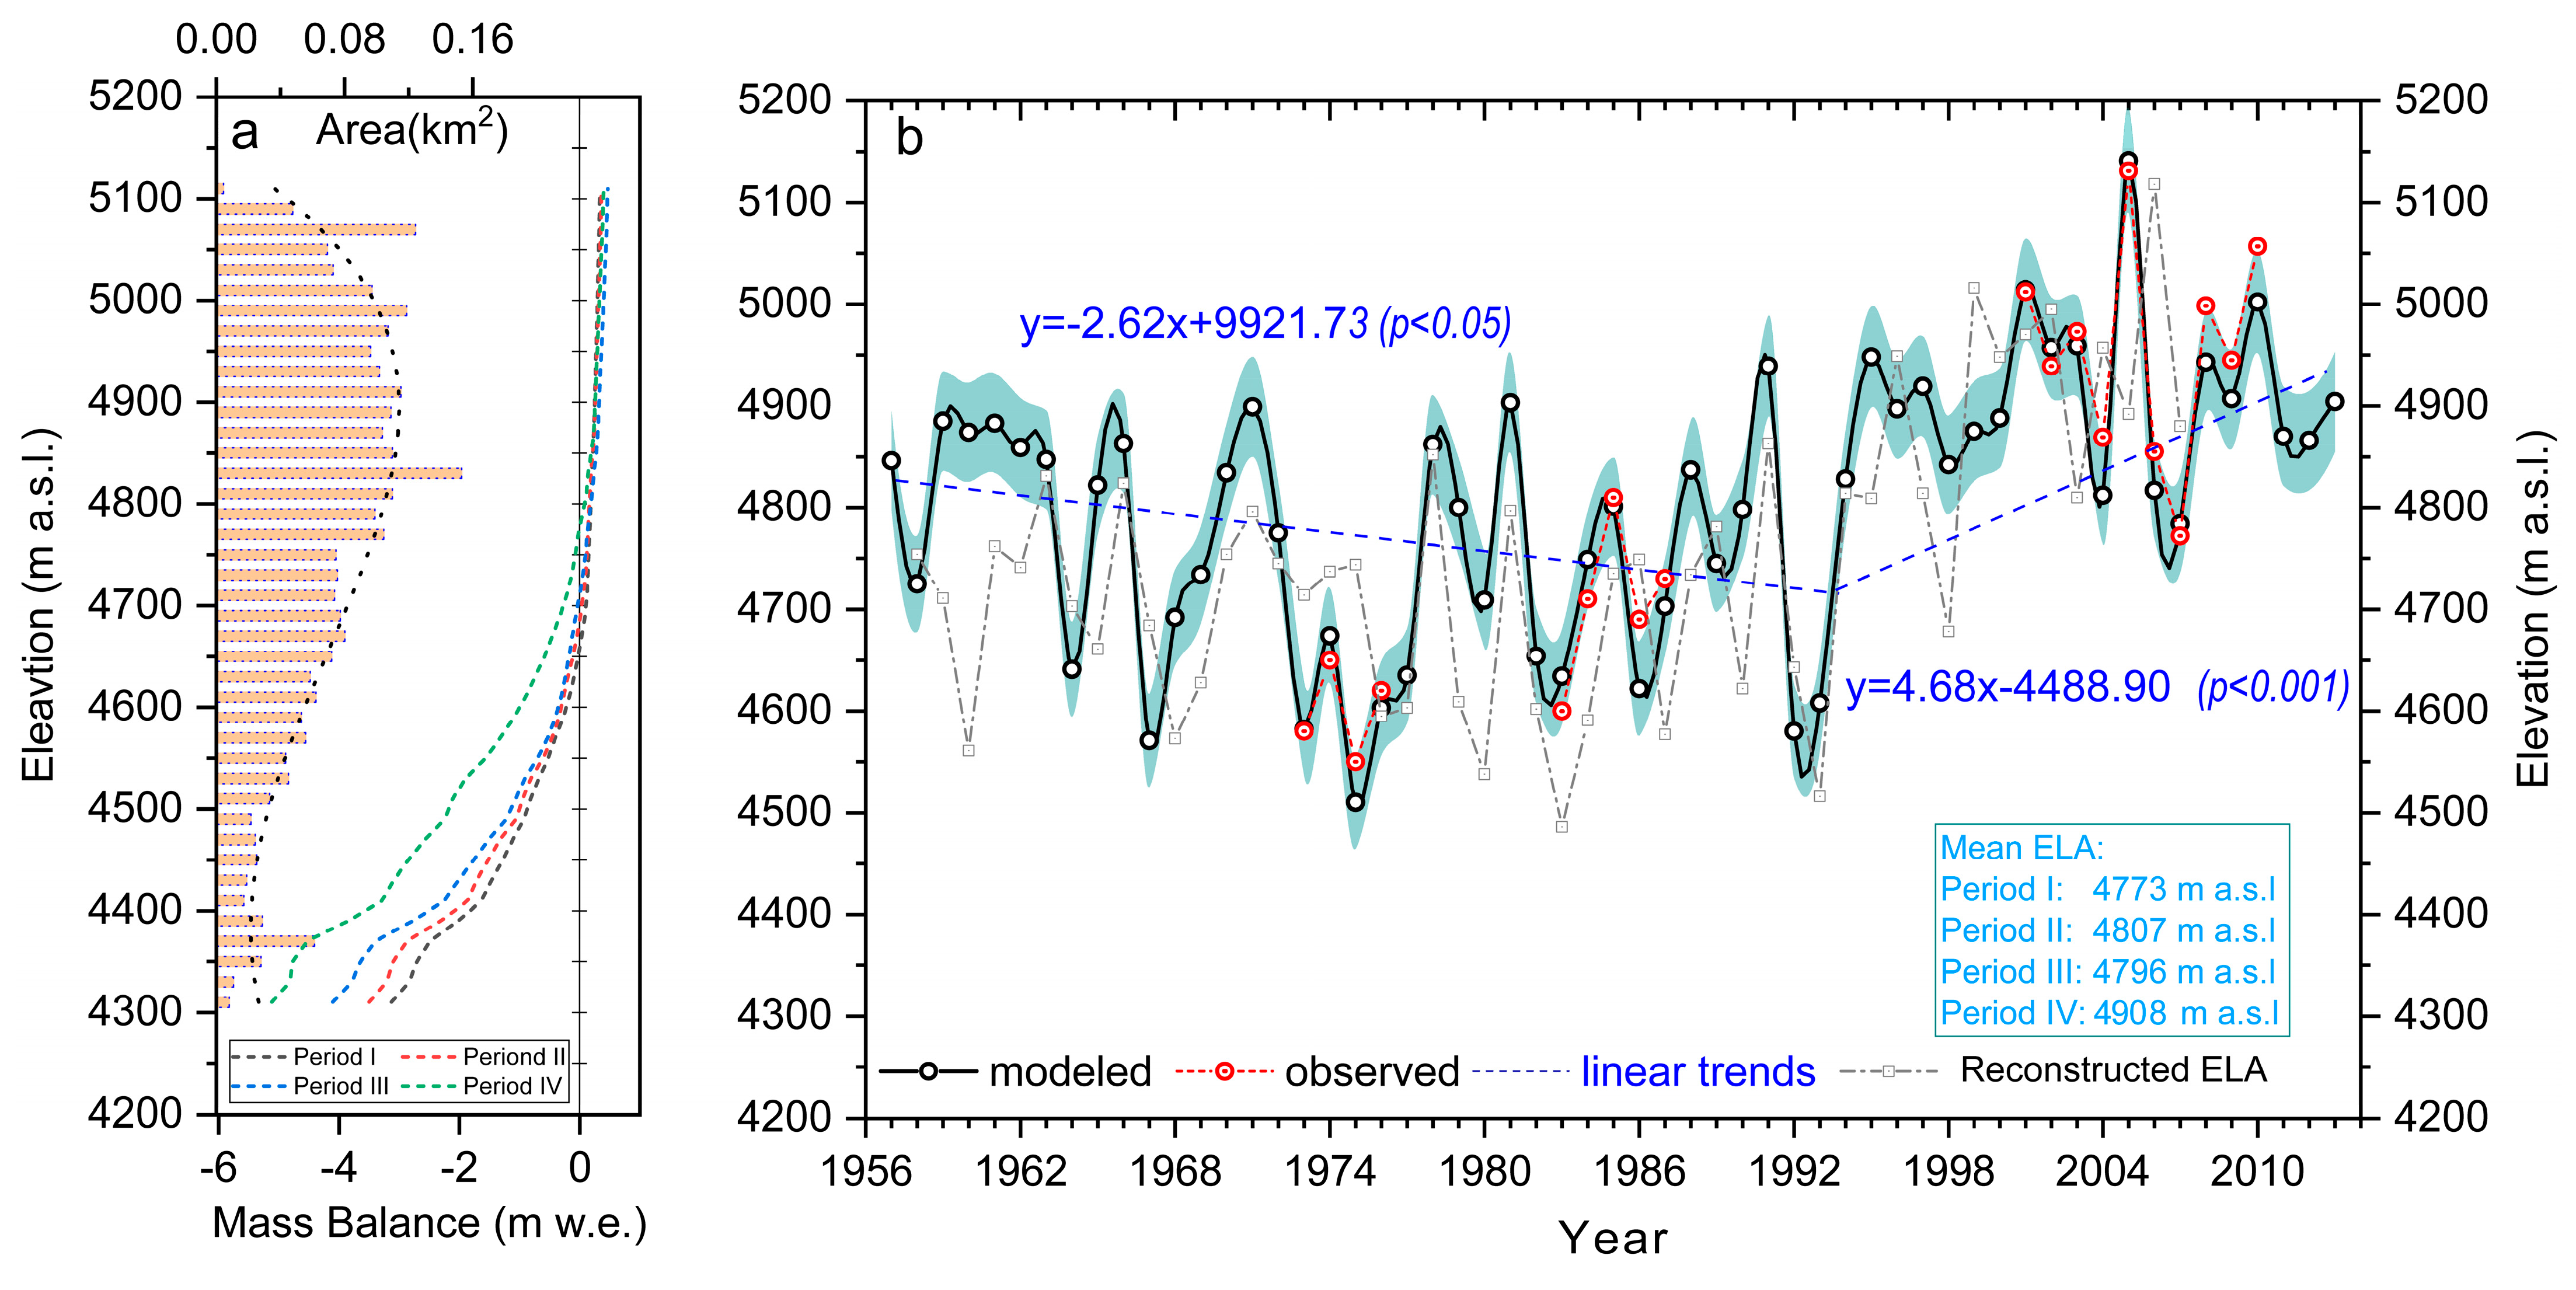
As Figure 9 shows, the modeled ELA agrees well with those derived from glacier mass balance measurements from three discontinuous periods (1972–1975, 1983–1986, and 2001–2011) and the earlier rebuilt results [55]. Both reconstructed and observed results implied that the annual variability of ELA is considerable in Qiyi Glacier. During the 1970s and 1980s, ELA’s value was just 4600 m and 4670 m, respectively [13]. By 2002/2003, it had risen to about 4970 m with the increased air temperature; by 2005, the ELA had dramatically retreated to 5131 m [15], which is quite close to its summit altitude of 5145 m. Throughout the study period, the lowest and highest ELA values differ by ca. 700 m (Figure 9b). The mean value of ELA in each positive stage (Periods I to III) was 4773, 4807, and 4798 m a.s.l, respectively. While the average ELA has increased to 4908 m in the negative mass balance (Period IV) and will continue to rise in the coming future under whatever climate scenario it is.
In general, the modeled time series of the SMB identified that the ELA in the Qiyi Glacier maintained a significant downward trend with a linear rate of −2.62 m a−1 (p < 0.01) from the 1950s to 1991 (Period I to III). During this period, the multi-year average ELA was ~4750 m. Whereas the trend shifted, there was an apparent rising trend with a linear rate of 4.68 m a−1 (p < 0.001) since 1992 (Period IV). At this stage, the multi-year average ELA was ~4908 m. Compared to the mean ELA in the former period, the ELA has raised ~158 m. In addition, although our modeled ELA seems quite different from that estimated by the statistical relationship between the observed ELA and the climate data from a meteorological station about 50 km north of the glacier (Figure 9b; Wang et al. [13]), both studies suggested the ELA of the Qiyi Glacier had a rising trend since 1957, and the glacier ELA had increased by ~230 m in total.

5. Discussions

5.1. Qiyi Glacier SMB Response to Climate Change

The SMB of mountain glaciers is affected by a wide range of associated topographic conditions and climatic factors, such as height, aspect, and slope [6,55]. Climate forcing (e.g., temperature and precipitation) may be the most critical factor among these contributing factors to glacier mass balance change. Mountain glaciers are essentially recognized as the product of climate change under certain conditions [1,43,55,56]. The fluctuation of air temperature and precipitation mainly controls the ablation and accumulation of the glacier and, therefore, causes height changes to the glacier surface [34,47]. Generally, warmer air temperatures cause the glacier to melt, whereas increased precipitation leads to mass accumulation. These factors also affect the evolution of glacier geometry.
As shown in Figure 7, the SMB of Qiyi Glacier fluctuated noticeably from 1957 to 2013. A strong relationship exists between the summer mass balance and the annual mass balance (R = 0.98, p < 0.01) on the glacier. Consequently, despite significant year-to-year variability in winter mass balance, summer mass balance strongly regulates long-term SMB variation. As a typical “summer accumulation type” glacier, the combined effect of air temperature and precipitation in the warm seasons determined the annual SMB change of the Qiyi Glacier [37,55]. A similar result was also yielded by Liu et al. [4], who suggested that climatic conditions in the summer season significantly influence the SMB of glaciers in the Qilian Mountains. In essence, the large-scale atmosphere circulation mode might influence the local climate change pattern and further control the regional SMB. Several studies have pointed out that the Asian summer monsoon strongly influenced the Qiyi Glacier [9,11]. It is determined that air temperatures are above zero, and almost 80% of yearly precipitation is concentrated from June to September in the region [13,15]. These climate conditions and circulation patterns might cause the ablation and accumulation to both mainly happen in the summer seasons, and the summer SMB accounts for most of the annual SMB.
To better understand the pattern of glacier SMB response to climate change, the correlations between the temperature, precipitation, and glacier SMB have been analyzed based on the statistical analysis of meteorological data. Figure 3 shows that the annual rainfall increased slightly with a linear rate of 0.68% a−1(p < 0.01), while the air temperature dramatically rose at 0.035 °C a−1 (p < 0.001) from 1957 to 2013. This variation tendency is consistent with previous studies of the Qilian Mountains from the 1950s to 2010 [9,11] but significantly higher than the global level of 0.12 °C a−1 [34]. Figure 10 further exhibits that air temperature negatively correlates with the annual SMB variation (R = −0.21), especially in the summer seasons (R = −0.78), revealing that the summer temperature strongly influences the glacier mass variation. Conversely, precipitation positively correlates with the SMB (R = 0.14), especially in winter (R = 0.20). This relationship implied that even in the monsoon domain Qilian Mountain ranges, the precipitation in winter is by no means negligible and can influence the mass balance significantly. Nevertheless, for the long-term SMB variation, the winter precipitation seems to play a limited role in its variation, given that both the ablation and accumulation occur in the summer season for Qiyi Glacier [13].
Although some studies have found that the precipitation in September influences the summer mass balance in the accumulation zone of Qiyi Glacier [21], the long-term trend suggests that summer precipitation has had little impact on the summer SMB (R = 0.01) from 1957 through 2013. The accumulation gained from the summer precipitation may not be sufficient to compensate for the glacier melt caused by the increasing summer air temperatures. In addition, though the temperature and precipitation increased from 1957 to 2013 (Figure 3), the increase rates between them are substantially different, especially during the summer. Air temperature increased with a linear rate of 0.035 °C a−1 yearly (p < 0.001) and 0.04 °C a−1 (p < 0.001) in summer seasons, whereas the precipitation increased with a rate of 2.45 mm a−1 (~0.68% a−1, p < 0.01) and 2.40 mm a−1 (~0.65% a−1, p < 0.01) in summer seasons. According to Oerlemans [47], the impacts of a 1 K warming on the glacier SMB are equal to a 25% increase in precipitation. Recent studies conducted at the Beida River Basin further suggested that 1 °C air temperature rise induced mass loss would be compensated by a 210 mm [12] ~272 mm [15] or 25% increase in precipitation [20]. Obviously, the precipitation increasing rate is lower than the rate of air temperature rising during the summer seasons of the Qiyi Glacier. This competitive relationship between temperature and precipitation is the primary reason the SMB has a slightly negative trend from 1957 to 2013 (−0.008 m w.e. a−1, p < 0.001; Figure 7). Subsequently, the increased air temperature, particularly the summer air temperature rise, has more robust control over the SMB of the Qiyi Glacier.
A similar conclusion that summer air temperatures dominate the shrinkage of glaciers has been reported from the studies of other glaciers in Qilian Mountain by recent remote sensing [9,10,11], glacier stimulation [12], and other studies [13,56]. However, as the correlation coefficient between the summer air temperature and mass balance is only −0.78, other factors are also playing important roles in glaciers’ mass variation, such as radiation, substantial sublimation [21], the local topography of glaciers [55,57], as well as their combined effect of radiation [20] and topography [12] in Qiyi Glacier. Unfortunately, many of these factors lack observational data, preventing a quantitative examination of their relative influence on SMB variations.
In addition, the variation of SMB in Qiyi Glacier shows an evident shift since 1992. From 1957 to 1991 (Periods I to III). the glacier kept a positive trend of SMB (trending from positive to a slightly positive, then to equilibrium state; Figure 7 and Figure 8), and subsequently, it shifted to negative and gradually accelerated when entering the 21st century (Period IV). To determine whether shifting occurs in the region, we use the Mann–Kendall (M–K) method for the mean of the TL and other stations mentioned in Table 1. The results show that abrupt air temperature changes happened in 1992. This finding is consistent with the previous studies on the Beida River Basin by Wang et al. [12] and the Qilian Mountain by Tian et al. [9]. Considering that the climate regime and the altitude are similar between the Qiyi Glacier and TL stations [13,15], we believe the mass balance shift also occurred in 1992. A similar climate shift pattern during the early 1990s was also identified in the Xiao Dongkemadi Glacier in the inner TP [40] and the MZ15 Glacier in the eastern Pamir [58].
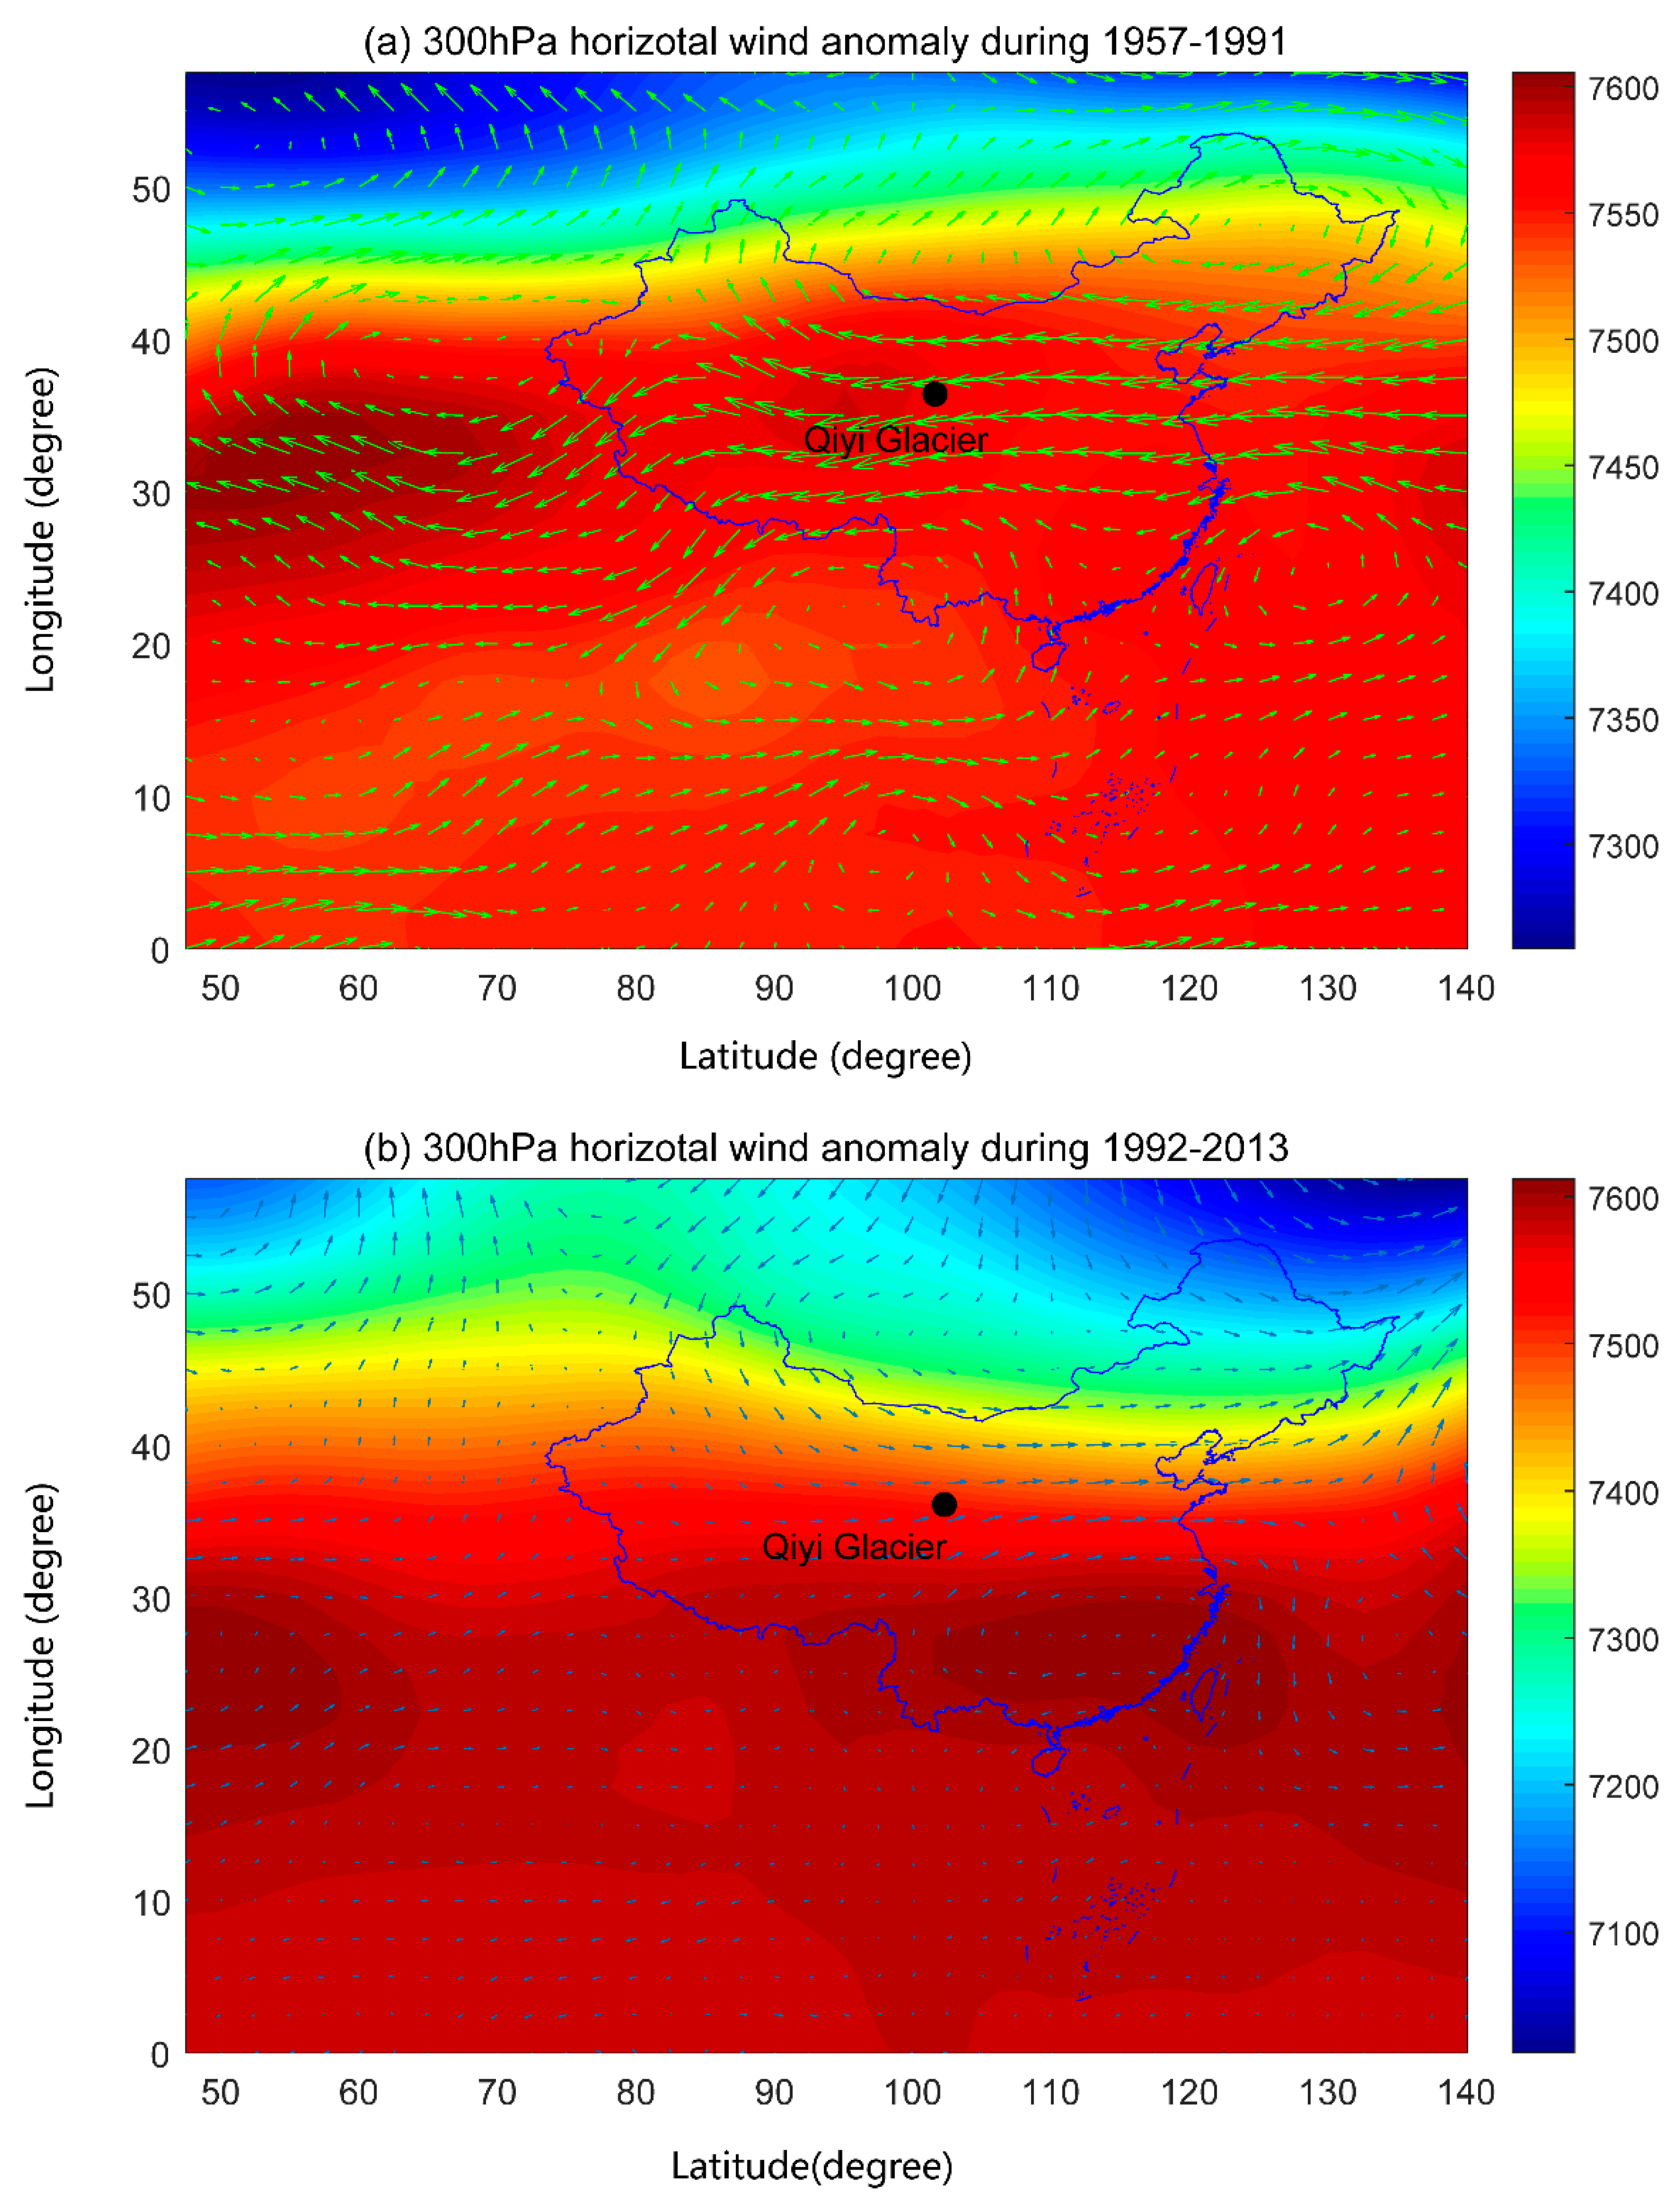
Although the combined effects of air temperature and precipitation dominate the glacier mass variations [12,47,55], they are also closely related to variations in the region’s large or large-scale atmospheric circulation pattern [58,59]. Figure 11 is a simple composite of the yearly mean 300 hPa geopotential height and horizontal wind anomalies for positive and negative SMB periods. During the positive SMB period 1957–1991, the anomalies at the 300 hPa horizontal wind directions are westerly wind [58]. In contrast, the directions are reversed during the negative period 1992–2013. The large-scale atmospheric airflow pattern across the Qilian Mountain may be crucial for SMB variations. Previous studies have proved that large-scale atmospheric circulation plays an essential role in controlling SMB change via influencing precipitation and air temperature (e.g., Yao et al. [55]; Mölg et al. [60]; Zhu et al. [58]; Yao et al. [5]). Therefore, this contrasting pattern between the two periods is discernible in the temporal variation of air temperature/precipitation anomalies [58]. Further research is needed to better understand the mechanisms coupling large-scale circulation and climate variability over the Qilian Mountain area, but this is beyond the scope of our study.

5.2. Surface Mass Balance Projections

Temperature estimations for RCP 4.5 and RCP 8.5 exhibited remarkable warming in the area over the 21st century (Figure 3a,c), but precipitation is expected to increase slightly with large variability among the GCMs (Figure 3b,d). In comparison to 1957–2013, the multi-model mean temperature by 2100 is anticipated to rise at a pace of 0.025 °C a−1 (p < 0.001) for RCP 4.5 and 0.059 °C a−1 (p < 0.001) for RCP 8.5 (Figure 3a). Whereas the precipitation by 2100 is expected to increase at a linear rate of 0.12% a−1 (p < 0.05) for RCP 4.5 (Figure 3b) and 0.21% a−1 (p < 0.01) for RCP 8.5 (Figure 3d) relative to 1957–2013. By 2081–2100, the temperature increase will exceed 2.5 °C for RCP 4.5 and 5.1 °C for RCP 8.5, while precipitation is projected to increase by 17.7% for RCP 4.5 and 25.8% for RCP 8.5.
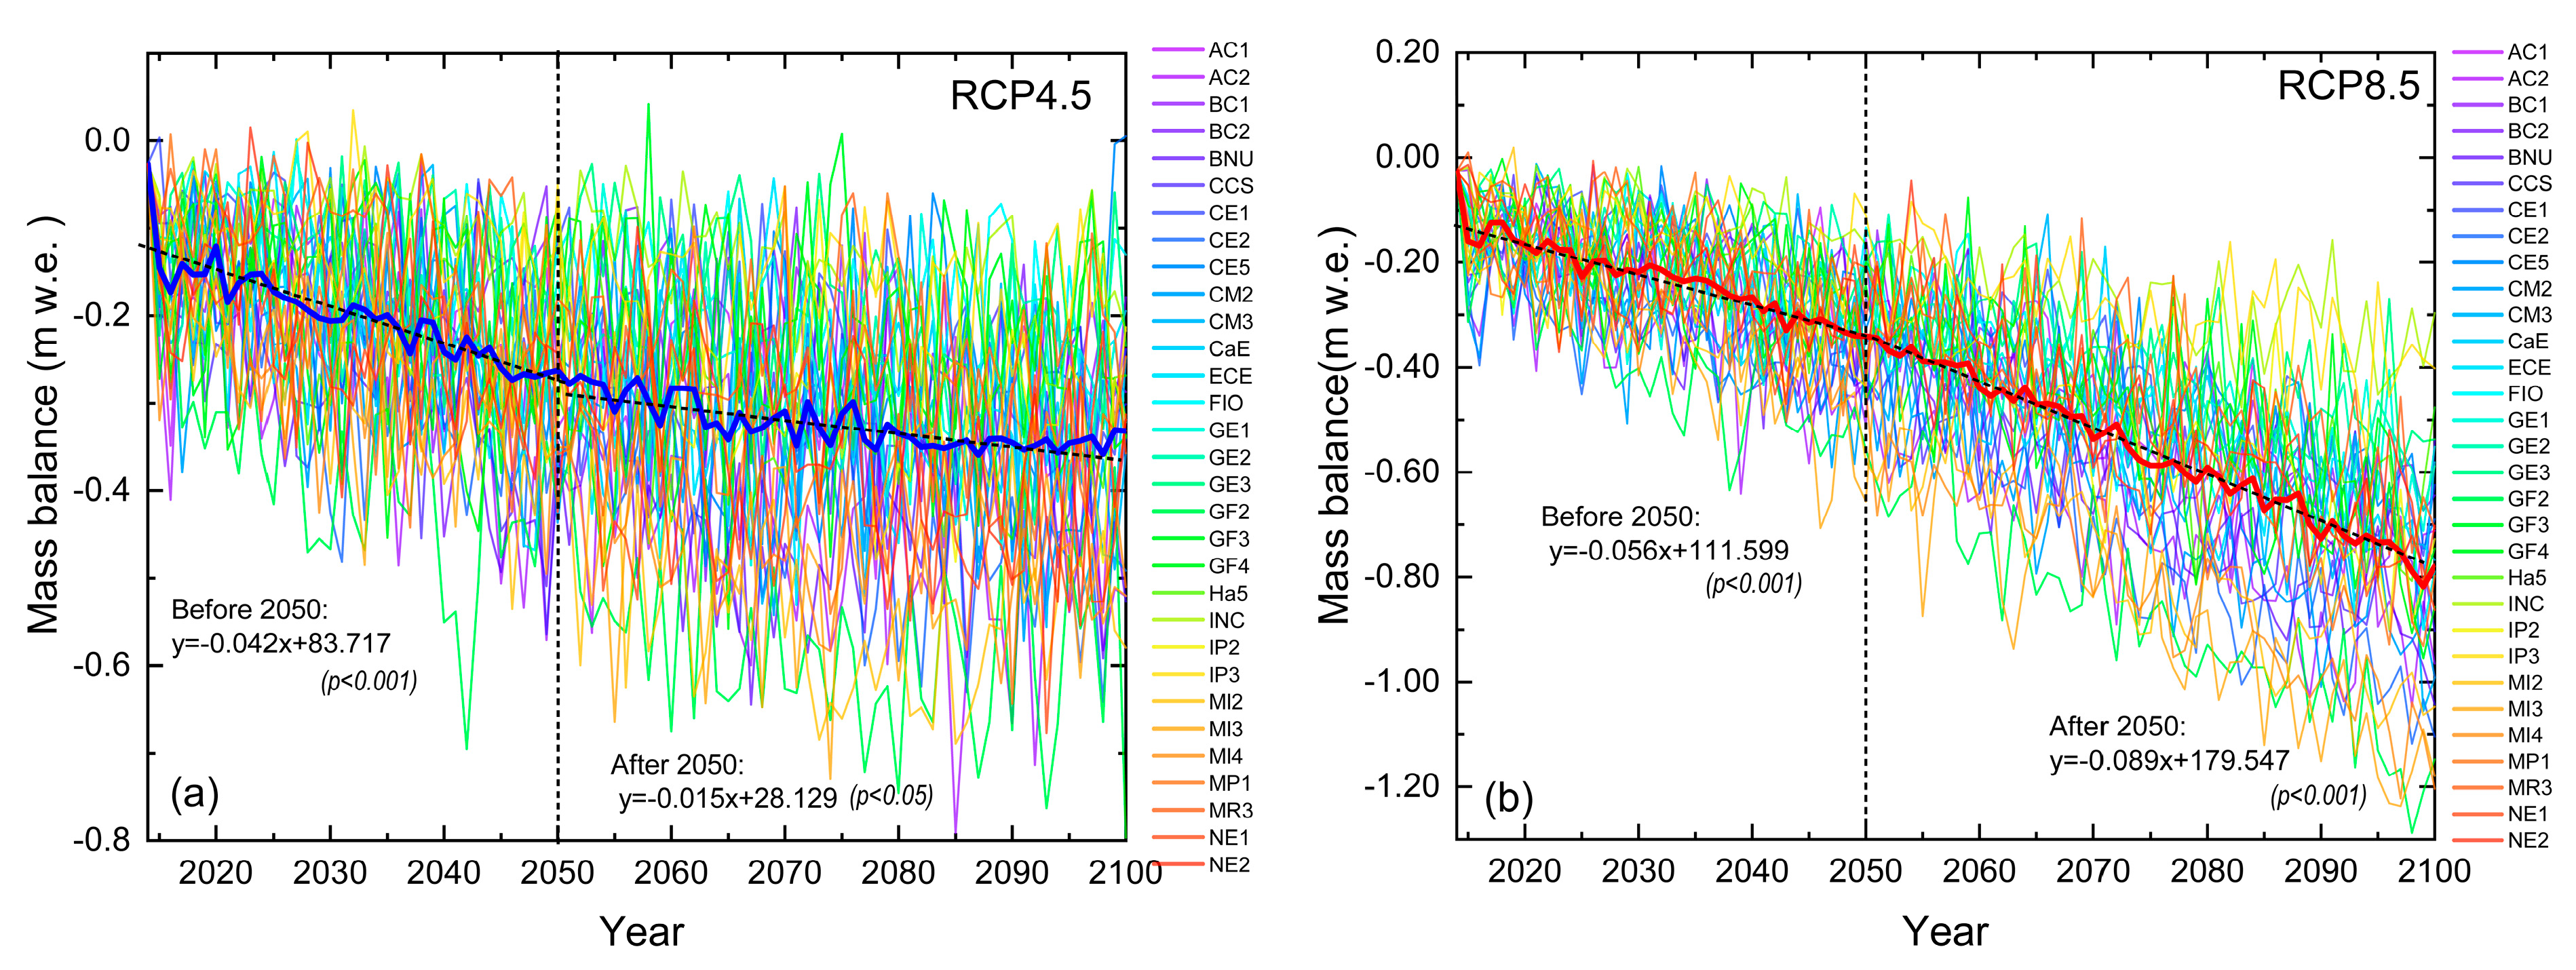
Figure 12a,b show the multi-model projected differences in SMB for RCP 4.5 and RCP 8.5. As temperatures rise, the Qiyi Glacier is predicted to lose glacier mass continuously throughout the 21st century. The projected mean SMB is −0.27 m w.e. and −0.42 m w.e. for RCP 4.5 and RCP 8.5 from 2014 to 2100, respectively. Before 2050, the means of SMB continuously decreases at a rate of −0.042 m w.e. a−1 for RCP 4.5 and −0.056 m w.e. a−1 for RCP 8.5, indicating the trend of the two scenarios is relatively small. However, the differences between the two RCPs of SMB loss become evident toward the end of 2100: mass loss is relatively stable for RCP 4.5 (−0.015 m w.e. a−1) but is accelerated for RCP 8.5 (−0.089 m w.e. a−1). The annual mean SMB is −0.75 m w.e. throughout 2091–2100 for RCP 8.5 ensembles, which is double that for RCP 4.5 ensembles (−0.35 m w.e.). With the rising air temperature, glacier melt is projected to be significantly enhanced. During this period, the mean air temperature increases rapidly with a linear rate of 0.038 °C a−1 (p < 0.001) for RCP 4.5 ensembles and 0.051 °C a−1 (p < 0.001) for RCP 8.5 relative to 1957–2013.
Despite the precipitation increasing slightly during two RCPs (Figure 2b,d), the tiny changes in precipitation are insufficient to offset the increased melting. The mean loss rates of SMB over 2014–2050 are expected to increase ~5 times for RCP 4.5 and ~7 times for RCP 8.5 relative to 1957–2013 (−0.008 m w.e a−1). Consequently, more glacier mass loss was released from Qiyi Glacier during this interval for both RCPs than in 1957–2013. In the coming decades, the air temperature would therefore remain to rise dramatically for RCP 8.5, resulting in consistent ice melting after 2050, which could not be compensated by the slight increase in precipitation (Figure 2d). As a result, the SMB loss of Qiyi Glacier continues to expand at a higher rate for RCP 8.5, particularly after 2081 when the air temperature increase approaches 5.1 °C. On the contrary, the air temperature rises at a steady rate of 0.01 °C a−1 during the corresponding period for the RCP 4.5 scenario, causing a slight increase in glacier melting. As discussed above, the ice melting could be partly compensated by the solid precipitation; thus, the glacier SMB loss for RCP 4.5 is not expected to accelerate but rather to remain steady in the second half of this century.
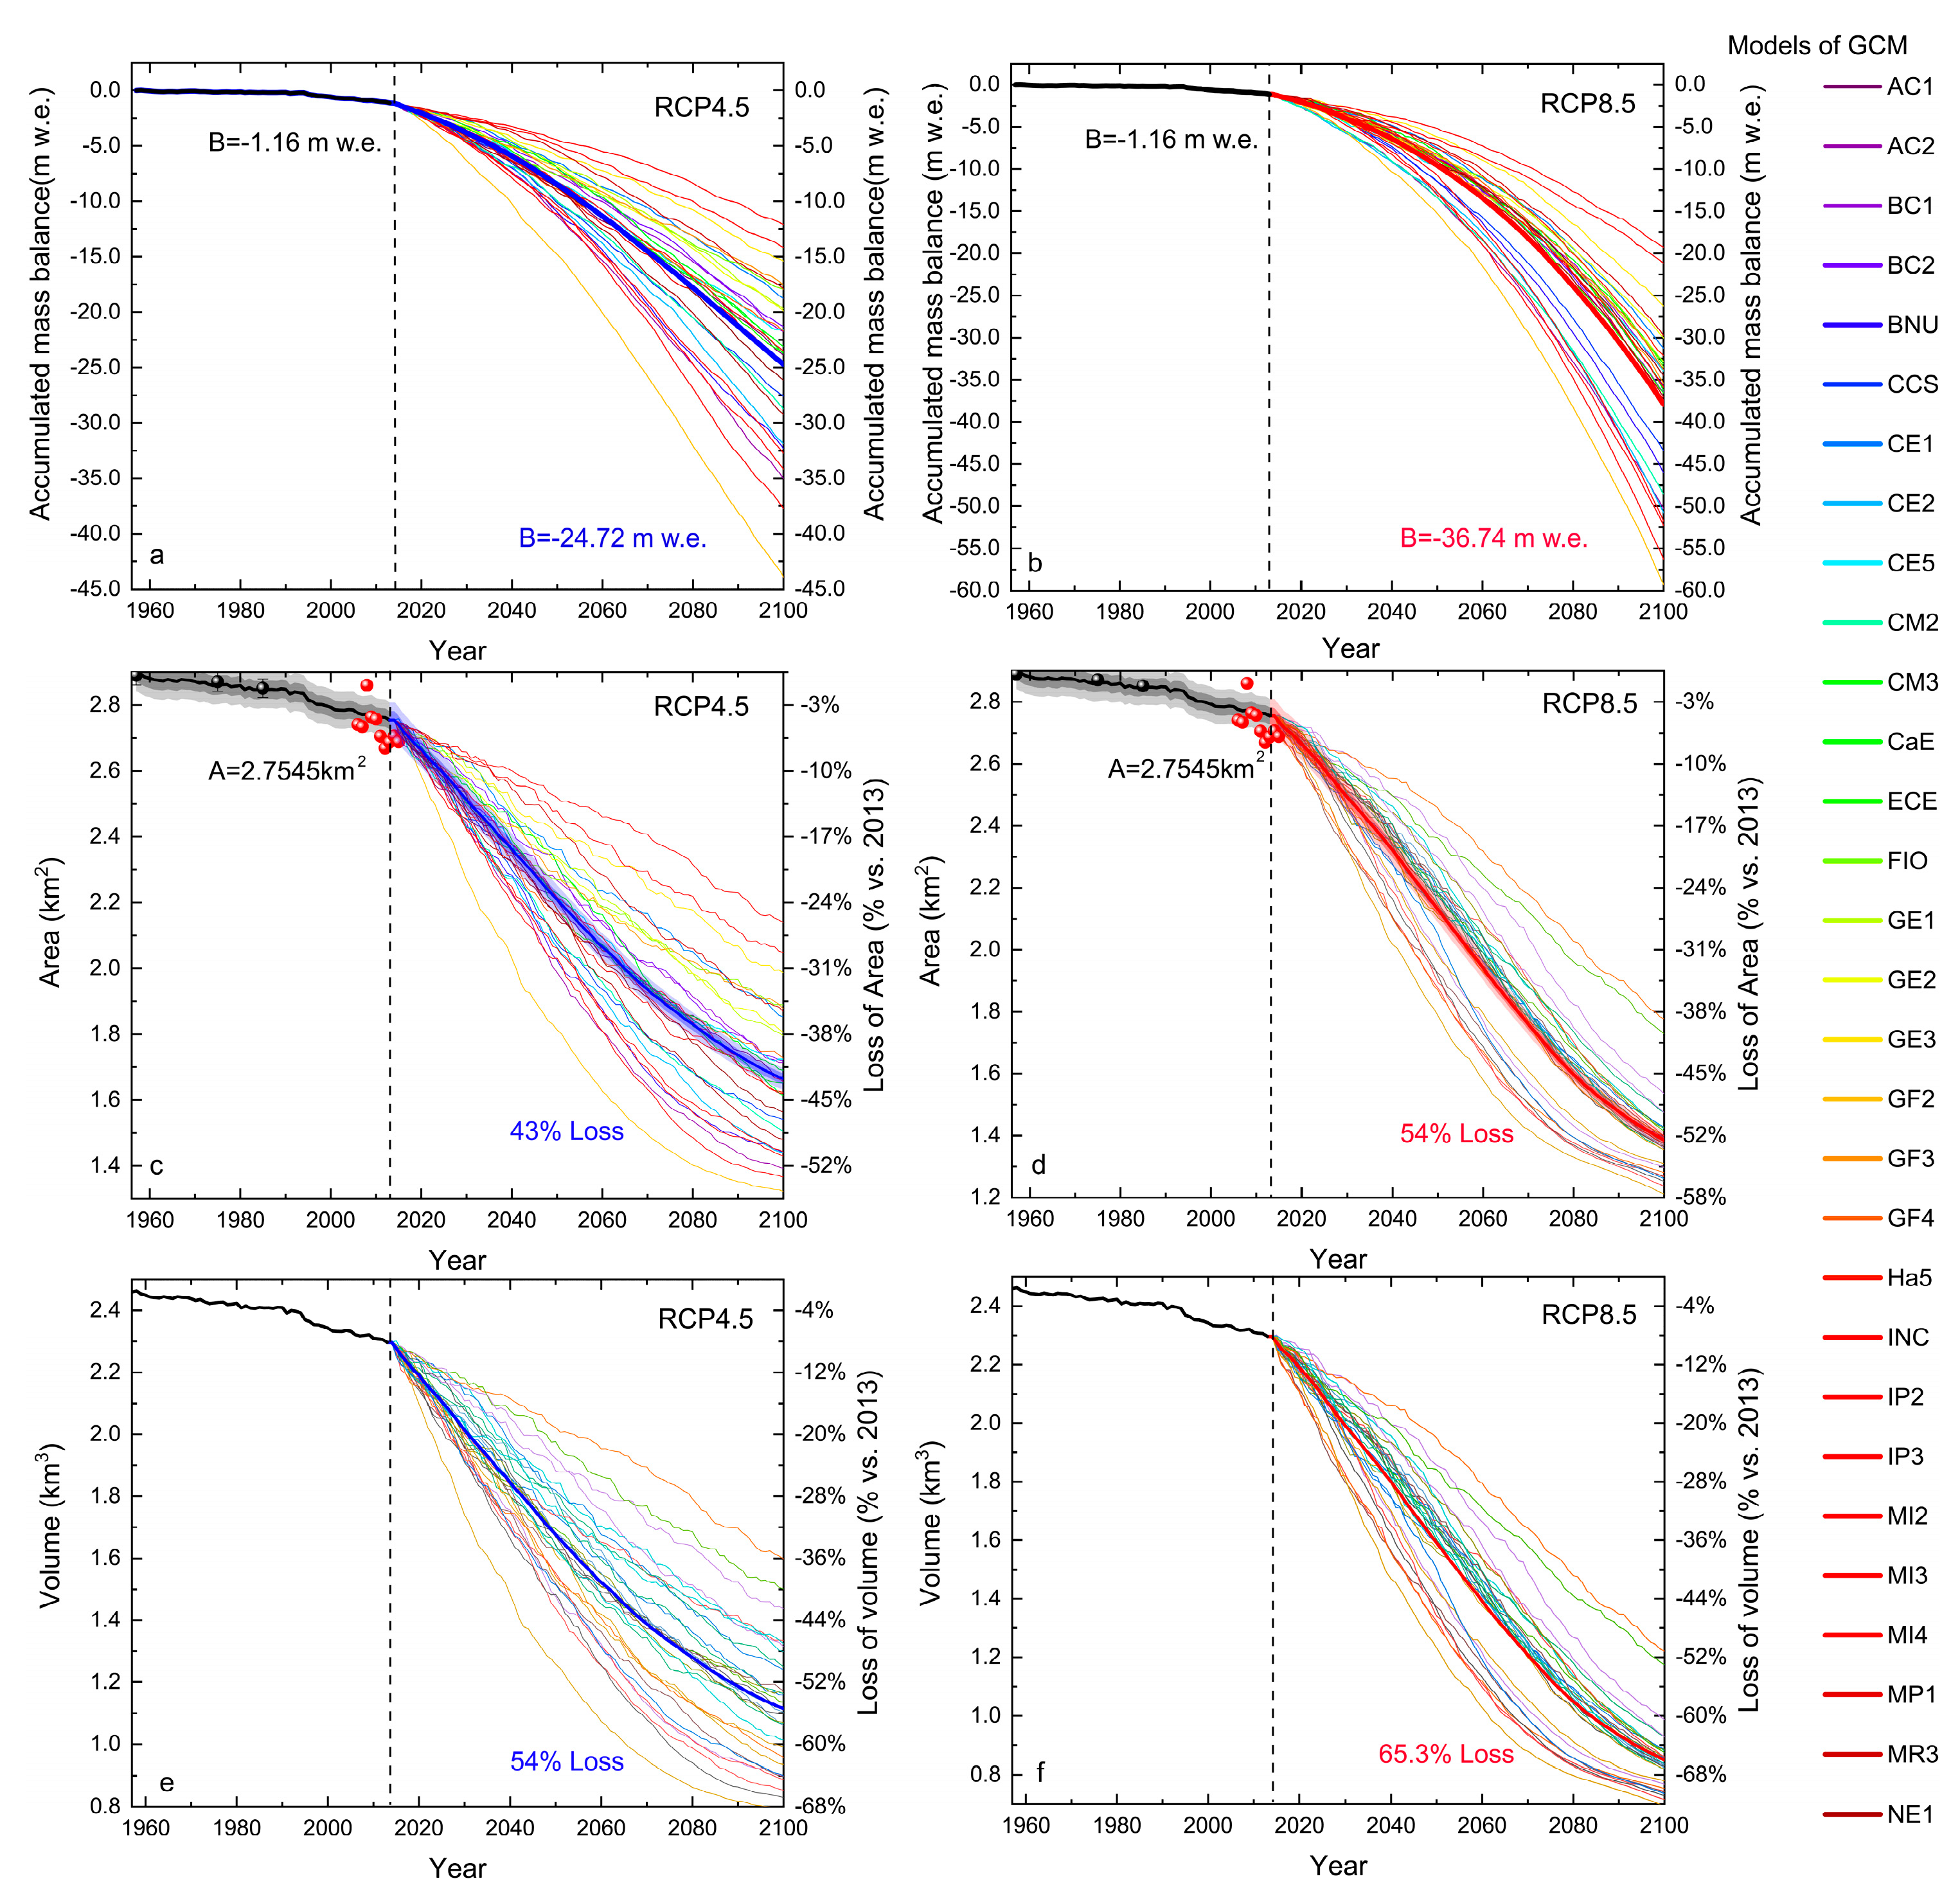
By the end of 2100, the Qiyi Glacier will lose ~25 m w.e. for RCP 4.5 (Figure 13a) and ~37 m w.e. for RCP 8.5 (Figure 13b), corresponding to the glacier thinning ~27.78 m for RCP 4.5 and 41.11 m (assuming the glacier density is 0.9 g/cm3). According to our observation by ground penetrating radar (GPR) in 2015, the average thickness of Qiyi Glacier is ~39.55 m, and the thickest site is located at 4800 m a.s.l. Thus, we conclude that the ice below 4800 m will completely melt by the end of 2100.

5.3. Glacier Area, Volume, and Terminus Elevation Projections

5.3.1. Area and Volume Evolution

The V-A scaling parameters (Table 4) gained from Radić and Hock [48], Grinsted [49], and Liu et al. [4] are commonly applied for estimating the glacier area and volume changes in the TP [61]. However, the differences between calculated results are primarily due to using different methods in the Qilian Mountains [10,11]. The maximum and minimum variation for the glacier volume and related changes are calculated using the method of Radić and Hock [48] and Grinsted [49], while the result found by Liu et al. [4] is among them. In this study, we compared these three sets of V-A scaling parameters and found that the parameters from Radić and Hock [48] reproduced the closest area variations of the Qiyi Glacier to the observed and remote sensing results from 1957 to 2013 (Figure 13c,d) and therefore, were used to calculate the glacier area changes in both RCPs to the end of 2100. It should be noted, however, that the glacier area change is not only related to the mass balance sensitivity but also influenced by the response time of the glacier to the climate variation [19]. In the Qilian Mountain, there are generally several decades of time lag for glacier areas in response to climate change [9,56], which has been considered in Equation (13).
The ensemble projections for 31 GCMs indicate a significant decrease in the glacier area of the Qiyi Glacier between 2014 to 2100 (Figure 13b,c). Before 2050, the means of ensembles exhibit a quick decline in glacier areas but with nearly similar rates for RCP 4.5 (~0.15 km2 a−1) and RCP 8.5 (~0.17 km2 a−1). As stated above, the SMB loss for both RCPs accelerates over this period in response to the increasing air temperatures (Figure 12). As a consequence, the increased mass loss causes a rapid decrease in glacier volume (Figure 13e,f) and the corresponding decline in glacier area (Figure 13b,d). A relatively steady mass loss in Qiyi Glacier during 2051–2100 causes a slight reduction in ice volume for RCP 4.5 (Figure 13e); therefore, the glacier area declines relatively slowly (~0.01km2 a−1). On the contrary, an enhanced mass loss resulted in a rapid reduction in glacier volume for RCP 8.5 (Figure 13f), which cannot be balanced by increased precipitation due to higher temperatures (Figure 3c,d). Therefore, the glacier area continues to decline relatively quickly for RCP 8.5 (~0.015 km2 a−1) after 2050. In short, the area of Qiyi Glacier will lose by ~43% for RCP 4.5 and ~54% for RCP 8.5 by the end of 2100 relative to 2013 content. Meanwhile, the volume of the Qiyi Glacier will decrease by ~54% for RCP 4.5 and by ~65% for RCP 8.5 by 2100, accordingly.
The projected area changes of Qiyi Glacier are within the IPCC AR5 projections of ~15% to 85% loss for global glaciers under RCP scenarios by the end of the 21st century [34]. These results are also close to previous studies conducted on the Altai Mountains, which suggested the glacier area will decrease by 26 ± 10% for RCP 4.5 and 60% ± 15% for RCP 8.5 by 2100 relative to 2005 [62]. A recent study on glaciers over the TP shows that the glacier area in Qilian Mountain declined by −0.56% a−1 from 2000–2050 by RegCM3 [61]. For Qiyi Glacier, the area retreated with a linear rate of −0.0126 km2 a −1 (−0.45% a−1, p < 0.001) for RCP 4.5 and −0.0145 km2 a −1 (−0.52% a−1, p < 0.001) for RCP 8.5 from 2014 to 2100. Considering the uncertainties in climate forcing and glacier scale models [19,35], the declining rate of the area is reasonable and acceptable.
There are also several estimations of glacier area loss close to our projections. For example, Xie et al. [63] predicted that the glacier area in China would be reduced by 40–60% by 2100 under different climate scenarios with the air temperature increase at rates of 0.03 °C a−1 (similar to RCP 4.5) and 0.05 °C a−1 (similar to RCP 8.5), respectively. Shi et al. [64] also estimated that the glacier in western China would lose 45% by the end of 2100 when the air temperature rises 2.1–4.0 K (similar to RCP 4.5). However, the decline of the Qiyi Glacier area seems less than that in other sub-regions of TP, especially in the Himalayan Mountains. As suggested by previous studies, almost all glaciers will be gone by 2035 if the globe continues to warm at its current rate [34] or decreases at least 63% (RCP 4.5) −87% (RCP 8.5) by 2050 relative to glacier extent in 2005 [65]. In contrast, our projected area loss rate is higher than that of 11% (based on a 0.035 °C a–1 historical warming trend) or 18% (the A1B scenario) in Qiangtang No. 1 Glacier, inner TP [66]. In addition to glacier area shrinkage, several studies reported that glaciers in the western Himalayas and the Karakoram keep expanding [5,15]. Except for heterogeneities for glacier variation caused by different sub-region and climate regimes [5,55], this pattern of glacier extent reduction also reveals that the retreat of Qiyi Glacier is higher than that in the TP interior but lower than glaciers in the area of Tienshan and Muztagh Ata, as well as the south margin of TP. Therefore, the extent of area reduction in Qiyi Glacier seems reasonable and acceptable.

5.3.2. Terminus Elevation and ELA Evolution

Glacier terminus elevation is the most widely used parameter to assess the overall health of glaciers [19,52]. Generally, a positive SMB causes the glacier to expand to lower terminal elevations, while a negative SMB leads to a retreat to higher terminus elevations. Therefore, changes in glacier terminus elevation provide negative feedback to the glacier SMB [3]. Without the possibility of a response of the glacier terminus to mass balance anomalies, the glacier could not reach equilibrium with ongoing climate change [19]. If terminus elevation changes are neglected, glaciers will lose substantially more mass negatively under increasing temperature in the coming centuries [3,19]. In addition, the changes to the glacier terminus elevation are also one of the critical factors in affecting the variation of glacier surface area shrinkage and therefore, influencing the volume variation [11]. However, due to the law of conservation of mass, the terminus elevation response to SMB is not instantaneous.
Compared to the SMB observation at Qiyi Glacier [13,18,20,55], little research has been conducted on the terminus elevation fluctuations for this representative glacier. The terminus elevation of Qiyi glacier’s response to the RCP 4.5 and RCP 8.5 climate scenarios was further estimated using the modified V-A scaling approach combined with the mass balance model. Since the terminus elevation position (outlier) of Qiyi Glacier could not be defined in the past decades, the outlier (4310 m a.s.l) in 2013 obtained by the Landsat TM/ETM+ images was applied to calculate the future variations. As Figure 14 shows, the mean ensemble projections of terminus elevation by 31 GCMs are 4335 (2020), 4570 (2040), 4693 (2060), 4767 (2080), and 4810 (2100) m a.s.l in RCP 4.5 climate scenarios. From 2013 to the end of 2100, the terminus elevation raises ~500 m with an upward rate of 5.68 m a−1. On the contrary, the mean terminus elevation is located at 4350 (2020), 4601 (2040), 4705 (2060), 4705 (2080), and 4838 (2100) m a.s.l in the RCP 8.5 climate scenario. The elevation of the terminus retreats ~528 m upwards at a mean rate of 6.00 m a−1. From 2013 through 2050, differences in terminus elevation change between the RCP 4.5 and RCP 8.5 seems relatively small. As mentioned above, the temperature increase rate during this period in RCP 8.5 (0.051 °C a−1, p < 0.001) is higher than that in RCP 4.5 (0.036 °C a−1, p < 0.001), but the rate of increased precipitation is higher in RCP 4.5 than that in RCP 8.5 during the same period.
Despite the fact that the precipitation could compensate for parts of the melting effect caused by temperature rising, the temperature increased at a higher rate of 0.068 °C a−1 (p < 0.001) for RCP 8.5 in the second half-century, whereas the temperature is relatively stable with a slightly increased rate of 0.014 °C a −1 (p < 0.001) for RCP 4.5 (Figure 3a,c). Similarly, the precipitation increased with a rate of 0.22 mm a−1 for RCP 8.5, while the rate for RCP 4.5 was only 0.09 mm a−1 (Figure 3b,d). Therefore, the mass loss in RCP 8.5 is almost twice as much as that in RCP 4.5 from 2014 to 2100 (Figure 13 and Figure 14). As a result, it leads the terminus elevation to retreat to a higher elevation in RCP 8.5 than in RCP 4.5 for the same periods. After all, the terminus elevation of Qiyi Glacier will at least go up to 4810 m a.s.l, which was higher than our calculated multi-year average ELA (4804 m a.s.l.) and the previous estimated mean annual ELA (4749 m. a.s.l.) from 1957 through 2013 [13].

6. Conclusions

The purpose of this study is to provide a comprehensive picture of the Qiyi Glacier to get a glimpse of the glacier variation in the Qilian Mountain, the response of glaciers to the ongoing climate change and its possible evolution in the SMB and its associated ELA, area, volume, and terminus elevation under future RCP 4.5 and RCP 8.5 climate scenarios. Therefore, an enhanced distributed temperature-index mass balance model and the latest time-related V-A scaling method were coupled to achieve this goal. The benefit of the methods employed here is effectively reducing the mass balance estimation inaccuracy caused by the glacier area variation (e.g., terminus retreat, shading effect, and solar radiation) and substantially improving the accuracy of glacier variation projection.
Our results show that the modeled annual SMB (−0.242 m w.e.) agrees well with the observed SMB (−0.252 m w.e.) from 1957 to 2013, especially during the 2011–2013 period; the monthly calculated SMB has a higher correlation with the observation. Consequently, the method adopted in the study should better reproduce the SMB variation and could be applied for the overall period simulation. From 1957 to 1991, the SMB variation of Qiyi Glacier experienced from a slightly positive (1957–1969) to a significant positive period (1970–1979), equilibrium stages (1980–1991), and finally, it abruptly shifted into the negative stages in 1992 which gradually accelerated since 2000. During the observed period, the glacier-wide mass balance switched from 0.23 m w.e. before 1992 to −0.26 m w.e. after that year. Meanwhile, the AAR decreased from 62.44% to 45.74%. The period ELA also raised from 4773 m (1957–1969) to 4832 m (1992–2013). This pattern of SMB variation and related ELA changes is primarily affected by the combined effect of air temperature and precipitation, especially the increasing air temperature in summer seasons that dominates its overall variation during 1957–2013. Moreover, the abrupt change of annual air temperature in 1992, related to a large-scale atmospheric circulation pattern shift, might have caused the mass to switch from a positive state to a negative stage and finally continuous loss with increasing air temperature when coming into the 21st century.
In the future, the ensemble projections for 31 GCMs indicate a continuous mass loss throughout the 21st century for RCP 4.5 and RCP 8.5. Before 2050, the mass loss trend for the two scenarios is relatively small. In contrast, the distinct temperature regimes for the two RCPs cause the disparities in SMB loss between them to become apparent toward the end of this century. By 2100, the Qiyi Glacier will lose ~25 m w.e. for RCP 4.5 and ~37 m w.e. for RCP 8.5. Correspondingly, the glacier will thin ~27.78 m for RCP 4.5 and ~ 41.11m for RCP 8.5. Meanwhile, the area of Qiyi Glacier projected by the multi-GCMs ensemble indicates a substantial decline from 2013 to 2100. It is similar to the decreasing pattern of SMB loss for both RCPs during the same period. The glacier area will lose ~43% for RCP 4.5 and ~54% for RCP 8.5 relative to 2013 glacier content in 2100. In comparison, the glacier volume will decrease by up to half (54%) for RCP 4.5 and 65% for RCP 8.5 by 2100, correspondingly. Simultaneously, the glacier terminus will experience extreme melt. The terminus elevation of Qiyi Glacier will go up from 4310 m a.s.l. in 2013 to 4810 m a.s.l. (RCP 4.5) and 4838 m a.s.l. (RCP 4.5) by the end of 2100. This terminus height will far exceed our estimated multi-year average ELA (4804 m a.s.l.) and the observed mean annual ELA (4749 m. a.s.l.) from 1957 to 2013.
These results alert us that the Qiyi Glacier is unstable in both RCPs. If the warming trend continues and glaciers continue to melt at this ‘shocking’ pace in coming years, urgent mitigation measures are required to adapt to ensure long-term water security in the Hexi Corridor.

Author Contributions

Conceptualization, K.D. and B.H.; investigation and data curation, A.C. and Y.W.; methodology and models simulations, L.C. and P.S.; validation and visualization, P.S. and A.C.; writing—original draft preparation, P.S. and L.C. All authors have read and agreed to the published version of the manuscript.

Funding

This research was funded by the Natural Science Foundation of Shaanxi Province, China (No. 2023-JC-YB-259), the China Postdoctoral Science Foundation (Nos. 2017M610622, 2017BSHEDZZ18), and the Second Tibetan Plateau Scientific Expedition research (STEP) program (No. 2019QZKK0201).

Institutional Review Board Statement

Not applicable.

Informed Consent Statement

Not applicable.

Data Availability Statement

The data source is included in the article and it can also be provided upon request.

Acknowledgments

We express our gratitude to the anonymous reviewers for their valuable comments and suggestions on the manuscript. Additionally, we extend our appreciation to the climate modeling groups (as listed in Table 2) for generating and sharing their model outputs.

Conflicts of Interest

The authors declare no conflict of interest.

References

  1. Immerzeel, W.W.; Van Beek, L.P.; Bierkens, M.F. Climate change will affect the Asian water towers. Science 2010, 328, 1382–1385. [Google Scholar] [CrossRef]
  2. Bolch, T.; Kulkarni, A.; Kääb, A.; Huggel, C.; Paul, F.; Cogley, J.G.; Frey, H.; Kargel, J.S.; Fujita, K.; Scheel, M.; et al. The state and fate of Himalayan glaciers. Science 2012, 336, 310–314. [Google Scholar] [CrossRef]
  3. Marzeion, B.; Jarosch, A.H.; Hofer, M. Past and future sea-level change from the surface mass balance of glaciers. Cryosphere 2012, 6, 1295–1322. [Google Scholar] [CrossRef]
  4. Shiyin, L.; Wenxin, S.; Yongping, S.; Gang, L. Glacier changes since the Little Ice Age maximum in the western Qilian Shan, northwest China, and consequences of glacier runoff for water supply. J. Glaciol. 2003, 49, 117–124. [Google Scholar] [CrossRef]
  5. Yao, T.; Bolch, T.; Chen, D.; Gao, J.; Immerzeel, W.; Piao, S.; Su, F.; Thompson, L.; Wada, Y.; Wang, L.; et al. The imbalance of the Asian water tower. Nat. Rev. Earth Environ. 2022, 3, 618–632. [Google Scholar] [CrossRef]
  6. Huss, M.; Fischer, M. Sensitivity of Very Small Glaciers in the Swiss Alps to Future Climate Change. Front. Earth Sci. 2016, 4, 34. [Google Scholar] [CrossRef]
  7. Zemp, M.; Huss, M.; Thibert, E.; Eckert, N.; McNabb, R.; Huber, J.; Barandun, M.; Machguth, H.; Nussbaumer, S.U.; Gärtner-Roer, I.; et al. Global glacier mass changes and their contributions to sea-level rise from 1961 to 2016. Nature 2019, 568, 382–386. [Google Scholar] [CrossRef]
  8. Masson-Delmotte, V.; Zhai, P.; Pirani, A.; Connors, S.L.; Péan, C.; Chen, Y.; Goldfarb, L.; Gomis, M.I.; Matthews, J.B.R.; Berger, S.; et al. Climate Change 2021: The Physical Science Basis. In Contribution of Working Group I to the Sixth Assessment Report of the Intergovernmental Panel on Climate Change; Cambridge University Press: Cambridge, UK, 2021. [Google Scholar]
  9. Tian, H.; Yang, T.; Liu, Q. Climate change and glacier area shrinkage in the Qilian mountains, China, from 1956 to 2010. Ann. Glaciol. 2014, 55, 187–197. [Google Scholar] [CrossRef]
  10. Sun, M.; Liu, S.; Yao, X.; Guo, W.; Xu, J. Glacier changes in the Qilian Mountains in the past half-century: Based on the revised First and Second Chinese Glacier Inventory. Acta Geogr. Sin. 2018, 28, 206–220. [Google Scholar] [CrossRef]
  11. He, J.; Wang, N.; Chen, A.A.; Yang, X.; Hua, T. Glacier Changes in the Qilian Mountains, Northwest China, between the 1960s and 2015. Water 2019, 11, 623. [Google Scholar] [CrossRef]
  12. Wang, S.; Yao, T.; Tian, L.; Pu, J. Glacier mass variation and its effect on surface runoff in the Beida River catchment during 1957–2013. J. Glaciol. 2017, 63, 523–534. [Google Scholar] [CrossRef]
  13. Wang, N.; He, J.; Pu, J.; Jiang, X.; Jing, Z. Variations in equilibrium line altitude of the Qiyi Glacier, Qilian Mountains, over the past 50 years. Chin. Sci. Bull. 2010, 55, 3810–3817. [Google Scholar] [CrossRef]
  14. Wang, Z.T.; Liu, C.; You, G.; Pu, J.; Yang, H.; Tian, P. Glacier Inventory of China, I, Qilian Mountain; Lanzhou Institute of Glaciology and Geocryology, Chinese Academy of Sciences: Lanzhou China, 1981; pp. 1–35. (In Chinese) [Google Scholar]
  15. Pu, J.C.; Yao, T.D.; Duan, K.Q.; Sakai, A.; Fujita, K.; Matsuda, Y. Mass Balance of the Qiyi Glacier in the Qilian Mountains: A New Observation. J. Glaciol. Geocryol. 2005, 27, 199–204. (In Chinese) [Google Scholar]
  16. Duan, K.; Yao, T.; Wang, N.; Shi, P.; Meng, Y. Changes in equilibrium-line altitude and implications for glacier evolution in the Asian high mountains in the 21st century. Sci. China Earth Sci. 2022, 65, 1308–1316. [Google Scholar] [CrossRef]
  17. Wu, Y.; Wang, N.; He, J.; Jiang, X. Estimating Mountain glacier surface temperatures from Landsat-ETM+ thermal infrared data: A case study of Qiyi glacier, China. Remote Sens. Environ. 2015, 163, 286–295. [Google Scholar] [CrossRef]
  18. Wang, S.; Wang, J.; Pu, J. Application of a distributed degree-day model of glaciers in the upper reaches of the Beida River Basin. Environ. Earth Sci. 2016, 75, 1–14. [Google Scholar] [CrossRef]
  19. Marzeion, B.; Jarosch, A.H.; Gregory, J.M. Feedbacks and mechanisms affecting the global sensitivity of glaciers to climate change. Cryosphere 2014, 8, 59–71. [Google Scholar] [CrossRef]
  20. Jiang, X.; Wang, N.; He, J.; Wu, X.; Song, G. A distributed surface energy and mass balance model and its application to a mountain glacier in China. Chin. Sci. Bull. 2010, 55, 2079–2087. [Google Scholar] [CrossRef]
  21. Wu, X.; He, J.; Jiang, X.; Wang, N. Analysis of surface energy and mass balance in the accumulation zone of Qiyi Glacier, Tibetan Plateau in an ablation season. Environ. Earth Sci. 2016, 75, 1–13. [Google Scholar] [CrossRef]
  22. Hock, R.; Radić, V.; De Woul, M. Climate sensitivity of Storglaciären, Sweden: An intercomparison of mass-balance models using ERA-40 re-analysis and regional climate model data. Ann. Glaciol. 2007, 46, 342–348. [Google Scholar] [CrossRef]
  23. Radić, V.; Bliss, A.; Beedlow, A.C.; Hock, R.; Miles, E.; Cogley, J.G. Regional and global projections of twenty-first century glacier mass changes in response to climate scenarios from global climate models. Clim. Dyn. 2014, 42, 37–58. [Google Scholar] [CrossRef]
  24. Cogley, J.G. The future of Asia’s glaciers. Nature 2017, 549, 166–167. [Google Scholar] [CrossRef] [PubMed]
  25. Liang, L.; Cuo, L.; Liu, Q. Mass Balance Variation and Associative Climate Drivers for the Dongkemadi Glacier in the Central Tibetan Plateau. J. Geophys. Res. Atmos. 2019, 124, 10814–10825. [Google Scholar] [CrossRef]
  26. Duan, K. Simulation and prediction of equilibrium line altitude of glaciers in the eastern Tibetan plateau. In Proceedings of the EGU General Assembly Conference, Vienna, Austria, 23–28 April 2017; pp. 104–113. [Google Scholar]
  27. Hock, R. Glacier melt: A review of processes and their modelling. Prog. Phys. Geogr. 2005, 29, 362–391. [Google Scholar] [CrossRef]
  28. Huss, M.; Bauder, A.; Funk, M.; Hock, R. Determination of the seasonal mass balance of four Alpine glaciers since 1865. J. Geophys. Res. Earth Surf. 2008, 113, F01015. [Google Scholar] [CrossRef]
  29. Ohmura, A. Physical Basis for the Temperature-Based Melt-Index Method. J. Appl. Meteorol. 2001, 40, 753–761. [Google Scholar] [CrossRef]
  30. Gabbi, J.; Carenzo, M.; Pellicciotti, F.; Bauder, A.; Funk, M. A comparison of empirical and physically based glacier surface melt models for long-term simulations of glacier response. J. Glaciol. 2014, 60, 1140–1154. [Google Scholar] [CrossRef]
  31. Réveillet, M.; Six, D.; Vincent, C.; Rabatel, A.; Dumont, M.; Lafaysse, M.; Morin, S.; Vionnet, V.; Litt, M. Relative performance of empirical and physical models in assessing the seasonal and annual glacier surface mass balance of Saint-Sorlin Glacier (French Alps). Cryosphere 2018, 12, 1367–1386. [Google Scholar] [CrossRef]
  32. Sorg, A.; Huss, M.; Rohrer, M.; Stoffel, M. The days of plenty might soon be over in glacierized Central Asian catchments. Environ. Res. Lett. 2014, 9, 104018. [Google Scholar] [CrossRef]
  33. Kienholz, C.; Hock, R.; Truffer, M.; Bieniek, P.; Lader, R. Mass Balance Evolution of Black Rapids Glacier, Alaska, 1980–2100, and Its Implications for Surge Recurrence. Front. Earth Sci. 2017, 5, 56. [Google Scholar] [CrossRef]
  34. IPCC. Climate change 2013: The physical science basis. In Contribution of Working Group I to the Fifth Assessment Report of the Intergovernmental Panel on Climate Change; Cambridge University Press: Cambridge, UK; New York, NY, USA, 2013. [Google Scholar]
  35. Watanabe, M.; Yanagawa, A.; Watanabe, S.; Hirabayashi, Y.; Kanae, S. Quantifying the range of future glacier mass change projections caused by differences among observed past-climate datasets. Clim. Dyn. 2019, 53, 2425–2435. [Google Scholar] [CrossRef]
  36. Wang, S.; Pu, J.; Wang, N. Study on mass balance and sensitivity to climate change in summer on the Qiyi Glacier, Qilian Mountains. Sci. Cold Arid Reg. 2012, 4, 281–287. [Google Scholar]
  37. Guo, Z.; Wang, N.; Wu, H.; Wu, Y.; Wu, X.; Li, Q. Variations in Firn Line Altitude and Firn Zone Area on Qiyi Glacier, Qilian Mountains, Over the Period of 1990 to 2011. Arct. Antarct. Alp. Res. 2015, 47, 293–300. [Google Scholar] [CrossRef]
  38. Wang, D.; Liu, J.; Wang, H.; Shao, W.; Mei, C.; Ding, X. Performance evaluations of CMIP6 and CMIP5 models for precipitation simulation over the Hanjiang River Basin, China. J. Water Clim. Chang. 2022, 13, 2089–2106. [Google Scholar] [CrossRef]
  39. Salathé, E.P. Downscaling simulations of future global climate with application to hydrologic modelling. Int. J. Climatol. 2005, 25, 419–436. [Google Scholar] [CrossRef]
  40. Shi, P.-H.; Duan, K.-Q.; Liu, H.-C.; Yang, J.-H.; Zhang, X.; Sun, J.-Y. Response of Xiao Dongkemadi Glacier in the central Tibetan Plateau to the current climate change and future scenarios by 2050. J. Mt. Sci. 2016, 13, 13–28. [Google Scholar] [CrossRef]
  41. Fujita, K.; Suzuki, R.; Nuimura, T.; Sakai, A. Performance of ASTER and SRTM DEMs, and their potential for assessing glacial lakes in the Lunana region, Bhutan Himalaya. J. Glaciol. 2008, 54, 220–228. [Google Scholar] [CrossRef]
  42. Oerlemans, J.; Fortuin, J.P.F. Sensitivity of Glaciers and Small Ice Caps to Greenhouse Warming. Science 1992, 258, 115–117. [Google Scholar] [CrossRef]
  43. Fujita, K.; Ohta, T.; Ageta, Y. Characteristics and climatic sensitivities of runoff from a cold-type glacier on the Tibetan Plateau. Hydrol. Process. 2007, 21, 2882–2891. [Google Scholar] [CrossRef]
  44. Young, J.C.; Arendt, A.; Hock, R.; Pettit, E. The challenge of monitoring glaciers with extreme altitudinal range: Mass-balance reconstruction for Kahiltna Glacier, Alaska. J. Glaciol. 2018, 64, 75–88. [Google Scholar] [CrossRef]
  45. Mosier, T.M.; Hill, D.F.; Sharp, K.V. How much cryosphere model complexity is just right? Exploration using the conceptual cryosphere hydrology framework. Cryosphere 2016, 10, 2147–2171. [Google Scholar] [CrossRef]
  46. Kang, E.; Cheng, G.; Lan, Y.; Jin, H. A model for simulating the response of runoff from the mountainous watersheds of inland river basins in the arid area of northwest China to climatic changes. Sci. China Ser. D Earth Sci. 1999, 42 (Suppl. 1), 52–63. [Google Scholar] [CrossRef]
  47. Oerlemans, J. Extracting a Climate Signal from 169 Glacier Records. Science 2005, 308, 675–677. [Google Scholar] [CrossRef]
  48. Radić, V.; Hock, R. Regional and global volumes of glaciers derived from statistical upscaling of glacier inventory data. J. Geophys. Res. Earth Surf. 2010, 115, F01010. [Google Scholar] [CrossRef]
  49. Grinsted, A. An estimate of global glacier volume. Cryosphere 2013, 7, 141–151. [Google Scholar] [CrossRef]
  50. Zhao, Q.; Ding, Y.; Wang, J.; Gao, H.; Zhang, S.; Zhao, C.; Xu, J.; Han, H.; Shangguan, D. Projecting climate change impacts on hydrological processes on the Tibetan Plateau with model calibration against the glacier inventory data and observed streamflow. J. Hydrol. 2019, 573, 60–81. [Google Scholar] [CrossRef]
  51. Berthier, E.; Arnaud, Y.; Kumar, R.; Ahmad, S.; Wagnon, P.; Chevallier, P. Remote sensing estimates of glacier mass balances in the Himachal Pradesh (Western Himalaya, India). Remote Sens. Environ. 2007, 108, 327–338. [Google Scholar] [CrossRef]
  52. Zhao, L.; Yang, Y.; Cheng, W.; Ji, D.; Moore, J.C. Glacier evolution in high-mountain Asia under stratospheric sulfate aerosol injection geoengineering. Atmos. Chem. Phys. 2017, 17, 6547–6564. [Google Scholar] [CrossRef]
  53. Che, Y.; Zhang, M.; Li, Z.; Li, H.; Wang, S.; Sun, M.; Zha, S. Glacier mass-balance and length variation observed in China during the periods 1959–2015 and 1930–2014. Quat. Int. 2017, 454, 68–84. [Google Scholar] [CrossRef]
  54. Rupper, S.; Roe, G. Glacier Changes and Regional Climate: A Mass and Energy Balance Approach. J. Clim. 2008, 21, 5384–5401. [Google Scholar] [CrossRef]
  55. Yao, T.; Thompson, L.; Yang, W.; Yu, W.; Gao, Y.; Guo, X.; Yang, X.; Duan, K.; Zhao, H.; Xu, B.; et al. Different glacier status with atmospheric circulations in Tibetan Plateau and surroundings. Nat. Clim. Chang. 2012, 2, 663–667. [Google Scholar] [CrossRef]
  56. Cao, B.; Pan, B.-T.; Cai, M.-Y.; Wang, J. An investigation on changes in glacier mass balance and hypsometry for a small mountainous glacier in the northeastern Tibetan Plateau. J. Mt. Sci. 2017, 14, 1624–1632. [Google Scholar] [CrossRef]
  57. Ji, Q.; Yang, T.B.; Dong, J.; He, Y. Glacier variations in response to climate change in the eastern Nyainqêntanglha Range, Tibetan Plateau from 1999 to 2015. Arct. Antarct. Alp. Res. 2018, 50, e1435844. [Google Scholar] [CrossRef]
  58. Zhu, M.; Yao, T.; Yang, W.; Xu, B.; Wu, G.; Wang, X.; Xie, Y. Reconstruction of the mass balance of Muztag Ata No. 15 glacier, eastern Pamir, and its climatic drivers. J. Glaciol. 2018, 64, 259–274. [Google Scholar] [CrossRef]
  59. Ke, L.; Ding, X.; Song, C. Estimation of mass balance of Dongkemadi glaciers with multiple methods based on multi-mission satellite data. Quat. Int. 2015, 371, 58–66. [Google Scholar] [CrossRef]
  60. Mölg, T.; Maussion, F.; Scherer, D. Mid-latitude westerlies as a driver of glacier variability in monsoonal High Asia. Nat. Clim. Chang. 2014, 4, 68–73. [Google Scholar] [CrossRef]
  61. Zhao, L.; Ding, R.; Moore, J.C. Glacier volume and area change by 2050 in high mountain Asia. Glob. Planet. Chang. 2014, 122, 197–207. [Google Scholar] [CrossRef]
  62. Zhang, Y.; Enomoto, H.; Ohata, T.; Kitabata, H.; Kadota, T.; Hirabayashi, Y. Projections of glacier change in the Altai Mountains under twenty-first century climate scenarios. Clim. Dyn. 2016, 47, 2935–2953. [Google Scholar] [CrossRef]
  63. Xie, Z.-C.; Wang, X.; Feng, Q.-H.; Kang, E.; Liu, C.-H.; Li, Q.-Y. Modeling the response of glacier systems to climate warming in China. Ann. Glaciol. 2006, 43, 313–316. [Google Scholar] [CrossRef]
  64. Shi, Y.; Liu, S. Estimation on the response of glaciers in China to the global warming in the 21st century. Chin. Sci. Bull. 2000, 45, 668–672. [Google Scholar] [CrossRef]
  65. Li, L.; Shen, M.; Hou, Y.; Xu, C.-Y.; Lutz, A.F.; Chen, J.; Jain, S.K.; Li, J.; Chen, H. Twenty-first-century glacio-hydrological changes in the Himalayan headwater Beas River basin. Hydrol. Earth Syst. Sci. 2019, 23, 1483–1503. [Google Scholar] [CrossRef]
  66. Li, Y.; Tian, L.; Yi, Y.; Moore, J.C.; Sun, S.; Zhao, L. Simulating the Evolution of Qiangtang No. 1 Glacier in the Central Tibetan Plateau to 2050. Arct. Antarct. Alp. Res. 2017, 49, 1–12. [Google Scholar] [CrossRef]
Figure 1. The location of the Qiyi glacier in the Qilian Mountain and the adjacent meteorological stations. (a) The glaciers (dark red) and the adjacent meteorological stations (black dots; Source: ESRI Basemap DigitalGlobe imagery), (b) the pictures of Qiyi glaciers, and (c) the stakes and AWSs on the Qiyi glacier.
Atmosphere 14 00723 g001
Figure 2. (a,b) Comparison of the monthly total precipitation for the raw GCM outputs, downscaled precipitation, and measurements of TL stations. (c,d) Comparison of the monthly mean precipitation for raw GCM outputs, observation, and the bias-corrected results. In the box-and-whisker plots, the centerlines represent the ensemble means, box limits indicate the 25th and 75th percentiles, and whiskers denote minimum and maximum values of the ensemble of 31 ensembles of GCM outputs. (e,f) Comparison of the mean daily air temperature for observation, raw GCM, and the bias-corrected GCM results.
Atmosphere 14 00723 g002
Figure 3. De-biased temperature anomaly (a,c) and de-biased precipitation anomaly (b,d) between 1957 and 2100 relative to 1957–2013 (horizontal dotted line). The thick black line represents the variables’ progress across the observation period. The colored thin lines reflect the evolution of each GCM simulation in the CMIP5 ensemble (31 in total; see Table 1). The thick red and blue lines are the means of GCM simulations.
Atmosphere 14 00723 g003
Figure 4. Annual slope corrected clear-sky potential radiation (a) and shading (b) at Qiyi Glacier surface. The centerlines in the box-and-whisker plots represent the mean, the box bounds refer to the 25th and 75th percentiles, and the whiskers represent minimum and maximum values. The error bars indicate a 5% percentage deviation.
Atmosphere 14 00723 g004
Figure 5. Spatial distribution of shading (a,b) and the slope corrected clear-sky potential radiation (c,d) in winter and summer seasons at the Qiyi glacier surface.
Atmosphere 14 00723 g005
Figure 6. Evaluating modeled SMB against in-suit observations at Qiyi glacier. Linear plots (a,b) refer to the modeled annual and monthly glacier-wide SMB vs. observations. The frequency of misfits (c) is modeled vs. measured glacier-wide monthly SMB. Error bars in (a) indicate the 1 δ standard deviation. In (a,b), dashed green lines mean the zero of SMB. In (c), the dashed red line represents the zero misfit.
Atmosphere 14 00723 g006
Figure 7. The simulated and observed annual SMB and the seasonal glacier SMB series of Qiyi glacier, 1957–2014.
Atmosphere 14 00723 g007
Figure 8. The spatial mean annual mass balance (MB) variation during Period I (1957–1969, a), Period II (1970–1979, b), Period III (1980–1991, c), and Period VI (1992–2013, d).
Atmosphere 14 00723 g008
Figure 9. The altitudinal distribution of SMB and mean area were calculated for Qiyi glacier (a) and the ELA variation from 1957–2013 (b). The reconstructed ELA provided by Wang et al. [13]. The dashed blue line indicates the linear rate of ELA, and the sky-blue shading refers to the 1 δ standard deviation of modeled ELA.
Atmosphere 14 00723 g009
Figure 10. The glacier ablation and accumulation response to local air temperature and precipitation of TL station during 1957–2013. The relationship between annual mass balance and annual air temperature (a) and annual precipitation (d); the relationship between annual ablation in summer and summer annual mean air temperature (b) and summer precipitation (e); the relationship between accumulation in winter and winter mean annual air temperature (c); and annual precipitation (f). The solid lines in the figure indicate the linear rate for air temperature and precipitation.
Atmosphere 14 00723 g010
Figure 11. Composites of the 300 hPa geopotential height and horizontal wind anomalies (June to September) for the years in when the Qiyi glacier’s mass balance was positive (1957–1991); (a) and negative (1992–2013); (b) during the ablation season. The Qiyi glacier is marked with a black dot. The data came from the National Center for Environmental Predictions/National Center for Atmospheric Research (NCEP/NCAR).
Atmosphere 14 00723 g011
Figure 12. The annual surface mass balance was projected in RCP 4.5 (a) and RCP 8.5 (b) scenarios during 2014–2100. The thick dashed thick lines refer to the mean value of ensembles.
Atmosphere 14 00723 g012
Figure 13. The accumulated mass balance (a,b), area (c,d), and volume (e,f) of the Qiyi glacier during 1957–2100 under RCP 4.5 and RCP 8.5 climate scenarios by using multi-model outputs of GCM. The black balls in (c,d) refer to the observed areas of the Qiyi glacier; the red balls in (c,d) refers to the areas gained from Landsat EM+. The thick lines in the (af) indicate the mean values.
Atmosphere 14 00723 g013
Figure 14. The terminus elevation and SMB distribution of Qiyi glacier under the RCP 4.5 and RCP 8.5 climate scenarios. The bold blue T refers to the terminus elevation; the bold blue B refers to the glacier-wide SMB. Dash lines and numbers refer to the elevation band of the Qiyi glacier.
Atmosphere 14 00723 g014
Table 1. The meteorological stations used in this research.
StationPeriodsLatitude
/°N
Longitude
/°E
Altitude
/m
Summer T/°CWinter
T/°C
Summer
P/mm
Winter
P/mm
Tuole1957–201338.4898.2538208.34−8.061.740.15
Yeniugou1960–201338.2599.3544297.38−8.032.520.24
Qilian1957–201338.11100.15359711.11−3.932.580.26
Wuwei1953–201337.55102.40377220.672.170.700.10
Table 2. List of the global climate models in CMIP5 used in this research.
No.AbbreviationModel NameOrganizationResolution
(Lon. × Lat., No. Levels)
Nationality
1AC1ACCESS1-0CSIRO and BoM192 × 145, L38Australia
2AC2ACCESS1-3CSIRO and BoM192 × 145, L38Australia
3BC1BCC-CSM1-1BCC128 × 64, L26 (T42)China
4BC2BCC-CSM1-1-mBCC128 × 64, L26 (T42)China
5BNUBNU-ESMGCESS128 × 64, L26 (T42)China
6CaECanESM2CCCMA128 × 64, L35 (T63)Canada
7CCSCCSM4NCAR288 × 192, L26USA
8CE1CESM1-BGCNSF-DOE-NCAR288 × 192, L26USA
9CE2CESM1-CAM5NSF-DOE-NCAR288 × 192, L26USA
10CE5CESM1-WACCMNSF-DOE-NCAR288 × 192, L26USA
11CM2CMCC-CMCMCC480 × 240, L31 (T159)Europe
12CM3CMCC-CMSCMCC480 × 240, L31 (T159)Europe
13ECEEC-EARTHEC-EARTH320 × 160, L62
(T159)
Europe
14FIOFIO-ESMFIO128 × 64,China
15GE1GISS-E2-HNASA GISS144 × 90,USA
16GE2GISS-E2-H-CCNASA GISS144 × 90,USA
17GE3GISS-E2-RNASA GISS144 × 90,USA
18GF2GFDL-CM3NOAA GFDL144 × 90, L24USA
19GF3GFDL-ESM2GNOAA GFDL144 × 90, L24USA
20GF4GFDL-ESM2MNOAA GFDL144 × 90, L24USA
21Ha5HadGEM2-AONIMR/KMA192 × 145,Korea
22INCINM-CM4INM180 × 120, L21Russia
23IP2IPSL-CM5A-MRIPSL144 × 143, L39France
24IP3IPSL-CM5B-LRIPSL96 × 96, L39France
25MI2MIROC5MIROC256 × 128, L40 (T85)Japan
26MI3MIROC-ESMMIROC128 × 64, L80 (T42)Japan
27MI4MIROC-ESM-CHEMMIROC128 × 64, L80 (T42)Japan
28MP1MPI-ESM-LRMPI-M192 × 96, L47 (T63)Germany
29MR3MRI-CGCM3MRI320 × 160, L48 (T159)Japan
30NE1NorESM1-MNCC144 × 96, L26Norway
31NE2NorESM1-MENCC144 × 96, L26Norway
Table 3. The parameters of volume-area scaling law applied in recent studies.
ReferencesVolume-Area Scaling LawsComments
Radić and Hock [48]V = 0.0365A1.375Based on earlier studies
Grinsted et al. [49]V = 0.0433A1.290Obtained from minimizing the absolute volume deviation from glacier inventory
Huss et al. [28]V = 0.0259A1.275Relationship for Central Asia
Liu et al. [4]V = 0.0395A1.350From the observation of Qilian and Tien Shan
Table 4. The lapse rate of temperature (λT, °C/100 m) and precipitation (λP, mm/d 100 m) of different months at the Qiyi glacier.
ParametersJanuaryFebruaryMarchAprilMayJuneJulyAugustSeptemberOctoberNovemberDecember
Temperature0.530.550.520.670.710.580.630.620.610.490.510.46
Precipitation0.390.490.290.430.400.240.230.160.211.250.931.89
Table 5. The model parameters optimized for all mass-balance series measured in the Qiyi glacier.
ParametersValuesUnits
Melt factor, fm2mm day−1 °C−1
Radiation coefficient for snow, αsnow6mm day−1W−1m2 °C−1
Radiation coefficient for ice, αice1.5mm day−1W−1m2 °C−1
Precipitation correction factor, S25%
Disclaimer/Publisher’s Note: The statements, opinions and data contained in all publications are solely those of the individual author(s) and contributor(s) and not of MDPI and/or the editor(s). MDPI and/or the editor(s) disclaim responsibility for any injury to people or property resulting from any ideas, methods, instructions or products referred to in the content.