Article

The Effect of Fly Ash Microspheres on the Pore Structure of Concrete

by
Elzbieta Haustein
and
Aleksandra Kuryłowicz-Cudowska
*
Department of Mechanics of Materials and Structures, Faculty of Civil and Environmental Engineering, Gdansk University of Technology, Narutowicza 11/12, 80-233 Gdansk, Poland
*
Author to whom correspondence should be addressed.
Minerals 2020, 10(1), 58; https://doi.org/10.3390/min10010058
Submission received: 10 December 2019 / Revised: 6 January 2020 / Accepted: 7 January 2020 / Published: 9 January 2020

Abstract

:
The fly ash microspheres (FAMs) formed during the mineral transformation stage in coal combustion are hollow spherical particles with a density less than water. This paper presents the results of X-ray micro-computed tomography and an automatic image analysis system of the porosity in the structure of hardened concrete with microspheres. Concrete mixtures with ordinary Portland cement and two substitution rates of cement by microspheres—5% and 10%—are investigated. For all considered mixes, a constant water/binder ratio (w/b) equal to 0.50 was used. The distribution of the air voids and the compressive strength of the concrete were tested after 28 days. With the increasing mass of cement replacement by FAMs, the compressive strength decreases after 28 days. The total volume of the air voids in hardened concrete with fly ash microspheres tested by X-ray varies from 5.1% to 7.4%. The closed pores constitute more than 80% of the total content of air pores. The study proves that the use of microspheres grains with specific dimensions has a significant impact on concrete porosity. Their application in concrete technology can be an alternative aeration solution for fresh concrete mixes and an effective method for utilization.

1. Introduction

A number of studies have proven that it is difficult to preserve appropriate frost resistance of concrete and reinforced concrete structures [1,2]. To ensure frost resistance of concrete in exposure classes XF2–XF4, the European standard EN 206–1 [3] requires an air content in fresh mixture of at least 4% without verification of the pore structure in the hardened concrete [4]. Dosing a larger amount of air usually increases the concrete porosity and reduces its strength. A clear improvement in frost resistance is obtained by reducing the water/cement ratio (w/c) with an appropriate aeration of concrete mixture.
The frost resistance of concrete depends on the content and structure of air voids. The achieved resistance is the result of a specific balance between capillary pores filled with water, capable of freezing, and pores, which are not fully filled with water. There is an opinion that during water freezing in concrete structures, the ice pressure in pores is transferred to the inside of pores, including air.
Coal-fired thermal power plants (TPPs) produce large amounts of combustion waste, such as fly ashes, slags, or their mixtures. The study of the frost resistance of concrete with mineral additives is therefore very meaningful. An alternative method of concrete mixtures aeration may be fly ash microspheres (FAMs)—the waste fractions of coal combustion. In the present work, one type of fly ash microsphere was studied: hollow aluminosilicate microspheres (cenospheres). The main technique of recovering microspheres is a wet method. The microspheres float due to their low density and hollow nature. They are collected on the surface of settling ponds, either by suction or mechanically, and then dried. Microspheres are often called network-structured cenospheres or plerospheres, from the Greek plërës (filled) plus “sphere”. Their content in fly ash coming from the combustion of different types of coals ranges from 0.1 to 3.8 wt %; in most cases, it is equal to 0.3–1.5 wt % [5,6].
The formation of the microspheres occurs because of thermochemical and phase transformations of the mineral forms in the coal combustion process. Their hollow spherical shape is an effect of cooling and solidifying of ash particles around trapped gases, which are generally CO2 and N2, and traces of CO, O2, and H2O. The major minerals and phases in microspheres are alumino-silicate glass, mullite, quartz, calcite, iron oxides and calcium silicates, and sulfates [7,8,9].
The fly ash (FA) microspheres have small open porosity and a small surface area (<500 cm2/g). Their average thickness usually varies from 2 to 30 µm and is from 5% to 10% of their diameter. The grain size of the microspheres generally ranges from 20 to 300 µm. Their chemical composition is similar to the composition of the fly ash [10,11]. The microspheres are different from other types of the combustion waste: low density (0.2–0.8 g/cm3), high mechanical strength (210–350 kg/cm2), low thermal conductivity (0.1–0.2 W/m∙K), and high thermal stability (sintering usually occurs at 1000–1450 °C) [5,8].
The unique properties of the microspheres make them useful for a variety of fields of applications. Liu et al. [12] investigated the morphology, chemical, and mineral composition of the microspheres in fly ash from the Luohuang coal-fired power plant, Chongqing, southwestern China. The scientists proved that it is good way to effectively raise the utilization rate of fly ash. The microspheres can be used to produce various lightweight construction products, including lightweight cements, aggregates in lightweight concrete [13,14,15], and porous glass crystalline molded blocks for the removal and solidification of liquid and other hazardous wastes. In addition, they have been studied for the production of ceramic composite foams with different properties. The fly ash microspheres are currently used as lightweight filler, which improves the thermal insulation properties of mortars and concretes based on mineral binders [10,11,16,17].
The aim of this study was to determine the effect of fly ash microspheres (FAMs) on the structure of air voids in hardened concrete. Currently, computational software gives us the possibility of solving material and engineering problems in detail [18,19]. The X-ray microtomography used in this paper allowed us to get qualitative visualization of the pore appearance, shape, and spatial position. Based on this information, the pore volume, porosity, and pore distribution could be statistically quantified. Additionally, in order to compare the total volume of air voids the tests using automatic image analysis system, Rapid Air 457 were performed.

2. Research Significance

X-ray computed tomography is a well-known technique to measure porosity in materials like concrete, although this usually requires time-consuming scans and complex analysis procedures [20]. Due to its unique capacity to measure the three-dimensional (3D) structure in a non-destructive manner, micro X-ray computed tomography (µCT) has been widely adopted for the microstructural characterization of materials.
The use of computed tomography (X-ray) allows for the determination of the total (absolute) porosity, which expresses the ratio of the total volume of voids (pores) to the volume of the tested sample. All air pores (open and closed) can be identified in the structure of hardened mortar or concrete. Empty spaces are usually filled with water or air. The knowledge of the percentage of pore size provides the opportunity to calculate the quantitative/volume share of individual pore fractions in the structure of cementitious materials. The content of open pores—i.e., those to which water can penetrate—is important for determination of the freeze-thawing of concrete.

3. Materials and Methods

The following materials were used to prepare the concrete mixture: Portland cement CEM I 42.5 R, according to European Standard EN 197–1 [21], with aggregate fractions of 2–8 and 8–16 mm; natural sand, with the maximum grain size to 2 mm; and tap water. In the present work, three concrete mixtures were made with a constant water/binder (w/b) ratio, namely 0.5. The FA microspheres in the amounts of 5% and 10% by weight of cement in the concrete were examined. The composition of concrete mixtures is shown in Table 1. Following the European Standard for Concrete (EN 206–1 [3]), the consistency (concrete slump) for fresh concrete mixtures without and with 5% and 10% FAMs was specified from the S2 to S1 class, respectively.
The study involved microspheres, light fractions of siliceous fly ash coming from a power plant located in Poland, where the energy production technology is based on conventional coal combustion. The microspheres were obtained from ash pools, where the waste had been hydraulically disposed (Figure 1). Before testing, the microspheres were dried at a temperature of 20 ± 5 °C (68 ± 9 °F).
Using three concrete mixtures, 100 mm cubic samples were prepared. The distribution of air voids and the compressive strength of cubic specimens were analysed after 28 curing days. The compressive strength of concrete was determined according to EN 12390–3 [22].
The first part of the research involved the chemical composition and morphology of the microspheres. The morphology of samples was observed by a scanning electron microscope (SEM; type JEOL JSM 7800 F, Akishima, Tokyo, Japan) equipped with an energy dispersive X-ray spectrometer (EDAX, Octane Elite, Mahwah, NJ, USA), which allows for the identification of the elemental composition of the tested material. SEM and EDS tests were performed for two samples of microspheres. The loss on ignition (LOI) was identified in accordance with EN 196–2 [23].
The particle size distribution of the microspheres was analysed by a laser particle analyser (Helios/R, Sympatec GMbH, Clausthal-Zellerfeld, Germany). Laser diffraction is a standardized method, according to the International Standard ISO 13320 [24], and it is used for the determination of particle size distribution. The analyser applies to rapid and automatic particle size analysis of solids by dry method. The range of operation of the analyser varies from 0.1 to 3500.0 μm.
The structure of air pores in the hardened concrete with the participation of microspheres was determined using computed tomography (X-ray). In the first step, the concrete samples were prepared. The specimens with dimensions of 40 mm (height), 40 mm (width), and 40 mm (depth) were cut out from concrete cubes with dimensions of 100 × 100 × 100 mm (using a diamond saw) in order to obtain three-dimensional (3D) images. With a focus on improving the image quality, as compared to two-dimensional (2D) images, the X-ray source voltage of the micro-CT scanner was set to 130 keV, the current was 61 μA, and the exposure time was equal to 5000 ms. Additionally, despeckling and bitwise operations were carried out. The pixel size was 120.7 μm. The X-ray projections were recorded with a rotation increment of 0.2° within 360° for about 18 h. The scans were averaged based on six scans. The image reconstruction was carried out with the NRECON software (Version, Bruker microCT, Kontich, Belgium). In order to separate different concrete phases, the global thresholding of the grey level was used, based on the differences in the absorption of the X-ray radiation by the phases (e.g., 0–54 for air voids, 54–123 for the cement matrix, and 123–255 for aggregate). The luminance curve, colour transfer function, and cutting/clipping box were manually adjusted to obtain 3D images of good quality. For improving visualisation, light and shadow options were introduced [25].
To compare the pore structures in concrete specimens, the automatic image analysis system was used. This method is used for measuring air void parameters (air content, void frequency, specific surface, and void spacing factor) in hardened concrete by the linear traverse and modified point count microscopical method, described in ASTM C457 [26]. The investigations of the air void structures were performed on concrete samples with the dimensions 100 mm × 100 mm × 25 mm, cut out from 100 mm cubic samples. The parameters defining the structure of the air voids in concrete by the automatic image analysis system Rapid Air 457 were as follows:
  • the total content of air in hardened concrete: A (%);
  • the content of micropores with a diameter below 300 μm (according to the type of pore size recommended by IUPAC [27], these are classified as macropores): A300 (%);
  • the surface area of air voids (indicating the relative number and size of air bubbles for a given volume of air): α (mm−1);
  • the spacing factor (relative distance between the air voids): L ¯ (mm).

4. Results and Discussion

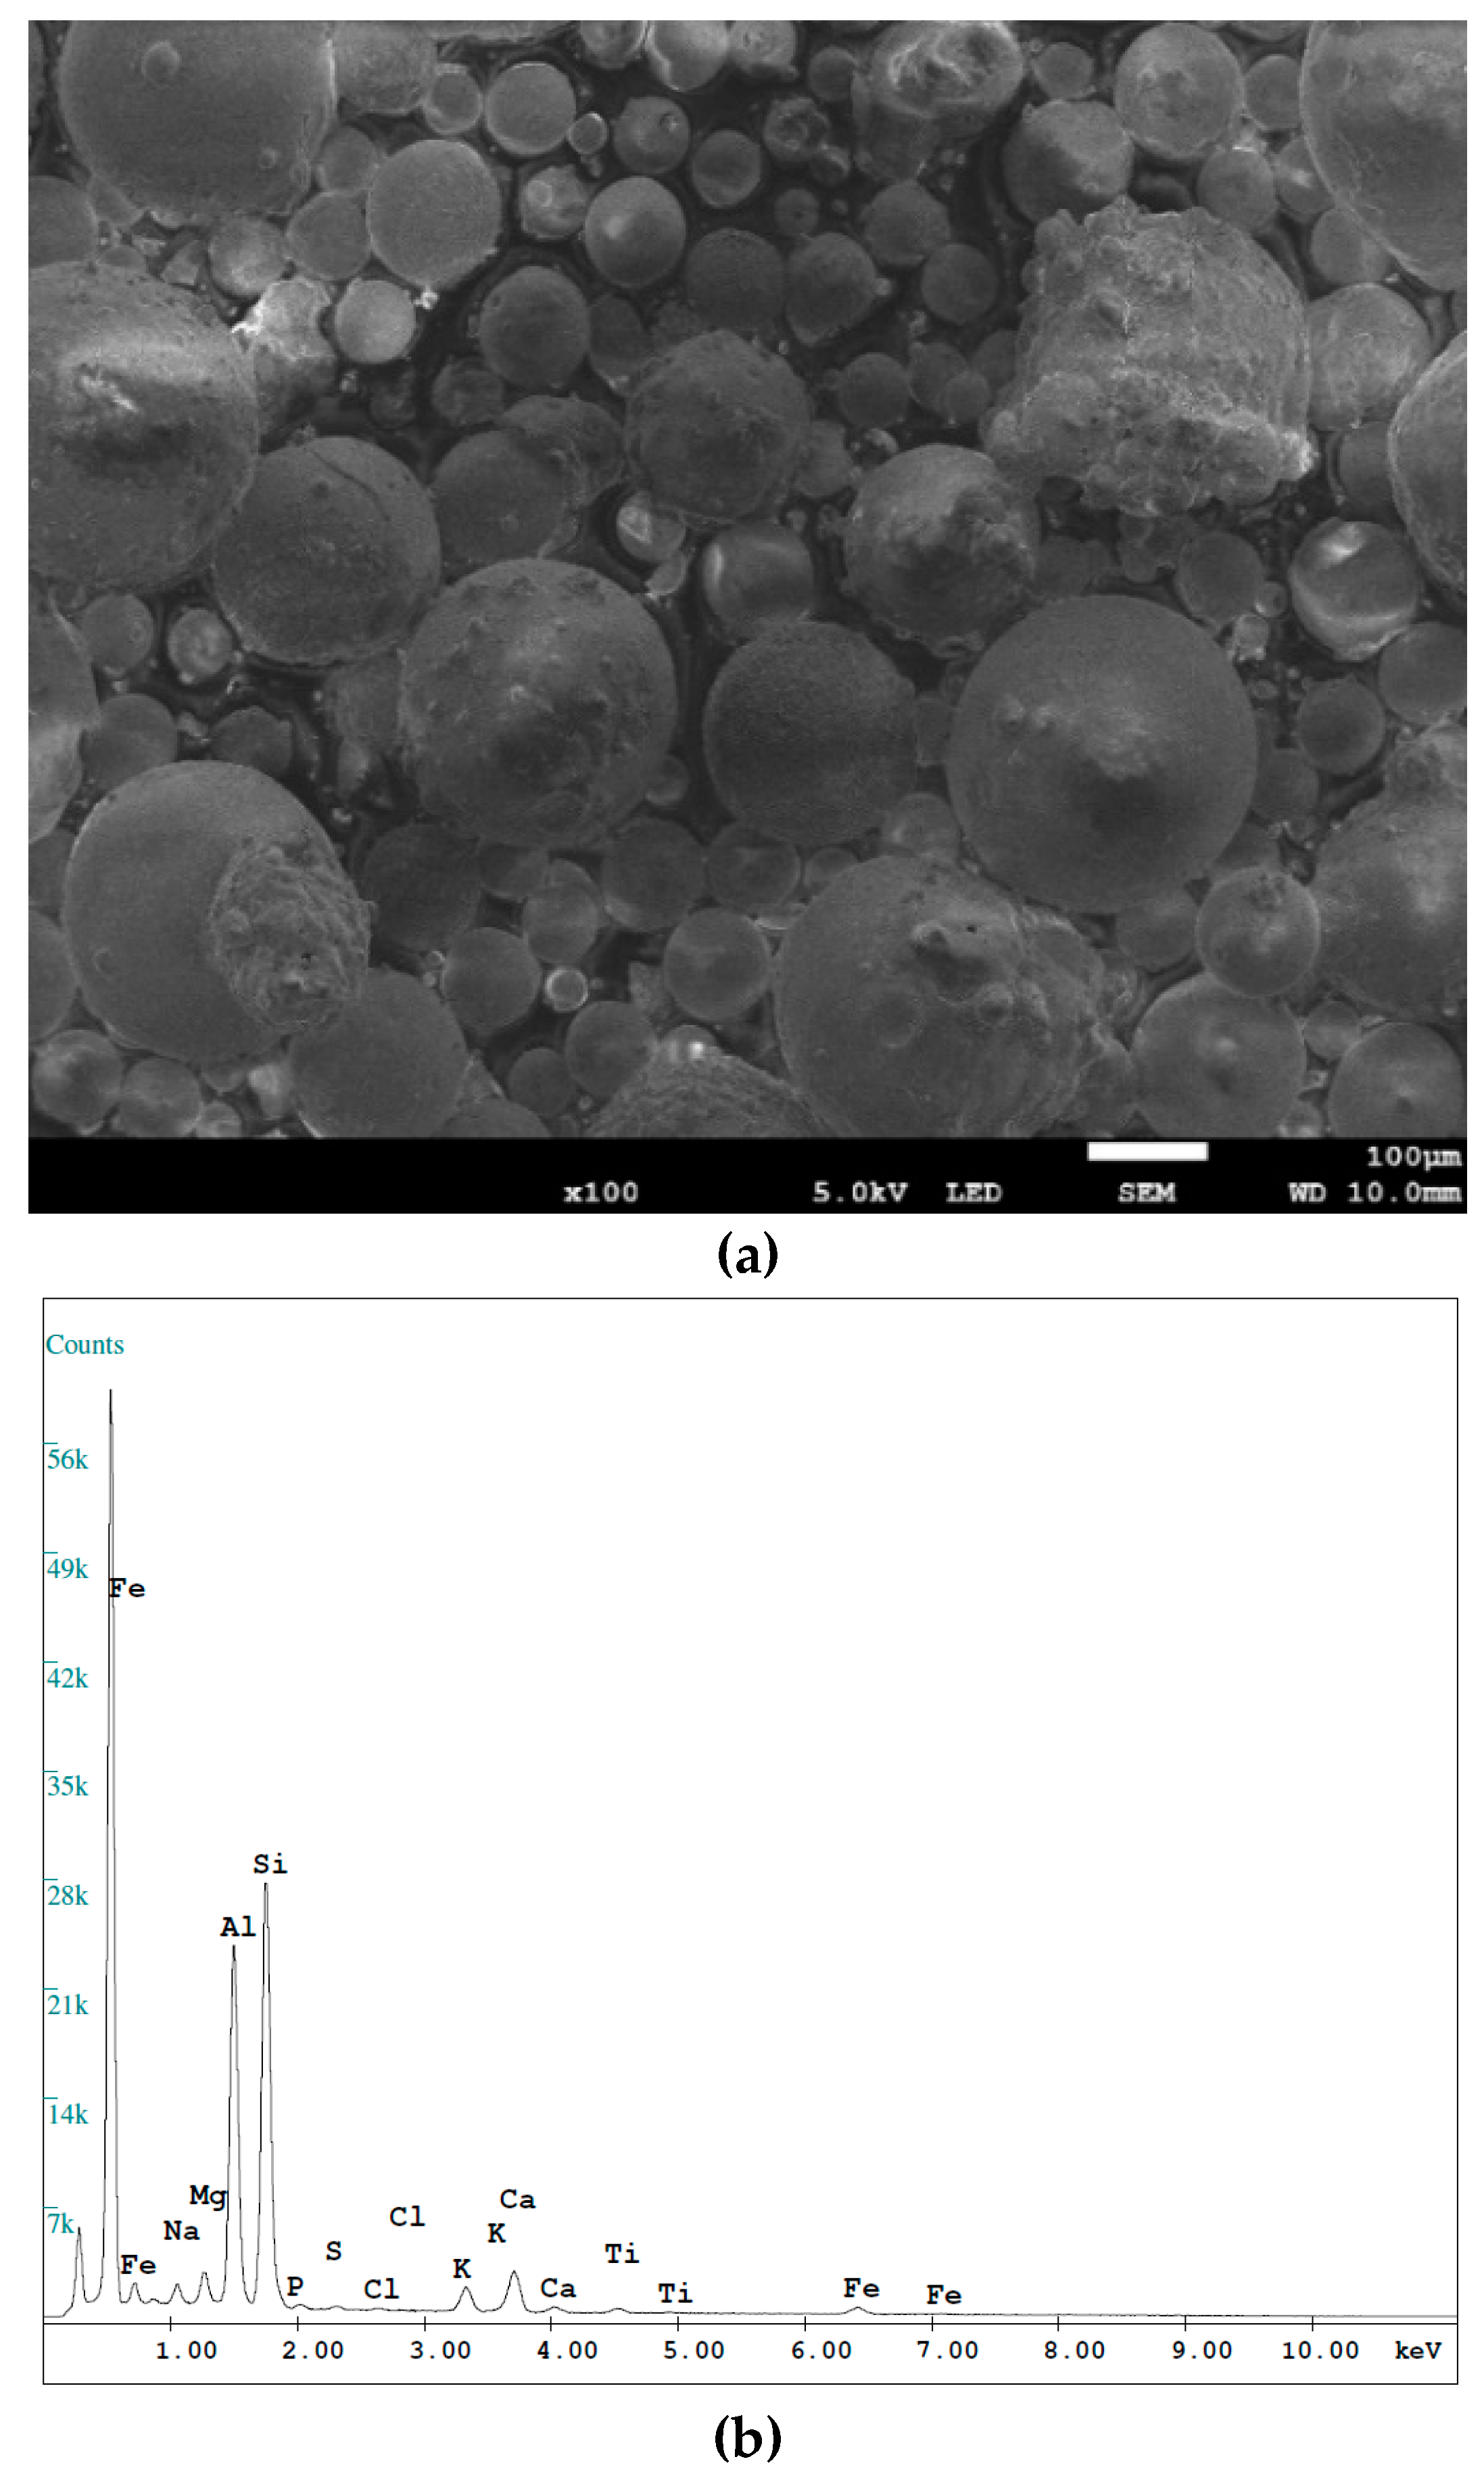
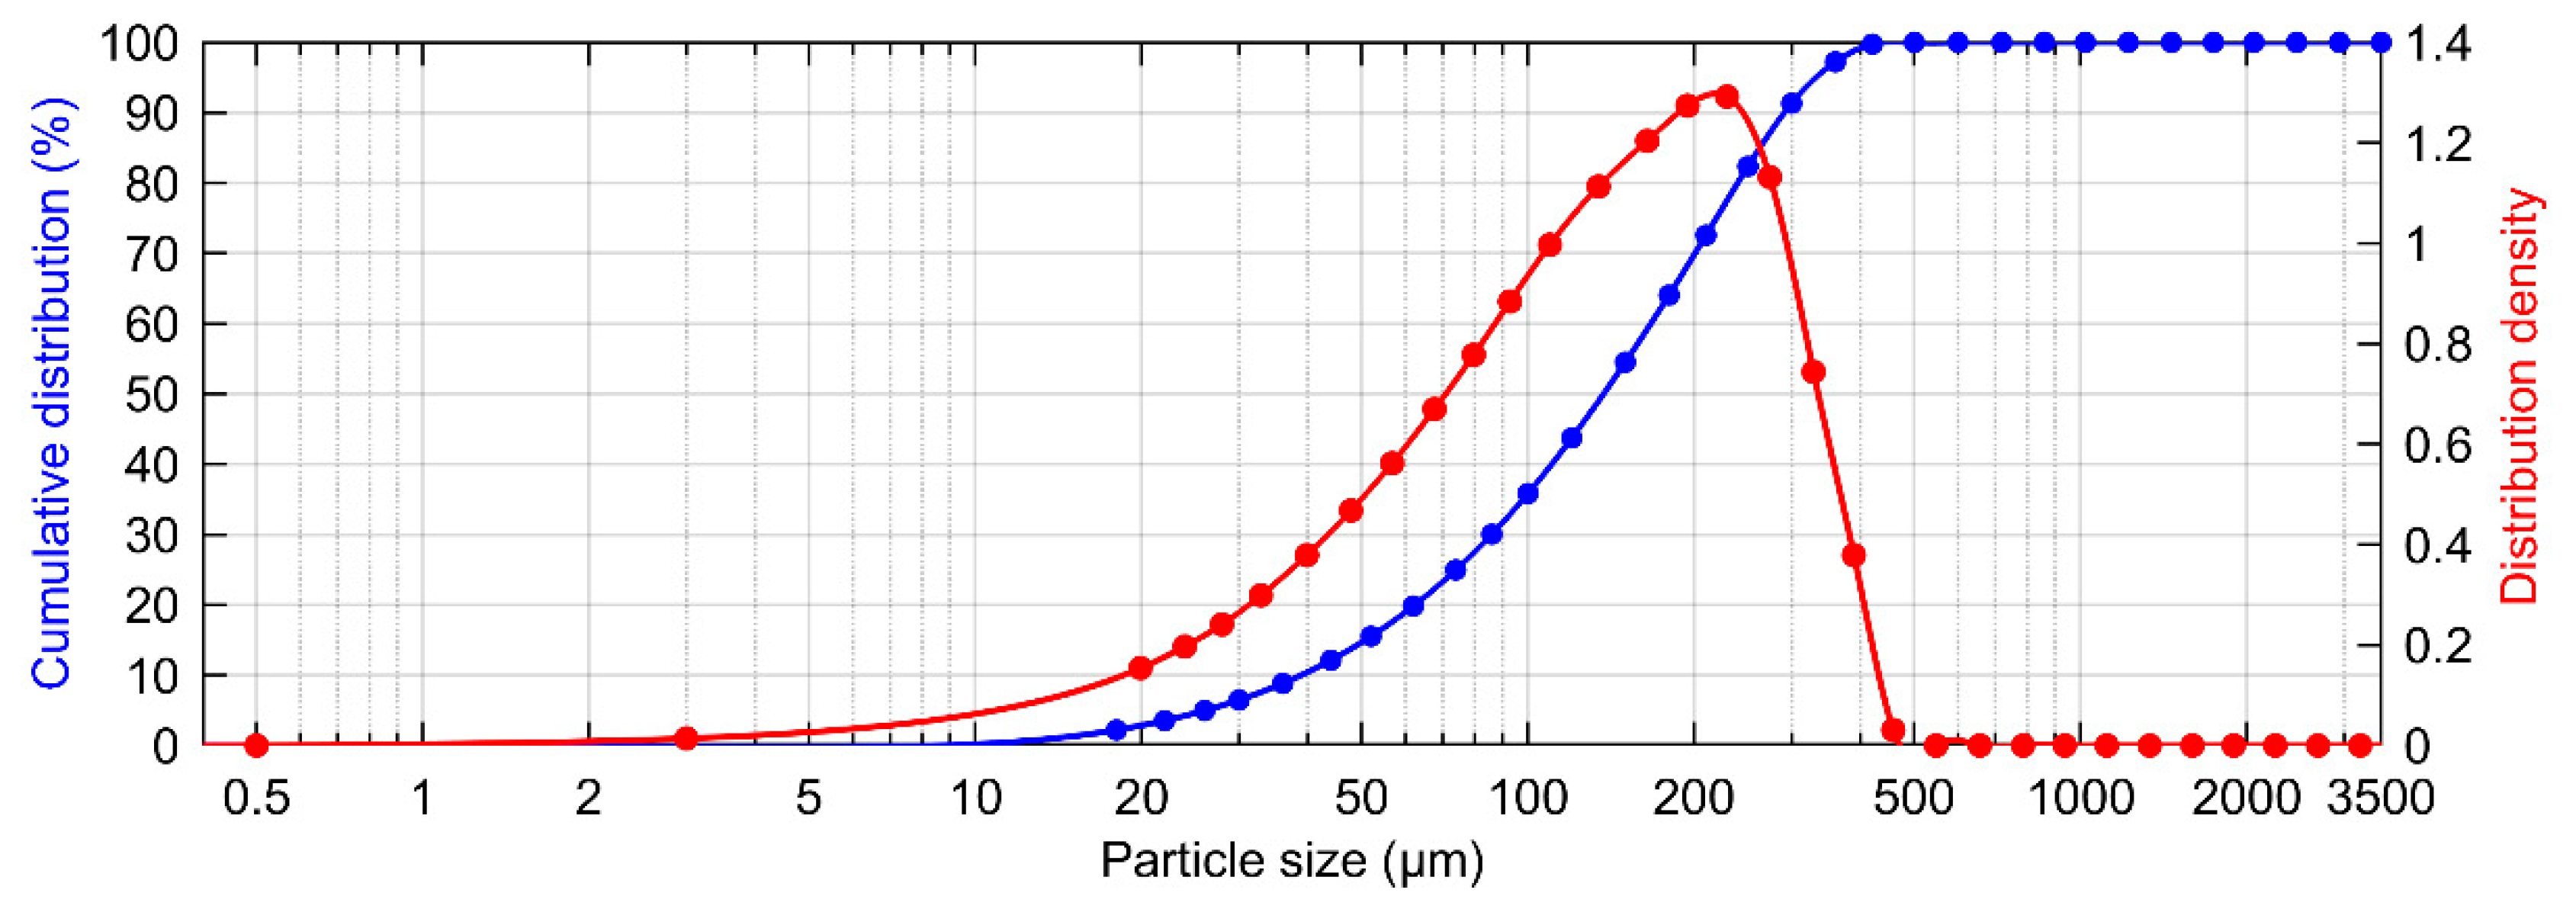
4.1. The Chemical Composition and the Particle Size Distribution of the Fly Ash Microspheres

Figure 2 shows SEM images of the microspheres, clearly highlighting their size and porosity. The visible shape of the microspheres is diverse, from almost perfectly spherical to highly irregular. Their structure is not homogeneous, and is composed of closed and open pores. The outer surface of the microspheres has a spongy or rough form. The microspheres of smaller sizes have a compact smooth wall surface and closed pores. The large microspheres have irregular shapes and a deformed surface structure, with open visible pores [7].
The variety of morphological changes observed in the microspheres is related to the combustion of coal. The wide range of temperatures during its combustion leads to decomposition of the mineral substances contained within.
The results of the analysis of two samples of the FA microspheres (by % weight), their average value of chemical composition, and their loss on ignition (LOI) are presented in Table 2. The results of oxide analysis show that the microspheres were composed of aluminosilicates. This table shows that the major chemical constituents of the microspheres are SiO2 and Al2O3. The content of the main three oxides, such as Si2O3, Al2O3, and Fe2O3, are very important for mineral additives used in cements and concrete. They are in the range of 50.6% to 52.0%, from 29.5% to 30.9%, and from 4.0% to 4.2%, respectively. The average total sum of these three oxides, according to EN 450–1 [28], is nearly equal to 86% of the total content. The microspheres characterize a low content of oxides like CaO, MgO, and K2O (average values equal to 5.3%, 2.2%, and 3.0%, respectively). Oxides of chemical elements like Na, S, P, and Ti are present in trace amounts (below 1.5 by % weight). According to the ASTM C618 standard [29], FA microspheres, due to their chemical composition, meet requirements for fly ash (Class F) used in concrete. The loss on calcination at 950 °C during 1 h in an electric furnace (loss on ignition (LOI) = 0.9%) in the microspheres is low due to the low content of the organic material and calcite in burned coal. According to the classification adopted for fly ash by EN 450–1 [28] and ASTM C 618 [29], microspheres belong to category A (≤5.0% mass) and class F (maximum = 6%).
The cumulative distribution and distribution density with respect to grain size of the microspheres is presented in Figure 3. According to the results of the analysis of granulometric composition (Figure 3), the size of the particle distribution of microspheres changes in the range from 0.5 to 500 μm. The percentage of grains of microspheres with a diameter below 250 µm or a diameter range of 250 to 500 µm are 81.4% and 17.4%, respectively. For grain diameters larger than 500 µm, their content in the whole volume is equal to 0.2%. The particle size of the microspheres for D10, D50, and D90 is equal to 170.6 µm, 270.4 µm, and 430.7 µm, respectively. The value of dv10, dv50 and dv90 represents the size below which 10%, 50%, and 90%, respectively, of sample falls. The average diameter of the microspheres used in the studies was 300.2 µm.

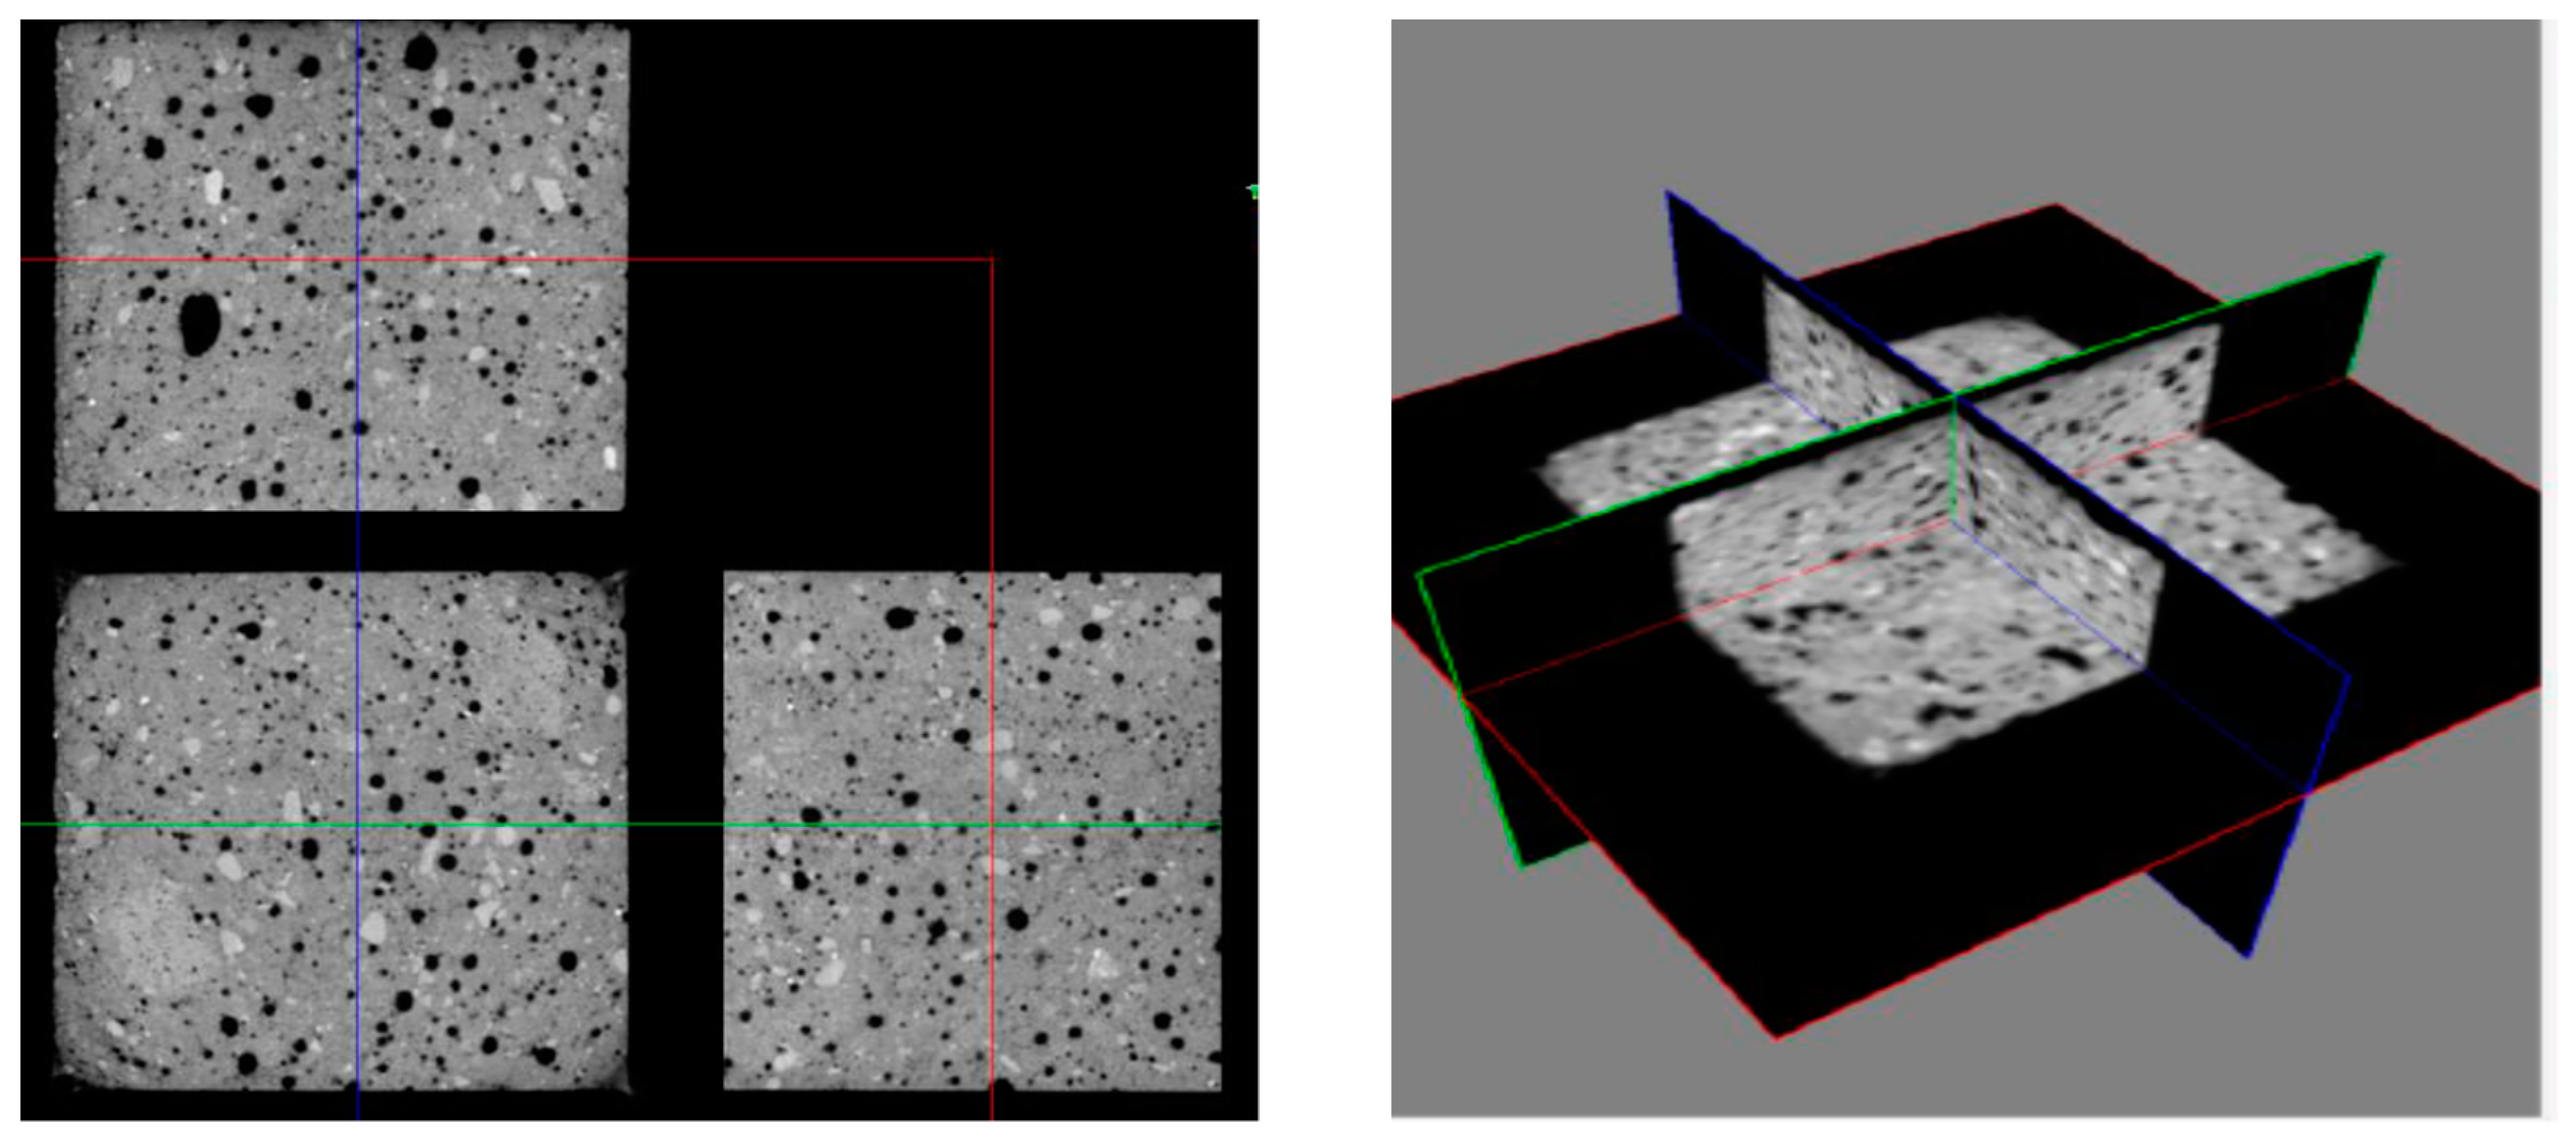
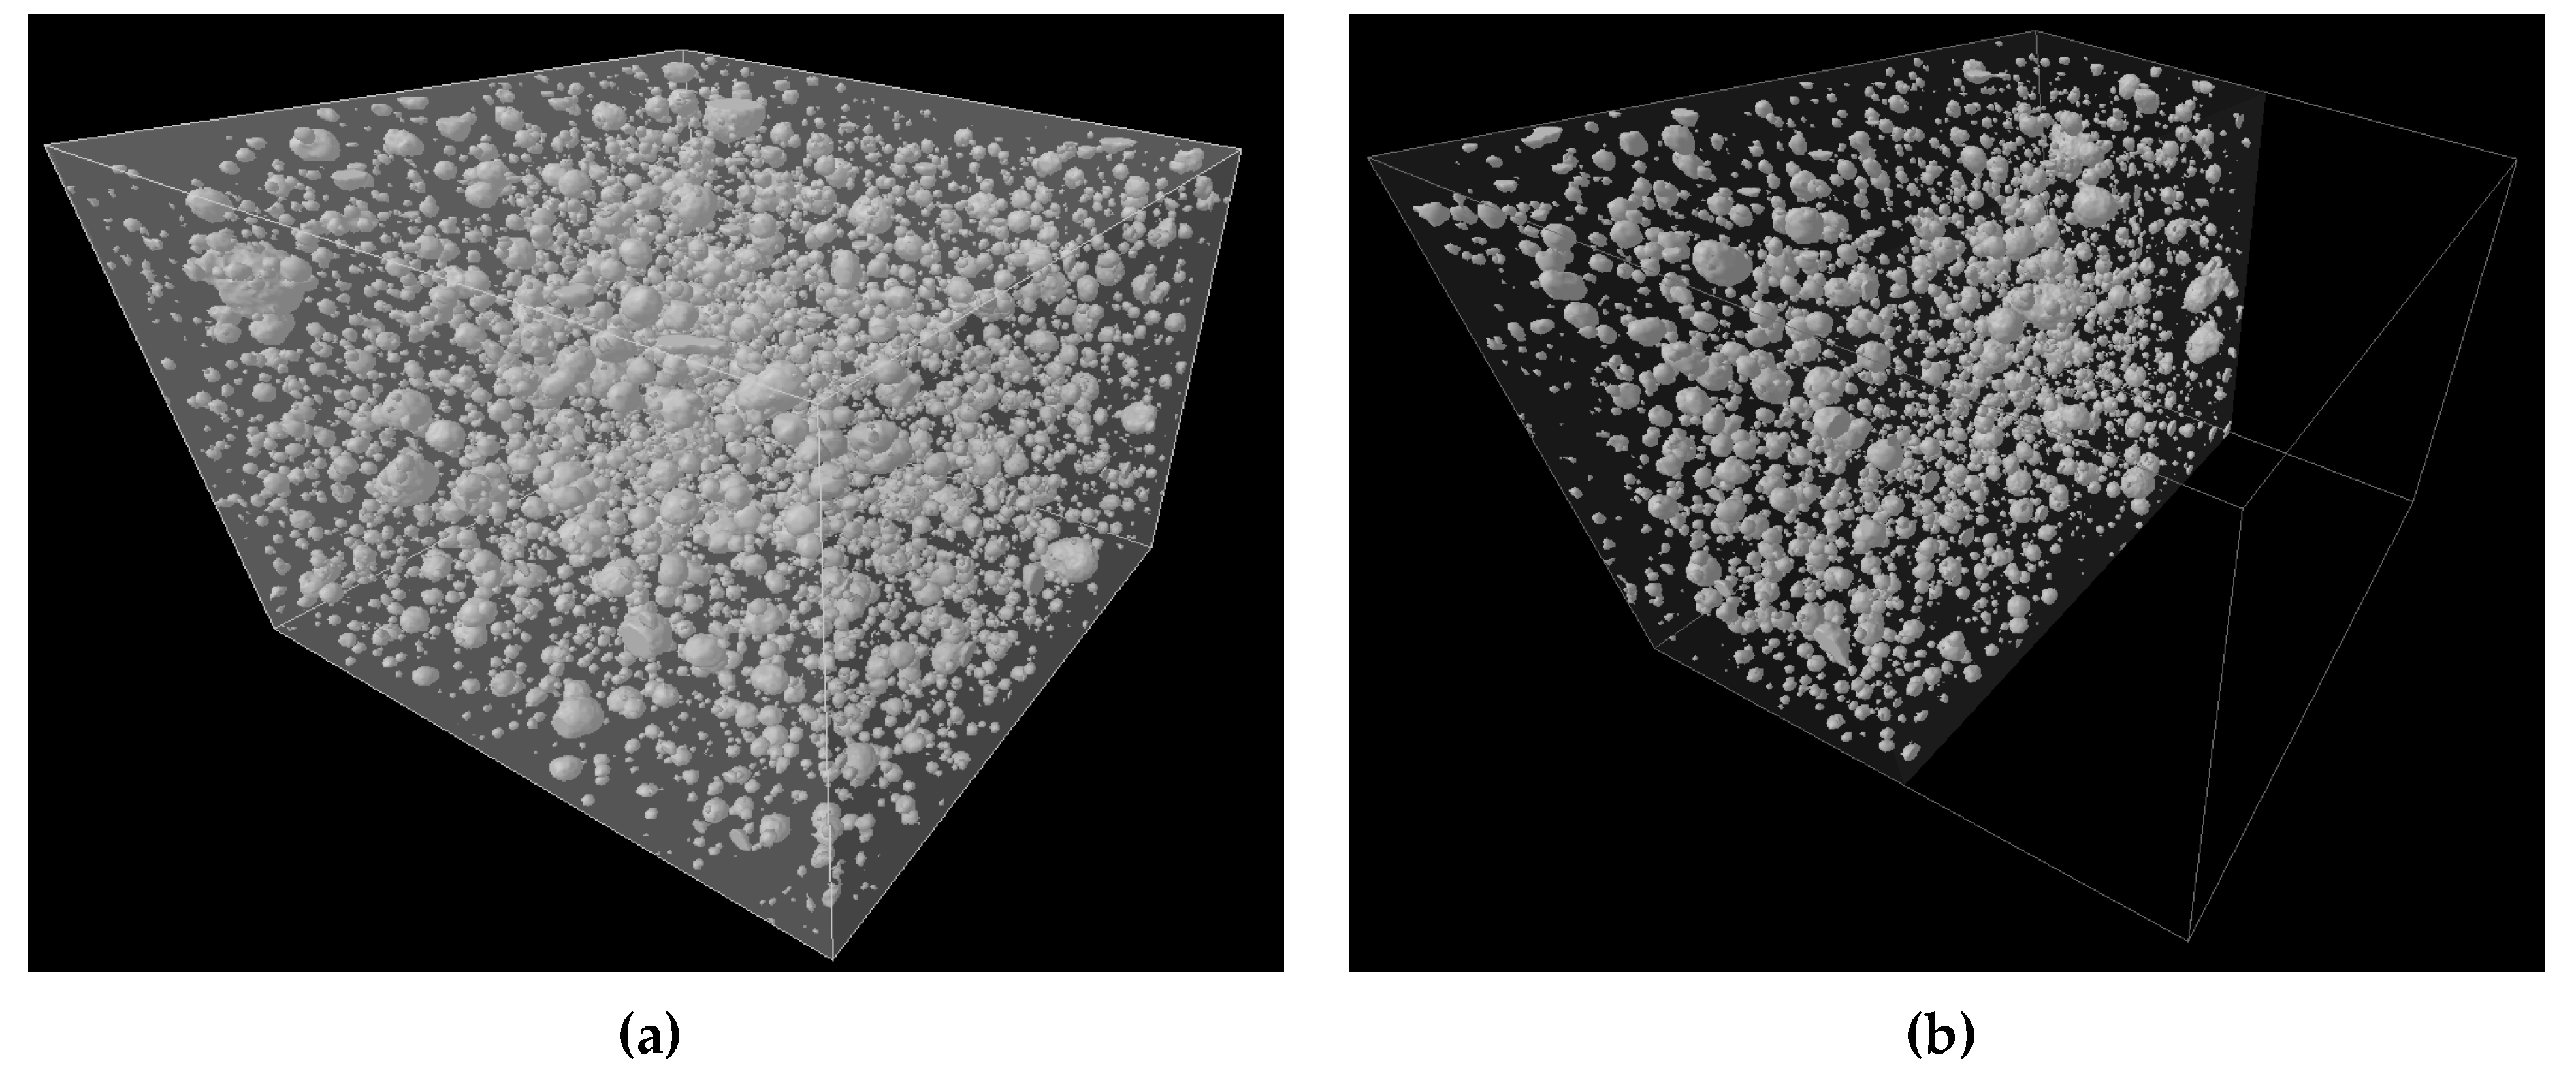
4.2. The Structure of Air Pores in X-ray Technology

The three-dimensional model of a concrete specimen with microspheres is presented in Figure 4. The black shadow represents air voids entrained in concrete samples. The distribution of the grains of microspheres (5% and 10%) in the concrete specimen by the three-dimensional (3D) method is shown in Figure 5 and Figure 6.
The visible gray areas in Figure 5 and Figure 6 are air voids in concrete, and their quantity and area increase with the increasing number of microspheres, which indicates that more air voids were entrained in concrete.
The percentage content of air pores in the concrete samples was investigated after 28 days. Table 3 presents the measured values, taking into account size of air voids. The distribution of open and closed pores in concrete specimens is summarized in Table 4. The μ-CT is an imaging technique that allows for the gathering of three-dimensional data on the internal microstructure of materials (such as pore structure and porosity). The identification of open and closed pores is done automatically by the device.
The studies of the concrete porosity using X-ray technology allowed for determination of the number of pores, their sizes, and their types. Concrete with microspheres has a different distribution of air voids, in various ranges of diameters. The largest percentage increase of the air voids was found in those with diameters below 250 µm (Table 3). For concrete with 5% and 10% microspheres, the number of pores of this size equaled about 4.0% and 5.8%, respectively. This value was 10 and 15 times larger than the content of air voids in the concrete without microspheres (Table 3). In the case of 5% microspheres in concrete, the air content was as follows: 0.582% (pore size 250–500 μm) and 0.502% (pore size above 500 μm). For concrete with 10% microspheres in the binder, the content of air voids of size between 250–500 μm was equal to 0.884%. This value was two times higher compared to the concrete without FAMs. The same relationship was noticed for diameters above 500 μm.
The air voids can either be “closed” and inaccessible, or “open” and connected to other voids present in the structure of hardened concrete. The open pores directly affect the material permeability, while the mechanical properties of concrete are influenced by both the open and closed pores. For all considered samples, a significant increase of closed pores was observed with increasing the numbers of microspheres in the concrete, regardless of the pore diameter. The closed pore content in concrete made with 5% and 10% microspheres was equal to 4.534% and 6.277%, respectively. The results presented in Table 4 show that their content was about 88.3% (for 5% microspheres) and 84.8% (for 10% microspheres) of the total air void content in hardened concrete. For the open pores in concrete, their content is lower, and is respectively about 0.6% and 1.1%.

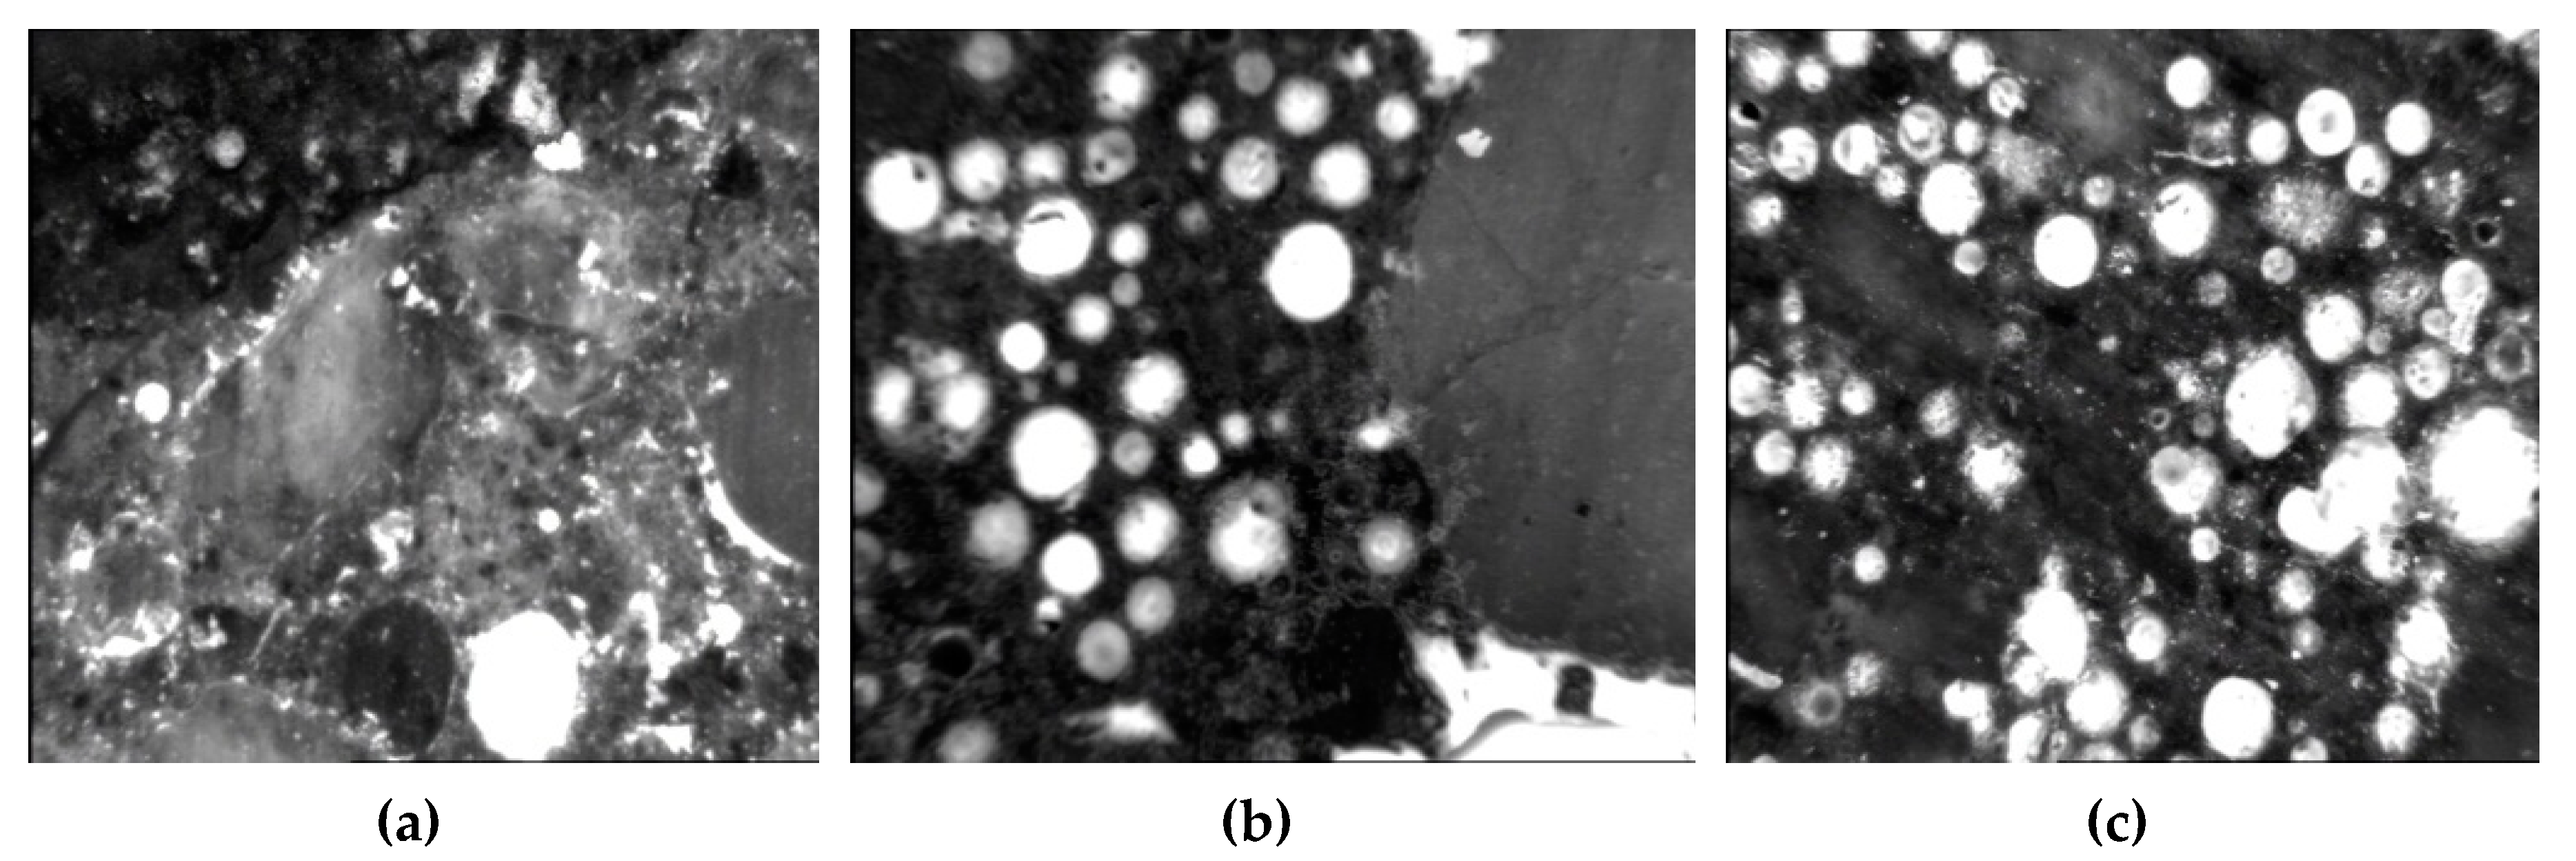
4.3. The Structure of Air Pores in Concrete Using the Automatic Image Analysis System

The images coming from the automatic analysis system (Rapid Air 457) show some examples of air void distribution in the concrete specimens, with ordinary Portland cement and two substitution rates of cement with microspheres at 5% and 10% (Figure 7).
The presence of microspheres in concrete causes the growth of the total content of the air (A). The observed cross-sections of the concrete structure are consistent with those adopted in the Powers model, which features spherical air voids [30]. The considered specimens feature the uniform distribution of voids, without segregation and clustering or other microstructure defects (Figure 7). The properties of the air structure in hardened concrete after 28 days are summarized in Table 5.
Powers [30] defined an air void spacing factor ( L ¯ ) as the distance between the air voids, while the specific surface (α) is defined as the ratio of the average void surface area to the average void volume. According to ASTM C457 [26], a spacing factor should be less than 0.2 mm (0.008 in), and a specific surface should be greater than 24 mm2/mm3 (600 in2/in3). It is considered that to obtain these values are necessary to maintain the freeze–thaw durability of concrete. Obtaining a larger specific surface is better, because it indicates a larger number of small bubbles in the microstructure of hardened concrete.
The total content of the air (A) in concrete without microspheres was equal to 1.5%. When 5% and 10% of the mass of the cement was replaced by microspheres, the air content values of 5.8% and 7.9% were obtained. The content of micropores (A300) varied from 0.64% for ordinary concrete to 4.5% for concrete with 10% microspheres. Based on Table 5, the increase of A300 micropores and the total air content A causes the spacing factor L ¯ to be reduced.
The spacing factor ( L ¯ ) was in the range of 0.39 to 0.09 mm. The ratio of micropores (A300) to the total air content (A) was within the range from 0.25 to 0.57 (Table 5). The highest content of the total air (A) in concrete, including the specific surface area of air voids (α) at the lowest spacing factor ( L ¯ ), was obtained in the presence of 10% microspheres in the binder. The specific surface area of air voids (α) varied in the range of 22.7 mm−1 for 0% microspheres in concrete to 38.6 mm−1 for 10% microspheres in concrete.
For concrete with 5% and 10% microspheres, the total air content provides the frost resistance, but for concrete with 5% microspheres the content of micropores (<300 µm) is slightly below of the acceptable limit (1.5–1.8%). The number of microspheres used in this study ensures an appropriate spacing factor acceptable by ASTM C457 [26,31] (≤0.20 mm).
In comparison to concrete without microspheres, their presence significantly reduces the spacing factor ( L ¯ ). Such close pore distribution reduces the distance of air flow and limits the possibility of high hydraulic pressure, in the case of frost impact on concrete structures.

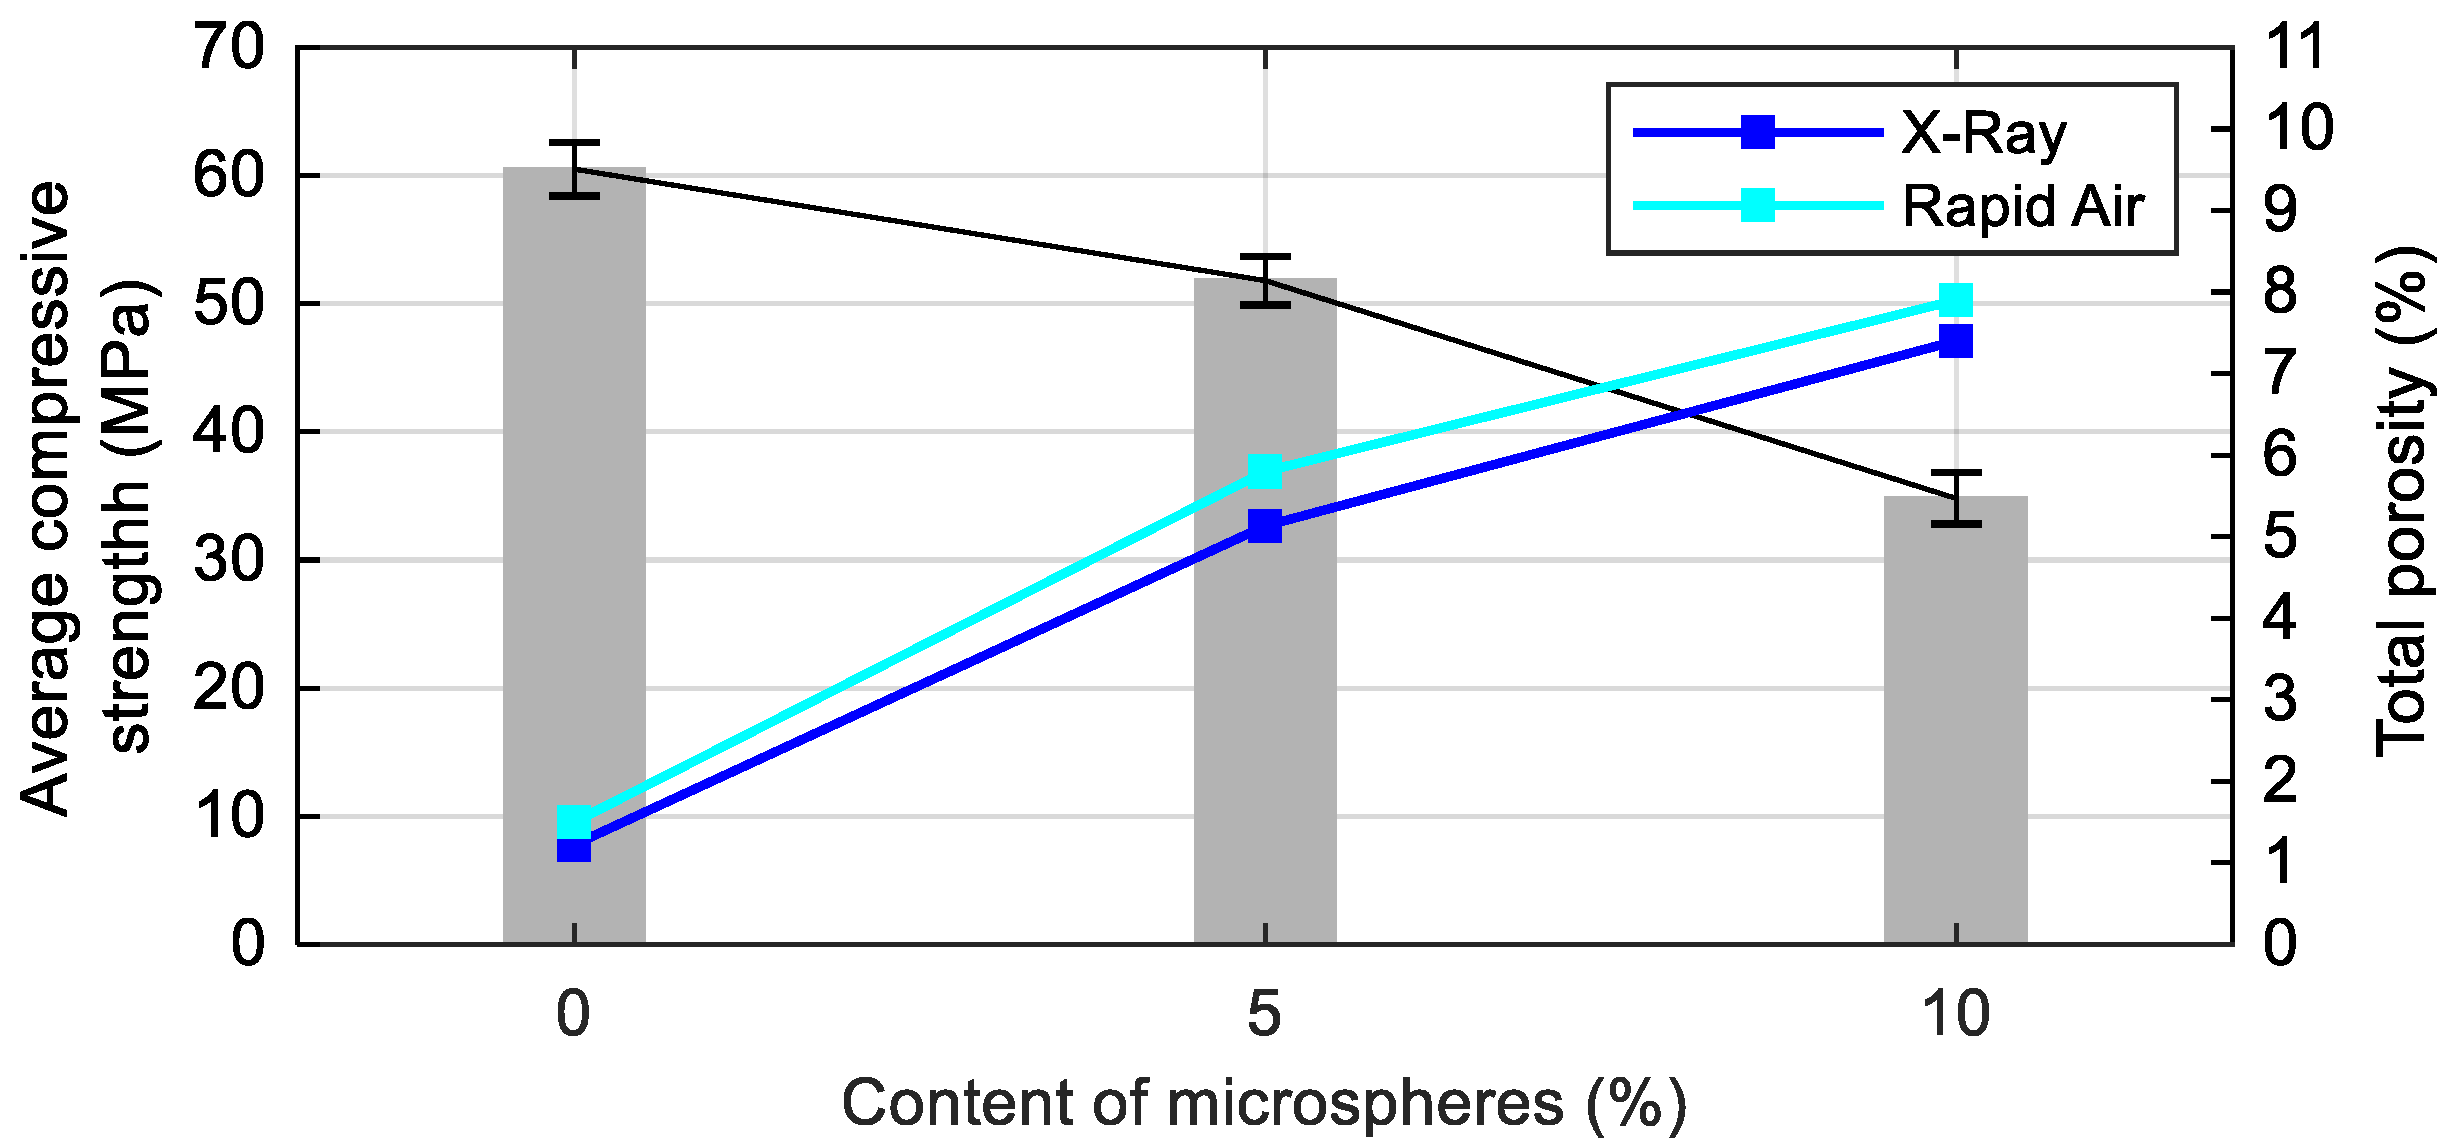
4.4. Compressive Strength versus Total Air Pores

The average compressive strength was calculated for three 100 mm cubes, according to EN 12390–3 [22]. The tests were performed after 28 days, using a compressive machine with 3000 kN capacity and a rate of pressure of 0.3 MPa/s. The value of the compressive strength of ordinary concrete was equal to 60.5 MPa. When 5% and 10% mass of the cement was replaced by microspheres, the value of strength decreased to 51.8 and 34.8 MPa, respectively (Figure 8). Thus, the strength was 14.4% and 42.5% lower, respectively, than that of the concrete without microspheres. The standard deviation of compressive strength varies from 1.9 and 2.1 MPa. The obtained results allowed for the classification of concrete in a range from C20/25 to C35/45 class (EN 206–1) [1].
Figure 8 presents a comparison between the total porosity of the considered concrete samples for the two mentioned methods (X-ray and Rapid Air). The results achieved from the automatic image analysis system are higher, especially for the concrete with microspheres. The studies proved that the increase of microspheres in concrete significantly reduced its compressive strength.

5. Conclusions

The observation of the number of small air voids is very important for evaluating the frost resistance of concrete. The conducted research program of the hardened concrete enhanced with microspheres allows for the formulation of the following conclusions:
  • The 3D, X-ray micro-computed tomography is a non-destructive technique that allows for the determination the type of air void distribution present in the structure of hardened concrete. This method is very useful for testing building materials.
  • The performed tests demonstrate the ability and applicability of novel image analysis methods for rapid-air void measurements of hardened concrete, with good reproducibility.
  • The potential use of hollow fly ash microspheres (FAMs) as an aeration additive in building materials is one of the ways for utilizing and reducing the degree of waste accumulation in the natural environment.
  • The total air content in concrete increases when increasing the cement replacement by microspheres.
  • The total porosity of hardened concrete with 5% and 10% microspheres after 28 days was in the range of 5.1% to 7.4% for X-ray computed tomography, and 5.8% to 7.9% for the automatic image analysis system (Rapid Air 457). In turn, the total porosity in the concrete samples without microspheres was only 1.22% (X-ray) and 1.5% (Rapid Air), and it was lower by about 83.5% and 81.0% in relation to concrete samples containing 10% microspheres in the binder.
  • The X-ray computed tomography, compared to automatic image analysis system Rapid Air 457, allows for the observation of the distribution of air pores in the three-dimensional space. An important parameter for the frost–thaw resistance of concrete is the possibility of determining the proportion of open and closed air pores in the entire cross-section of the sample.
  • A larger content of closed pores compared to open pores is associated with the percentage content of microspheres in concrete. Due to their nature (their interior is filled with gases), the presence of closed pores causes an increase in the content of air voids in hardened concrete.
  • The substitution of ordinary Portland cement by microspheres (5% and 10%) significantly reduced the compressive strength of concrete.
  • In the future, the proper composition of microspheres may be an additional possibility for concrete aeration without the deterioration of its mechanical properties, in order to improve frost resistance.
Due to the fact that concrete with different mineral additions is increasingly used, it is necessary to conduct expanded research works focused on the application of microspheres as a factor dedicated to the aeration of concrete mixtures.

Author Contributions

Conceptualization, E.H. and A.K.-C.; methodology, E.H.; software, E.H.; formal analysis, E.H. and A.K.-C.; investigation, E.H.; data analysis, E.H. and A.K.-C.; writing—original draft preparation, E.H.; writing—review and editing, A.K.-C.; project administration, A.K.-C. All authors have read and agreed to the published version of the manuscript.

Funding

This research received no external funding.

Conflicts of Interest

The authors declare no conflict of interest.

References

  1. Trofimov, B.Y.; Kramar, L.Y.; Schuldyakov, K.V. On deterioration mechanism of concrete exposed to freeze-thaw cycles. IOP Conf. Ser. Mater. Sci. Eng. 2017, 262, 1–7. [Google Scholar] [CrossRef] [Green Version]
  2. Pogorelov, S.N.; Semenyak, G.S. Frost resistance of the steel fiber reinforced concrete containing active mineral additives. Procedia Eng. 2016, 150, 1491–1495. [Google Scholar] [CrossRef] [Green Version]
  3. EN 206–1. Concrete Part. 1: Specification, Performance, Production and Conformity; European Standards; European Committee for Standardization: Brussels, Belgium, 2003. [Google Scholar]
  4. Nowak-Michta, A. Influence of superplasticizer on porosity structures in hardened concretes. Procedia Eng. 2015, 108, 262–269. [Google Scholar] [CrossRef] [Green Version]
  5. Fenelonov, V.B.; Mel’gunov, M.S.; Parmon, V.N. The properties of cenospheres and the mechanism of their formation during high-temperature coal combustion at thermal power plans. Kona Powder Part. J. 2010, 28, 189–208. [Google Scholar] [CrossRef] [Green Version]
  6. Drozhzhin, V.S.; Shpirt, M.Y.; Danilin, L.D.; Kuvaev, M.D.; Pikulin, I.V.; Potemkin, G.A.; Redyushev, S.A. Formation processes and main properties of hollow aluminosilicate microspheres in fly ash from thermal power stations. Solid Fuel Chem. 2008, 42, 107–119. [Google Scholar] [CrossRef]
  7. Haustein, E. The selected physico-chemical properties of microspheres and possibility of their use in cement composites. Compos. Theory Pract. 2016, 16, 25–29. [Google Scholar]
  8. Acar, I.; Atalay, M.U. Recovery potentials of cenospheres from bituminous coal fly ashes. Fuel 2016, 180, 97–105. [Google Scholar] [CrossRef]
  9. Żyrkowski, M.; Neto, R.C.; Santos, L.F.; Witkowski, K. Characterization of fly-ash cenospheres from coal-fired power plant unit. Fuel 2016, 174, 49–53. [Google Scholar] [CrossRef]
  10. Ranjbar, N.; Kuenzel, C. Cenospheres: A review. Fuel 2017, 207, 1–12. [Google Scholar] [CrossRef]
  11. Fomenko, E.V.; Anshits, N.N.; Vasilieva, N.G.; Mikhaylova, O.A.; Rogovenko, E.S.; Zhizhaev, A.M.; Anshits, A.G. Characterization of fly ash cenospheres produced from the combustion of Ekibastuz coal. Energy Fuels 2015, 29, 5390–5403. [Google Scholar] [CrossRef]
  12. Liu, H.; Sun, Q.; Wang, B.; Wang, P.; Zou, J. Morphology and Composition of Microspheres in Fly Ash from the Luohuang Power Plant, Chongqing, Southwestern China. Minerals 2016, 6, 30. [Google Scholar] [CrossRef] [Green Version]
  13. Kurpinska, M.; Kułak, L. Predicting Performance of Lightweight Concrete with Granulated Expanded Glass and Ash Aggregate by Means of Using Artificial Neural Networks. Materials 2019, 12, 2002. [Google Scholar] [CrossRef] [PubMed] [Green Version]
  14. Kurpińska, M.; Grzyl, B.; Pszczola, M.; Kristowski, A. The Application of Granulated Expanded Glass Aggregate with Cement Grout as an Alternative Solution for Sub-Grade and Frost-Protection Sub-Base Layer in Road Construction. Materials 2019, 12, 3528. [Google Scholar] [CrossRef] [PubMed] [Green Version]
  15. Kurpińska, M.; Ferenc, T. Application of lightweight cement composite with foamed glass aggregate in shell structures. Shell Struct. Theory Appl. 2018, 4, 549–552. [Google Scholar]
  16. Liu, F.; Wang, J.; Hollingsworth, J. Internal curing of high performance concrete using cenospheres. Cem. Concr. Res. 2017, 95, 39–46. [Google Scholar] [CrossRef] [Green Version]
  17. Hanif, A.; Lu, Z.; Li, Z. Utilization of ash cenosphere as lighweight filler in cement-based composites—A review. Constr. Build. Mater. 2017, 144, 373–384. [Google Scholar] [CrossRef]
  18. Kuryłowicz-Cudowska, A. Determination of Thermophysical Parameters Involved in The Numerical Model to Predict the Temperature Field of Cast-In-Place Concrete Bridge Deck. Materials 2019, 12, 3089. [Google Scholar] [CrossRef] [Green Version]
  19. Mariak, A.; Kurpińska, M.; Wilde, K. Maturity curve for estimating the in-place strength of high performance concrete. MATEC Web Conf. 2019, 262, 06007. [Google Scholar] [CrossRef]
  20. Plessis, A.; Olawuyi, B.J.; Boshoff, W.P.; Roux, S.G. Simple and fast porosity analysis of concrete using X-ray computed tomography. Mater. Struct. 2016, 49, 553–562. [Google Scholar] [CrossRef]
  21. EN 197–1. Cement. Part. 1: Composition, Specifications and Conformity Criteria for Common Cements; European Standards; European Committee for Standardization: Brussels, Belgium, 2012. [Google Scholar]
  22. EN 12390–3. Testing Hardened Concrete. Part. 3: Compressive Strength of Test Specimens; European Standards; European Committee for Standardization: Brussels, Belgium, 2019. [Google Scholar]
  23. EN 196–2. Methods of Testing Cement. Part. 2: Chemical Analysis of Cement; European Standards; European Committee for Standardization: Brussels, Belgium, 2013. [Google Scholar]
  24. ISO 13320:2009. Particle Size Analysis-Laser Diffraction Methods. Part. I: General Principles; International Organization for Standardization; ISO: Geneva, Switzerland, 2009. [Google Scholar]
  25. Skarzynski, Ł.; Tejchman, J. Experimental investigations of fracture process in concrete by means of X-ray micro-computed tomography. Strain 2016, 52, 26–45. [Google Scholar] [CrossRef]
  26. ASTM C457.C457 M. Standard Test. Method for Microscopical Determination of Parameters of the Air-Void System in Hardened Concrete; ASTM International: West Conshohocken, PA, USA, 2012. [Google Scholar]
  27. IUPAC. Manual of Symbols and Terminology for Physicochemical Quantities and Units; Butterworths: London, UK, 1972. [Google Scholar]
  28. EN 450–1. Fly Ash for Concrete. Part. 1: Definition, Specifications and Conformity Criteria; European Standards; European Committee for Standardization: Brussels, Belgium, 2012. [Google Scholar]
  29. ASTM C618. Standard Specification for Coal Fly Ash and Raw or Calcined natural Pozzolan for Use in Concrete; ASTM International: West Conshohocken, PA, USA, 2019. [Google Scholar]
  30. Powers, T.C. Air requirement of frost-resistant concrete. Proc. Highw. Res. Board 1949, 29, 184–211. [Google Scholar]
  31. Lindquist, W.; Montney, R. Comparison of spacing factors as measured by the air-void analyzer and ASTM C457. Int. J. Pavement Eng. 2019, 20, 1–8. [Google Scholar] [CrossRef]
Figure 1. (a) The place of the microspheres’ waste dump; (b) the microsphere on the surface of the pool.
Minerals 10 00058 g001
Figure 2. (a) Scanning electron microscope (SEM) microscopic images; (b) energy dispersive X-ray spectrometer (EDS) analyses of the microspheres.
Minerals 10 00058 g002
Figure 3. Particle size distribution of the microspheres.
Minerals 10 00058 g003
Figure 4. General view of the cross-sections of the sample in three planes, using X-ray technology (air pores marked by black dots).
Minerals 10 00058 g004
Figure 5. The three-dimensional (3D) visualization of a concrete specimen containing 5% microspheres: (a) the region of 40 mm × 40 mm × 40 mm; (b) the location of air pores in cuboid depth and width.
Minerals 10 00058 g005
Figure 6. The three-dimensional (3D) visualization of a concrete specimen with 10% microspheres: (a) the region of 40 mm × 40 mm × 40 mm; (b) the location of air pores in cuboid depth and width.
Minerals 10 00058 g006
Figure 7. Air void distribution (white color) at the cross-section of concrete specimens after 28 days (w/b = 0.50): (a) 0% microspheres, (b) 5% microspheres, and (c) 10% microspheres.
Minerals 10 00058 g007
Figure 8. Compressive strength and total porosity of concrete versus microsphere content.
Minerals 10 00058 g008
Table 1. Composition of concrete mixtures; w/b = 0.50 1.
Components of Concrete (kg/m3)
Cement
CEM I 42.5 R
MicrospheresSandCoarse AggregateWater
0–2 mm
(37%)
2–8 mm
(38%)
8–16 mm
(25%)
-
3500 (0%)698717472182
34317 (5%)672691454182
33734 (10%)647665437182
1 w/b = water/(cement + microsphere).
Table 2. Chemical composition of microspheres (by % weight) determined via X-ray EDS.
ComponentsSiO2Al2O3Fe2O3CaOMgONa2OK2OSO3P2O5TiO2ClLOI
Sample 150.629.54.06.72.11.23.10.60.71.30.20.7
Sample 252.030.94.23.82.41.13.00.40.61.20.41.1
Average (%)51.330.24.15.32.21.23.00.50.71.20.30.9
Table 3. The percentage content of air void structures in concrete for various dosages of microspheres.
Content of Microspheres in ConcreteTotal Porosity (%)Content of Air Voids (%)
<250 µm250–500 µm>500 µm
0%1.2220.3890.4120.421
5%5.1324.0480.5820.502
10%7.4005.7690.8840.747
Table 4. The percentage content of the open and closed pores in concrete for different dosages of microspheres.
Water/Binder Ratio (w/b)0.5
Content of Microspheres in Concrete0%5%10%
Total content of air pores (%)closed1.0014.5346.277
open0.2210.5981.123
The content of pores with a size <250 µm (%)closed0.4983.3894.708
open0.1890.4750.899
The content of pores with a size 250–500 µm (%)closed0.2930.6280.837
open0.0210.0970.172
The content of pores with a size >500 µm (%)closed0.2100.5170.732
open0.0110.0260.052
Table 5. The quantitative characteristics of air voids in hardened concrete made from type I cement and two replacement levels of microspheres.
Characteristics of Air Structure in ConcreteContent of Microspheres in Concrete
0%5%10%
The total volume of air voids (A300) (%)1.55.87.9
The content of micropores with a diameter below 300 μm (A300) (%)0.641.474.5
The ratio of micropores to total air (A300/A)0.430.250.57
The specific surface area of air voids (α) (mm−1),22.730.038.6
The spacing factor ( L ¯ ) (mm)0.390.210.09

