Abstract
The Moroccan phosphate deposits are the largest in the world. Phosphatic layers are extracted in open-pit mines mainly in the sedimentary basins of Gantour and Ouled Abdoun in Central Morocco. The purpose of this study was to prospect and evaluate the water potential of aquifers incorporated in the phosphatic series using the following geophysical methods: Magnetic resonance sounding (MRS), electrical resistivity tomography (ERT), time-domain electromagnetics (TDEM), and frequency-domain electromagnetics (FDEM). The objective was, on the one hand, to contribute to the success of the drinking water supply program in rural areas around mining sites, and on the other hand, to delimit flooded layers in the phosphatic series to predict the necessary mining design for their extraction. The use of geophysical methods made it possible to stratigraphically locate the most important aquifers of the phosphatic series. Their hydraulic parameters can be evaluated using the MRS method while the mapping of their recharge areas is possible through FDEM surveys. The results obtained in two selected experimental zones in the mining sites of Youssoufia and Khouribga are discussed in this paper. The application of the implemented approach to large phosphate mines is in progress in partnership with the mining industry.
1. Introduction
Phosphate is a valuable mineral resource for different industries. In Morocco and all over the world, phosphate rocks are being extracted for their phosphorus content. Phosphate is used to produce phosphoric acid (PA) that have various uses in our daily lives. First, PA is mainly used in agriculture for the production of soil fertilizers. It is also used as animal feed supplements. PA is also widely solicited in laboratories because it resists to oxidation, reduction, and evaporation. It has many other industrial applications such as soaps and detergents, water treatment, dentistry, etc.
Moroccan subsoil includes more than three-quarters of the world’s phosphate reserves [1,2]. These reserves exist mainly in the sedimentary basins of Gantour and Ouled Abdoun in Central Morocco (Figure 1a,b). In these basins, the age of the tabular structure of sedimentary cover ranges from Permo–Triassic (251.9 My = million years ago) to Quaternary (2.58 My) [3]; it rests unconformably on the Hercynian basement of the western part of the Moroccan Meseta [4,5]. The phosphatic series investigated in this study corresponds to the upper part of the sedimentary cover. Its age extends from the Maastrichtian (72.1 My) to Lutetian (47.8 My) [6,7]. This series outcrops in the northern part of the aforementioned basins where the phosphatic layers are exploited in open-pit mines. To the south, this series is buried under the Neogene (23 My) and Quaternary continental deposits of the Bahira and Tadla plains (Figure 1a,b).
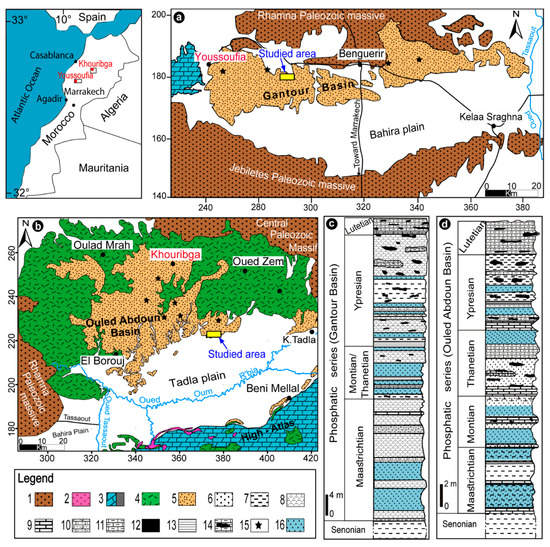
Figure 1.
Location and geology sitting of study areas. (a) Geological map of the Gantour Basin (modified after [8]); (b) Geological map of the Ouled Abdoun Basin (after [9]); (c) Lithological columns of the phosphatic series in Gantour Basin showing the main groundwater aquifers; (d) Lithological columns of the phosphatic series in Ouled Abdoun Basin showing the main groundwater aquifers; 1: Paleozoic; 2: Trias; 3: Jurassic; 4: Cretaceous except Maastrichtian; 5: Maastrichtian–Eocene; 6: Uncemented phosphates, 7: Marl; 8: Phosphatic marl; 9: Limestone; 10: Phosphatic limestone; 11: Marly limestone; 12: Silex; 13: Clay; 14: Marly-siliceous limestone; 15: Open-pit mine; 16: Aquifers. (N.B. Lambert kilometric coordinates projection for the north of Morocco).
The present study was conducted to characterize the aquifers of the phosphatic series and better understand their properties and characteristics. This study is part of an ambitious sustainable development program led by the Office Chérifien des Phosphates (OCP) around phosphatic extraction sites. The drinking water supply of rural agglomerations in the vicinity of mining sites is among the main objectives of this program. In addition, OCP’s geo-mining engineers are interested in determining the flooded areas in the phosphatic series which will allow them to predict all the required preparations to extract phosphates in such a hydrogeological context.
This study combined the use of at least two different geophysical methods across two selected areas, namely Youssoufia and Khouribga mining sites (Figure 1a,b). Electrical resistivity tomography (ERT) and magnetic resonance sounding (MRS) surveys were carried out in the Youssoufia area (Figure 1a); while time-domain electromagnetic (TDEM) and frequency-domain electromagnetic (FDEM) measurements were performed in the Khouribga site (Figure 1b).
The treatment and interpretation of the acquired data made it possible to locate the main horizon of the aquifer contained in the phosphatic series and map on the surface conductive corridors that would constitute potential recharging zones.
The experimental research conducted at the two aforementioned sites allowed for the establishment of a scientific approach for larger hydro-geophysical studies to be conducted on the phosphatic series. It also made it possible to define appropriate devices and sampling steps for the used geophysical methods. The MRS method is a satisfactory tool to explore the aquifers and determine their hydrodynamic parameters in the phosphatic series context. FDEM surveys, which are very easy to implement in field, are the most efficient tool for mapping aquifer recharge zones in the geological context of our studied areas. The ERT and TDEM methods can also be used in areas where MRS data are affected by natural electromagnetic noise. We discuss, in this article, the approach adopted and the main obtained results.
2. Geological and Hydrogeological Context of the Study Areas
This research was conducted at two OCP mining sites in two distinct sedimentary basins: Gantour and Oulad Abdoun. The Youssoufia site is located in the Gantour Basin. In this basin, the sedimentary series ranges from the Triassic to Quaternary period [7]. It is surrounded from the north and south, respectively, by the Paleozoic outcrops of the Rhamna and Jebiletes Massifs (Figure 1a). The phosphatic series outcrops in the northern basin where they are exploited in open-pit mines in Youssoufia and Benguerir. In the southern basin, this series is buried below the Neogene and Quaternary deposits of the Bahira Plain. In the Gantour Basin, the phosphatic series is well known owing to its exploitation and borehole recognition (Figure 1c). It starts with the Maastrichtian, mainly formed of fine sandy phosphates, phosphatic marls, and a clay–sandstone complex constituting an impermeable reference layer [7,10]. The Paleocene that is the lower epoch of the Paleogene, which includes the Montian (61.6 My) and the Thanetian (59.2 My), is mainly composed of alternating layers of uncemented phosphates, limestones and/or phosphatic marls, coprolites, and flint nodules. The Lower Eocene (Ypresian (56 My)) is commonly formed of phosphatic marls intercalated by phosphatic limestones, silexite, and siliceous marl [11,12]. Uncemented phosphatic layers become weak and often overlay impermeable clay layers, known as Ypresian clays by geo-mining engineers, in the Gantour Basin. Lutetian (47.8 My) strata mark the end of the phosphatic series. It is characterized by a fossiliferous marly limestone slab, known as the Thersitae slab [7,13,14,15,16].
The second study area is in the Ouled Abdoun Basin situated approximately 26 km south of Khouribga. This basin includes the largest phosphate deposits in the world. It extends over more than 10,000 km2 and is bounded on the north by the Hercynian Massif of Central Morocco, on the south and east by the Jurassic escarpments of the Middle and High Atlas, and on the west by the Paleozoic outcrops of the Rhamna [14]. Geomorphologically, this basin contains two distinct units: The phosphate plateau and the Tadla Plain (Figure 1b). The phosphatic series (Figure 1d) is formed of alternating layers of uncemented phosphate, sterile limestone, and marly limestone with an average thickness of approximately 50 m in the deposits under extraction [16,17]. It begins with phosphatic marls and limestone layers that are very rich in bone debris, known as bone-bed limestones, of Maastrichtian age [18,19]. This stage marks the beginning of a phosphatogenesis that reaches its maximum during the following stages. Above, successive layers of uncemented phosphates and phosphatic limestone occur. The Montian is represented by uncemented phosphates, overlain by limestone with coprolites and flint nodules that constitute a reference layer for mining extraction. The last is also overlain by alternating regular beds of marly and phosphatic limestones, coarse-grained uncemented phosphatic layers, continuous flint horizons and, sometimes, silto-pelitic layers from Thanetian to Ypresian in age [6]. The Lower Lutetian consists mainly of alternating flint layers and slightly phosphate marls and limestones that mark the last stages of phosphatogenesis. The phosphatic series is overlain by strong fossiliferous carbonated layers, rich in gastropods, known as the Thersitae Slab [20]. The phosphatic layers outcrop or are beneath a thin quaternary cover in the Northern Ouled Abdoun Basin. They are extracted in the open-pit mines of Khouribga, Daoui, Merah, and Sidi Chennane. To the south and southeast, the phosphatic series is buried beneath the Neogene and Quaternary continental and lacustrine deposits of the Tadla Plain [21].
Hydrogeologically, the main groundwater aquifers in the sedimentary series of the Gantour and Ouled Abdoun basins correspond to karstic Turonian limestones, uncemented phosphatic horizons, and fractured limestones that cover the phosphatic series [8,21,22,23]. The Turonian aquifer is very deep (greater than 250 m) in the two aforementioned basins, and therefore less recognized and extracted. The aquifer corresponding to the Lutetian fractured limestones of the Thersitea slab is only important for water supply in areas where the phosphate series is buried under the Bahira and Tadla Plains. Along the perimeters of the open-pit mines in both the Gantour and Ouled Abdoun Basins, the piezometric level is generally below the Ypresian limestones.
This study is concerned with the aquifers in the uncemented phosphate horizons of the phosphatic series. Actually, this aquifer system is composed of at least eight superimposed layers of uncemented phosphates; each is overlaying a sterile impermeable interlayer of clay, marl, continuous flint bench, or siliceous phosphatic limestone. These aquifer horizons connect with each other via a network of fractures and microfaults affecting the phosphatic series. They are from bottom to top (Figure 1c,d) the following: (i) Two layers of Maastrichtian uncemented phosphates that constitute the most important aquifer of the Youssoufia and Benguerir mines; (ii) four layers of Montien–Thanetian uncemented phosphates that often overlie siliceous limestone layers. The thickness of these layers changes from one location to another in the studied basins [8]. Finally, the Ypresian phosphatic coarse layers overlie either plastic clays or siliceous marl. They correspond to the Ypresian strata indicated with blue background in Figure 1c.
3. Materials and Methods
To conduct the present hydrogeophysical study of the OCP mining sites, we chose two zones to perform experimental geophysical surveys. These zones were selected near extraction areas where geological and hydrogeological data are available to calibrate the results of the used geophysical methods. The first zone was located in the Gantour Basin at the “Panel 6” deposit according the OCP terminology (Figure 1a). The second is adjacent to the Sidi Chennane mining deposit in the Ouled Abdoun Basin (Figure 1b). During this experimental phase, we arbitrarily chose to test the MRS and ERT methods at the Youssoufia mine site, while the TDEM and FDEM methods were used at Khouribga. The same methods can be used at any of the OCP mining sites because of the similarity of the geological and hydrogeological contexts, as shown in Figure 1c,d; in addition, the two sites chosen to conduct the present study have the advantage of a low electromagnetic noise level. They are located far from any source of anthropogenic noise generated by human activities, such as power lines, radio antennae, electric fences, motors, pumps, buried conductors, etc.
3.1. ERT Profiles
ERT profiles provide two-dimensional (2D) images of subsurface resistivities. The implantation of a large number of electrodes, at regular intervals, along a rectilinear profile, enables one to obtain pseudo-sections of apparent resistivities. Using modern equipment, the acquisition is automatic by interrogating quadrupoles of increasing length, thus making it possible to obtain increasing measurement depths. A data inversion is then performed to obtain a quantitative measurement of the true electrical resistivity at real depths.
An ABEM Terrameter LS 12 with 81 electrodes was used and made available by the Andaluz Institute of Geophysics (AIG) at Granada University, Spain. We adopted an edge gradient acquisition device which allowed for a better assembly between electrodes by combining symmetrical and asymmetrical configurations. Such a configuration provides an image of subsurface resistivities at high resolution and with less artifacts, e.g., distortions of the inversion resistivity model caused by the relatively high noise contamination of the data [24]. Three ERT profiles 700 m long with 5-m electrode spacing were collected (Figure 2). A total of 6531 apparent resistivity measurements were acquired. Before the inversion of the data, their quality control was thoroughly controlled. No automatic filtering was applied but the data were edited, and all bad datum readings were manually eliminated. This resulted in slight reduction of the total corrected datum point for each profile. The data inversion was performed using the AIG’s Res2dinv software (V.358-Geotomo Software). The program uses a smoothness-constrained Gauss–Newton method to obtain a 2D resistivity model [25]. The process is automatic once the inversion parameters are established and a user-defined initial model is not needed. The iterative inversion process was set at a maximum of 10 error-iterations using the L2-norm (root mean square), offering an error, between the apparent resistivities in the field and those generated by the calculated models, less than 5%. The inversion model contained 15 layers and 1692 resistivity blocks. It was refined to half the electrode spacing because of the sensitivity of the gradient array to near surface variation. The sensitivity matrix was calculated using the incomplete Gauss–Newton method that is recommended for large data sets. In general, the first 40 m of the three profiles showed good relative sensitivity values. Between 40 and 60 m depth, the sensitivity was acceptable. The ERT-3 profile showed an area of low sensitivity values due to the presence of the resistive body. Prior to the inversion process, topographic data acquired every 50 m by an OCP surveyor team were added to the resistivity measurement files.
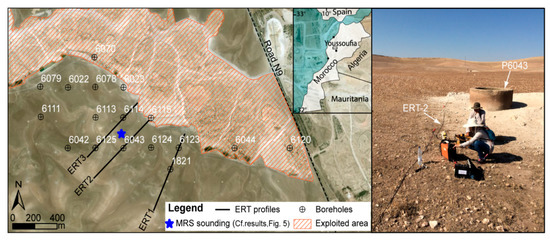
Figure 2.
Location of geophysical surveys carried out in Youssoufia area and photograph showing a borehole intersected by the electrical resistivity tomography (ERT)-2 profile.
3.2. MRS Data
Schematically, the physical principle of the MRS method is based on the fact that the protons that form the hydrogen nuclei of water molecules in Earth’s magnetic field have positive magnetic moments that, at equilibrium, are aligned in the direction of this main field. The excitation of these protons by emitting a disturbing magnetic field at a specific frequency, termed a “Larmor frequency,” modifies this equilibrium state and causes magnetic precession moments around Earth’s magnetic field. After cutting off the exciter field, and during the return to their equilibrium state, a magnetic relaxation field is generated by the protons, thus constituting the MRS measured signal. The higher the signal amplitude, the larger the number of protons in resonance; thus, this provides information regarding the subsoil water content. The importance of the precession process in the excitation and relaxation at the field cut-off is also related to the average pore size of the aquifer formation. The relaxation time (decay time of the measured signal) is longer as the solicited protons are those of water less enclosed in the rock, and therefore of an aquifer with a high hydrodynamic potential guaranteeing a sufficient pumping flow rate [26,27,28,29].
First, we measured the ambient electromagnetic noise and assessed the quality of the MRS signal in the geological context of the Youssoufia mine. Then, an MRS survey was conducted using a loop of 100 × 100 m, which is the loop size of the MRS systems employed to realize the survey. We chose this dimension in order to maximize the depth of investigation of the study area. The transmitter/receiver loop was centered on well P6043 (Figure 2) to compare and calibrate the results of this method with real hydrogeological data. Numis Pro from IRIS Instruments was used from the University Cadi Ayyad of Marrakech. MRS data acquisition and inversion were, respectively, performed using the Prodiviner and Samovar software of the aforementioned company [30]. The measured parameter is the relaxation magnetic field created by excited protons when they return to their equilibrium state. The physical parameter that we sought to identify was the water content of the different subsoil layers. The result is a plot showing the hydrogeological model corresponding to the measured signal.
3.3. TDEM Data
Electromagnetic methods are based on the diffusion of an electromagnetic field (EM) in the subsoil to determine its electrical resistivity. For the TDEM soundings conducted at the Khouribga mining site, the EM field, termed the primary field, is created by the sudden cutting off of a flowing current in a transmitting coil placed on the ground. The secondary field, related to the induced current, is measured by a receiver coil after the current cut-off. The TDEM sounding curve provides the variation in the apparent resistivity of the subsoil according to the time, in other words according to the depth, which increases with time during the secondary field measurement [31,32]. Therefore, recorded curves can be converted to pseudo-depths [33,34]. The investigation depth depends on the formation resistivities, signal–noise ratio, as well as the measurement loop size. It is classically estimated at 1.5 to 2.5 times the size of the loop, but depends on the local conditions [35]. The Tem-Fast ProSystem, from the geological service of the OCP in Khouribga, was used. The surveys were conducted using a square emission loop of 20 m side pulled on the ground. A total of 84 TDEM soundings were completed at a sampling step of 12.5 m along a profile 1050 m in length (Figure 3). Obtained data, from each survey, were inverted using the TemRes software based on the Temfast Prosystem technique [35].
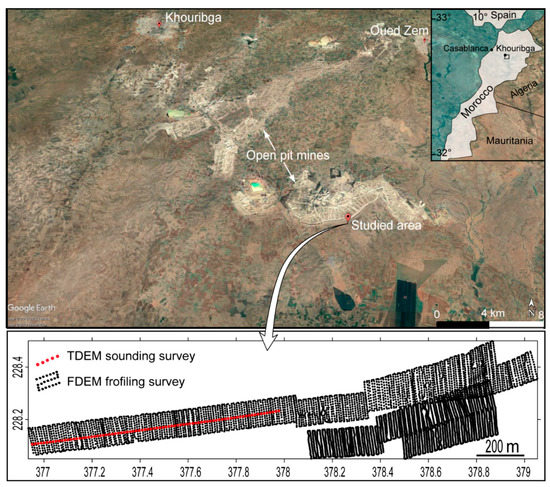
Figure 3.
Location of geophysical surveys conducted in Khouribga area.
3.4. FDEM Data
The FDEM method applied in the present study was carried out using the Geonics EM-31 MK-2 system. This technique helps record the electrical conductivity whose variations reflect the facies heterogeneities in the near subsoil. The measurements were performed without any contact with the ground; this makes the field survey very easy to implement and provides a higher acquisition performance than the TDEM technique. The EM31-MK-2 system contains a transmitter and receiver coils fixed at the ends of a 3-m-long support bar and connected to the control box in the middle of the device. The transmitter generates a primary magnetic field at a given frequency. A secondary field is generated and recorded by the receiver when the primary field encounters conducting areas in the ground. The ratio of the vertical component of the secondary field in the quadrature with the primary field is proportional to the apparent conductivity of the investigated soil. The investigation depth of the EM31 method is theoretically equal to 1.5 to 2 times the distance between the transmitting and receiver coils, for a medium-conducting environment [36,37,38].
The EM31 method was used at the Sidi Chennane deposit (Figure 3), in the same area where the TDEM surveys were conducted. Measurements were made along profiles spaced every 10 m. These profiles cover 33 juxtaposed parcels of 100 × 100 m equaling a total length of 36.3 km and 207,746 measured values. A global positioning system (GPS) was connected and synchronized with the EM31 acquisition console, allowing for measurement geolocalization.
4. Results and Discussion
4.1. Youssoufia Mining Site
The study area belongs to the phosphate deposit of Panel 6, approximately 26 km east of Youssoufia on the main road No 9 linking Marrakech to El Jadida. Figure 4 shows the results of ERT profiles P1, P2, and P3. This figure also shows the synthetic lithological columns of the recognition wells of the phosphatic deposits created by OCP. This allowed us to constrain the models of the calculated resistivities and assign the measured values to the different lithological units of the phosphatic series. We also show on the same figure the curve of the piezometric level measured in the OCP boreholes during the geophysical field surveys.
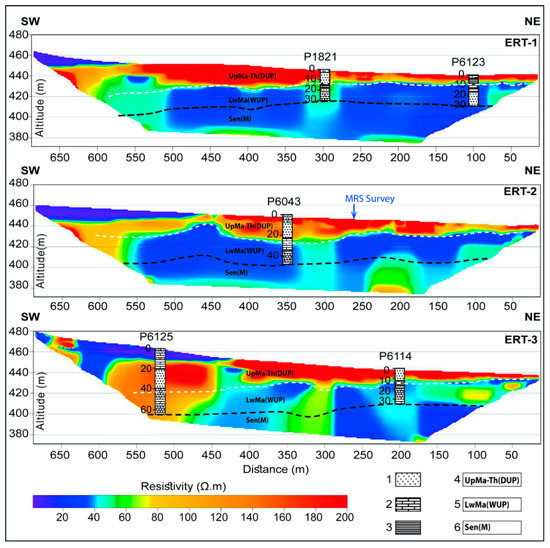
Figure 4.
Model resulting from ERT data inversion calibrated to lithological boreholes columns. The dashed white line corresponds to the piezometric level measured on site. The dashed black line indicates the limit between the Maastrichtian and the Senonian formations. 1: Uncemented phosphate; 2: Limestone; 3: Clay; 4: Upper Maastrichtian–Thanetian (dry uncemented phosphate); 5: Lower Maastrichtian: (wet uncemented phosphate); 6: Senonian: (marl).
In the southwest part of the three ERT profiles, the resistivity values are less than 20 ohm·m in the sub-surface. These low values can be explained by the more or less wet marl and clay facies that we observed in this area during the geophysical surveys. The remainders of the profiles at this depth (i.e., about 10 to 20 m) are represented by higher resistivity values greater than 140 ohm·m. These values are attributed to the phosphatic limestone and uncemented phosphatic dry layers of the Upper Maastrichtian and Thanetian, between 0 and 25 m depth, in the OCP’s lithological wells, but also in the surrounding mining trench. Underneath, clearly conductive areas with resistivities less than 60 ohm·m occur. They correspond to the damped or high-water content of the uncemented phosphatic layers of the Lower Maastrichtian and to Maastrichtian impermeable clays (2 m) that constitute a reference level for the extraction of the Youssoufia open-pit mining [10,17]. Conductive layers still occur beneath the Maastrichtian formations until the bottom of the ERT sections. They correspond to the Senonian marls described in the stratigraphic columns of the OCP wells since the depth of 50 m. The most conductive horizon of all the ERT sections is situated between 25 and 35 m depth. It corresponds to the uncemented phosphatic layer of the Lower Maastrichtian that overlies the aforementioned impermeable clays. At some locations, it is difficult to make delimitation according to the depth of the top and the bottom of the real aquifer horizons, corresponding to Maastrichtian uncemented phosphatic layers and marl and/or limestone intercalary, which are probably very wet. Both formations provide comparable electrical signatures, as reflected in the ERT sections by the thick blue section. Therefore, the sensitivity according to the vertical of the ERT method is more or less limited. However, laterally, the ERT sections show moderately resistive zones within the same conductive stratigraphic horizon. This lateral variation in the resistivities can be attributed to a decrease in the water content within the same conductive horizon or to local facies change. These facies variations within the same layer are actually described along the operating trenches.
The piezometric level measured in the P1821, P6123, and P6043 boreholes during the geophysical surveys exactly coincide with the interpretation provided to the ERT sections. We interpolated between the OCP boreholes and extrapolated outside of them, assigning aquifer resistivity values less than 60 ohm·m. The perfect match between the depth of the piezometric level measured in the OCP boreholes and the roof of the conductive horizon was shown by the ERT data inversion (Figure 4). Thus, this method can be used to identify and locate the aquifers in the phosphatic series at the Youssoufia mining site.
During the present study reliable MRS data were recorded after some unsuccessful attempts to perform the measurements with low stacking values, even if the survey area was located far from any electromagnetic source of noise. To obtain data of good signal-to-noise ratio (average of 5.5), it was necessary to take the measurements using 250 stacks. The emitted and the received signals had very close frequencies (difference less than 1.0 Hz). A smooth inversion of the MRS data was performed using Samovar software with a filtering window of 197.8 ms, a time constant of 15.00 ms, an average signal to noise ratio of 2.66, and a fitting error for the free induction decay 1 (FID1) of 9.05%.
Figure 5 shows MRS survey data and results including the signal relaxation curves versus time for the various pulse moments injected (Figure 5a). The hydrogeological model resulting from the inversion helps determine the depth of the aquifers and the free water content that estimates the porosity of the rock in a saturated environment. One can clearly see that the amplitude of the measured signal changed according to the excitation pulse and thus the depth. This shows the presence of subsoil water and the variation in water content from one level to another (Figure 5b). We also note that the MRS signal was clearly distinguished from the electromagnetic noise, which was fortunately very low at the studied site. Generally, two aquifer levels can be distinguished (Figure 5c): The first is between 20 and 30 m, and the second between 32 and 45 m. The water content, which reflects the porosity of the layers below the piezometric level, is, respectively, 3% and 6.7%. These values are quite comparable to those provided by pumping tests conducted on the same aquifer outside the study area [22].
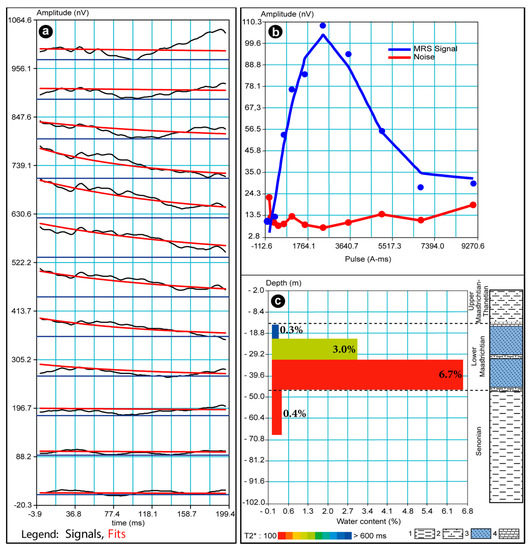
Figure 5.
(a) Magnetic resonance sounding (MRS) signal relaxation curves versus time for the various pulse moments injected; (b) amplitude of measured MRS signal and noise level; (c) model resulting from MRS data inversion and its correlation with hydrogeological column; 1: Marl; 2: Phosphatic marl; 3: Uncemented phosphate; 4: Phosphatic limestones.
The average aquifer thickness derived from the MRS calculated model was approximately 23 m. The depth of the piezometric level measured in well n°6043 at the center of the MRS loop was 21.23 m. The MRS signal’s decay time was relatively low (100–150 ms) which meant that, in general, the aquifer was moderately permeable [39,40,41]. The recognition well lithological sections in the phosphatic deposits showed that the aquifer delimited by the MRS data inversion corresponded to the two uncemented phosphatic layers of the Lower Maastrichtian in the study area (Figure 5c). Given that the studied area was approximately 19,242,500 m2, we deduced a total water volume of approximately 22,128,875 +/- 2,251,373 m3. The uncertainty of the volume estimate was about 10% due to the error of average porosity calculated from MRS inversion and the quantification of the unsaturated part of the aquifer. This volume was quite comparable to the that obtained via the direct calculation using the OCP well piezometric data (22,829,600 +/- 2,282,960 m3). It is with this purpose that the study was conducted using MRS to better understand the water reserves and hydrodynamic parameters of the Maastrichtian aquifer. These results strongly support the use of this method in other areas of the Youssoufia open-pit mines.
4.2. Khouribga Mining Site
To facilitate interpretation of the results, we used the same color palette for both resistivity (TDEM method) and resistivity calculated from conductivity (EM31 method). The TDEM sounding data are presented as a pseudo-section obtained by interpolation of the experimental apparent resistivities from one sounding to another using the minimum curvature method [42] (Figure 6a). The same method was used to interpolate the 1D inversion of the 84 performed soundings in order to build the resistivity model illustrated in Figure 6b. This model shows a clearly conductive horizon whose top varies approximately in altitude from 495 to 510 m, and in depth from 24 to 47 m. This conductive horizon is continuous and extends for more than 1 km along the TDEM executed profile. Beneath the 70 m depth, the top of moderately resistant layers is locally observed. They correspond to the compact gray marl with gypsum of the Senonian, which can be seen in the OCP’s recognition wells at this depth [43]. Above the conductive horizon, moderately resistant and resistant soils consisting of phosphatic layers with very low water content with intercalated limestone and flint layers occur. At the near-surface, the layers are even more resistant because they are dry and rich in limestone encrustation. Other resistant bodies also cut the phosphatic series. They are attributed to the disturbed areas of the phosphatic series, known as “derangements” by the OCP mining engineers [43,44,45,46]. These structures are often accompanied by a localized silicification event. The research of Kchikach et al. 2002, 2006, and 2012 [16,47,48] shows that the disturbed areas of the phosphatic series are characterized by a strongly resistive electrical signature.
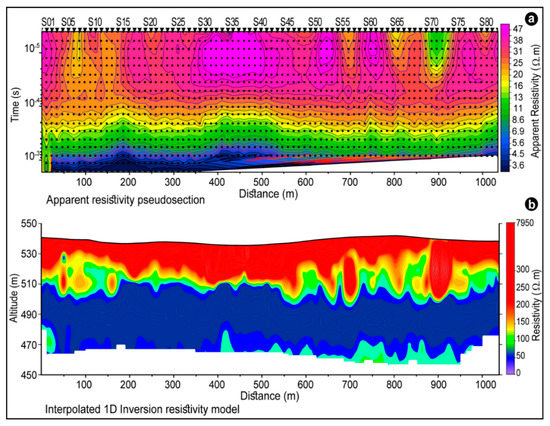
Figure 6.
(a) Time-domain electromagnetic (TDEM) pseudo-section of experimental resistivity data from TDEM sounding survey, (b) interpolated 1D inversion resistivity model.
The apparent resistivity map obtained after smoothing the EM31 data, and at regular sampling steps of 1 × 1 m, shows a series of conductive anomalies in the studied area. These anomalies, with conductivity values generally greater than 20 mS/m (Figure 7), consist of altered and fractured zones of limestone encrustation. However, the areas where these encrustations are thicker and less fractured result in conductivities less than 15 mS/m. Conductive anomalies are superimposed with fractured and altered corridors that can be easily delimited in the field. Actually, during the geophysical surveys, these corridors were distinguished in the field by their wet aspect. They constitute potential zones for surface water infiltration towards the identified aquifer in the same areas as shown using the TDEM method. Despite its limited investigation depth, the EM31 technique is a very good tool for mapping groundwater aquifer recharge zones in the phosphatic series. The most productive water wells and boreholes should be, in our estimation, installed in line with these highly conductive anomalies.
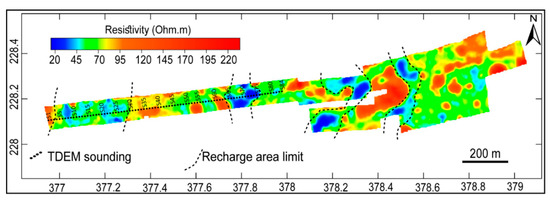
Figure 7.
Apparent resistivity map obtained from EM31 data.
Finally, a summary illustration synthesizing the main outputs of the present study was established (Figure 8). The latter clearly shows that in both Youssoufia and Khouribga areas, the Lower Maastrichtian constitute a high potential water-bearing aquifer. The figure clearly depicts the convergence between the ERT and the MRS findings in Youssoufia. In fact, the conductive character of the Lower Maastrichtian is explained by the water content evidenced by the MRS survey. In the Khouribga site, TDEM data revealed that the Lower Maastrichtian is also clearly a conductor. Since this age (Lower Maastrichtian) is made with the same facies as Youssoufia (uncemented phosphate), we can assume that it may constitute the main reservoir of underground water.
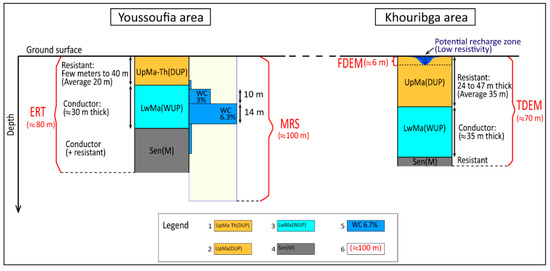
Figure 8.
Summary illustration synthesizing the main outputs of the present study. 1: Upper Maastrichtian–Thanetian (Dry uncemented phosphate); 2: Upper Maastrichtian: (Dry uncemented phosphate); 3: Lower Maastrichtian: (Wet uncemented phosphate); 4: Senonian: (Compact gray marl); 5: Aquifer water content derived from MRS survey; 6: Maximal investigated depth for each geophysical method.
5. Conclusions
This study clearly shows the efficiency of the MRS method for prospecting groundwater resources and evaluating their importance in the geological context of Youssoufia open-pit mining. The hydrogeological model resulting from the MRS data inversion corroborates with the real hydrogeological data of the study area. The highlighted aquifer corresponds to two layers of high-water content Maastrichtian uncemented phosphate, as shown by the extraction works in the surrounding areas. The water volumes estimated via the piezometric data analysis and MRS method are quite comparable. Despite the average signal amplitude, the exceptional low electromagnetic noise conditions, in the geological context of the OCP open-pit mines, encourage the use of this method to survey and characterize the groundwater aquifers in the phosphatic series.
ERT profiles allowed us to delimit in detail the conductive horizons attributed to the groundwater aquifers. They clearly show that aquifers in the study area are situated below 21 m depth. Compared to the MRS method, the ERT method is less sensitive; the aquifer horizons corresponding to the uncemented phosphatic layers and intercalary of the wet marls and limestones show comparable electrical signatures, thus limiting the precise location of the top and the bottom of the supposedly saturated aquifer. However, this method is sensitive to lateral resistivity variations along the same aquifer horizon. These variations reflect the changes in water content from one zone to another along the horizon.
TDEM surveys at the Khouribga mining site highlighted a conductive horizon whose depth varies from 24 to 47 m. The interpolation between the models of the 84 surveys conducted shows that this horizon is continuous throughout the prospected zone. The integration of the lithological data sections of the surrounding boreholes enables one to attribute this conductance to the Lower Maastrichtian phosphatic layers. These layers overlie compact and impermeable Senonian marls that prevent deeper groundwater infiltration. Therefore, uncemented phosphatic layers of the Lower Maastrichtian constitute the most important aquifer in the geological context of the Khouribga open-pit mines. Conducting larger geophysical surveys, combining the TDEM and MRS surveys, which provide satisfying results in the similar hydrogeological context of the Youssoufia deposits, would enable a better understanding of the Lower Maastrichtian aquifer and evaluation of its hydrodynamic parameters.
Despite its limited investigation depth, the FDEM method can be used as a tool for mapping and delimiting the aquifer potential recharge zones in the phosphate series. The superposition of the conductivity map obtained from the FDEM data on the TDEM results, and on the spatial distribution of the aquifer hydrodynamic parameters deduced from the MRS data, could guide borehole or well installation in the most productive areas for groundwater extraction. The location of these areas would allow OCP mining engineers to implement all the necessary preparations and arrangements to extract phosphates in these flooded areas.
Author Contributions
Conceptualization: A.K. and F.-Z.I.; methodology: A.K., M.J., and D.E.A.; software: F.-Z.I., M.J., J.A.P.R., O.A.O., and L.V.D.; validation: A.K., F.-Z.I., and M.J.; investigation: F.-Z.I., A.K., M.J., D.E.A., J.A.P.R., O.A.O., and L.V.D.; resources: E.-S.J. and O.K.Y.; writing—original draft preparation: F.-Z.I. under the supervision of A.K.; writing—review and editing: A.K., M.J., D.E.A., O.K.Y., E.-S.J., J.A.P.R., O.A.O., and L.V.D.; project administration: A.K. All authors have read and agreed to the published version of the manuscript.
Funding
This research was funded by OCP-SA and CNRST Morocco project APHOS, GEO-KCH-01/2017.
Acknowledgments
This research was carried out as part of the project ID GEO-KCH 01/2017, funded by OCP. Particular thanks are addressed to the managers of the Youssoufia and Khouribga mining sites for their help and logistical support.
Conflicts of Interest
The authors declare no conflict of interest.
References
- Bouda, A.; Salvan, M. État des connaissances sur le plateau continental marocain et ses dépôts phosphatés. Mines Géol. Énergie 1971, 25, 15–52. [Google Scholar]
- Jasinski, S.M. Phosphate Rock, Mineral Commodity Summaries; U. S. Geological Survey (USGS): Reston, VA, USA, 2019; p. 122.
- Choubert, G.; Salvan, H. Evolution du Domaine atlasique marocain depuis les temps paléozoiques. Mém. Serv. Géol. Fr. 1976, 1, 447–527. [Google Scholar]
- Michard, A. Eléments de Géologie Marocaine. Notes Mem. Serv. Geol. (Maroc) 1976, 252, 131–146. [Google Scholar]
- Zouhri, S.; Kchikach, A.; Saddiqi, O.; El Haïmer, F.; Baidder, L.; Michard, A. The Cretaceous-tertiary plateaus. In Continental Evolution: The Geology of Morocco; Springer: Berlin, Germany, 2008; pp. 331–358. [Google Scholar]
- Azmany, M.; Farkhany, X.; Salvan, H. Gisement des Ouled Abdoum, géologie des gites minéraux marocains. Notes Mém. Serv. Géol. Maroc 1986, 276, 200–249. [Google Scholar]
- Boujo, A. Contribution à L’étude Géologique du Gisement de Phosphate Crétacé-Éocène des Ganntour (Maroc Occidental); Thèse Université de Strasbour: Strasbourg, France, 1976. [Google Scholar]
- Karroum, M.; El Mandour, A.; Khattach, D.; Cassas, A.; Himi, M.; Rochdane, S.; Laftouhi, N.-E.; Khalil, N. Fonctionnement hydrogéologique du bassin de la Bahira (Maroc central): Apport de l’analyse des données géologiques et gravimétriques. Can. J. Earth Sci. 2014, 51, 517–526. [Google Scholar] [CrossRef]
- Saadi, M.; Hilali, E.; Bensaïd, M.; Boudda, A.; Dahmani, M. Carte Géologique du Maroc; Ministere de l’éenergie et des mines, direction de la géologie: Paris, France, 1985.
- Daafi, Y.; Chakir, A.; Jourani, E.; Ouabba, S.M. Geology and mine planning of phosphate deposits: Benguerir deposit Gantour basin–Morocco. Procedia Eng. 2014, 83, 70–75. [Google Scholar] [CrossRef]
- Belfkira, O. Evolutions Sédimentologiques et Géochimiques de la Série Phosphatée du Maestrichtien des Ouled Abdoun (Maroc); Université Scientifique et Médicale de Grenoble: Grenoble, France, 1980. [Google Scholar]
- Salvan, H. Étude préliminaire du gisement de Merah El Areh, rapport inédit. Serv. études Gisem. OCP 1961, 2, 14. [Google Scholar]
- Bba, A.N.; Boujamaoui, M.; Amiri, A.; Hejja, Y.; Rezouki, I.; Baidder, L.; Inoubli, M.; Manar, A.; Jabour, H. Structural modeling of the hidden parts of a Paleozoic belt: Insights from gravity and aeromagnetic data (Tadla Basin and Phosphates Plateau, Morocco). J. Afr. Earth Sci. 2018, 151, 506–522. [Google Scholar] [CrossRef]
- El Haddi, H.; Benbouziane, A.; Mouflih, M. Geochemical Siliceous and Silicified Facies of Phosphate Series of Ouled Abdoun Basin (Morocco). Open J. Geol. 2014, 4, 295. [Google Scholar] [CrossRef]
- Salvan, H. Phosphates. Notes et Mémoires du Serv. Géologique du Maroc 1952, 87, 283–320. [Google Scholar]
- Kchikach, A.; Andrieux, P.; Jaffal, M.; Amrhar, M.; Mchichi, M.; Boya, B.; Amaghzaz, M.; Veyrieras, T.; Iqizou, K.J.C.R.G. Les sondages électromagnétiques temporels comme outil de reconnaissance du gisement phosphaté de Sidi Chennane (Maroc): Apport à la résolution d’un problème d’exploitation. Comptes Rendus Geosci. 2006, 338, 289–296. [Google Scholar] [CrossRef]
- Kchikach, A.; Jaffal, M.; El Assel, N.; Chalikakis, K.; Guérin, R.; Daafi, Y.; Jourani, E.-s. Les Sondages De Resonance Magnetique Des Protons Appliques A La Caracterisation Des Aquiferes: Presentation D’une Etude Experimentale A Bouchane (Youssoufia, Maroc). Conf. Pap. 2013. [Google Scholar] [CrossRef]
- Noubhani, A.; Cappetta, H. Batoïdes nouveaux ou peu connus (Neoselachii: Rajiformes, Myliobatiformes) des phosphates maastrichtiens et paléocènes du Maroc. Elasmobranches et Stratigr. Belg. Geol. Surv. Prof. Pap. 1995, 278, 7. [Google Scholar]
- Suberbiola, X.P.; Bardet, N.; Jouve, S.; Iarochène, M.; Bouya, B.; Amaghzaz, M. A new azhdarchid pterosaur from the Late Cretaceous phosphates of Morocco. Geol. Soc. Lond. Spec. Publ. 2003, 217, 79–90. [Google Scholar] [CrossRef]
- Salvan, H. Étude Complémentaire Sur le Gisement de Merah El Areh. Etude D’ensemble des Niveaux Supérieurs; Umpublished report; Office Chérifien des Phosphates: Casablaca, Morocco, 1963; pp. 1–14. [Google Scholar]
- Ettazarini, S.; El Mahmouhi, N. Vulnerability mapping of the Turonian limestone aquifer in the Phosphates Plateau (Morocco). Environ. Geol. 2004, 46, 113–117. [Google Scholar] [CrossRef]
- Bougadra, A. Synthèse Hydrogéologique de la Bahira Occidentale. Thèse de Troisième Cycle; Université Cadi Ayyad: Marrakech, Morocco, 1991. [Google Scholar]
- El Mokhtar, M.; Fakir, Y.; El Mandour, A.; Benavente, J.; Meyer, H.; Stigter, T. Salinisation des eaux souterraines aux alentours des sebkhas de Sad Al Majnoun et Zima (plaine de la Bahira, Maroc). Sci. Chang. Planétaires/Sécher. 2012, 23, 48–56. [Google Scholar]
- Dahlin, T.; Zhou, B. A numerical comparison of 2D resistivity imaging with 10 electrode arrays. Geophys. Prospect. 2004, 52, 379–398. [Google Scholar] [CrossRef]
- Loke, M.; Dahlin, T. A comparison of the Gauss–Newton and quasi-Newton methods in resistivity imaging inversion. J. Appl. Geophys. 2002, 49, 149–162. [Google Scholar] [CrossRef]
- Chalikakis, K.; Nielsen, M.R.; Legchenko, A.; Hagensen, T.F. Investigation of sedimentary aquifers in Denmark using the magnetic resonance sounding method (MRS). Comptes Rendus Geosci. 2009, 341, 918–927. [Google Scholar] [CrossRef]
- Legchenko, A.; Baltassat, J.M.; Bobachev, A.; Martin, C.; Robain, H.; Vouillamoz, J.M. Magnetic resonance sounding applied to aquifer characterization. Groundwater 2004, 42, 363–373. [Google Scholar] [CrossRef]
- Legchenko, A.; Baltassat, J.-M.; Beauce, A.; Bernard, J. Nuclear magnetic resonance as a geophysical tool for hydrogeologists. J. Appl. Geophys. 2002, 50, 21–46. [Google Scholar] [CrossRef]
- Nielsen, M.R.; Hagensen, T.F.; Chalikakis, K.; Legchenko, A. Comparison of transmissivities from MRS and pumping tests in Denmark. Near Surf. Geophys. 2011, 9, 211–223. [Google Scholar] [CrossRef]
- IRIS Instruments. Software for Magnetic Resonance Sounding, Numis Pro User’s Manual; IRIS Instrument: Orléans, France, 2005. [Google Scholar]
- Galibert, P.-Y.; Guerin, R.; Andrieux, P. Structural mapping in basin-and-range-like geology by electromagnetic methods: A powerful aid to seismic. Geophys. Prospect. 1996, 44, 1019–1040. [Google Scholar] [CrossRef]
- Descloitres, M.; Guérin, R.; Albouy, Y.; Tabbagh, A.; Ritz, M. Improvement in TDEM sounding interpretation in presence of induced polarization. A case study in resistive rocks of the Fogo volcano, Cape Verde Islands. J. Appl. Geophys. 2000, 45, 1–18. [Google Scholar] [CrossRef]
- McNeill, J. Principles and Application of Time Domain Electromagnetic Techniques for Resistivity Sounding; Geonics: Mississauga, ON, Canada, 1994. [Google Scholar]
- Schmutz, M.; Guérin, R.; Maquaire, O.; Descloitres, M.; Schott, J.-J.; Albouy, Y. Apport de l’association des méthodes TDEM (Time-Domain Electromagnetism) et électrique pour la connaissance de la structure du glissement-coulée de Super Sauze (bassin de Barcelonnette, Alpes-de-Haute-Provence, France). Comptes Rendus l’Acad. Sci. Ser. IIA-Earth Planet. Sci. 1999, 328, 797–800. [Google Scholar] [CrossRef]
- AEMR. Applied Electromagnetic Research: Manual for Tem-Fast ProSystem; AEMR: Utrecht, The Netherlands, 1997; 62p. [Google Scholar]
- McNeill, J. Electromagnetic Terrain Conductivity Measurement at Low Induction Numbers; Technical note; Geonics: Mississauga, ON, Canada, 1980. [Google Scholar]
- Nabighian, M. Electromagnetic Methods in Applied Geophysics; Society of Exploration Geophysicists: Tulsa, OK, USA, 1989. [Google Scholar]
- Hördt, A.; Hauck, C. Electromagnetic methods. In Applied Geophysics in Periglacial Environments; Cambridge University Press: Cambridge, UK, 2008; pp. 28–56. [Google Scholar]
- Dunn, K.-J.; Bergman, D.J.; LaTorraca, G.A. Nuclear Magnetic Resonance: Petrophysical and Logging Applications; Elsevier: Amsterdam, The Netherlands, 2002; Volume 32. [Google Scholar]
- Legchenko, A.; Valla, P. Removal of power-line harmonics from proton magnetic resonance measurements. J. Appl. Geophys. 2003, 53, 103–120. [Google Scholar] [CrossRef]
- Perttu, N. Assessment of Hydrogeological and Water Quality Parameters, using MRS and VES in the Vientiane Basin, Laos. Ph.D. Thesis, Luleå tekniska universitet, Luleå, Sweden, 2008. [Google Scholar]
- Briggs, I.C.J.G. Machine contouring using minimum curvature. Geophysics 1974, 39, 39–48. [Google Scholar] [CrossRef]
- El Assel, N.; Kchikach, A.; Durlet, C.; AlFedy, N.; El Hariri, K.; Charroud, M.; Jaffal, M.; Jourani, E.; Amaghzaz, M.J.E.G. Mise en évidence d’un Sénonien gypseux sous la série phosphatée du bassin des Ouled Abdoun: Un nouveau point de départ pour l’origine des zones dérangées dans les mines à ciel ouvert de Khouribga, Maroc. Estud. Geol. 2013, 69, 47–70. [Google Scholar] [CrossRef]
- Michard, A.; Saddiqi, O.; Chalouan, A.; de Lamotte, D.F. Continental Evolution: The Geology of Morocco: Structure, Stratigraphy, and Tectonics of the Africa-Atlantic-Mediterranean Triple Junction; Springer: Berlin/Heidelberg, Germany, 2008; Volume 116. [Google Scholar]
- El Kiram, N.; Kchikach, A.; Jaffal, M.; El Azzab, D.; El Ghorfi, M.; Khadiri, O.; Jourani, E.-S.; Manar, A.; Nahim, M.J.C.R.G. Phosphatic series under Plio-Quaternary cover of Tadla Plain, Morocco: Gravity and seismic data. Comptes Rendus Geosci. 2019, 351, 420–429. [Google Scholar] [CrossRef]
- El Kiram, N.; Kchikach, A.; Jaffal, M.; Pena, J.A.; Teixido, T.; Guerin, R.; Khadiri Yazami, O.; Jourani, E. Les Dérangements de la série Phosphatée Dans le District Minier de Khouribga (Maroc): Une Esquisse de Leur Origine et de Leurs Méthodes de Cartographie Sous Couverture Quaternaire; Géologues: Revue Officielle de la Société Géologique de France: Paris, France, 2017; p. 194. [Google Scholar]
- Kchikach, A.; Elassel, N.; Gurein, R.; Teixido, T.; Pena, J.; Jaffal, M. TDEM and EM31 Methods for Detecting Sterile Bodies in the Phosphatic Bearing of Sidi Chennane (Morocco). In Proceedings of the Near Surface Geoscience 2012—18th European Meeting of Environmental and Engineering Geophysics, Paris, France, 3–5 September 2012. [Google Scholar]
- Kchikach, A.; Jaffal, M.; Aïfa, T.; Bahi, L. Cartographie de corps stériles sous couverture quaternaire par méthode de résistivités électriques dans le gisement phosphaté de Sidi Chennane (Maroc). Comptes Rendus Geosci. 2002, 334, 379–386. [Google Scholar] [CrossRef]
© 2020 by the authors. Licensee MDPI, Basel, Switzerland. This article is an open access article distributed under the terms and conditions of the Creative Commons Attribution (CC BY) license (http://creativecommons.org/licenses/by/4.0/).