Abstract
The main objective of this research was the determination of the geochemical and mineralogical properties of particulate matter: TSP (total suspended particles) and, especially PM1 (particles with aerodynamic diameter not greater than 1 µm) suspended in the air of a selected urban area in southern Poland. Identification of the emission sources of metals and metalloids bound in TSP and PM1 as well as the assessment of potential risk of urban ambient air to human health using hazard indices was an additional aim of this investigation. The daily TSP and PM1 quartz fiber filters collected during heating season were subjected to mass magnetic susceptibility (χ) measurements, SEM (Scanning Electron Microscopy) observations and geochemical analyses. Obtained results revealed that the concentration of TSP and PM1 well correlated with their mass-specific magnetic susceptibility. The good relationship between the PM concentration and χ suggests that magnetic susceptibility measurements can be a good proxy of low-level atmospheric dust pollution. The rank order of potentially toxic elements (PTE) based on average concentration was Ba > Zn > Al > Fe > Pb > Mn > Ti > Cu > Cr > Ni >As > Cd > V > Tl, both for TSP and PM1. PM1/TSP ratios for PTE concentrations and χ were around or slightly above unity, which indicated that PM1 was the main carrier of PTE (with the exception of cadmium, copper and lead) and technogenic magnetic particles. The non-carcinogenic and carcinogenic risks were confirmed by very high values of human health indices.
1. Introduction
Human activities contribute to the air pollution, especially in industrial and urban areas. Airborne particulate matter (PM), consisting of a mixture of solid and liquid particles suspended in the air, varies in terms of physical properties (shape, dimension, density) and chemical composition [1,2,3]. As a result of atmospheric deposition, metals migrate to water and soil, where they can be taken up by plants and animals and further transferred through the food chain directly into humans. Once released into the environment, metals are continuously undergoing physical and chemical transformations that affect the forms of their occurrence and determine their toxicity. Currently observed changes in the structure of particulate matter emission into the air [4], involving a significant reduction in coarse particles (emitted mainly from industrial sources) and an increase in ultrafine particles (combustion by car engines) allow us to conclude that the actual environmental pollution by metals is primarily caused by the smallest particles. The finer particles the deeper penetration into the human tissues thus the stronger and more dangerous health impact [5], since they penetrate deep into the lungs and deposit on the respiratory tract at an increasing rate [6]. In nasal-breathing, coarse PM 10 fraction settles quickly and tends to lodge in the trachea (upper throat) or in the bronchi causing sneezing and coughing [7]. Particles smaller than 10 μm are deposited in the tracheobronchial tree, the respiratory bronchioles and the alveoli [8]. These particles can penetrate the lung and escape into the blood stream to cause significant health problems [9]. Particles smaller than PM2.5 tend to possess a higher radical generating capacity than larger ones [10]. Particles smaller than 1 μm behaving similar to gas molecules can penetrate down to the alveoli (deposition by diffusion forces) and translocate further into the cell tissue and/or circulation system [11].
Previous studies indicate that environmental magnetism methods can be used to estimate the quantity, distribution, range and source of environmental pollution [12,13,14,15,16,17,18] due to magnetic properties of Fe-rich PM derived from industrial and urban activities, fossil fuel combustion, vehicle emission and other anthropogenic as well as natural sources. It is well known that such magnetic particles are excellent absorbers and carriers of heavy metals and other pollutants due to their large specific surface area. The Cu, Pb and Zn were absorbed onto the surface of magnetite like minerals or incorporated into the structure of hematite [19,20,21]. The Fe-rich particles being a component of PM and originating from atmospheric pollution were detected as a deposit on topsoils, plants (especially tree leaves) and other surfaces by means of reliable, simple and quick magnetic susceptibility measurements [22,23,24,25,26,27,28,29,30,31]. Several studies are concerned with the application of magnetic methods in order to characterize industrial or street dust samples [32,33,34,35], while some authors used bioindicators (as tree leaves, lichens, mosses or spider webs) for air pollution monitoring [28,29,36,37,38] and filters from the air monitoring stations [39,40,41,42]. In this case, an empirical linear correlation was found between the magnetic susceptibility of filters from air-monitoring stations and the PM10 (particles with aerodynamic diameter not greater than 10 µm) and TSP (total suspended particles) concentrations as well [39,40]. Moreover, the magnetic properties of PM2.5 (particles with aerodynamic diameter not greater than 2.5 µm) and PM10 show significant seasonal patterns and weekly cycles [42]. Górka-Kostrubiec et al. [43] discovered a relationship between monthly magnetic susceptibility and temperature and absolute humidity which tend to correlate positively in the cold periods and negatively in warm months of the year. Actually, magnetic characterization was determined for particles with aerodynamic diameter not greater than 2.5 and 10 µm, using standard PM filters. Previous investigations on PM1 have concerned chemical composition, origin and meteorological dependence [44,45,46,47,48].
This is one of the first studies in which PM1 filters were subjected to such diverse analyses, and its most innovative feature is the estimation of non-carcinogenic and carcinogenic risk assessment for selected elements in TSP and, especially, PM1. Therefore, the determination of the geochemical and mineralogical properties of particulate matter (TSP and especially PM1) suspended in the air of a selected urban area in southern Poland was the aim of this preliminary research. Measurements of magnetic susceptibility as a proxy for atmospheric pollution collected on filters were carried out in order to test the applicability of this method in air pollution monitoring. Moreover, finding similarities and differences in the particle size, morphology and chemical composition between emitted dusts, fly ashes and airborne PM will be the basis for the identification of the emission sources of metals and metalloids bound to TSP and PM1. The assessment of potential risk of urban ambient air to human health using hazard indices was also an objective of this investigation.
2. Materials and Methods
The study area was located in the very urbanized and industrialized city of Zabrze (southern Poland, Silesia Conurbation) (Figure 1), adjacent to Bytom, Gliwice and Ruda Slaska, all known from their coking plants, steel mills and mines. The geological structure of this area is dominated by various sedimentary rocks (sandstones, conglomerates, limestones, marls, etc.) with numerous mineral resources: hard coal, zinc, lead and iron ores. In the close neighborhood of the sampling site (an air-quality monitoring station) a trunk road, blocks of flats and residential houses (heated with poor-quality stoves, qualitatively bad coal, and even garbage), and city center with commercial buildings are located. The monitoring station is located in a transformed area, on technogenic soil covered with grass. The TSP and PM1 were collected on quartz fiber filters (Whatman, UK, Ø 47 mm) during heating season, between 24 October 2018 and 17 January 2019. The impactor PNS3D15/LVS3D worked at the flow rate of 2.3 m3/h.
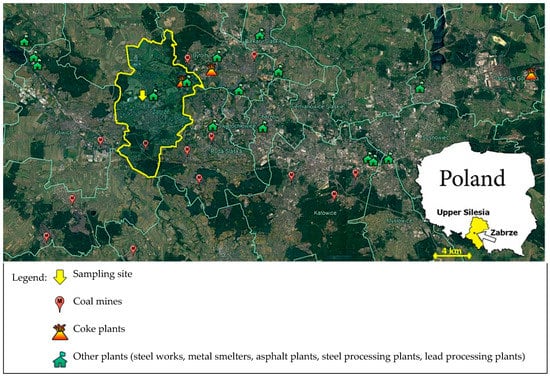
Figure 1.
Location of the air-quality monitoring station in Zabrze (Poland).
The collected 70 filters of daily retained PM1 (35 filters) and TSP (35 filters) were divided by means of a guillotine specially designed for this purpose and adapted to the diameter of the filters and then weighted. One part of them was subjected to the non-destructive volumetric magnetic susceptibility (ĸ) measurements using an MFK1 Kappabridge device (Agico Advanced Geoscience Instruments Co., Brno, Czech Republic) that operated at a low frequency (976 Hz) and low magnetic field intensity (200 A·m−1). In order to ensure the exact positioning of the specimen, each filter was placed in the 10 mL cylindrical bottle (originally assigned for the Bartington MS2B device, Bartington Instruments Ltd., Witney, UK) which afterwards was placed in the central bottom of the plastic vessel of MFK1 for specimen fragments for use in static measurement mode (KLY VES40). Each sample was measured five times at least, and the mean value was calculated. Subsequently, the mass-specific magnetic susceptibility (χ, m3/kg) was computed by taking into account the weight of the sample as well as the mass and the χ (−0.02 × 10⁻⁸ m3/kg) of the clean filters.
Afterwards, SEM/EDS analysis was carried out at the Institute of Earth Science, Faculty of Natural Sciences of University of Silesia in Katowice. Industrial dusts and fly ash samples from neighboring industrial emission sources collected directly at the source (power and metallurgical plants) were analyzed using a scanning electron microscope Philips XL30 ESEM/TMP equipped with an EDAX EDS Sapphire system, detectors: SE, BSE and EDS. This microscope can work in the environmental mode, i.e., it enables analyses to be carried out without the need to spray the sample with a conductive layer, e.g., carbon (metallurgical dusts). Electrifying fly ashes were dusted with a thin layer of carbon and analyzed in the high vacuum mode. Magnifications from several to several thousand times were used, and the voltage accelerating the beam was 15 keV.
TSP/PM1 filters were analyzed using a Quanta 250 scanning microscope with Thermo-Fisher EDS Ultra Dry analyzer (Thermo Fisher Scientific Inc., Waltham, MA, USA). BSE images were recorded, in which, apart from the habit and grain size, the chemical composition variation was visible both between and within the sample grains. EDS microanalysis was performed at selected sample points to determine the chemical composition of the grains present in the samples.
The second parts of the filters were digested in a mixture of nitric acid and hydrogen peroxide solution in microwave oven in order to determine total content of the following elements, in majority considered as potentially toxic (PTE): V, Mn, Ni, Cu, Zn, As, Cd, Tl, Pb, Cr, Ti and Al using High-Resolution Inductive Coupled Plasma-Mass Spectrometry (HR-ICP-MS, 6100 DRC-e Perkin Elmer, Waltham, MA, USA). Iron content was determined by Inductively Coupled Plasma Optical Emission Spectroscopy (ICP-OES; Avio 200 Perkin Elmer, Waltham, MA, USA).
The homogeneity of the loaded halves of filters was previously examined by the magnetic susceptibility measurements of experimental three filters (six halves). Obtained results varied from 51.25 to 61.32 × 10⁻⁸ m3/kg (mean 57.54 × 10⁻⁸ m3/kg). The favorable low relative error (7.9%) indicates the homogeneity of the collected material and the possibility of using filter halves for further analyses. Sysalová et al. [49] tested homogeneity of divided filters in determination of trace elements in airborne particulate matter and they yielded sufficiently homogenous results (errors for particular elements between 1.7% and 12.5%).
The potential health impacts associated with environmental exposures to inhaled contaminants were estimated on the basis of USEPA’s guidance [50]. The non-carcinogenic risk assessment (mutagenicity, neurotoxicity, developmental and reproductive toxicity) posed by As, Cd, Cr, Ni, Pb and Mn and carcinogenic one posed by As, Cd, Cr and Ni (classified as class 1 carcinogenic agents) [51] were determined by their hazard quotient (HQ) and carcinogenic risk (CR), respectively [52,53]. The hazard quotient (HQ) was computed as the ratio of the exposure concentration of the inhalable chemical (EC) to a reference concentration (RfC) meaning an estimate of a continuous inhalation exposure to the human population (including sensitive subgroups) that is likely to be without an appreciable risk of deleterious effects during a lifetime USEPA [54]. RfC values for As, Cd, Cr, Ni, Pb and Mn were as follows: 0.000015, 0.00001, 0.0001, 0.00009, 0.008 and 0.003 mg/m3, respectively:
HQ = EC/(RfC × 1000 µg/mg)
The carcinogenic risks (CR) were computed by multiplying the exposure concentration of the inhalable chemical (EC) for the inhalation unit risk (IUR):
CR = EC × IUR,
Values of IUR were specified by USEPA [55]: 0.0043, 0.0018, 0.012, 0.00024 for As, Cd, Cr and Ni ((μg/m3)−1), respectively. EC was calculated according to the following equations [50]:
EC (µg/m3) = (C × ET × EF × ED)/AT.
All symbols concerning hazard parameters used in the above equations are explained in Table 1. To assess the overall potential non-cancer and cancer health risk caused by multiple compounds the hazard index (HI) was introduced as the sum of hazard quotients of individual elements [50]. In the present work HI values were calculated as follows:
HInon-cancer = ΣHQ = ECAs/RfCAs + ECCd/RfCCd + ECCr/RfCCr + ECNi/RfCNi + ECPb/RfCPb + ECMn/RfCMn
HIcancer = ΣCR = ECAs × IURAs + ECCd × IURCd + ECCr × IURCr + ECNi × IURNi

Table 1.
Hazard parameters used for calculating the inhalable chemical (EC) [50].
Hazard index values exceeding unity provides evidence that potential health effects may occur. Otherwise (HI < 1), it is assumed that the risk is at an acceptable level. Carcinogenic risk is the chance of an individual causing any kind of cancer from lifetime exposure to carcinogenic hazardous substances. The acceptable or tolerable risk for regulatory purposes is 1 × 10⁻⁶–1 × 10⁻⁴ [51].
The obtained results were analyzed using Microsoft Office Excel software and the package of Statistica for Windows, version 12 (StatSoft Polska Sp. z o.o., Kraków, Poland). The basic statistical functions of mean, median, standard deviation, as well as factor analysis were applied in order to interpret results and explain variations in the data. For data evaluation and presentation mean values of obtained results were used. As the data did not exhibit a normal distribution, a Spearman’s rank correlation coefficient was applied.
3. Results and Discussion
3.1. PM1/TSP Data Relationship
The TSP concentration averaged at 45.58 µg/m3 with a wide range of 4.67–150.60 µg/m3, while PM1 mean concentration was 29.88 µg/m3 with a range of 4.03–118.87 µg/m3 (Figure 2). The highest concentration of both PM fraction occurred on 7 November 2018. This remarkable increase in concentration of both PM fractions can be explained by the air temperature in the range of 7–18 °C and low wind speed (8–10 km/h) leading to temperature inversion creating a low atmospheric convection. This phenomenon causes the retention of pollutants within a height of 2–4 m from the ground [56]. A similar temporal distribution of PM1 and TSM (supported by a correlation coefficient of 0.83) was generally observed, although on some days (28 October 2018; 3 December 2018; 23 December 2018; 5 January 2019, 7 January 2019 and 17 January 2019) the mass concentration of both collected fractions were totally inverse, and that means high concentrations of TSP corresponded to low PM1 concentrations.
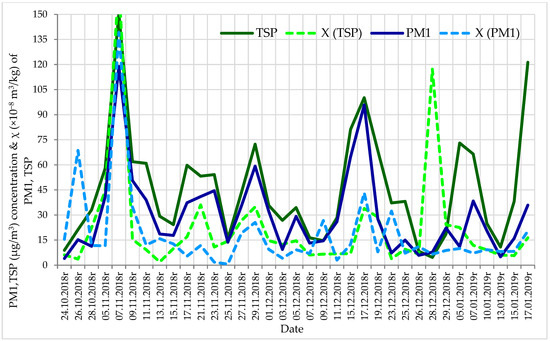
Figure 2.
Total suspended particles (TSP) and particles with aerodynamic diameter not greater than 1 µm (PM1) concentration (µg/m3) and mass-specific magnetic susceptibility (χ, ×10−8 m3/kg) of daily filters.
Moreover, the concentration of TSP and PM1 corresponded well with mass-specific magnetic susceptibility of the same fractions, suggesting higher concentration of technogenic magnetic particles (Fe-rich minerals) on days with increasing PM concentration (Figure 2). A similar relationship was observed for TSP collected in the city of Querétaro, where the magnetic susceptibility (χ) measurements of the filters showed a good linear correlation with the concentration of TSP (r = 0.928) [39]. In this study, the correlation coefficient was not that high and equaled 0.46 and 0.63 for TSP and PM1 concentrations, respectively. Nevertheless, on some days with high humidity (9–13 November 2018, 17–23 November 2018, 29 November 2018, 15–19 December 2018, 7 January 2019 and 17 January 2019) the inversion (foggy) phenomenon of negative correlation between the χ and TSP and PM1 concentrations was observed (Figure 2, Table 2). This phenomenon was recently described by Petrovský et al. [57], who studied the magnetic properties of particulate matter during smoggy period, obtaining negative correlation between saturation magnetization (concentration of ferrimagnetic iron oxides) and both PM1 and PM10 concentrations.
Table 2.
Meteorological data (as daily average) for study site in Zabrze.
The mass-specific magnetic susceptibility (χ) of collected daily filters varied from 2.0 to 168.1 × 10⁻⁸ m3/kg for TSP and from 0.7 to 139.2 × 10⁻⁸ m3/kg for PM1 (Figure 2, Figure 3 and Figure 4; Table 3). The mean and median values for the data were 22.4 and 12.4 × 10⁻⁸ m3/kg for TSP filters, and 18.3 and 11.1 × 10⁻⁸ m3/kg for PM1 samples (Table 3). These values were relatively low, in the range of rural background area obtained in Latium (Italy) by Sagnotti et al. [40], who for a high-traffic industrial area received an extremely high value of the χ above 1000 × 10−8 m3/kg. In presented case, the results of both fractions were quite similar, suggesting a comparable content of magnetic iron minerals in both TSP and respirable PM1. Simplifying, it seems that PM1 was the main carrier of most technogenic magnetic particles in the total aspirated dust. A high PM1/TSP ratio (Table 4) may indicate that the TSP is mostly influenced by the small size distribution sources such as combustion processes and secondary particles sources, while lower PM1/TSP ratio indicates that the TSP was mostly influenced by natural sources and mechanical processes generating larger particles, e.g., non-exhaust particles [58]. Similar results concerning the ratio between fine (PM2.5) and coarser (PM2.5–10) particular matter were reported for the industrial area of Beijng, China; however, the χ values were much higher [42].
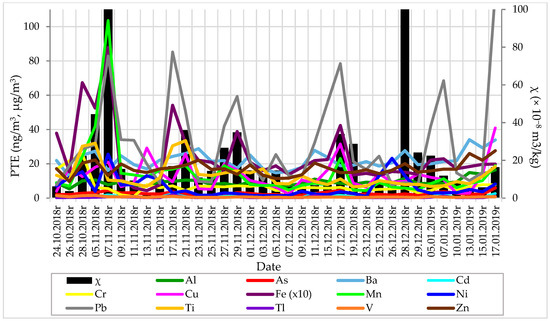
Figure 3.
Mass-specific magnetic susceptibility (χ) and concentration of PTE ((As, Cd, Cr, Cu, Fe [×10], Mn, Ni, Pb, Ti, Tl and V in ng/m3) and (Al, Ba and Zn in µg/m3)) in TSP daily filters.
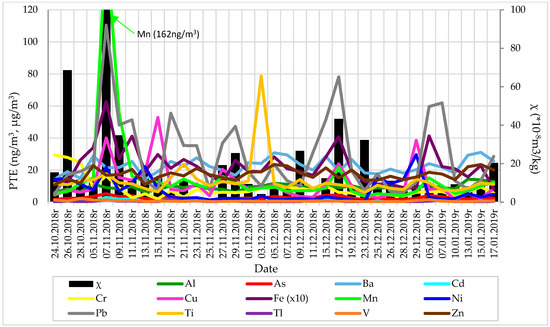
Figure 4.
Mass-specific magnetic susceptibility (χ) and concentration of PTE ((As, Cd, Cr, Cu, Fe [×10], Mn, Ni, Pb, Ti, Tl and V in ng/m3) and (Al, Ba and Zn in µg/m3)) in PM1 daily filters.
Table 3.
Descriptive statistics of magnetic susceptibility (χ) and concentration of PM (PM) and potentially toxic elements (nTSP = 35; nPM1 = 35).
Table 4.
Ratios of measured features between PM1 and TSP.
Generally, enhanced values of χ indicated that PM on filters may contain relevant amounts of Fe-rich particles originated probably from anthropogenic sources, but natural dusts and re-suspended soil may have also significant contribution to the magnetic properties. Previous studies have shown that the magnetic properties of airborne particles may be strongly associated with potentially toxic elements (PTE) [59,60,61,62].
3.2. Concentration of Potentially Toxic Elements and Their Source Apportionment
The total PTE concentrations (range, mean, median and standard deviation) determined in this study are summarized in Table 3 along with corresponding χ values. The rank order of PTE based on average concentration was Ba > Zn > Al > Fe > Pb > Mn > Ti > Cu > Cr > Ni >As > Cd > V > Tl, both for TSP and PM1 (with only exception: Mn occurred in higher concentration than Pb in PM1) (Table 3). Comparing the content of elements in TSP and PM1, it was observed that content of V, Mn, Ni, As, Tl, Cr, Ti, Ba and Al was slightly higher in PM1, but the daily variability of elemental concentrations in TSP and PM1 looks similar (Figure 3 and Figure 4).
Several days were characterized by much higher χ values and PTE concentrations (7 November 2018, 17 November 2018, 29 November 2018, 17 December 2018 and 17 January 2019). On these days, stagnant weather conditions and residual mists were noted, i.e., conditions that encourage concentration of pollutants by capturing particles and reducing the degree of their dispersion in the atmosphere [63].
Calculated averaged ratios between all PTE (mass concentration and χ) determined in PM1 and TSP were around or above unity (Table 4), which unequivocally indicated that, although PM1 exhibited lower mass concentration than TSP, it was a main carrier of PTE (with the exception of cadmium, copper and lead) and technogenic magnetic particles (expressed by higher values of magnetic susceptibility) as well. The computed empirical correlation coefficients between magnetic susceptibility of diurnal filters and the particular PTE were relatively high and statistically significant (0.34–0.99) for the majority of elements, suggesting that the largest part of magnetic minerals in particulate matter originates from anthropogenic combustion processes. From Spearman’s correlations presented in Table 5 and Table 6 we observed that in the case of TSP, magnetic susceptibility showed a significant correlation with As, Cd, Cu, Fe, Mn, Pb and Tl. In the case of PM1, magnetic susceptibility exhibited a significant positive correlation only with Cu and Mn. In addition, PM1 showed a negative significant correlation between magnetic susceptibility and Ba. Such a specific “negative” binding to very small particles can also be observed for Al and Zn. In case of TSP, no association with χ and Al, Ba and Zn was found. Therefore, in case of such elements as Al, Ba and Zn, magnetic susceptibility cannot be used as reliable proxy reflecting PTE concentration in PM filters.
Table 5.
Spearman’s rank correlation matrix for TSP (n = 35).
Table 6.
Spearman’s rank correlation matrix for PM1 (n = 35).
Correlated PTE could be related to a common source of emission; however, principal component analysis, a valuable multivariate statistical tool was applied as a complementary attempt of the anthropogenic origin assessment. Two main groups of components were separated in both TSP and PM1 (Figure 5). A distinct group consisting of Al, Ba and Zn was distinguished for both size fractions of PM. As the filters were collected in an urban area, high concentration of these elements, especially Ba and Zn, was probably due to the influence of tyre abrasion [64]. Moreover, Ba is a common component in automobile brake pads [65], as well as in diesel fuel as a smoke suppressant [66], but, in the case of Silesia, Ba originated from fly ashes of the coal used for heating [67,68]. These elements could be also related to fossil fuel combustion, but the influence of vehicular and industrial (non-ferrous metallurgy in short-distant Miasteczko Slaskie) emissions cannot be excluded [69,70].
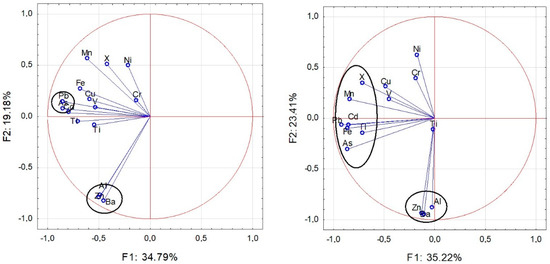
Figure 5.
PC1 vs. PC2 biplot of the investigated elements in TSP (left) and PM1 (right).
Simultaneously, Al along with Ti (and also Fe and Mn) are considered as crustal metals and their enhanced concentration can be an effect of road dust re-suspension and the local geology/soil composition [71,72]. The second TSP cluster was characterized by high loadings of As, Cd and Pb which may be related to coal combustion [73,74]. The rest of the elements in TSP have not been assigned to any of the clusters, indicating their diverse origin. While the second PM1 cluster was associated with χ, As, Cd, Fe, Mn, Pb and Tl, elements which are produced as a by-product of non-ferrous metal smelting and refining. Mn, Cd and Ni may be associated with exhaust emissions [74,75,76]. Furthermore, such elements as Pb, Zn, Cu, Cd, Cr and Ni in TSP and PM1 are the markers of diesel engine exhaust, oil combustion, tire and brake abrasion, brake wear debris and burning of lubricating oil [77,78,79].
3.3. Mineral and Morphological Characteristics of Dusts
The results of SEM observations confirmed the above-mentioned relationships between particular elements, showing that in both PM fractions natural fly ashes are mostly composed of silicate and carbonate minerals occur together with characteristic technogenic particles. Additionally, remarkably alike technogenic particles visible on SEM images of fly ashes from power plants as well as metallurgical dusts confirmed that they were sources of particles accumulated on filters (Figure 6 and Figure 7). Amorphous glass (mullit and quartz), quick coke, calcium sulfate and aluminosilicates with inclusions of spherical iron and manganese oxides were the main components of fly ashes (Figure 6A), while oxides of Fe, Zn, Ca and Mn with varied morphology (spherules, stamens, aggregates) were characteristic for metallurgical dusts (Figure 6B,C).
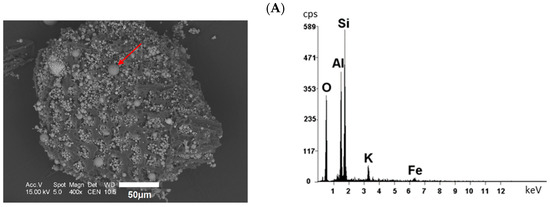
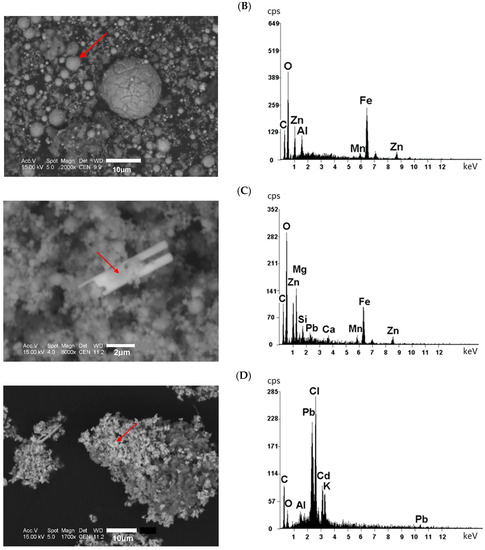
Figure 6.
SEM images and related EDS spectra of fly ashes from power plants (A), steel metallurgical dusts (B), metallurgical dust from dedusting (C), dusts after Pb, Zn ore smelting (D); red arrows show the points where presented EDS spectra have been performed (axes description: cps—counting per second; energy—keV).
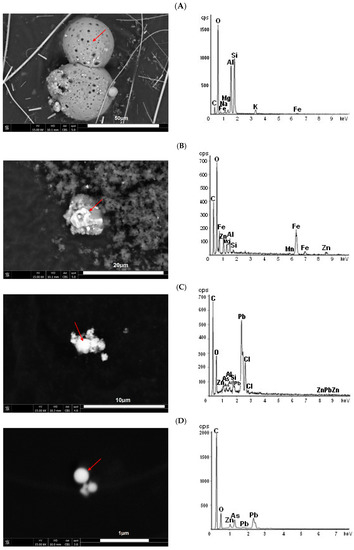
Figure 7.
SEM images and related EDS spectra of TSP filters (A–C) and PM1 filter (D); red arrows show the points where presented EDS spectra have been performed (axes description: cps—counting per second; energy—keV).
Dusts after smelting of Pb and Zn ores consisted of small rods and irregular beads of Pb and Zn oxides, chlorides and sulfates, often enriched with Cd (Figure 6D). The mineral composition of these dusts was reflected in dusts collected on the filters, both TSP and PM1, indicating their origin. Aluminosilicate glaze characteristic for fly ashes from combustion processes in power plants and combined heat and power plants were visible on SEM image of TSP filters (Figure 7A). In central parts of SEM of TSP particulate, an aggregate consisting of oxides containing Zn, Fe, Mg, Mn as well as Al and Si was detected (Figure 7B). The fine gray particles on Figure 6C and Figure 7B were soot aggregates. The composition of the particles in the PM1 (Figure 7D) containing Zn, As and Pb oxides corresponds to the dust of the non-ferrous metal industry. SEM observations showed the presence of metal chlorides in both industrial dust samples and those aspirated on filters (Figure 6B,D and Figure 7C).
3.4. Human Health Risk Assessment
The composition of PM strongly determines its toxicity. The majority of elements contained in TSP and PM1 have a very negative impact on human health, even in very small quantities, causing serious diseases, including cancer. Non-cancer effects of metals include effects on the neurological, cardiovascular, hematological, gastrointestinal, musculoskeletal, immunological and epidermal systems. Epidemiological research has found consistent and coherent associations between long-term exposure and various health outcomes, such as reduced lung function, respiratory symptoms, chronic bronchitis and cardiopulmonary mortality [11]. Analyzing values of HQ, CR and HI (Table 7), i.e., the possible adverse health impact on humans (adults) due to inhaled metals and metalloids of TSP and PM1, the PM1 fraction exhibited only a slightly higher risk. However, it should be taken into account that the basis for the calculation of HQ and CR was only the concentration of particular elements, but the particle size was not taken into consideration. Furthermore, the finer the dust fraction, the deeper the penetration of impurities in the respiratory system and then into the human blood system [5,6]. However, all obtained indices are extremely high and the highest HQ values were obtained for toxic As, followed by Cd > Cr = Ni > Mn > Pb for TSP. Taking into account PM1 fraction the decreasing order of HQ was As > Cr > Cd > Ni > Mn > Pb, whereas the CR value of Cr was almost ten times as high as that of other elements followed by Ni, As and Cd. Moreover, as the HI in the area of study exceeded unity by several times, the health hazard posed by TSP and PM1 is very high. The children are more endangered then adults, thus USEPA [50] recommends application of a 10-fold adjustment for exposures during the first 2 years of life and 3-fold adjustment for exposures from ages 2 to 16, when assessing adverse impact of inhaled PTE on children’s health. In this light, the non-cancer and cancer risk to children’s health seems to be extremely high.
Table 7.
Comparative results of non-carcinogenic (HQ) and carcinogenic risks (CR) due to human exposure to metals collected on TSP and PM1 filters.
4. Conclusions
Obtained results revealed that the concentration of TSP and PM1 well correlated with their mass-specific magnetic susceptibility. The good relationship between the PM concentration and χ suggests that magnetic susceptibility measurements can be a good proxy of low-level atmospheric dust pollution.
The difference in χ for TSP and PM1 was generally low, indicating a comparable content of magnetic minerals in both TSP and PM1. Thus, PM1 was the main carrier of technogenic magnetic particles in the total deposited dust. Generally, enhanced values of χ indicated an increased number of Fe-rich particles in PM filters, but obtained results concerning Fe concentration and its correlation with χ did not confirm this statement. Probably, a foggy weather condition occurring during almost the whole investigated period can be the reason for an unexpected negative correlation between magnetic susceptibility (concentration of ferrimagnetic iron oxides) and Fe concentration [57]. On the other hand, χ exhibited a positive and significant correlation with the majority of determined PTE in the case of TSP, but not for the PM1 fraction—Only with Cu, Mn, and a negative significant correlation with Ba. So, the other elements were linked to susceptibility when the particles were larger than 1 μm, as it happens for non-exhaust emissions. Comparing the content of chemical elements in TSP and PM1, it was observed that concentration of V, Mn, Ni, As, Tl, Cr, Ti, Ba and Al was slightly higher in PM1, but the daily variability of elemental concentrations in TSP and PM1 looked similar. PM1/TSP ratios for PTE concentrations and χ were around or slightly above unity, which indicated that PM1 was the main carrier of PTE (with the exception of cadmium, copper and lead) and technogenic magnetic particles.
Correlation matrices and principal component analyses were applied in order to determine the sources of dusts aspirated on filters. In the case of both PM fractions two main groups of components were separated. A distinct group consisting of Al, Ba and Zn was distinguished for both size fractions of PM. High concentration of these elements was probably due to the influence of tyre abrasion, and Ba most likely originated from fly ashes of the coal used for heating in the study area. The second TSP cluster was characterized by high loadings of As, Cd and Pb which may be related to coal combustion, while the second PM1 cluster was associated with χ, As, Cd, Fe, Mn, Pb and Tl, elements which are produced as a by-product of non-ferrous metal smelting and refining. Obviously, the influence originated from steel metallurgy and vehicular emissions, but also that from soil and road dust re-suspension should not be excluded. SEM images and results of EDS analysis confirmed the presence of particles and minerals characteristic for the above-mentioned sources.
Surprisingly, despite not very high values of magnetic susceptibility and the PTE concentration, the human health risk indices (cancer and non-carcinogenic) determined on the basis of PTE concentration were very high, which confirms the relevance of this study and suggests that they should be continued.
Author Contributions
Conceptualization, M.R. and W.R.-K.; methodology, W.R.-K. and M.J.; software, M.R., M.W., M.J. and W.R.-K.; validation, M.W., M.J. and P.R.-K.; formal analysis, M.R.; investigation, M.R., M.W., M.J. and P.R.-K.; resources, M.J. and P.R.-K.; data curation, M.J. and P.R.-K.; writing—original draft preparation, M.R.; writing—review and editing, M.R., M.J. and M.W.; visualization, M.R., M.J., M.W. and W.R.-K.;; supervision, M.R.; project administration, W.R.-K.; funding acquisition, W.R.-K. All authors have read and agreed to the published version of the manuscript.
Funding
This research was funded by National Science Centre of Poland in the frame of two research projects on the basis of the decision numbers: 2013/09/B/ST10/02227 and 2016/23/B/ST10/02789, both implemented by Consortium consisting of The Institute of Environmental Engineering, PAS in Zabrze and University of Silesia.
Acknowledgments
The authors thank Magdalena Kaczorowska from The Institute of Environmental Engineering for her involvement in the development of the analytical procedures and the meticulousness in performing chemical analyses. The valuable comments and suggestions for the improvement of the manuscript quality made by reviewers are gratefully acknowledged.
Conflicts of Interest
The authors declare no conflict of interest.
References
- Davidson, C.I.; Phalen, R.F.; Solomon, P.A. Airborne Particulate Matter and Human Health: A Review. Aerosol Sci. Tech. 2005, 39, 737–749. [Google Scholar] [CrossRef]
- Gaita, S.M.; Boman, J.; Gatari, M.J.; Wagner, A.; Jonsson, S.K. Characterization of Size-Fractionated Particulate Matter and Deposition Fractions in Human Respiratory System in a Typical African City: Nairobi, Kenya. Aerosol Air Qual. Res. 2016, 16, 2378–2385. [Google Scholar] [CrossRef]
- Rogula-Kozłowska, W. Size-segregated urban particulate matter: Mass closure, chemical composition, and primary and secondary matter content. Air Qual. Atmos. Health 2016, 9, 533–550. [Google Scholar] [CrossRef]
- Rogula-Kozłowska, W. Traffic-generated changes in the chemical characteristics of size-segregated urban aerosols. Bull. Environ. Contam. Toxicol. 2014, 93, 493–502. [Google Scholar] [CrossRef] [PubMed]
- Rattanavaraha, W.; Canagaratna, M.R.; Budisulistiorini, S.H.; Croteau, P.L.; Baumann, K.; Canonaco, F.; Prevot, A.S.H.; Edgerton, E.S.; Zhang, Z.F.; Jayne, J.T.; et al. Source apportionment of submicron organic aerosol collected from Atlanta, Georgia, during 2014–2015 using the aerosol chemical speciation monitor (ACSM). Atmos. Environ. 2017, 167, 389–402. [Google Scholar] [CrossRef]
- Sah, D.; Verma, P.K.; Kandikonda, M.K.; Lakhani, A. Pollution characteristics, human health risk through multiple exposure pathways, and source apportionment of heavy metals in PM10 at Indo-Gangetic site. Urban Clim. 2019, 27, 149–162. [Google Scholar] [CrossRef]
- Atkinson, R.W.; Fuller, G.W.; Anderson, H.R.; Harrison, R.M.; Armstrong, B. Urban ambient particle metrics and health: A time-series analysis. Epidemiol 2010, 21, 501–511. [Google Scholar] [CrossRef]
- Löndahl, J.; Massling, A.; Pagels, J.; Swietlicki, E.; Vaclavik, E.; Loft, S. Size-resolved respiratory-tract deposition of fine and ultrafine hydrophobic and hygroscopic aerosol particles during rest and exercise. Inhal. Toxicol. 2007, 19, 109–116. [Google Scholar] [CrossRef]
- Fu, M.; Zheng, F.; Xu, X.; Niu, L. Advances of study on monitoring and evaluation of PM2.5 pollution. Meteorol. Disaster Reduc. Res. 2011, 34, 1–6. [Google Scholar]
- Li, N.; Sioutas, C.; Cho, A.; Schmitz, D.; Misra, C.; Sempf, J.; Wang, M.; Oberley, T.; Froines, J.; Nel, A. Ultrafine particulate pollutants induce oxidative stress and mitochondrial damage. Environ. Health Perspect. 2003, 111, 455–460. [Google Scholar] [CrossRef]
- Valavanidis, A.; Fiotakis, K.; Vlachogianni, T. Airborne particulate matter and human health: Toxicological assessment and importance of size and composition of particles for oxidative damage and carcinogenic mechanisms. J. Environ. Sci. Health C 2008, 26, 339–362. [Google Scholar] [CrossRef] [PubMed]
- Chaparro, M.A.E.; Lavornia, J.M.; Chaparro, M.A.E.; Sinito, A.M. Biomonitors of urban air pollution: Magnetic studies and SEM observations of corticolous foliose and microfoliose lichens and their suitability for magnetic monitoring. Environ. Pollut. 2013, 172, 61–69. [Google Scholar] [CrossRef] [PubMed]
- Jeleńska, M.; Górka-Kostrubiec, B.; Werner, T.; Kądziałko-Hofmokl, M.; Szczepaniak-Wnuk, I.; Gonet, T.; Szwarczewski, P. Evaluation of indoor/outdoor urban air pollution by magnetic, chemical and microscopic studies. Atmos. Pollut. Res. 2017, 8, 754–766. [Google Scholar] [CrossRef]
- Jordanova, D.; Jordanova, N.; Lanos, P.; Petrov, P.; Tsacheva, T. Magnetism of outdoor and indoor settled dust and its utilization as a tool for revealing the effect of elevated particulate air pollution on cardiovascular mortality. Geochem. Geophys. Geosyst. 2012, 13, Q08Z49. [Google Scholar] [CrossRef]
- Kusza, G.; Hulisz, P.; Łęczyński, L.; Michalski, A.; Dąbrowski, M.; Kłostowska, Ż. Application of magnetic susceptibility measurements for identification of technogenic horizons in soil profiles on the example of the Vistula river cross-cut area. In Magnetometry in Environmental Sciences, 1st ed.; Jeleńska, M., Łęczyński, L., Ossowski, T., Eds.; GeoPlanet: Earth and Planetary Sciences; Springer: Cham, Switzerland, 2018; pp. 65–78. [Google Scholar] [CrossRef]
- Petrovský, E.; Ellwood, B. Magnetic monitoring of air, land and water pollution. In Quaternary Climates, Environment and Magnetism; Maher, B.A., Thompson, R., Eds.; Cambridge University Press: Cambridge, UK, 1999; pp. 279–322. [Google Scholar]
- Rachwał, M.; Kardel, K.; Magiera, T.; Bens, O. Application of magnetic susceptibility in assessment of heavy metal contamination of Saxonian soil (Germany) caused by industrial dust deposition. Geoderma 2017, 295, 10–21. [Google Scholar] [CrossRef]
- Szuszkiewicz, M.; Magiera, T.; Kapička, A.; Petrovský, E.; Grison, H.; Gołuchowska, B. Magnetic characteristics of industrial dust from different sources of emission: A case study of Poland. J. Appl. Geophy. 2015, 116, 84–92. [Google Scholar] [CrossRef]
- Hoffmann, V.; Knab, M.; Appel, E. Magnetic susceptibility mapping of roadside pollution. J. Geochem. Explor. 1999, 66, 313–326. [Google Scholar] [CrossRef]
- Kapička, A.; Jordanova, N.; Petrovský, E.; Podrázský, V. Magnetic study of weakly contaminated forest soils. Water Air Soil Pollut. 2003, 148, 31–44. [Google Scholar] [CrossRef]
- Petrovský, E.; Kapička, A.; Jordanova, N.; Knab, M.; Hoffmann, V. Low-field magnetic susceptibility: A proxy method of estimating increased pollution of different environmental systems. Environ. Geol. 2000, 39, 312–318. [Google Scholar] [CrossRef]
- Chaparro, M.A.E.; Chaparro, M.A.E.; Marinelli, C.; Sinito, A.M. Multivariate techniques as alternative statistical tools applied to magnetic proxies for pollution: Cases of study from Argentina and Antarctica. Environ. Geol. 2008, 54, 365–371. [Google Scholar] [CrossRef]
- Jordanova, N. Soil Magnetism. Applications in Pedology, Environmental Science and Agriculture, 1st ed.; Elsevier: Amsterdam, The Netherlands, 2017; p. 466. [Google Scholar]
- Łukasik, A.; Gruba, P.; Magiera, T. Application of magnetometry to assess distribution of dust pollution in topsoil of under-crown area of Norway spruce (Picea abies Karst.) and European beech (Fagus sylvatica L.). Catena 2017, 150, 246–255. [Google Scholar] [CrossRef]
- Magiera, T.; Strzyszcz, Z.; Kapička, A.; Petrovsky, E. Discrimination of lithogenic and anthropogenic influences on topsoil magnetic susceptibility in Central Europe. Geoderma 2006, 130, 299–311. [Google Scholar] [CrossRef]
- Magiera, T.; Strzyszcz, Z.; Rachwał, M. Mapping particulate pollution loads using soil magnetometry in urban forests in the Upper Silesia Industrial Region, Poland. For. Ecol. Manag. 2007, 248, 36–42. [Google Scholar] [CrossRef]
- Magiera, T.; Jankowski, M.; Świtoniak, M.; Rachwał, M. Study of forest soils on an area of magnetic and geochemical anomaly in north-eastern Poland. Geoderma 2011, 160, 559–568. [Google Scholar] [CrossRef]
- Szönyi, M.; Sagnotti, L.; Hirt, A.M. A refined biomonitoring study of airborne particulate matter pollution in Rome, with magnetic measurements on Quercus Ilex tree leaves. J. Geophys. Res. 2008, 173, 127–141. [Google Scholar] [CrossRef]
- Sagnotti, L.; Taddeucci, J.; Winkler, A.; Cavallo, A. Compositional, morphological, and hysteresis characterization of magnetic airborne particulate matter in Rome, Italy. Geochem. Geophys. Geosyst. 2009, 10, Q08Z06. [Google Scholar] [CrossRef]
- Wawer, M.; Rachwał, M.; Kowalska, J. Impact of noise barriers on the dispersal of solid pollutants from car emissions and their deposition in soil. Soil Sci. Annu. 2017, 68, 19–26. [Google Scholar] [CrossRef]
- Zawadzki, J.; Fabijańczyk, P.; Magiera, T.; Rachwał, M. Geostatistical microscale study of magnetic susceptibility in soil profile and magnetic indicators of potential soil pollution. Water Air Soil Pollut. 2015, 226, 142. [Google Scholar] [CrossRef]
- Jordanova, D.; Jordanova, N.; Petrov, P. Magnetic susceptibility of road deposited sediments at a national scale-relation to population size and urban pollution. Environ. Pollut. 2014, 189, 239–251. [Google Scholar] [CrossRef]
- Magiera, T.; Jabłońska, M.; Strzyszcz, Z.; Rachwał, M. Morphological and mineralogical forms of technogenic magnetic particles in industrial dusts. Atmos. Environ. 2011, 45, 4281–4290. [Google Scholar] [CrossRef]
- Magiera, T.; Gołuchowska, B.; Jabłońska, M. Technogenic magnetic particles in alkaline dusts from power and cement plants. Water Air Soil Pollut. 2013, 224, 1389. [Google Scholar] [CrossRef] [PubMed]
- Wang, G.; Zeng, C.; Zhang, F.; Zhang, Y.; Scott, C.A.; Yan, X. Traffic-related trace elements in soils along six highway segments on the Tibetan Plateau: Influence factors and spatial variation. Sci. Total Environ. 2017, 581, 811–821. [Google Scholar] [CrossRef] [PubMed]
- Paoli, L.; Winkler, A.; Guttova, A.; Sagnotti, L.; Grassi, A.; Lackovicova, A.; Senko, D.; Loppi, S. Magnetic properties and element concentrations in lichens exposed to airborne pollutants released during cement production. Environ. Sci. Pollut. Res. 2017, 24, 12063–12080. [Google Scholar] [CrossRef]
- Rachwał, M.; Rybak, J.; Rogula-Kozłowska, W. Magnetic susceptibility of spider webs as a proxy of airborne metal pollution. Environ. Pollut. 2018, 234, 543–551. [Google Scholar] [CrossRef]
- Urbat, M.; Lehndorff, E.; Schwark, L. Biomonitoring of air quality in the Cologne conurbation using pine needles as a passive sampler. Part I: Magnetic properties. Atmos. Environ. 2004, 38, 3781–3792. [Google Scholar] [CrossRef]
- Castaneda-Miranda, A.G.; Böhnel, H.N.; Molina-Garza, R.S.; Chaparro, M.A.E. Magnetic evaluation of TSP-filters for air quality monitoring. Atmos. Environ. 2014, 96, 163–174. [Google Scholar] [CrossRef]
- Sagnotti, L.; Macrı, P.; Egli, R.; Mondino, M. Magnetic properties of atmospheric particulate matter from automatic air sampler stations in Latium (Italy): Toward a definition of magnetic fingerprints for natural and anthropogenic PM10 sources. J. Geophys. Res. 2006, 111, B12S22. [Google Scholar] [CrossRef]
- Saragnese, F.; Lanci, L.; Lanza, R. Nanometric sized atmospheric particulate studied by magnetic analyses. Atmos. Environ. 2011, 45, 450–459. [Google Scholar] [CrossRef]
- Shi, M.; Wu, H.; Zhang, S.; Li, H.; Yang, T.; Liu, W.; Liu, H. Weekly cycle of magnetic characteristics of the daily PM2.5 and PM2.5-10 in Beijing, China. Atmos. Environ. 2014, 98, 357–367. [Google Scholar] [CrossRef]
- Górka-Kostrubiec, B.; Król, E.; Jeleńska, M. Dependence of air pollution on meteorological conditions based on magnetic susceptibility measurements: A case study from Warsaw. Stud. Geophys. Geod. 2012, 56, 861–877. [Google Scholar] [CrossRef]
- Hassanvand, M.S.; Naddafi, K.; Faridi, S.; Arhami, M.; Nabizadeh, R.; Sowlat, M.H.; Pourpak, Z.; Rastkari, N.; Momeniha, F.; Kashani, H.; et al. Indoor/outdoor relationships of PM10, PM2.5, and PM1 mass concentrations and their water-soluble ions in a retirement home and a school dormitory. Atmos. Environ. 2014, 82, 375–382. [Google Scholar] [CrossRef]
- Pateraki, S.; Asimakopoulos, D.N.; Bougiatioti, A.; Maggos, T.; Mihalopoulos, N. Assessment of PM2.5 and PM1 chemical profile in a multiple-impacted Mediterranean urban area: Origin, sources and meteorological dependence. Sci. Total Environ. 2014, 479–480, 210–220. [Google Scholar] [CrossRef] [PubMed]
- Qiao, T.; Xiu, G.L.; Zheng, Y.; Yang, J.; Wang, L.; Yang, J.M.; Huang, Z.S. Preliminary investigation of PM1, PM2.5, PM10 and its metal elemental composition in tunnels at a subway station in Shanghai, China. Transp. Res. Part D 2015, 41, 136–146. [Google Scholar] [CrossRef]
- Zhang, Y.; Lang, J.; Cheng, S.; Li, S.; Zhou, Y.; Chen, D. Chemical composition and sources of PM1 and PM2.5 in Beijing in autumn. Sci. Total Environ. 2018, 630, 72–82. [Google Scholar] [CrossRef] [PubMed]
- Zhou, G.; Xu, J.; Gao, W.; Gu, Y.; Mao, Z.; Cui, L. Characteristics of PM1 over Shanghai, relationships with precursors and meteorological variables and impacts on visibility. Atmos. Environ. 2018, 184, 224–232. [Google Scholar] [CrossRef]
- Sysalová, J.; Kucera, J.; Kotlik, B.; Havranek, V. Quality control materials for the determination of trace elements in airborne particulate matter. Anal. Bioanal. Chem. 2002, 373, 195–199. [Google Scholar] [CrossRef] [PubMed]
- USEPA: US Environmental Protection Agency. Part F, Supplemental guidance for inhalation risk assessment. In Risk Assessment Guidance for Superfund Volume I: Human Health Evaluation Manual; Office of Superfund Remediation and Technology Innovation: Potomac Yards, VA, USA, 2009; p. 68. [Google Scholar]
- IARC: International Agency for Research on Cancer. Agents Classifed by the IARC Monographs. 2020. Available online: https://monographs.iarc.fr/list-of-classifications (accessed on 31 August 2020).
- Li, Y.; Zhang, Z.; Zhou, H.; Fan, Z.; Wu, D.; Xia, B. Characteristics, sources and health risk assessment of toxic heavy metals in PM2.5 at a megacity of southwest China. Environ. Geochem. Health 2016, 38, 353–362. [Google Scholar] [CrossRef]
- Zheng, J.; Zhan, C.; Yao, R.; Zhang, J.; Liu, H.; Liu, T.; Cao, J. Levels, sources, markers and health risks of heavy metals in PM2.5 over a typical mining and metallurgical city of Central China. Aerosol Sci. Eng. 2017, 2, 1–10. [Google Scholar] [CrossRef]
- USEPA. Integrated Risk Information System (IRIS) Glossary of Terms. 2008. Available online: http://www.epa.gov/iris/help_gloss.htm (accessed on 31 August 2020).
- USEPA. Integrated Risk Information System (IRIS); National Center for Environmental Assessment: Washington, DC, USA, 2002. [Google Scholar]
- Kalaiarasan, G.; Balakrishnan, R.M.; Sethunath, N.A.; Manoharan, S. Source apportionment studies on particulate matter (PM10 and PM2.5) in ambient air of urban Mangalore, India. J. Environ. Manag. 2018, 217, 815–824. [Google Scholar] [CrossRef]
- Petrovský, E.; Kapička, A.; Grison, H.; Kotlik, B.; Miturova, H. Negative correlation between concentration of iron oxides and particulate matter in atmospheric dust: Case study at industrial site during smoggy period. Environ. Sci. Eur. 2020. preprint. [Google Scholar] [CrossRef]
- Chen, G.; Morawska, L.; Zhang, W.; Li, S.; Cao, W.; Ren, H. Spatiotemporal variation of PM1 pollution in China. Atmos. Environ. 2018, 178, 198–205. [Google Scholar] [CrossRef]
- Hunt, A.; Jones, J.; Oldfield, F. Magnetic measurements and heavy metals in atmospheric particulates of anthropogenic origin. Sci. Total Environ. 1984, 33, 129–139. [Google Scholar] [CrossRef]
- Hay, K.L.; Dearing, J.A.; Baban, S.M.J.; Loveland, P.J. A preliminary attempt to identify atmospherically-derived pollutant particles in English topsoils from magnetic susceptibility measurements. Phys. Chem. Earth 1997, 22, 207–210. [Google Scholar] [CrossRef]
- Shu, J.; Dearing, J.A.; Morse, A.P.; Yu, L.; Yuan, N. Determining the sources of atmospheric particles in Shanghai, China, from magnetic and geochemical properties. Atmos. Environ. 2001, 35, 2615–2625. [Google Scholar] [CrossRef]
- Limo, J.; Paturi, P.; Mäkinen, J. Magnetic biomonitoring with moss bags to assess stop-and-go traffic induced particulate matter and heavy metal concentrations. Atmos. Environ. 2018, 195, 187–195. [Google Scholar] [CrossRef]
- Kumar, S. An Eulerian model for scavenging of pollutants by raindrops. Atmos. Environ. 1985, 19, 769–778. [Google Scholar] [CrossRef]
- Adachi, K.; Tainosho, Y. Characterization of heavy metal particles embedded in tire dust. Environ. Int. 2004, 30, 1009–1017. [Google Scholar] [CrossRef]
- Mosleh, M.; Blau, P.J.; Dumitrescu, D. Characteristics and morphology of wear particles from laboratory testing of disk brake materials. Wear 2004, 256, 1128–1134. [Google Scholar] [CrossRef]
- Lim, M.C.H.; Ayodo, G.A.; Morawska, L.; Ristovski, Z.D.; Jayaratne, E.R. The effects of fuel characteristics and engine operating conditions on the elemental composition of emissions from duty diesel buses. Fuel 2007, 86, 1831–1839. [Google Scholar] [CrossRef]
- Jablonska, M.; Janeczek, J.; Rietmeijer, F.J.M. Seasonal changes in the mineral compositions of tropospheric dust in the industrial region of Upper Silesia, Poland. Mineral. Mag. 2003, 67, 1231–1241. [Google Scholar] [CrossRef]
- Jablonska, M.; Rietmeijer, F.J.M.; Janeczek, J. Fine-grained barite in coal fly ash from the Upper Silesian Industrial Region. Environ. Geol. 2001, 40, 941–948. [Google Scholar] [CrossRef]
- Jablonska, M.; Janeczek, J. Identification of industrial point sources of airborne dust particles in an urban environment by a combined mineralogical and meteorological analyses: A case study from the Upper Silesian conurbation, Poland. Atmos. Pollut. Res. 2019, 10, 980–988. [Google Scholar] [CrossRef]
- Rogula-Kozłowska, W.; Majewski, G.; Czechowski, P.O. The size distribution and origin of elements bound to ambient particles: A case study of a Polish urban area. Environ. Monit Assess. 2015, 187, 240. [Google Scholar] [CrossRef]
- Querol, X.; Viana, M.; Alastuey, A.; Amato, F.; Moreno, T.; Castillo, S.; Pey, J.; De La Rosa, J.; Sanchez De La Campa, A.; Artinano, B.; et al. Source origin of trace elements in PM from regional background, urban and industrial sites of Spain. Atmos. Environ. 2007, 41, 7219. [Google Scholar] [CrossRef]
- Gholampour, A.; Nabizadeh, R.; Hassanvand, M.S.; Taghipour, H.; Rafee, M.; Alizadeh, Z. Characterization and source identification of trace elements in airborne particulates at urban and suburban atmospheRes. of Tabriz, Iran. Environ. Sci. Pollut. Res. 2016, 23, 1703–1713. [Google Scholar] [CrossRef] [PubMed]
- Duan, J.; Tan, J. Atmospheric heavy metals and arsenic in China: Situation, sources and control policies. Atmos. Environ. 2013, 74, 93–101. [Google Scholar] [CrossRef]
- Rajput, P.; Mandaria, A.; Kachawa, L.; Singh, D.K.; Singh, A.K.; Gupta, T. Chemical characterisation and source apportionment of PM1 during massive loading at an urban location in Indo-Gangetic Plain: Impact of local sources and long-range transport. Tellus B 2016, 516, 68. [Google Scholar] [CrossRef]
- Manoli, E.; Voutsa, D.; Samara, C. Chemical characterization and source identification/apportionment of fine and coarse air particles in Thessaloniki, Greece. Atmos. Environ. 2002, 36, 949–961. [Google Scholar] [CrossRef]
- Samara, C.; Voutsa, D. Size distribution of airborne particulate matter and associated heavy metals in the roadside environment. Chemosphere 2005, 59, 1197–1206. [Google Scholar] [CrossRef]
- Kuang, C.; Neumann, T.; Norra, S.; Stüben, D. Land use-related chemical composition of street sediments in Beijing. Environ. Sci. Pollut. Res. Int. 2004, 11, 73–83. [Google Scholar] [CrossRef]
- Kulshrestha, A.; Satsangi, P.G.; Masih, J.; Taneja, A. Metal concentration of PM2.5 and PM10 particles and seasonal variations in urban and rural environment of Agra, India. Sci. Total Environ. 2009, 407, 6196–6204. [Google Scholar] [CrossRef] [PubMed]
- Winkler, A.; Contardo, T.; Vannini, A.; Sorbo, S.; Basile, A.; Loppi, S. Magnetic Emissions from Brake Wear are the Major Source of Airborne Particulate Matter Bioaccumulated by Lichens Exposed in Milan (Italy). Appl. Sci. 2020, 10, 2073. [Google Scholar] [CrossRef]


© 2020 by the authors. Licensee MDPI, Basel, Switzerland. This article is an open access article distributed under the terms and conditions of the Creative Commons Attribution (CC BY) license (http://creativecommons.org/licenses/by/4.0/).