Article

Molybdenite Flotation in the Presence of a Polyacrylamide of Low Anionicity Subjected to Different Conditions of Mechanical Shearing

1
Department of Metallurgical Engineering, Universidad de Concepcion, 4070371 Concepción, Chile
2
Water Research Center for Agriculture and Mining (CRHIAM), University of Concepcion, 4070411 Concepción, Chile
*
Author to whom correspondence should be addressed.
Minerals 2020, 10(10), 895; https://doi.org/10.3390/min10100895
Submission received: 11 September 2020 / Revised: 29 September 2020 / Accepted: 6 October 2020 / Published: 9 October 2020
(This article belongs to the Special Issue Interactions of Chemical Reagents with Clay Minerals)

Abstract

:
Polyacrylamides (PAM) are used as flocculants in the copper-molybdenum mining industry to improve the settling rate of flotation tailings. These types of reagents are recirculated to flotation in the water that is recovered from the thickeners, and as a result of this practice they can cause depression of flotation of some important minerals such as molybdenite. The objective of this work was to study the effect of a PAM of 11.9% of degree of anionicity on the flotation of molybdenite. The effect of the anionic PAM on molybdenite flotation was studied under different levels (three) of flocculant mechanical shearing. The flotation data was discussed along with intrinsic viscosity, adsorption, induction time, and electrophoretic mobility measurements. It was found that the non-sheared PAM (NS–PAM) had the strongest depressing effect on molybdenite flotation, followed by the moderately sheared PAM (MS–PAM). The depressing effect of the strongly sheared PAM (SS–PAM) was negligible. The flotation data correlated with the induction time measurements that showed that molybdenite became more hydrophilic in the presence of the NS–PAM. The SS–PAM has no effect on the induction times. Further work is ongoing to understand the effect of PAM on molybdenite flotation in the presence of clay minerals and different aqueous media.

1. Introduction

A significant fraction of the process water used in Cu–Mo flotation plants corresponds to water recovered from thickeners and tailings dams. As a result of this operational practice, an important part of residual reagents dissolved in water are recirculated to flotation, causing flotation depression of some important minerals such as molybdenite [1]. Recycled water may contain slimes such as clay minerals, which can strongly affect the flotation of molybdenite as previously reported [2].
Polyacrylamides (PAM) are widely used flocculants in the mining industry [3], and Figure 1 shows the chemical structures of anionic (carboxylated and sulfonated), and cationic polyacrylamides. The main functional group in PAM is the amide group (Figure 1d), which form the polymer through a polyaddition process [4]. The ionic character and molecular weight of PAM can be achieved through copolymerization reactions to give them anionic or cationic character.
PAM have been used in mineral processing plants mainly as flocculants [5], but there are some studies that reported that PAM can act as depressing agents in some flotation applications [1]. It was reported that coal flotation can be strongly depressed by PAM due to modifications of the interfacial properties of the solid/liquid, and liquid/gas interfaces [6]. Hydroxamic PAM were also shown to depress pyrite flotation through chemical interactions with the mineral surfaces [7]. A cationic polyacrylamide (CPAM) was also tested as depressant to separate kaolinite and diaspore through reverse flotation using dodecyl amine as collector [8]. Hydrogen bonding and electrostatic interactions between the CPAM and the AlO surface sites on diaspore were proposed to explain adsorption. A modified low molecular weight PAM using carboxyl, sulfonate, and hydroxyl functional groups was successfully tested to depress pyrite flotation with low depression of activated sphalerite [9]. The use of a modified PAM by a xanthation modification was tested as pyrite depressant in the selective flotation of pyrite and copper-activated galena, showing good results [10]. Castro and Laskowski (2015) [1] summarize results related to the depressing effect of PAM on molybdenite flotation that indicated that these flocculants strongly depress molybdenite under both non-sheared and sheared conditions. Previous studies reported different means through which PAM can be degraded, e.g., mechanical, chemical, thermal, and biological degradation ([11] Yi et al., 2013). In the processing of copper and molybdenum ores, PAM may be strongly degraded by the mechanical action of pumps that recirculate water from thickeners to the grinding and flotation circuits. Therefore, the effect of mechanical shearing on PAM molecular conformation and as a result on the flotation of minerals such as molybdenite is of great interest today.
The objective of this work is to study the effect of an anionic PAM on the flotation of molybdenite. The effect of the anionic PAM on molybdenite flotation is studied under different levels (3) of flocculant mechanical shearing. The flotation data is discussed along with intrinsic viscosity, adsorption, induction time, and electrophoretic mobility measurements.

2. Materials and Methods

2.1. Samples and Reagents

Molybdenite was obtained from an industrial molybdenum concentrate of particle size range − 150 + 45 µm was used in the study. The original sample was cleaned using NaSH and acetone to eliminate flotation collectors and residual organic compounds. Then, molybdenite was purified by collectorless flotation (three stages) to remove impurities such as quartz and pyrite. Purified molybdenite was contacted with mili-Q water at different pH (6–11 adjusted with NaOH), and the liquid extracts were analyzed for Total Organic Carbon (TOC) to verify the absence of residual organic flotation reagents [2]. No presence of TOC was detected, which is interpreted as the absence of flotation reagents in the molybdenite sample. X-ray diffraction (XRD) measurements indicated that the purity of molybdenite was 99.34%, with 59.9% Mo and 40.1% S as measured by atomic absorption spectroscopy. The molybdenite sample was kept in a freezer at 1 °C in plastic bags sealed in the presence of nitrogen to reduce oxidation [2,12]. A highly pure (99.99% purity as indicated by the provider) anionic PAM was provided by SNF-Chile which was labeled as SNF2350. The sample was granular and white and was used as received. According to the provider, the PAM used in this work was a low-medium anionicity and high molecular weight polymer. Methyl isobutyl carbinol (MIBC) obtained from Merck was used as frother. Sodium hydroxide (NaOH) obtained from Merck was used as a pH modifier. A 0.01 M NaCl solution prepared using Milli-Q water of 18.2 MΩ∙cm at 25 °C and a chloride salt of sodium (Merck) was used as an aqueous medium in the tests.

2.2. PAM Preparation, Caracterization and Degradation

PAM preparation was done on a daily basis during the experimental program, following the procedure described by Arinaitwe (2008) [13]. Stock solutions at 0.35 g/L PAM were prepared by adding the flocculant into a 0.01M NaCl solution at a temperature of 20 °C. The procedure consisted of mixing 175 mg of PAM with 500 mL of solution in a beaker, and the resulting solution was agitated using a magnetic stirrer for 5 h to reach complete PAM dissolution. As described elsewhere, the beaker was covered with a parafilm and with an opaque lead to prevent exposure to light and degradation [13]. The stock solutions were used 8 h later for the experiments.
The degree of anionicity (DA) of the flocculant sample used in this work was determined through the method proposed by Arinaitwe (2008) [13]. In this method, an electroneutrality condition between the moles of sodium and the moles of carboxylic groups in the flocculant is assumed, thus one mole of carboxylic groups in the PAM is equivalent to a mole of sodium. Analyses of total organic carbon (TOC) and sodium (Na) of the PAM are needed and converted to moles and the degree of anionicity is determined from Equation (1).
D A   %   =   3 m o l e s   o f   N a m o l e s   o f   C × 100
Fourier transform infrared (FTIR) spectra were obtained using a Perkin-Elmer 2000 to characterize the PAM sample.
The effect of PAM on molybdenite flotation was evaluated considering three conditions of mechanical shearing, thus the flocculant was tested at three conditions, i.e., non-sheared PAM (NS–PAM), moderately sheared PAM (MS–PAM), and strongly sheared PAM (SS–PAM). Flocculant shearing was achieved using a 40 mm diameter bladed stirrer, which was inserted into 100 mL of a 0.35 g/L PAM fresh solution. The MS-PAM was obtained by shearing for 30 min at 500 rpm, and the SS–PAM was obtained by shearing for 3 h at 2,000 rpm.
Intrinsic viscosity ([η]) measurements were done to evaluate the degree of mechanical degradation of the flocculant. Equation (2), proposed by Fedors (1979) [14] and validated by Rao (1993) [15] and Ghimici and Popescu (1998) [16], was used to describe the viscosity of PAM.
1 2 η r e l 1 / 2 1   = 1 η c 1 η c m
where ηrel is relative viscosity (ηsolution/ηsolvent), c the polymer concentration, and cm a concentration parameter. Then, 1/[η] can be obtained from the slope of a plot of the term in the left side of Equation (2) vs 1/c. The intrinsic viscosity measurements were done following the procedure described by Conrad and Klein (1978) [17], which considered tests using a 0.5M NaCl solution at a temperature of 25 °C, and at natural pH. Solution viscosities (η) were measured using a Cannon-Fenske 200 viscometer (Cannon, State College, PA, USA) at different PAM concentrations.

2.3. Microflotation Tests

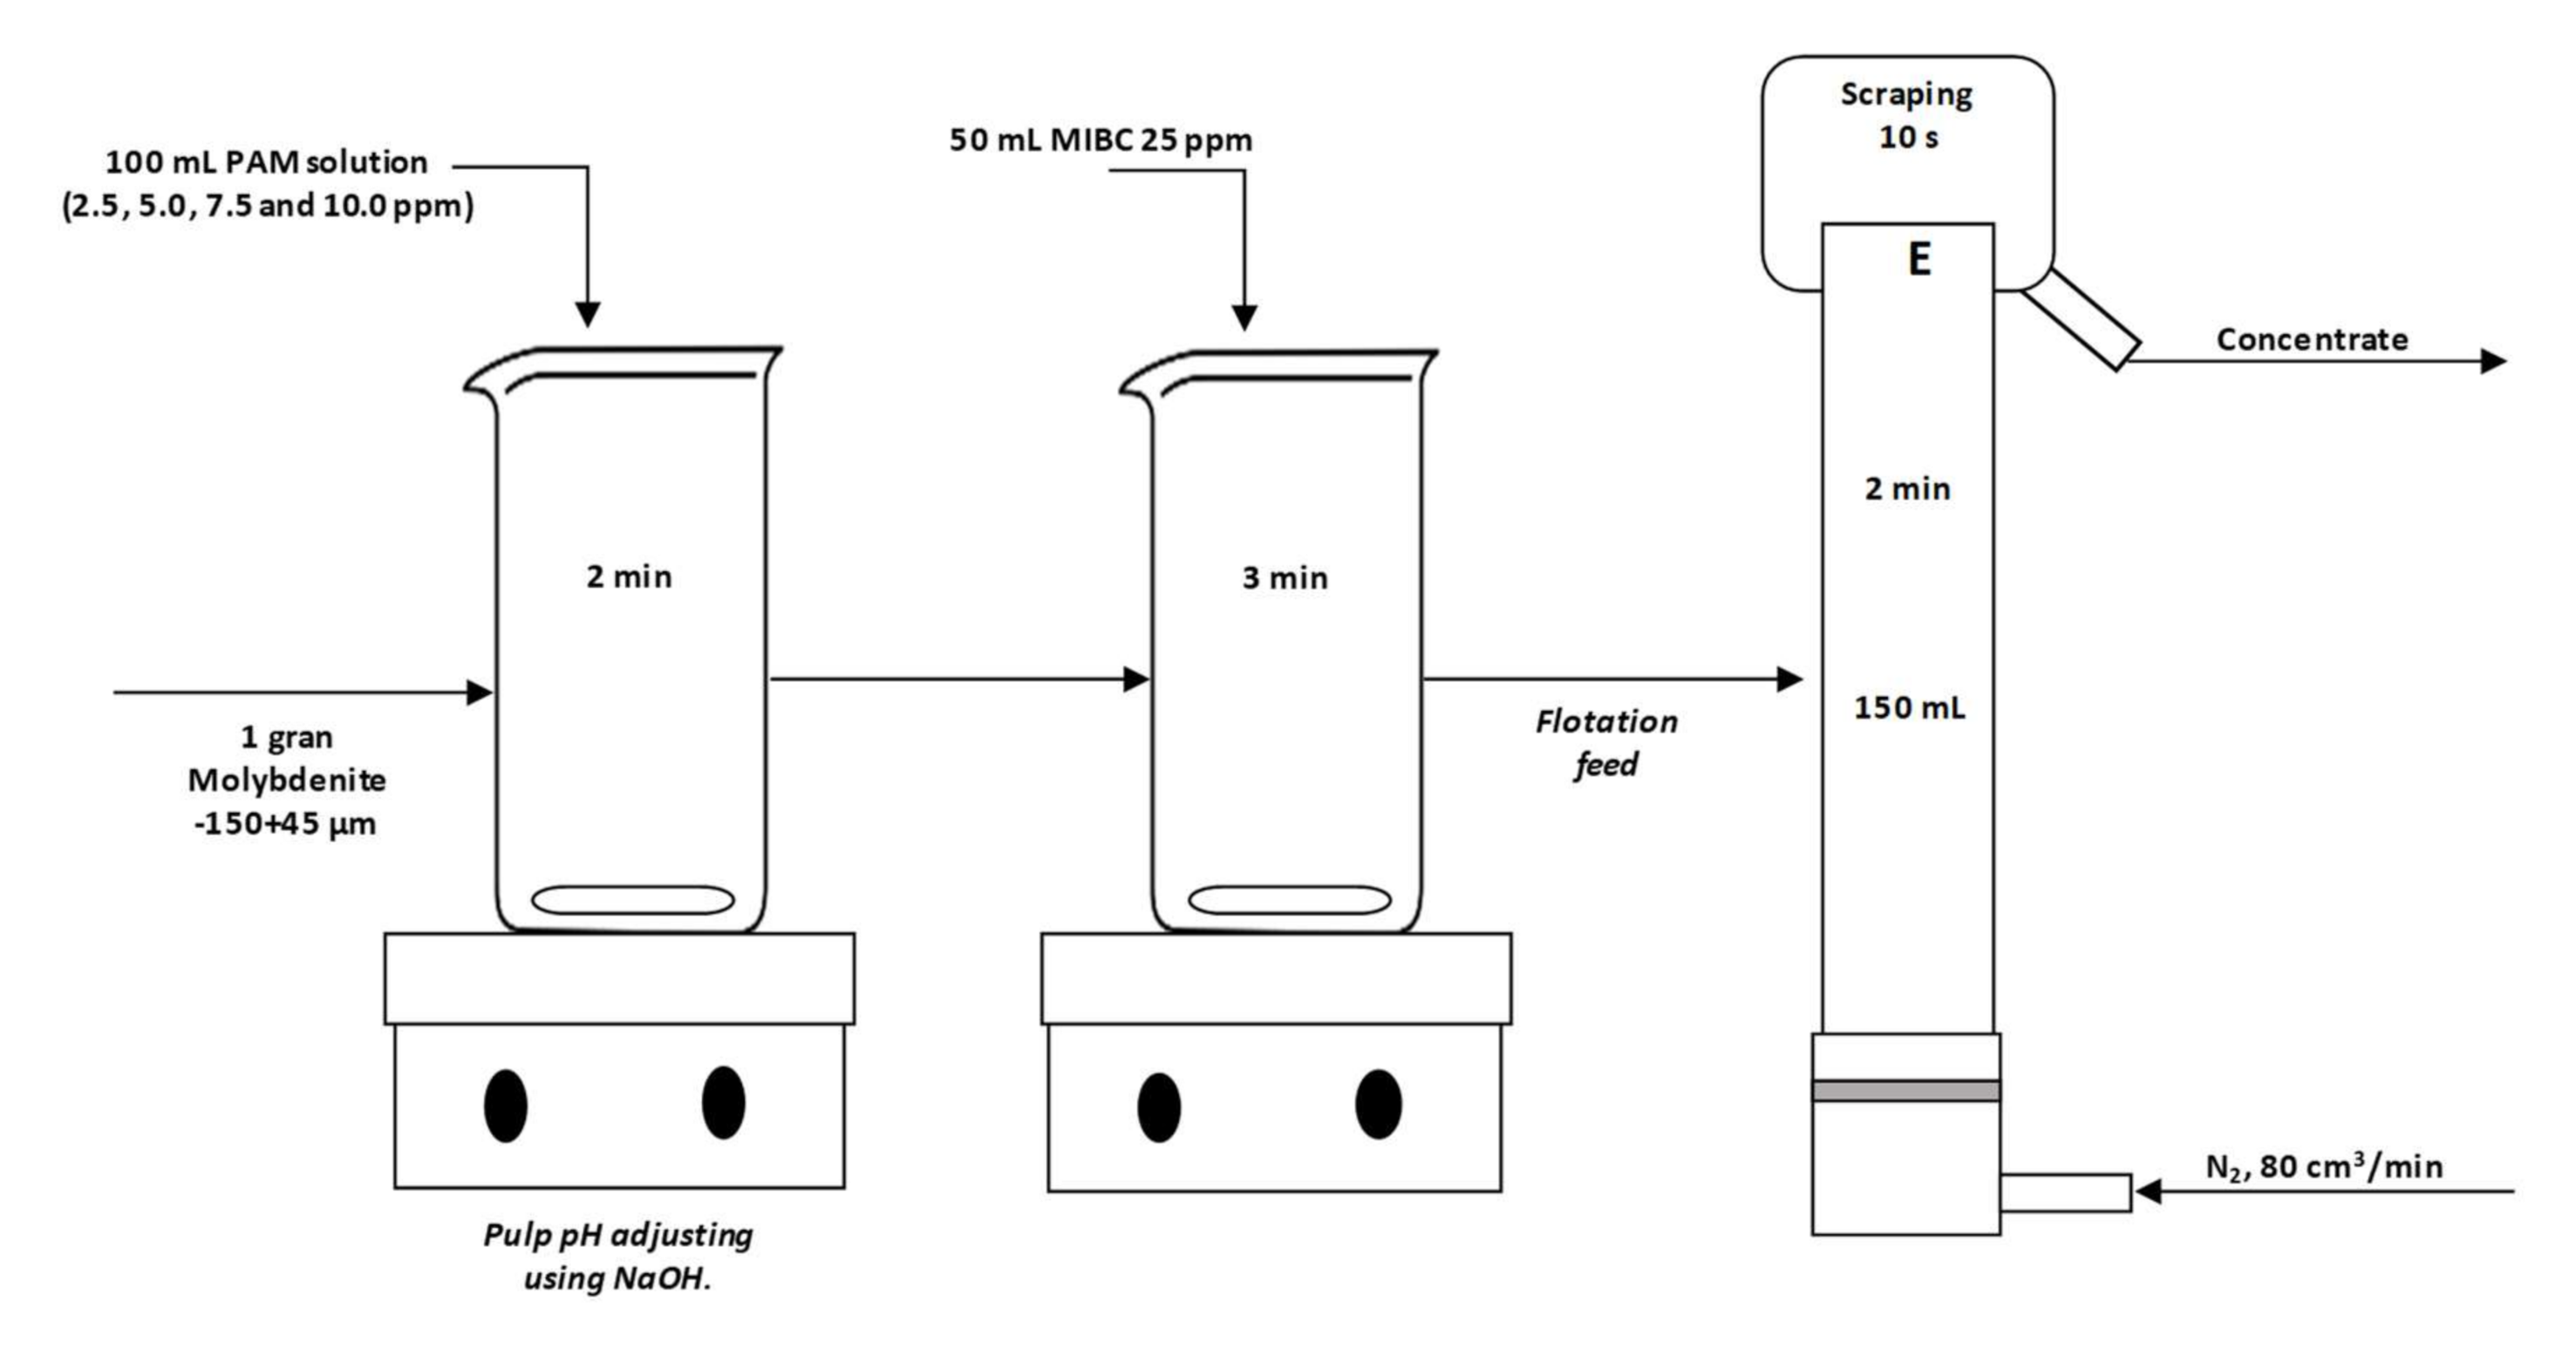
Figure 2 shows the schematic of the microflotation procedure followed in the study. Molybdenite flotation was assessed by microflotation tests under collectorless conditions in a Partridge and Smith glass cell of 150 mL and using nitrogen gas at a flowrate of 80 mL/min. The experiments considered 1 g of molybdenite, which was conditioned for 2 min in 100 mL of solution containing PAM (non-sheared and sheared) at varying concentrations (2.5, 5.0, 7.5, and 10.0 ppm) and pH. Thereafter, 25 ppm of MIBC were added along with 50 mL of solution to complete the volume of the microflotation cell and, lastly, the mixture was conditioned for additional 3 min. Then, the process of flotation was performed for 2 min, removing the froth every 10 s. The pulp level in the Partridge and Smith glass cell was controlled by adding solution of the same characteristics of the original solution (composition and pH). Finally, concentrates and tailings were dried in an oven at 105 °C for 5 h, and molybdenite recovery was calculated dividing the mass of molybdenite in the concentrate by the mass in the concentrate plus the mass in the tailings. All tests were done in triplicate ant the results reported in the manuscript are average values with the error bars representing a standard deviation.

2.4. Induction Time Measurements

The effect of PAM at different conditions of shear degradation on molybdenite hydrophobicity was assessed by induction time measurements [12], which were done following a procedure described elsewhere [2]. In these tests, bubbles are pushed against beds of particles in a solution for different measured and controlled contact times; bubble-particles adhesion is evaluated by microscopic observation. Varying contact times are evaluated and the percentages of effective or successful contacts are plotted vs the measured contact times. The induction time is the time at which 50% of the contacts are successful. The beds of molybdenite particles were prepared mixing 3 g of mineral with 30 mL of solution (with and without NS–PAM/MS–PAM/SS–PAM). The pH was adjusted using NaOH, and the slurry was conditioned for 12 min, after which it was poured in a 15 mL cell to start with the induction time measurements. No collector was used in these experiments and nitrogen was used to generate the bubbles. These experiments were done in triplicates and results reported in this manuscript are the average values.

2.5. Adsorption Tests

Adsorption of NS-PAM, MS-PAM, and SS-PAM on molybdenite was assessed, mixing for 15 min 1 g of molybdenite with 150 mL of PAM solutions of known concentrations. The suspensions were centrifuged and the filtrated was analyzed for TOC, readings which were translated to PAM concentrations through a calibration curve. The masses of adsorbed PAM on molybdenite were calculated multiplying the differences between the initial and final concentrations by the volume of solution (150 mL). Then specific adsorption was calculated in mg of PAM adsorbed per gram of molybdenite (mg/g) and the isotherm was drawn. Temperature was measured and controlled during the experiments using a thermostatic bath. These experiments were done in duplicates with an average standard error of 4%.

2.6. Electrophoretic Mobility Measurements

Molybdenite and flocculant interactions were assessed through electrophoretic mobility measurements using a Zetacompact Z9000 (CAD instrument, Paris, France), particles of molybdenite of size range—20 μm. The effects of pH and PAM modifications on the electrophoretic mobilities were studied.

3. Results

3.1. PAM Caracterization

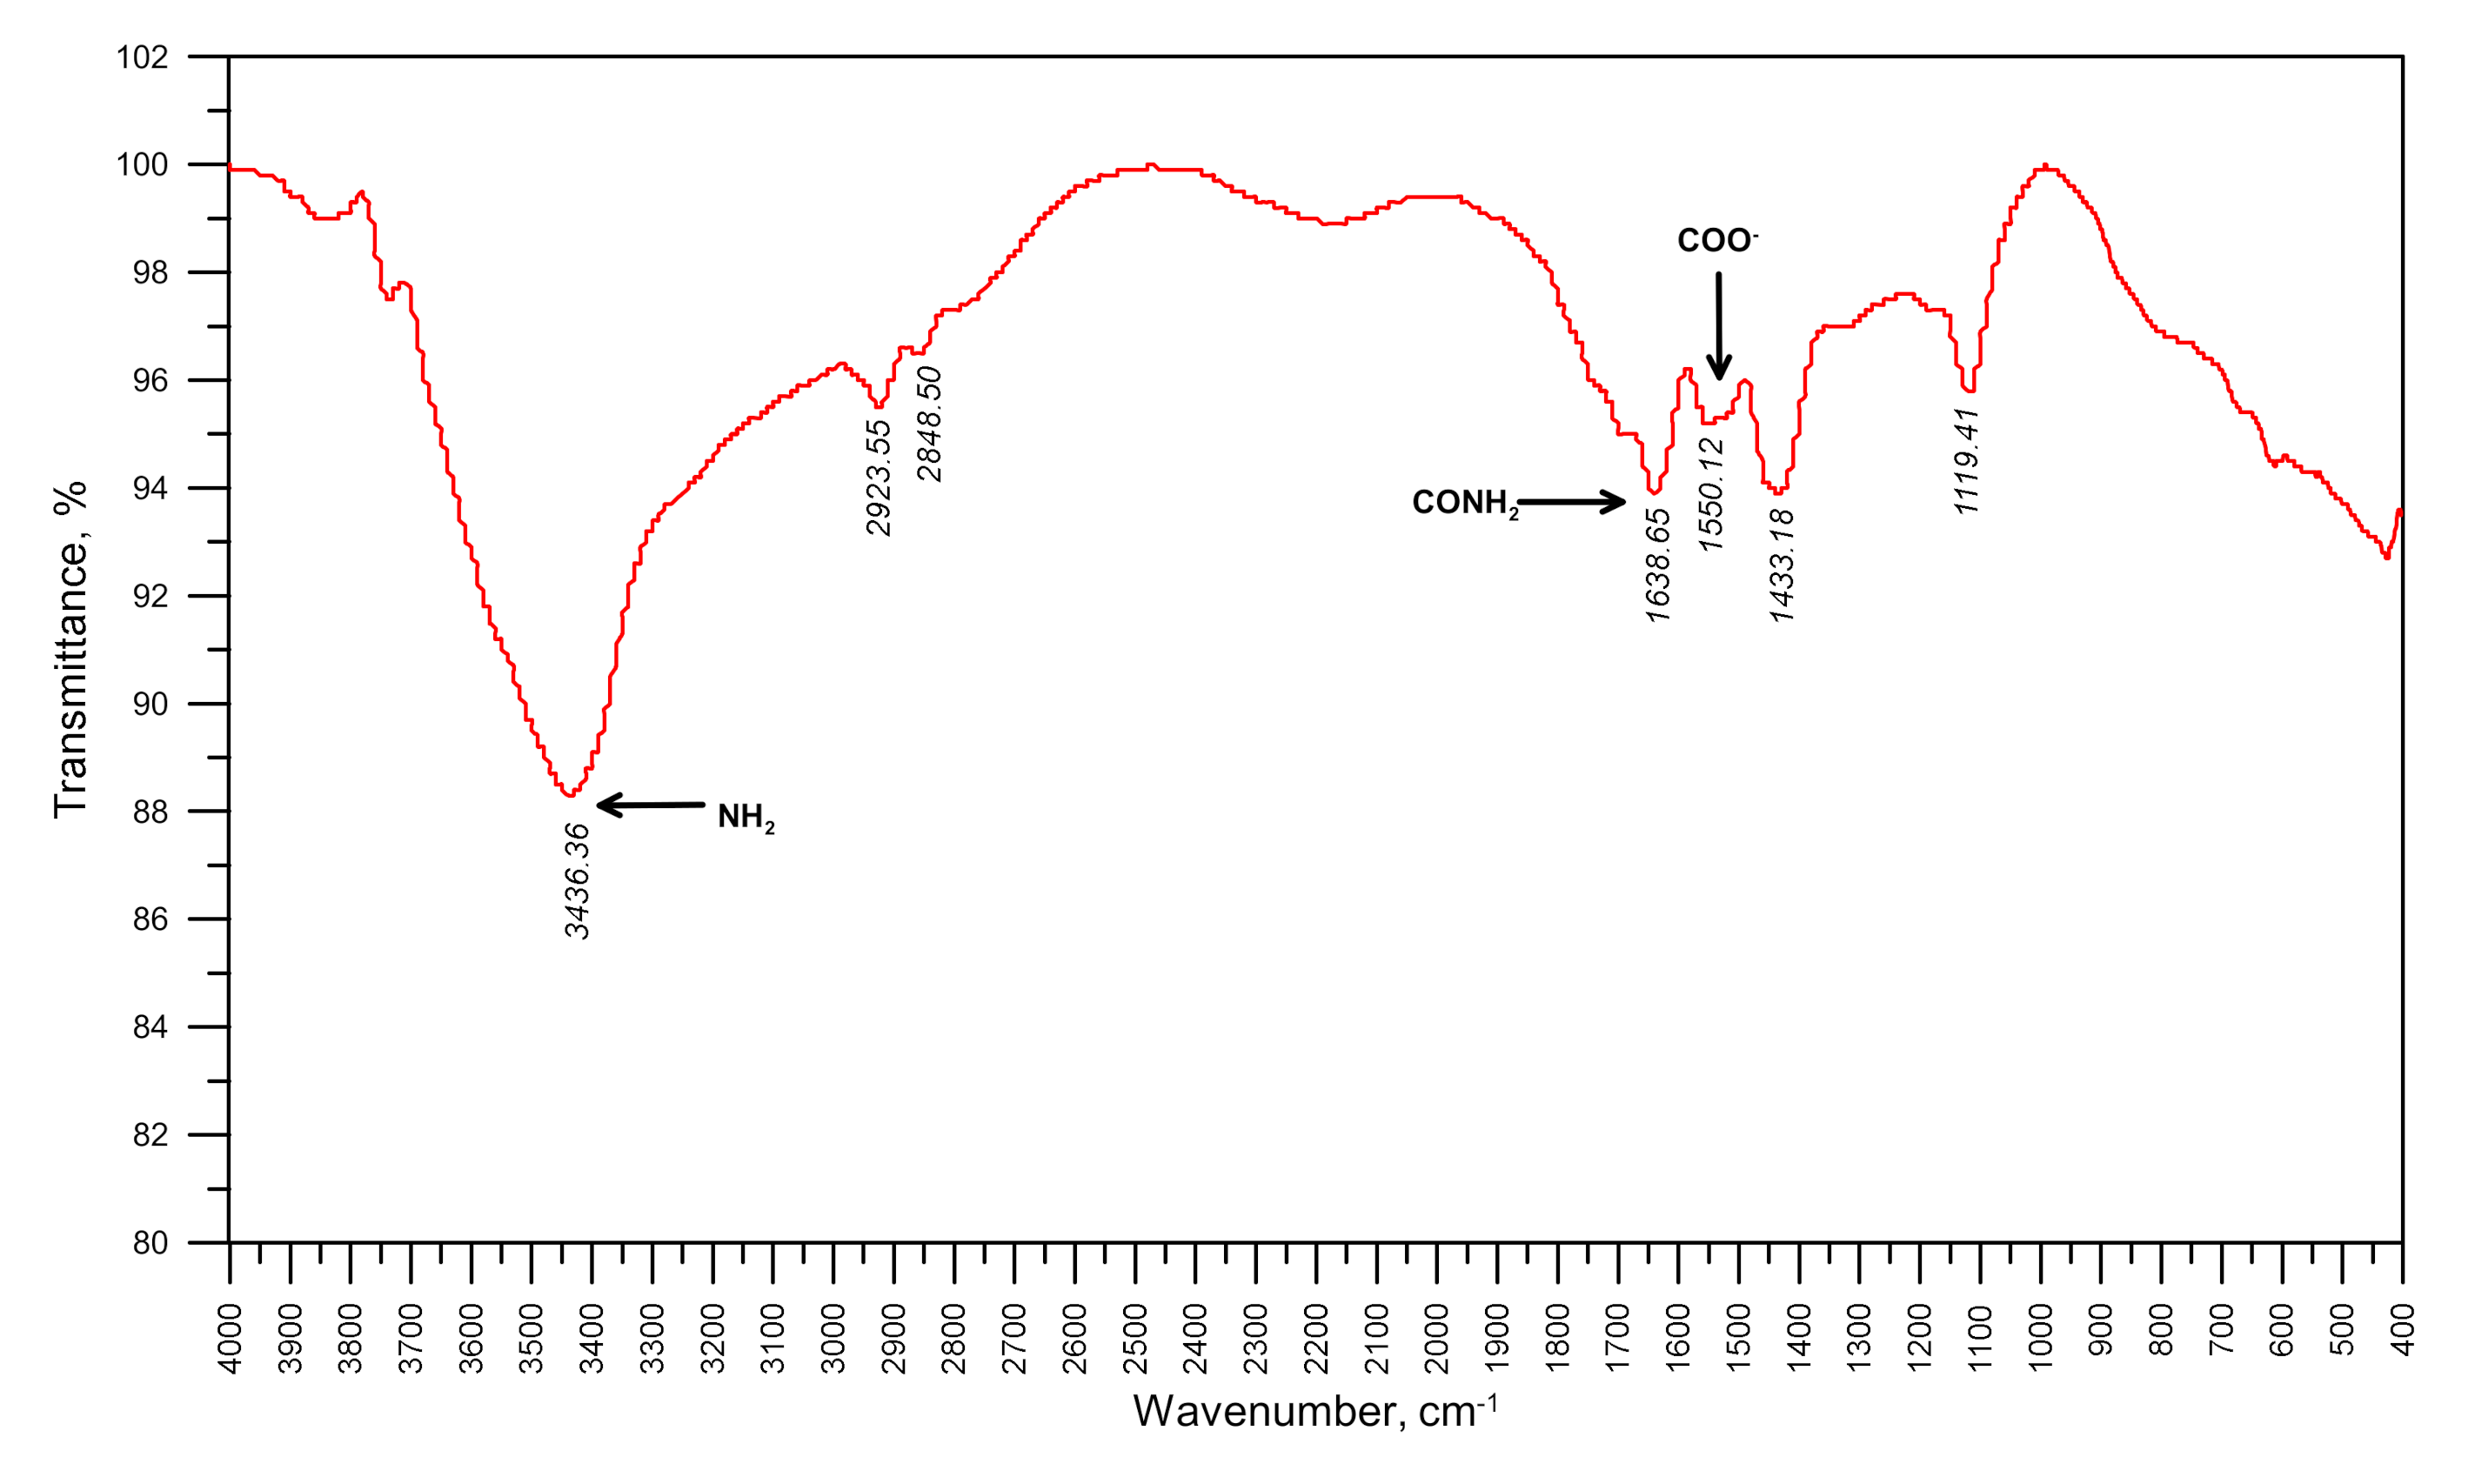
The DA of the flocculant was determined using Equation (1), which gave a value of 11.9%. Figure 3 shows the FTIR spectrum of the PAM used in this study which is a carboxylated PAM, and Table 1 shows the positions of the different bands. This spectrum was obtained using a solid PAM sample supported on a KBr disk, and it shows the different transmission bands corresponding to the different vibrational modes associated with the functional groups. The wide and high intensity band centered at 3436 cm–1 corresponds to vibrations of the symmetric and asymmetric N–H groups with hydrogen bonding interactions, while the bands that appear at 2923 cm–1 and 2848 cm–1 correspond to the vibrational modes of the asymmetric and symmetric aliphatic C–H bonds respectively. The band that appears at 1638 cm–1 is attributed to the vibrations of the C=O group of the amide function, while the bands at 1550 cm–1 and 1433 cm–1 correspond to the asymmetric and symmetric vibrations of the carboxylate group COO respectively. The band of the C–N group is superimposed with the symmetric vibration of the COO group at 1433 cm–1. Finally, the band attributed to the vibrations of the N–H group is observed at 1119 cm–1.
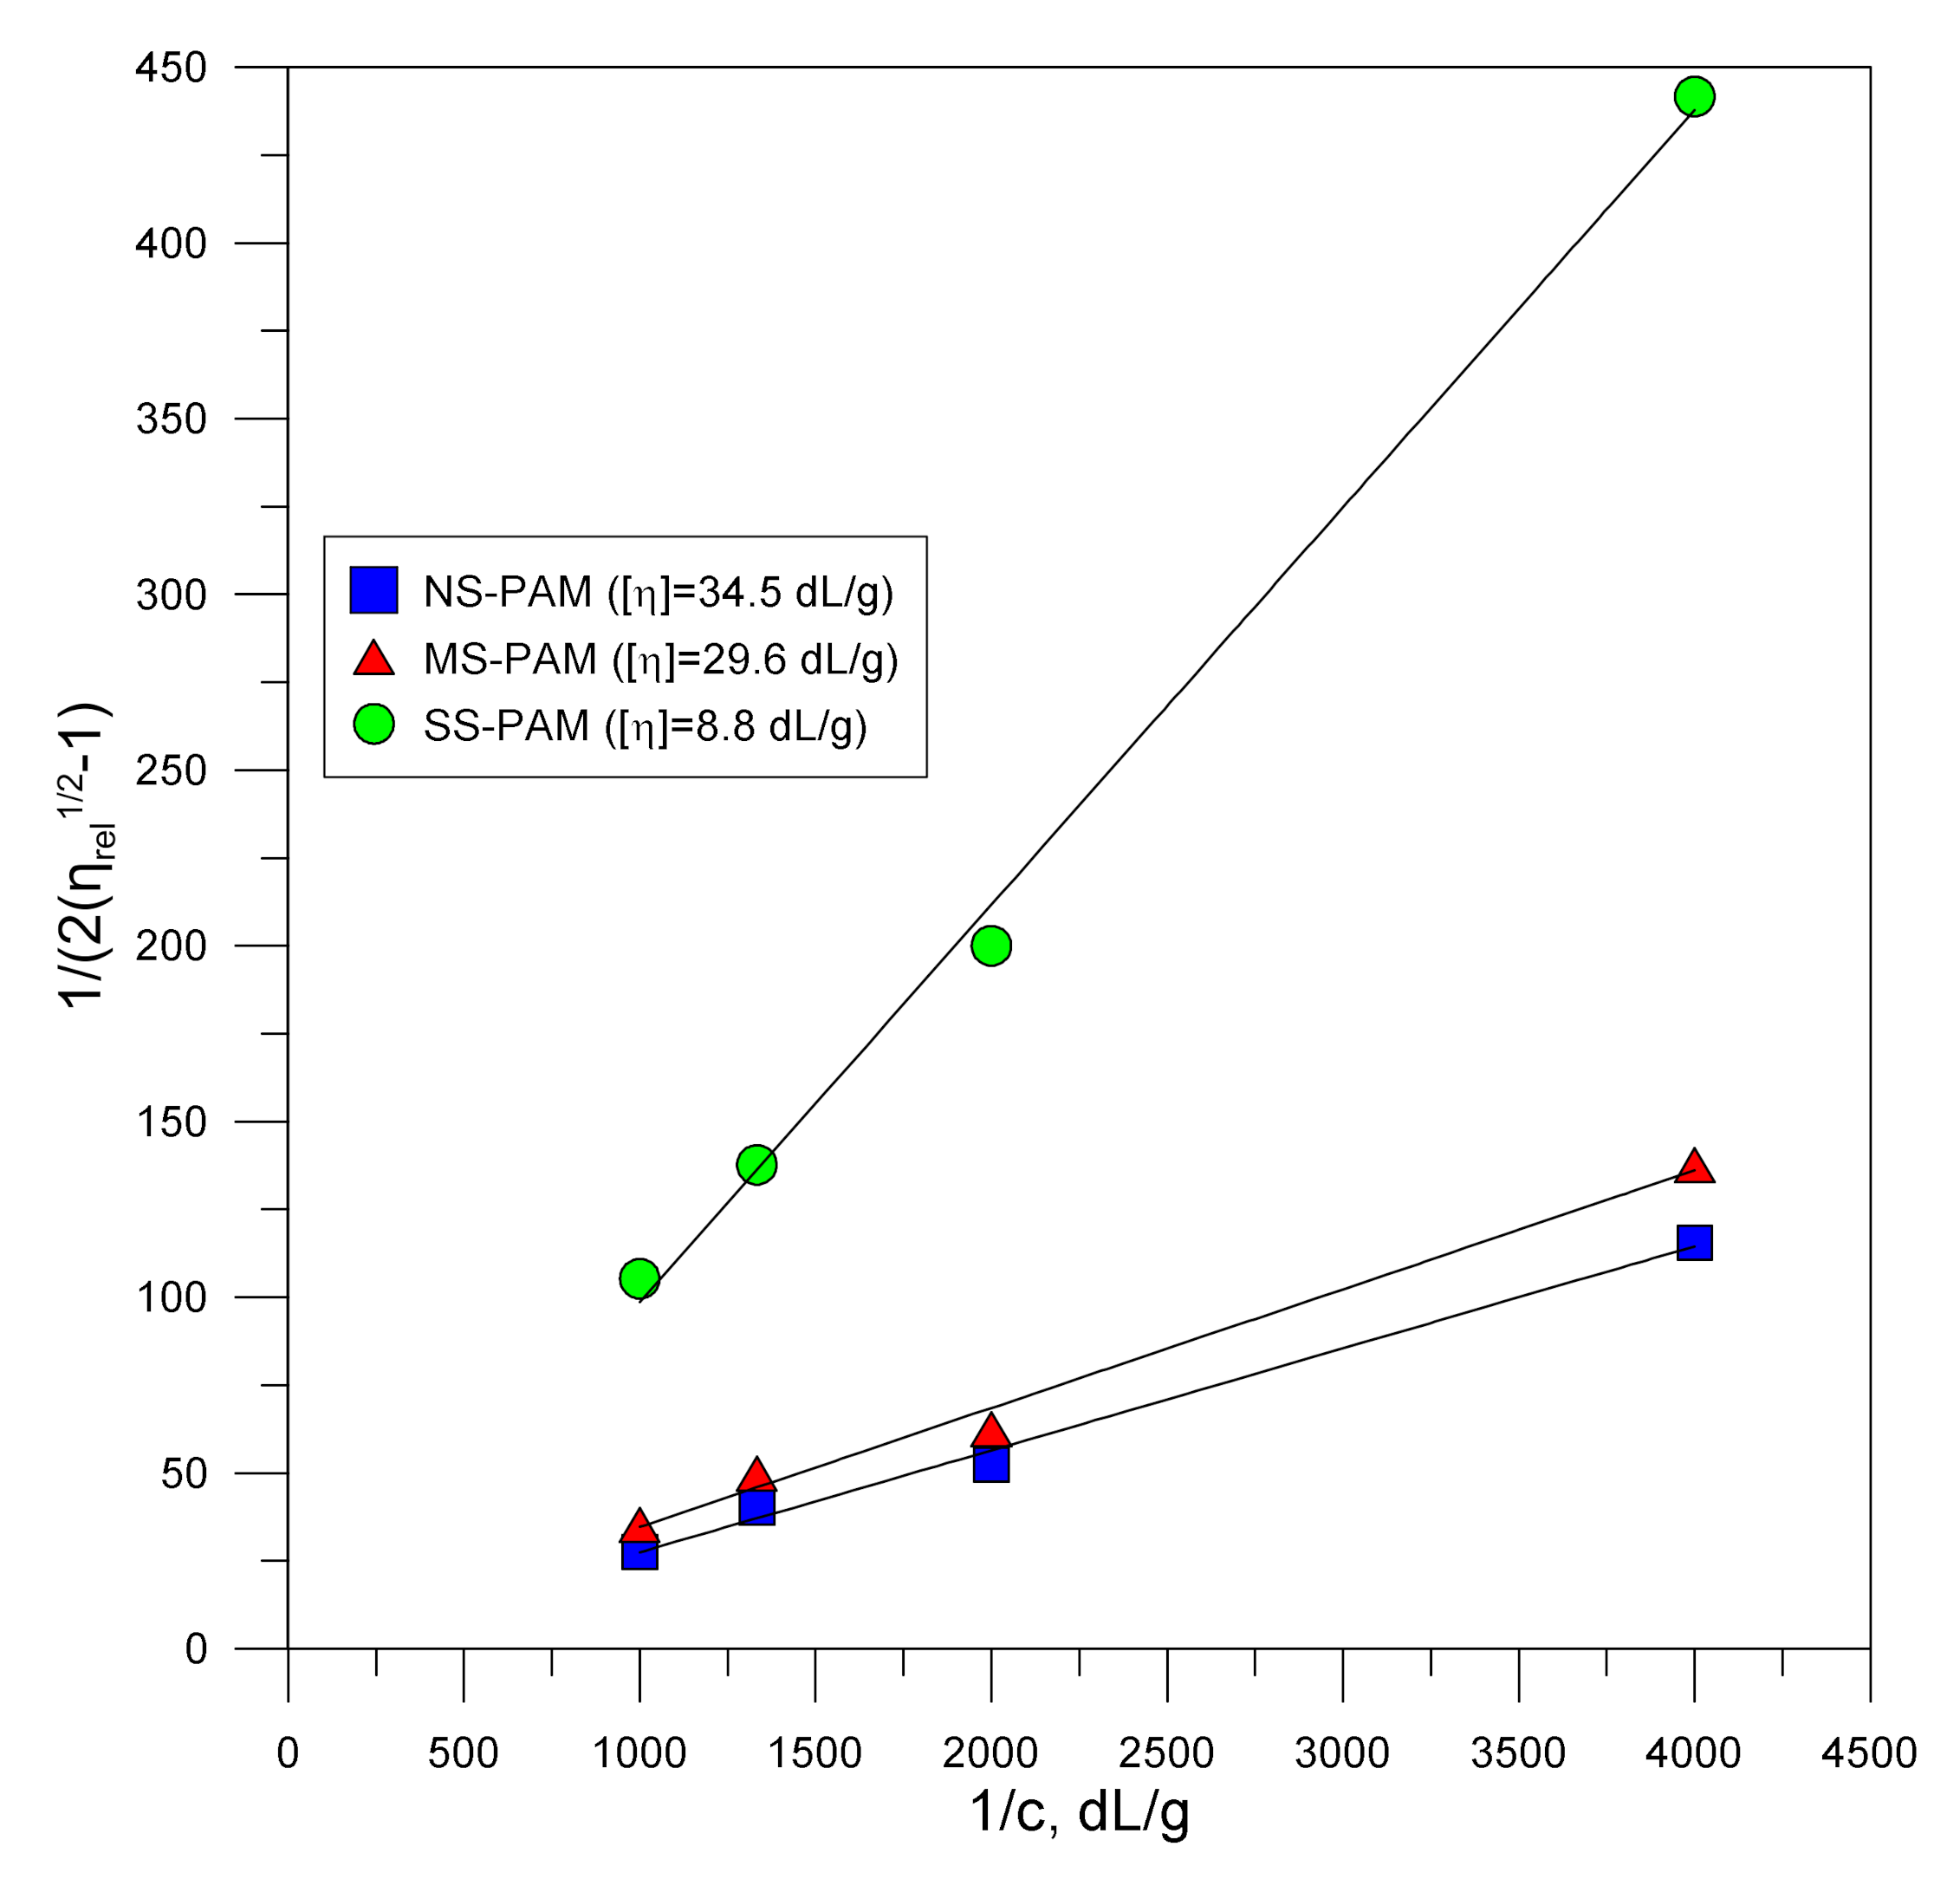
Intrinsic viscosities of the NS–PAM, MS–PAM and SS–PAM were obtained from plotting the left side of Equation (2) vs. 1/c as shown in Figure 4. The insert shows the obtained intrinsic viscosities. As expected, the effect of shearing on the molecular weight as measured by intrinsic viscosities is more important for the SS–PAM.

3.2. Microflotation

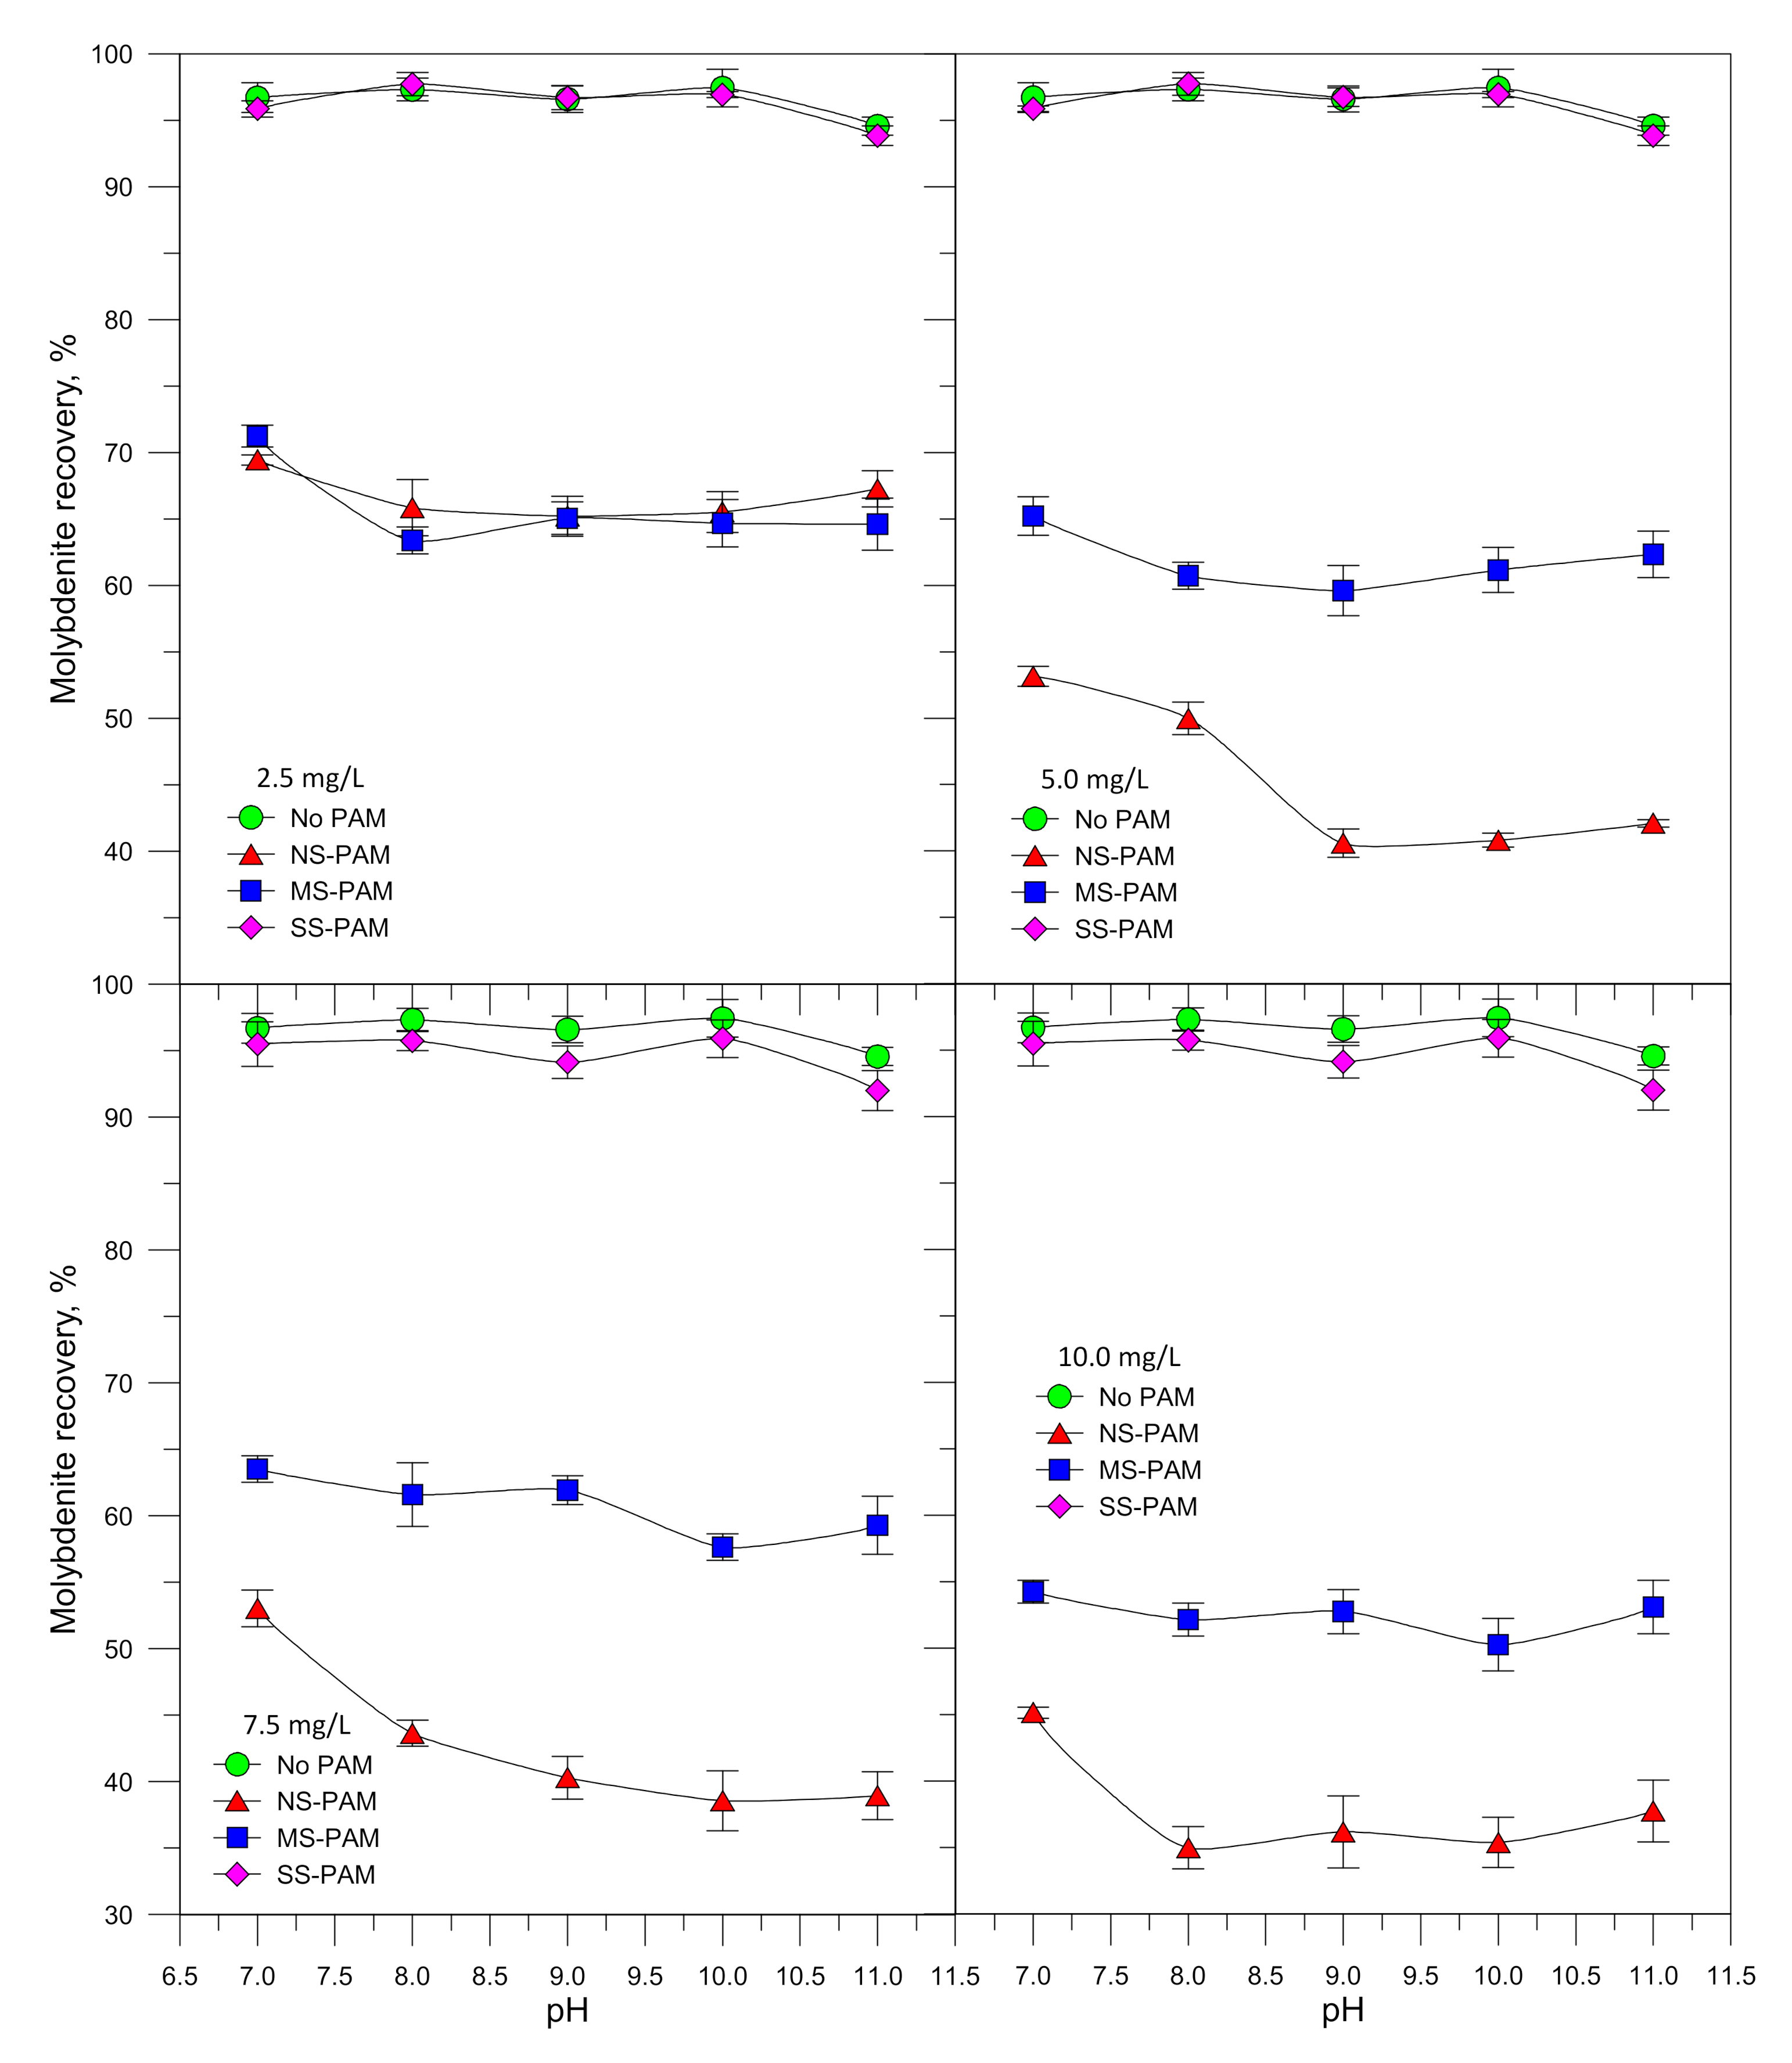
Figure 5 shows the recovery of molybdenite as a function of pH in the presence of 2.5, 5.0, 7.5, and 10.0 mg/L of NS–PAM, MS–PAM, and SS–PAM. The results of molybdenite flotation in the presence of the PAM flocculant subjected to different degrees of mechanical shearing show that the NS-PAM had the strongest depressing effect on molybdenite flotation followed by the MS–PAM. The depressing effect of the SS–PAM is minor.

3.3. Induction Time

Figure 6 shows the induction times obtained in the presence of NS–PAM, MS–PAM, and SS–PAM measured at varying concentrations and at pH = 9. The results show that the highest values of induction times (less hydrophobic) are obtained in the presence of the NS–PAM followed by the results obtained with the MS–PAM. These results are in agreement with those obtained in the microflotation tests, which showed that the strongest depressing effect on molybdenite was observed using the NS–PAM followed by the MS–PAM. As induction time measurements can be considered as indirect measures of molybdenite hydrophobicity, it is possible to infer from the data in Figure 6 that the NS–PAM induces more hydrophilicity on the molybdenite faces which leads to low recoveries.

3.4. Adsorption

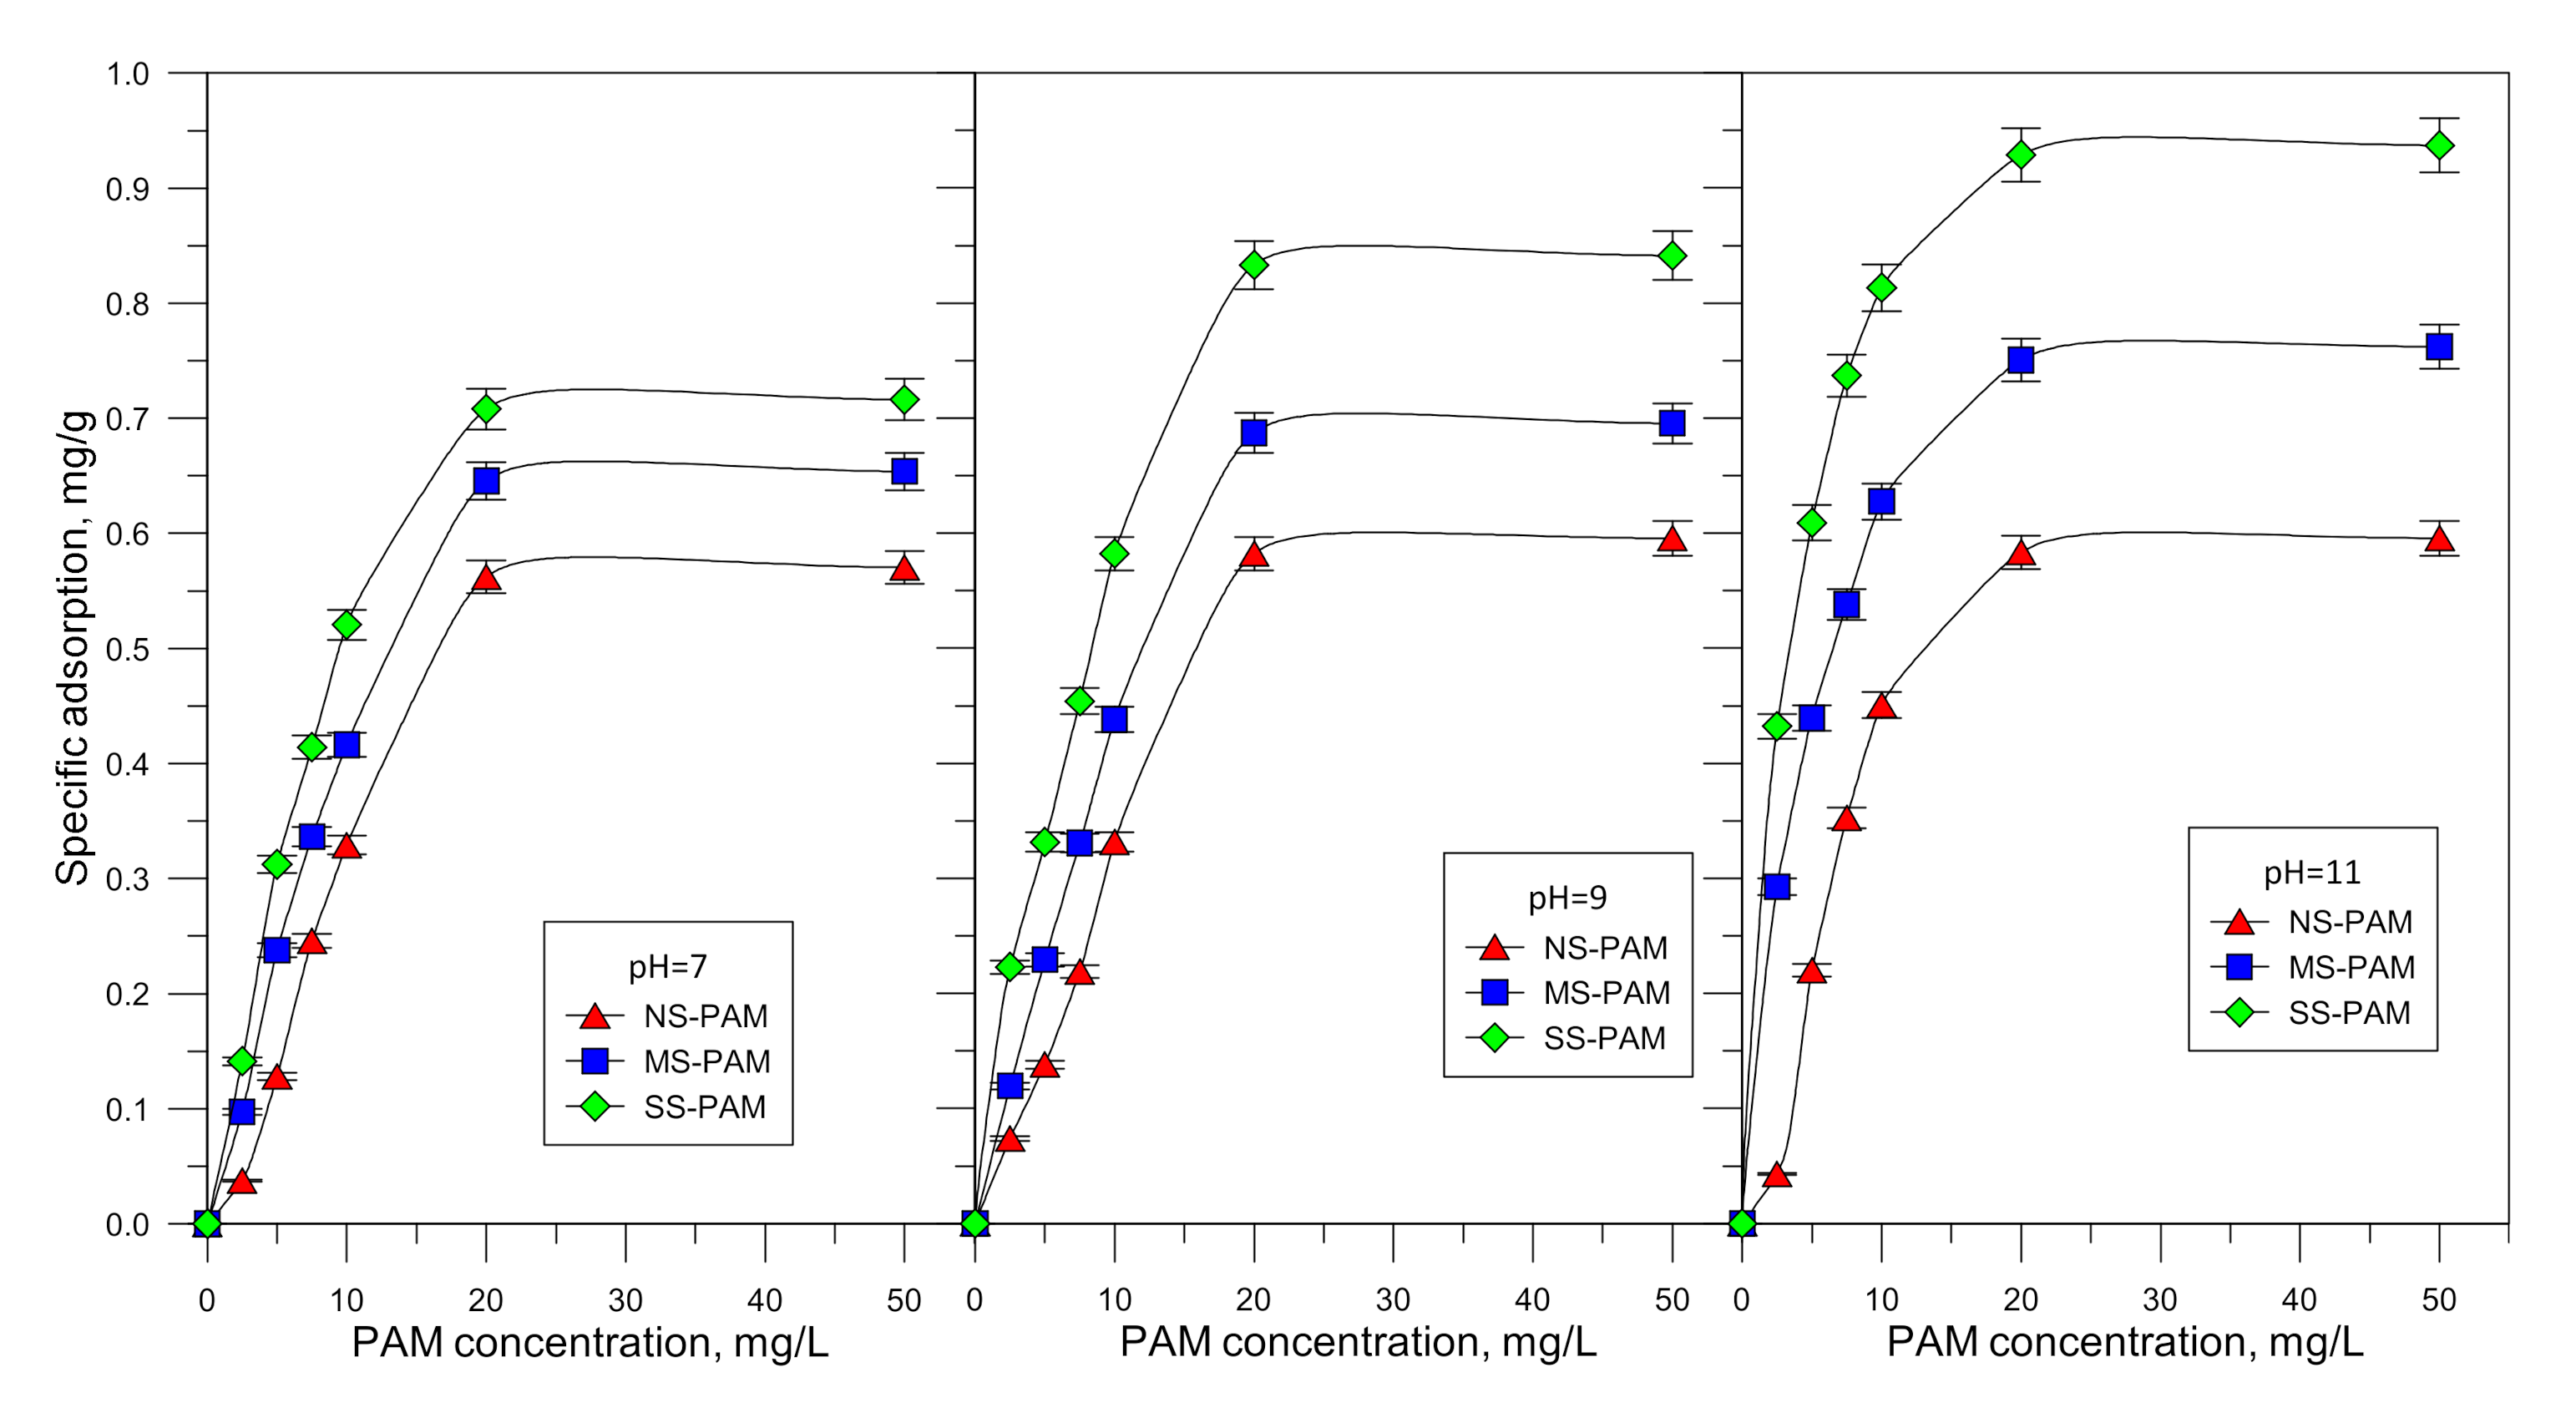
Figure 7 shows the results of specific adsorption of NS–PAM, MS–PAM, and SS–PAM on molybdenite at different values of pH. The results show that the strongest the mechanical shearing of the PAM the more the adsorption of the resulting molecules on the molybdenite surfaces. The adsorptions of MS–PAM and SS–PAM on molybdenite tend to increase with pH a trend not observed in the case of the tests with the NS–PAM.

3.5. Electrophoretic and Aggregation

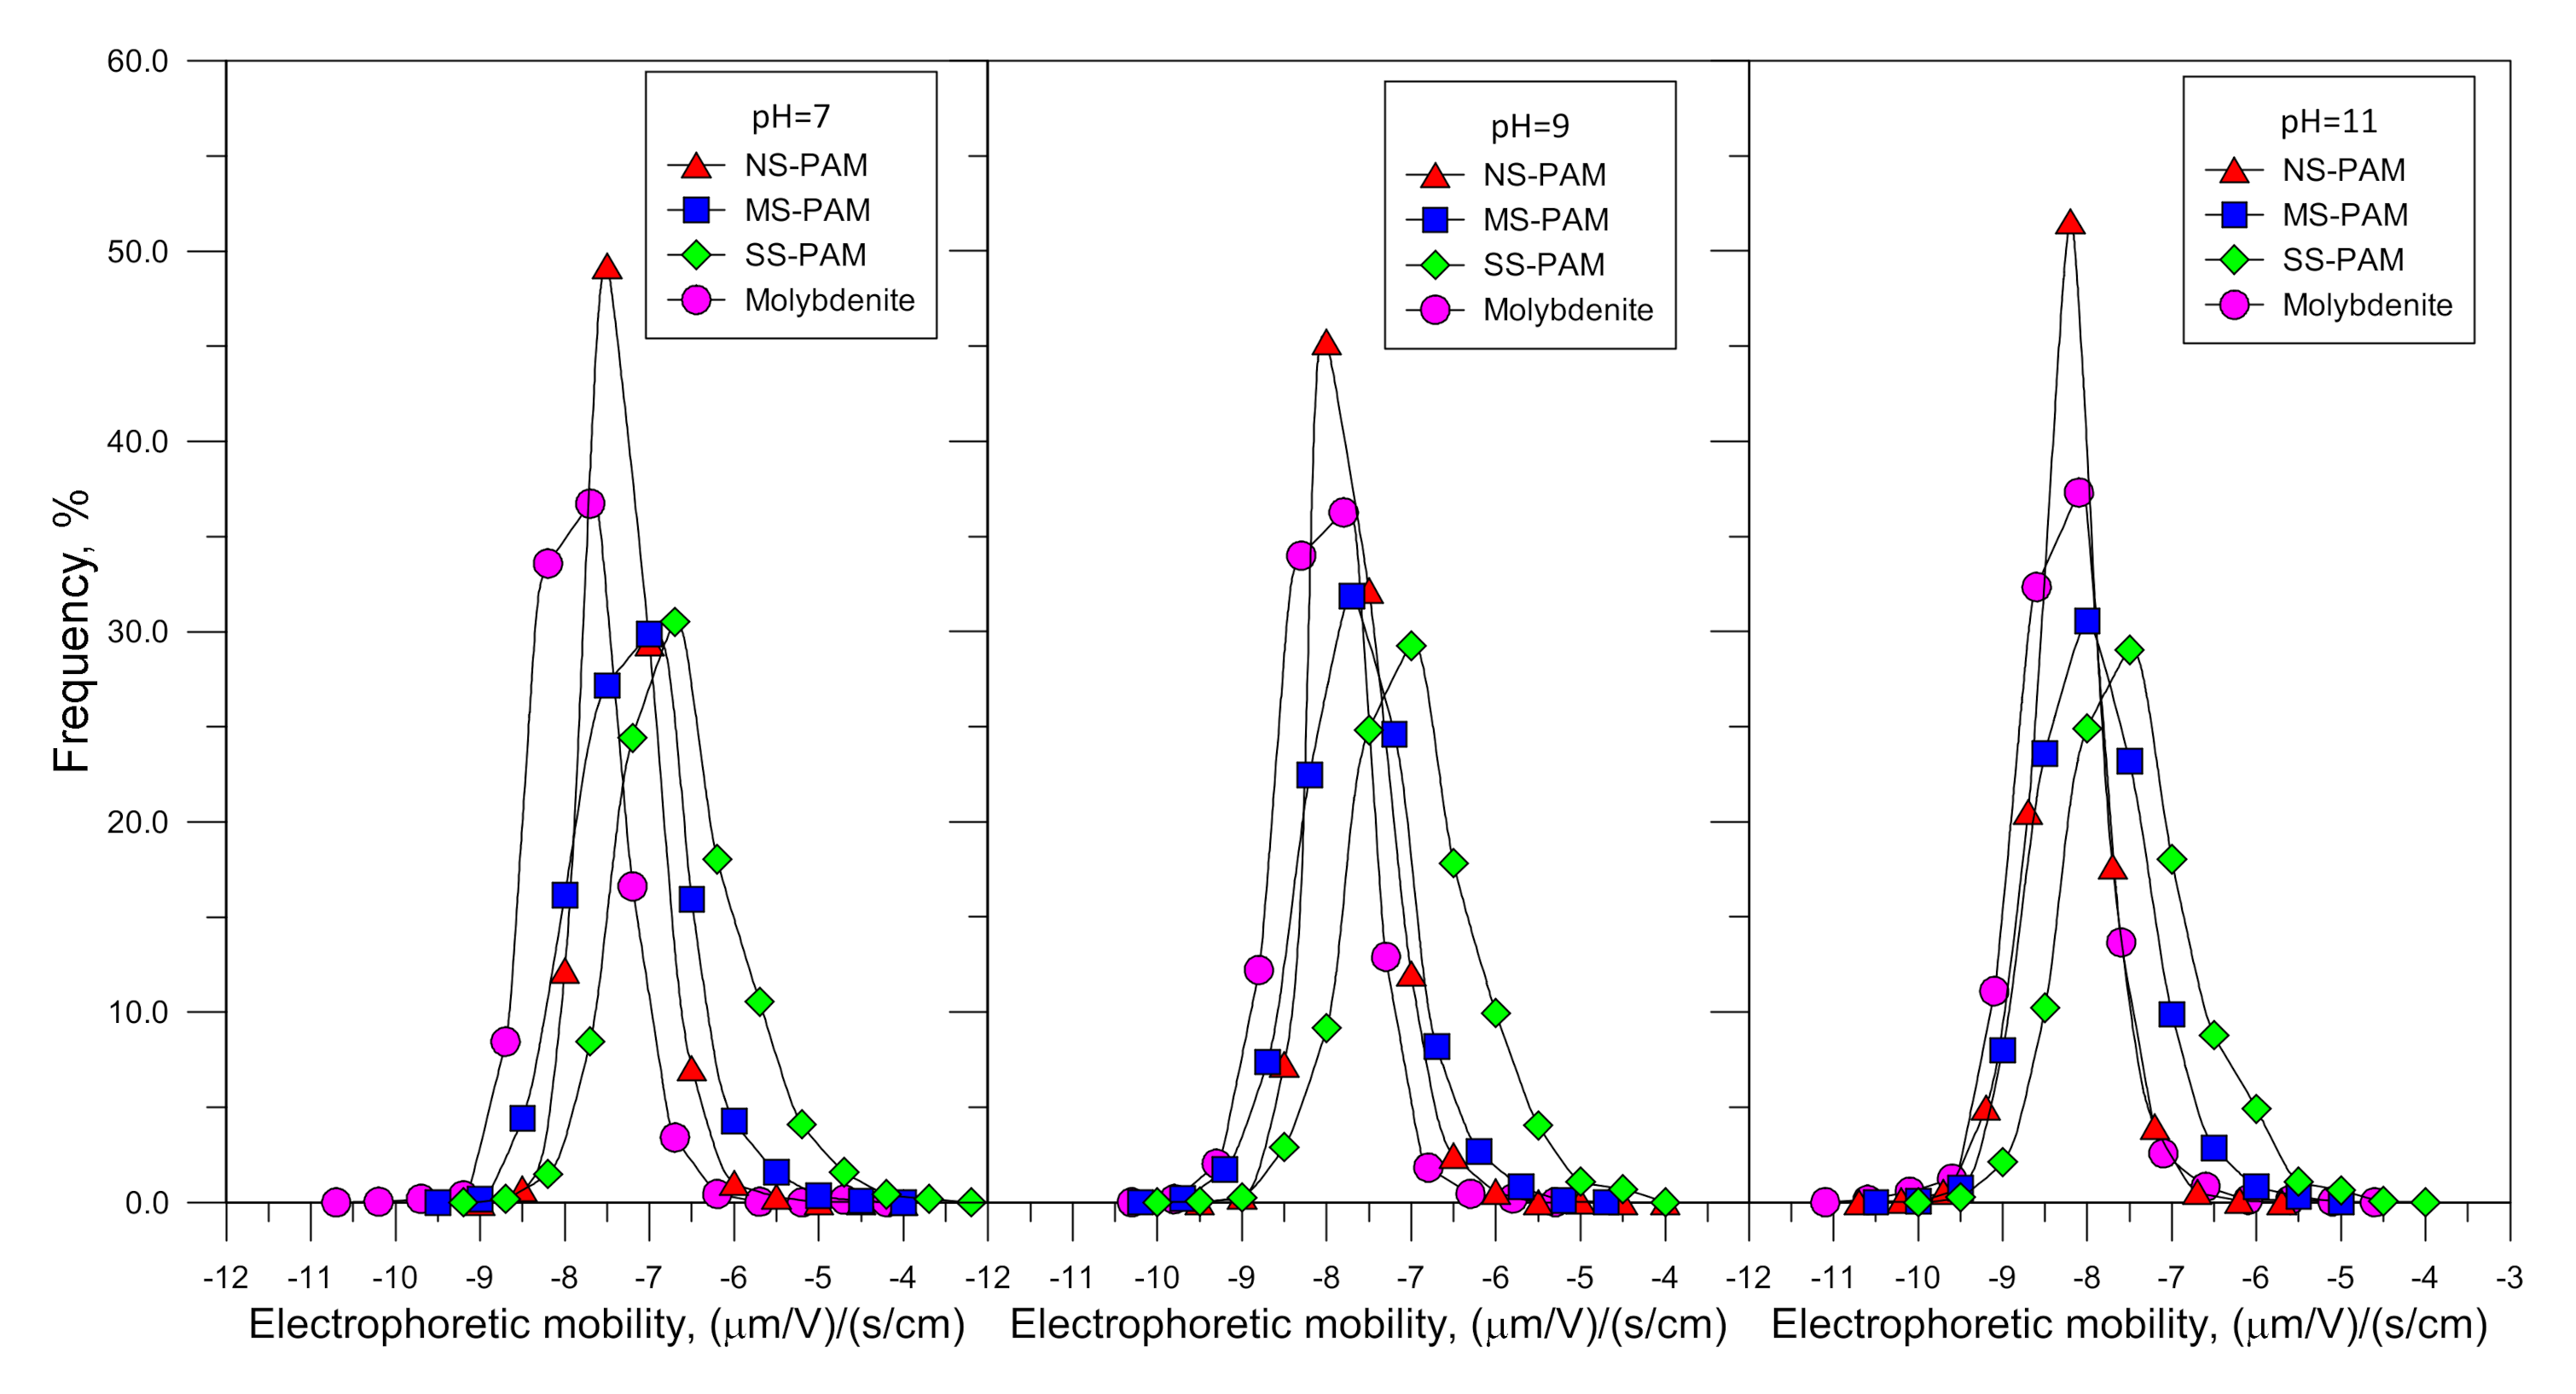
Figure 8 shows the results of electrophoretic mobility distributions of molybdenite in the absence and presence of PAM, and at pH 7, 9, and 11. Table 2 shows the average values of the electrophoretic mobility distributions. It has to be noted that the pH values were chosen as they are in the range of the typical values of the flotation process. Molybdenite is an anisotropic mineral with hydrophobic faces and hydrophilic edges both carrying different surface properties and surface charge, thus the use of the Smoluchowski´s equation to calculate the zeta potential from electrophoresis in the case of anisotropic minerals does not make sense. That is why, in this manuscript, electrophoretic mobility distributions are presented and not zeta potentials. The results show that the electrophoretic mobility distributions of molybdenite with no PAM added move towards more negative values, as the pH increases, which agrees with previous studies [18]. In the presence of PAM, the electrophoretic mobility distributions move towards less negative values which can also be observed from the average values presented in Table 2. These experimental results indicate that PAM flocculants obtained under different shearing conditions slightly reduce the negative surface charge of molybdenite, and that the more sheared the PAM the strongest the neutralizing effect.

4. Discussion

The effect of different polymers on the flotation process is a subject that is under continuous research. Polymers of different nature and molecular weights have been used as dispersants/depressants, and polymers of high molecular weights have been usually used as flocculants in mineral processing plants ([1,19]). All these polymers are water soluble, thus they are highly hydrophilic macromolecules that may affect the surface properties of different minerals. Some mechanisms were proposed by Laskowski et al. (2007) [19] to explain the adsorption of polysaccharides on the mineral particles claiming that these interactions occur between the hydroxyl groups of the organic compounds and the hydroxylated metallic sites that are generated on the mineral surfaces. These interactions depend on the basic and acidic nature of the hydroxylated metallic sites. It was proposed that the adsorption of polysaccharides on the mineral surfaces increases as the basicity of the hydroxylated metallic sites increases. Some recent experimental studies support this theory [18].
Due to its crystallochemical structure, molybdenite is formed by layers of S-Mo-S layers in which sulfur and molybdenum atoms are connected by covalent bonds and the layers interact through van der Walls forces [20]. As a result, molybdenite particles display non-polar and highly hydrophobic surfaces named faces, and polar and highly hydrophilic surfaces called edges. Therefore, molybdenite is an anisotropic mineral with varying surface properties on the edges and faces [20,21]. The edges are more chemically active than the faces and both faces and edges are negatively charged at pH values above 4 (point of zero charge PZC of faces) [21]. The negative charge of the edges is generated by the reactions of molybdenum with water and oxygen leading to the generation of negatively charged species such as HMoO4/MoO42− ions at the solid/liquid interface [20]. Therefore, the negative surface charge of the molybdenite edges and faces increases with pH, which agrees with the experimental data presented in Figure 8 that show that the electrophoretic mobility distributions move to more negative values as the pH is changed from 7 to 11. Previous studies proposed that molybdenite faces display imperfections in the form of nano-edges and nano-faces both of polar nature which affect the molybdenite surface properties ([22]). Other studies proposed that the presence of these imperfections leads to more adsorption of molecules of organic and inorganic nature on molybdenite [18,22,23,24]. The adsorption sites may become more active at higher pH and in when ions are dissolved in solution. The microflotation results presented in Figure 5 indicate that the depressing effect of the NS–PAM and MS–PAM on molybdenite flotation slightly increases with pH, which is in agreement with the theory raised regarding the possible interactions between polymers and the hydroxylated metallic sites which cover the molybdenite surfaces.
As was previously indicated the effect of PAM on molybdenite flotation was evaluated considering three conditions of mechanical shearing. Figure 4 shows that shearing induces strong changes on the molecular weights of the flocculant as measured by their intrinsic viscosities. The flotation results presented in Figure 5 indicate that molybdenite recovery is strongly depressed by the NS–PAM, and to a lesser extent by MS–PAM; however, molybdenite flotation is only slightly affected by SS–PAM. Castro and Laskowski (2015) [1] reported that molybdenite depression by a polyacrylamide flocculant of a DA of 18.1% occurs as other applications in which hydrophobic minerals are depressed by hydrophilic polymer. These authors also indicated that that when PAM molecules are mechanically sheared their depressing effect on molybdenite flotation is maintained and the ability to flocculate quartz particles is lost. The results obtained in this work show that PAM depress molybdenite flotation only if the flocculant is sheared at moderate shearing conditions. At strongly shearing conditions, the PAM flocculant has almost no effect on molybdenite flotation. This conclusion is supported by the induction time measurements that indicate that the SS-PAM has a minor effect on this parameter (as seen from Figure 6). As induction times can be considered as indirect measures of molybdenite hydrophobicity, then the results indicate that the SS-PAM produces no change on the hydrophobic behavior of molybdenite particles.
The adsorption results presented in Figure 7 show that the strongest the shearing the more the resulting molecules adsorb on molybdenite particles. Although the effect of the SS-PAM on molybdenite flotation is minor, adsorption of these molecules on the mineral particles is high. In contrast, the adsorption of the NS–PAM on molybdenite is lower than the adsorption of the MS-PAM and SS–PAM, but the observed depressing effect on molybdenite flotation is by far the strongest. The adsorption results correlate with the changes in the electrophoretic mobility distributions presented in Figure 8 and Table 2 that show that the largest shifts of the distributions are obtained with the MS–PAM and SS–PAM. The strong depressing effect observed with the NS–PAM can be explained by the fact that in this condition PAM molecules are stretched and therefore when adsorbed on the molybdenite faces they can cover more surface are than broken molecules. As a result, molybdenite faces become more hydrophilic.

5. Conclusions

The results of molybdenite flotation in the presence of the PAM flocculant subjected to different degrees of mechanical shearing show that the non-sheared PAM (NS–PAM) had the strongest depressing effect on molybdenite flotation followed by the moderately sheared PAM (MS–PAM). The depressing effect of the strongly sheared PAM (SS–PAM) is minor.
The flotation data correlate with the induction time measurements that show that the highest values of induction times (less hydrophobic) are obtained in the presence of the NS–PAM followed by the results obtained with the MS–PAM. The SS–PAM has no effect on the induction times.
Adsorption of the SS-PAM on molybdenite is higher than the adsorption of the NS–PAM and MS–PAM molecules. However, broken molecules cover less surface area of the molybdenite faces and thus have less effect on hydrophobicity.
Electrophoretic mobility distributions of molybdenite particles with no PAM added show that the distributions switch to more negative values as the pH increases as the molybdenite surface charge becomes more negative. In the presence of PAM, the electrophoretic mobility becomes less negative which indicates that PAM flocculants obtained under different shearing conditions slightly reduce the negative surface charge of molybdenite.
More work is ongoing to study the effect of PAM on molybdenite flotation in the presence of clay minerals and different aqueous media.

Author Contributions

Conceptualization/methodology/investigation/writing—original draft preparation, D.E.; Methodology/investigation, L.E. and A.R.; Conceptualization/writing—original draft preparation/writing—review and editing/supervision/project administration/funding acquisition, L.G. All authors have read and agreed to the published version of the manuscript.

Funding

This research was funded by ANID/FONDAP/15130015.

Acknowledgments

The authors acknowledge the financial support of the Water Research Centre for Agriculture and Mining (CRHIAM) of the Universidad de Concepcion sponsored by the ANID/FONDAP/15130015 project.

Conflicts of Interest

The authors declare no conflict of interest.

References

  1. Castro, S.; Laskowski, J. Depressing effect of flocculants on molybdenite flotation. Miner. Eng. 2015, 74, 13–19. [Google Scholar] [CrossRef]
  2. Ramirez, A.; Gutierrez, L.; Vega-Garcia, D.; Reyes-Bozo, L. The depressing effect of kaolinite on molybdenite flotation in seawater. Minerals 2020, 10, 578. [Google Scholar] [CrossRef]
  3. Arinaitwe, E.; Pawlik, M. A method for measuring the degree of anionicity of polyacrylamide-based flocculants. Int. J. Miner. Process. 2009, 91, 50–54. [Google Scholar] [CrossRef]
  4. Seybold, C.A. Polyacrylamide review: Soil conditioning and environmental fate. Soil Sci. Plant Anal. 1994, 25, 2171–2185. [Google Scholar] [CrossRef]
  5. Moody, G. The use of polyacrylamides in mineral processing. Miner. Eng. 1992, 5, 479–492. [Google Scholar] [CrossRef]
  6. Moudgil, B.M. Effect of polyacrylamide and polyethylene oxide polymers on coal flotation. Colloids Surf. 1983, 2, 225–228. [Google Scholar] [CrossRef]
  7. Zhang, J.; Hu, Y.; Wang, D.; Xu, J. Depressing effect of hydroxamic polyacrylamide on pyrite. J. Cent. South Univ. Technol. 2004, 11, 380–384. [Google Scholar] [CrossRef]
  8. Liu, G.; Zhong, H.; Hu, Y.; Zhao, S.; Xia, L. The role of cationic polyacrylamide in the reverse flotation of diasporic bauxite. Miner. Eng. 2007, 20, 1191–1199. [Google Scholar] [CrossRef]
  9. Boulton, A.; Fornasiero, D.; Ralston, J. Selective depression of pyrite with polyacrylamide polymers. Int. J. Miner. Process. 2001, 61, 13–22. [Google Scholar] [CrossRef]
  10. Wang, K.; Wang, L.; Cao, M.; Liu, Q. Xanthation-modified polyacrylamide and spectroscopic investigation of its adsorption onto mineral surfaces. Miner. Eng. 2012, 39, 1–8. [Google Scholar] [CrossRef]
  11. Yi, L.; Li, K.; Liu, D. Degradation of polyacrylamide: A review. Adv. Mater. Res. 2013, 800, 411–416. [Google Scholar] [CrossRef]
  12. Ramirez, A.; Gutierrez, L.; Laskowski, J.S. Use of “oily bubbles” and dispersants in flotation of molybdenite in fresh and seawater. Miner. Eng. 2020, 148, 578. [Google Scholar] [CrossRef]
  13. Arinaitwe, E. Characterization of Industrial Flocculants through Intrinsic Viscosity Measurements. Master’s Thesis, University of British Columbia, Vancouver, BC, Canada, August 2008. [Google Scholar]
  14. Fedors, R.F. An equation for describing the viscosity of dilute to moderately concentrated polymer solutions. Polymer 1979, 20, 225–228. [Google Scholar] [CrossRef]
  15. Rao, M.V.S. Viscosity of dilute to moderately concentrated polymer solutions. Polymer 1988, 34, 592–596. [Google Scholar] [CrossRef]
  16. Ghimici, L.; Popescu, F. Determination of intrinsic viscosity for some cationic polyelectrolytes using Fedors equation. Eur. Polym. J. 1998, 34, 13–16. [Google Scholar] [CrossRef]
  17. Conrad, K.D.; Klein, J. Molecular weight determination of polyacrylamide and polyacrylamide-co-sodium acrylate. Makromol. Chem. 1978, 179, 1635–1638. [Google Scholar]
  18. Castillo, I.; Gutierrez, L.; Hernandez, V.; Díaz, E.; Ramirez, A. Hemicelluloses monosaccharides and their effect on molybdenite flotation. Powder Technol. 2020, 373, 758–764. [Google Scholar] [CrossRef]
  19. Laskowski, J.S.; Liu, Q.; O’Connor, C.T. Current understanding of the mechanism of polysaccharide adsorption at the mineral/aqueous solution interface. Int. J. Miner. Process. 2007, 84, 59–68. [Google Scholar] [CrossRef]
  20. Chander, S.; Fuerstenau, D.W. On the natural floatability of molybdenite. Trans. Soc. Min. Eng. AIME 1972, 252, 62–68. [Google Scholar]
  21. Yuan, D.; Cadien, K.; Liu, Q.; Zeng, H. Separation of talc and molybdenite: Challenges and opportunities. Miner. Eng. 2019, 143, 105923. [Google Scholar] [CrossRef]
  22. López-Valdivieso, A.; Madrid-Ortega, I.; Valdez-Pérez, D.; Yang, B.; Song, S. The heterogeneity of the basal plane of molybdenite: Its effect on molybdenite floatability and calcium ion adsorption. In Proceedings of the 9th International Mineral Processing Conference, Santiago, Chile, 20–23 November 2012; pp. 20–23. [Google Scholar]
  23. Gutierrez, L.; Uribe, L.; Hernandez, V.; Vidal, C.; Texeira-Mendonca, R. Assessment of the use of lignosulfonates to separate chalcopyrite and molybdenite by flotation. Powder Technol. 2019, 359, 216–225. [Google Scholar] [CrossRef]
  24. Hernandez, V.; Ulloa, A.; Gutierrez, L. Use of wood hemicelluloses to improve copper recovery from high clay Cu-Mo ores. Miner. Eng. 2017, 111, 198–200. [Google Scholar] [CrossRef]
Figure 1. Chemical structures of non-ionic, anionic (carboxylated (a) and sulfonated (b)), cationic polyacrylamides (c), and amide group (d).
Minerals 10 00895 g001
Figure 2. Schematic of the microflotation procedure.
Minerals 10 00895 g002
Figure 3. FTIR spectra of PAM flocculant.
Minerals 10 00895 g003
Figure 4. Plots of the left side of Equation (2) vs. 1/c obtained for NS–PAM, MS–PAM, and SS–PAM.
Minerals 10 00895 g004
Figure 5. Recovery of molybdenite as a function of pH in the presence of 2.5, 5.0, 7.5, and 10.0 mg/L of NS-PAM, MS-PAM, and SS-PAM.
Minerals 10 00895 g005
Figure 6. (a) Induction times as a function of NS-PAM/MS-PAM/SS-PAM concentrations and at pH = 9; (b) images of bubble-particles attachment.
Minerals 10 00895 g006
Figure 7. Adsorption isotherms of NS–PAM, MS–PAM, and SS–PAM on molybdenite at different values of pH.
Minerals 10 00895 g007
Figure 8. Electrophoretic mobility distributions of particles of molybdenite in the presence of NS–PAM, MS–PAM, and SS–PAM and at different values of pH.
Minerals 10 00895 g008
Table 1. Characterization of polyacrylamide (PAM) bands through Fourier transform infrared (FTIR).
Peak Position (cm−1)Assignation
3436N–H asymmetric vibration of NH2
2923C–H asymmetric vibration of CH2
2848C–H asymmetric vibration of CH2
1638C=O vibration of CONH2, amide band
1550C–O asymmetric vibration of COO
1433C–O asymmetric vibration of COOy C–N (overlapping)
1119N–H torsión de NH2
Table 2. Electrophoretic mobility and turbidity.
Average Electrophoretic Mobility, (μm/V)/(s/cm) (10 mg/L flocculant)
PAM conditionpH = 7pH = 9pH = 11
NO–PAM−7.8−8.0−8.3
NS–PAM−7.3−7.7−8.2
MS–PAM−7.2−7.7−7.9
SS–PAM−6.6−7.0−7.5