Article

The Differences in Evaluation of Flotation Kinetics of Talc Ore Using Statistical Analysis and Response Surface Methodology

Institute of Earth Resources, Faculty of Mining, Ecology, Process Control and Geotechnology, Technical University of Kosice, 040 01 Kosice, Slovakia
*
Author to whom correspondence should be addressed.
Minerals 2020, 10(11), 1003; https://doi.org/10.3390/min10111003
Submission received: 5 October 2020 / Revised: 29 October 2020 / Accepted: 9 November 2020 / Published: 11 November 2020
(This article belongs to the Section Mineral Processing and Extractive Metallurgy)

Abstract

:
This paper investigates the effect of sodium hexametaphosphate (SHMP) depressant/dispersant in the presence of methyl isobutyl carbinol (MIBC) frother and soluble starch (SS) depressant on the flotation kinetics of talc ore. Emphasis is on a comparison between the evaluation of a custom design of experiment (DoE) using the multilinear regression analysis (MRA) and response surface methodology (RSM) approach. Although analysis of variance (ANOVA) is a good first step in the evaluation of the effect of factors on froth flotation processing, it nonetheless only reveals the effects that are the same under all conditions. In the case of SHMP, its effect on separation efficiency is positive; however, if it is used along with SS, the effect is negative. Moreover, if a higher frother dosage is used, the effect of SHMP on separation efficiency is negligible.

1. Introduction

Froth flotation is the most widely used mineral processing method in the mining industry. It is a complex process incorporating many factors and, despite being introduced over a century ago, froth flotation is not yet fully understood [1].
Flotation as a separation method uses the difference in surface properties of valuable and gangue minerals. In a three-phase environment, of a flotation pulp, air bubbles are used to capture particles based on the difference in their surface hydrophobicity. Hydrophobic particles will more likely attach to the bubble interface due to a strong adhesion force compared to hydrophilic particles [2]. For an efficient separation, it is necessary to achieve such a state, where the grains of valuable mineral stabilize at the surface of the phase interface and grains of the gangue minerals stay inside the volume of the phase. Most of the flotation plants use a range of chemical reagents to selectively render the surfaces of the minerals hydrophobic or hydrophilic [3]. However, the mineralogical composition of some ores allows their processing using only a frother, without affecting mineral surfaces. An example is a native flotation of talc ore [4,5,6,7] or the collectorless flotation of sulfide minerals [8,9] and coal [10,11].
Nonetheless, even without using any additional flotation reagents, other physical, chemical, and engineering aspects of flotation must be considered [12]. The use of modeling based on first-order kinetics is, therefore, a reasonable practice used to describe practical flotation behavior in plants. This allows the effects of several variables to be lumped into two or three parameters, depending on the chosen model [13]. In general, the kinetics of flotation is a time–recovery curve, where the recovery of mineral rises with time up to an asymptotic value of infinite recovery, which is generally less than 100%. The rate at which the mineral particles are recovered (slope of the time–recovery curve) is given by the kinetic constant [14].
Determination of the flotation kinetics is also recommended in modern practice as a standard laboratory flotation test procedure when enough sample is available [15]. There are two main advantages of determining the time-dependent recovery over flotation tests with defined flotation time or tests running till all the generated froth is skimmed. On the one hand, the estimated parameters can be used in the modeling and simulation of flotation circuits [16,17]. On the other hand, the effects of various variables can be studied in terms of their effects on flotation kinetics rather than just a single achieved value [18,19,20].
In our recent paper [21], we investigated the effect of sodium hexametaphosphate (SHMP) alone and in the presence of soluble starch (SS) on the flotation kinetics of talc ore and compared it to a native flotation using only methyl isobutyl carbinol (MIBC) frother. Earlier studies found that SHMP acts as a selective depressant/dispersant of carbonates [6,22] and silicates [23], which are mineral groups commonly associated with talc, and described some phenomena behind it. Our intention was to determine whether SHMP improves the results of froth flotation processing by affecting the rate of flotation or the fraction of recoverable particles. We evaluated the time-based flotation experiments using the analysis of variance (ANOVA) test. Although the null hypothesis was rejected for various investigated dependent variables and we were able to draw conclusions about the effect of the factors on flotation kinetics of both talc and gangue particles, concentrate grade, and yield, we were unable to statistically confirm the effect of SHMP on the efficiency of separation.
While many of the studies mainly focus on the achieved recoveries or the grade of the concentrate, we believe that it is necessary to also evaluate the efficiency of the separation. In many cases, attempts to maximize the recovery of the valuable mineral (e.g., by using higher collector dosages, finer grinding, etc.) may lead to a significant drop in concentrate grade (i.e., the recovery of the gangue minerals is also increased) and vice versa (e.g., in the case of using depressants). Separation efficiency combines the measured or calculated variables into a single figure and may, therefore, represent a better estimation of the performance of the studied factors [24,25,26,27]. Another advantage of using separation efficiency for the evaluation of the results is also the fact that it considers variations in the feed grade. It was shown that there is a link between froth grade and flotation feed grade [28] and, while it is a common practice to homogenize the material prior to testing, some variation in the composition between individual test runs must still be expected.
Talc is usually a problematic mineral in flotation, and depression of talc is more important than collection. In this paper, we discuss the importance of more in-depth analysis of the froth flotation results in order not to overlook the effects of the factors on the outcomes of the separation. This was the case of our previous interpretation of the results using only the ANOVA test. We also provide some insight into reasons why the response surface methodology (RSM) also revealed statistically important effects that were not detected by the ANOVA test.

2. Materials and Methods

2.1. Materials

Talc ore from a local supplier in Slovakia (Gemerska Poloma) was used. The main gangue mineral groups in the ore sample were silicate minerals (laminated phyllites with various chemical composition), oxide (quartz), carbonates (mainly dolomite), and sulfide minerals (mainly pyrite). Individual samples were crushed in a crucible and analyzed. The results of the chemical analysis are shown in Table 1. A homogenized sample was crushed in two stages and ground in a dry ball mill. The laboratory ball mill used had a volume of 30 dm3 and was filled with steel balls with diameters ranging from 2 to 10 cm. The material formed 40% of the mill volume and the revolution was adjusted to 90 per minute. Screening or sieving was used prior to each comminution stage to avoid overgrinding of the ore. In all, 98% of the ground ore passed through the 225 μm sieve with a d80 value of 150 μm.

2.2. Flotation Test

Flotation experiments were carried out in an automated laboratory froth flotation machine using a 3-L Denver type flotation cell [29]. The slurry contained 300 g.L−1 solids and the temperature was kept at 20 °C during all the experiments. After the weighed material was transferred to the agitated cell (1600 rpm), reagents were added, and 5 to 25 min of conditioning were allowed depending on the number and character of the reagents used in individual flotation tests. After the end of the conditioning period, air was introduced into the cell with airflow electronically regulated to 5 L min−1. Three froth products were collected in each flotation tests, i.e., skimmed for 2, 3, and 5 min, resulting in a cumulative flotation time of 10 min. Four products (the three froth products and a cell product) were then filtered, dried, and weighed and a representative sample was taken for analysis. Each laboratory froth flotation test was repeated twice.
Custom design of experiment (DoE) was used in order to evaluate the effect of SHMP alone and in the presence of SS on flotation kinetics of the ore. Methyl isobutyl carbinol (MIBC) was used as a frother in every flotation test. The DoE summarized in Table 2 contained also two test runs aimed at native flotation of the ore (# 100 and # 200), which were used as a reference in the evaluation of the effect of the reagents against native flotation of the ore.

2.3. Separation Efficiency

From the measured weight of the four obtained products, first individual and then cumulative yields (γ) were calculated. Results of the grade analyses and calculated yields were then used to calculate the cumulative product grade (c) in terms of talc content [21]. Cumulative yields of the froth product, the content of talc in the cumulative froth product at the three different flotation times (τ), and content of talc in the feed (α) were then used to calculate the recovery of talc (Rt using Equation (1)) and gangue minerals (Rg using Equation (2)) to the froth product (talc concentrate) as follows:
τ R t = τ β α τ γ
τ R g = 100 τ β 100 α τ γ
Separation efficiency (τη) at the time τ was then calculated as a difference between the achieved recovery of talc and gangue minerals using Equation (3) [24] as follows:
τ η = τ R t τ R g

2.4. Statistical Analysis and RSM

The main effects of the factors on the test results were calculated in MATLAB software, version 9.4 (R2018a) using the anovan function (N-way analysis of variance). Covariance was calculated for each statistically significant pair of an independent and dependent variable (p < 0.05) in order to determine the tendency in the linear relationship between the variables. Response surfaces were calculated using the MATLAB function regstats which performs a multilinear regression of the responses. Constant, linear, and interaction terms were used in calculations. In the case of three factors, this resulted in the calculation of seven coefficients based on Equation (4) as follows:
Y = b0 + b1X1 + b2X2 + b3X3 + b12X1X2 + b13X1X3 + b23X2X3
When also the fourth factor was considered, namely flotation time, eleven coefficients were calculated based on Equation (5) as follows:
Y = b0 + b1X1 + b2X2 + b3X3 + b4X4 + b12X1X2 + b13X1X3
+ b14X1X4 + b23X2X3 + b24X2X4 + b34X3X4
In Equations (4) and (5), Y is the predicted value of the response variable, b represents the calculated coefficients, X represents the investigated factors, i.e., dosage of the three reagents (MIBC, SHMP, and SS) and common logarithm of flotation time (log10 τ). The coefficient of determination (R2) was used as a measure of how well the experimental results are replicated by the model.

3. Results and Discussion

It has been previously shown that the presence of very fine particles has a negative effect on the concentrate grade due to the entrainment effect [4,30,31] and possibly also because of the formation of slime mineral coatings on surfaces of talc particles [22,23]. To minimize the influence of the entrainment effect on the results of the flotation tests, two approaches were used as follows: rather extensive use of screening or sieving during the comminution stage and froth washing during flotation tests [21]. Removal of fine particles prior to the next comminution stage is a common practice used to prevent overgrinding of the ore. We were thus able to achieve d80 = 150 μm with only about 20% of particles below 25 μm, which are most likely to be recovered by the entrainment effect [30]. Froth washing was used instead of a simple water addition to keep the pulp–froth interface stable during the tests and to further reduce the entrainment effect [31]. The results summarized in Table 3 therefore mainly reflect the real effects of the addition of investigated reagents with a focus on the effect of SHMP.
Back-calculation of the talc content in the feed from the yields and grades listed in Table 3 results in a mean α = 71.1% ± 1.7%. The calculated standard deviation of 1.7 %is a result of measurement errors during weighing and grade analysis of the individual products and certain heterogeneity of the feed composition, although much effort was made to minimize it by thoroughly homogenizing the feed prior to flotation tests.
Some conclusions can be drawn directly from the measured results, e.g., that the product with the highest grade was prepared using both of the additional reagents (#112), that the highest talc recovery is achieved by native flotation using only frother (#100 and #200) or that the highest efficiency was obtained with the addition of SHMP (#210 and #220). Nevertheless, statistical evaluation of the results provides a better understanding of the effect and significance of the investigated reagents.
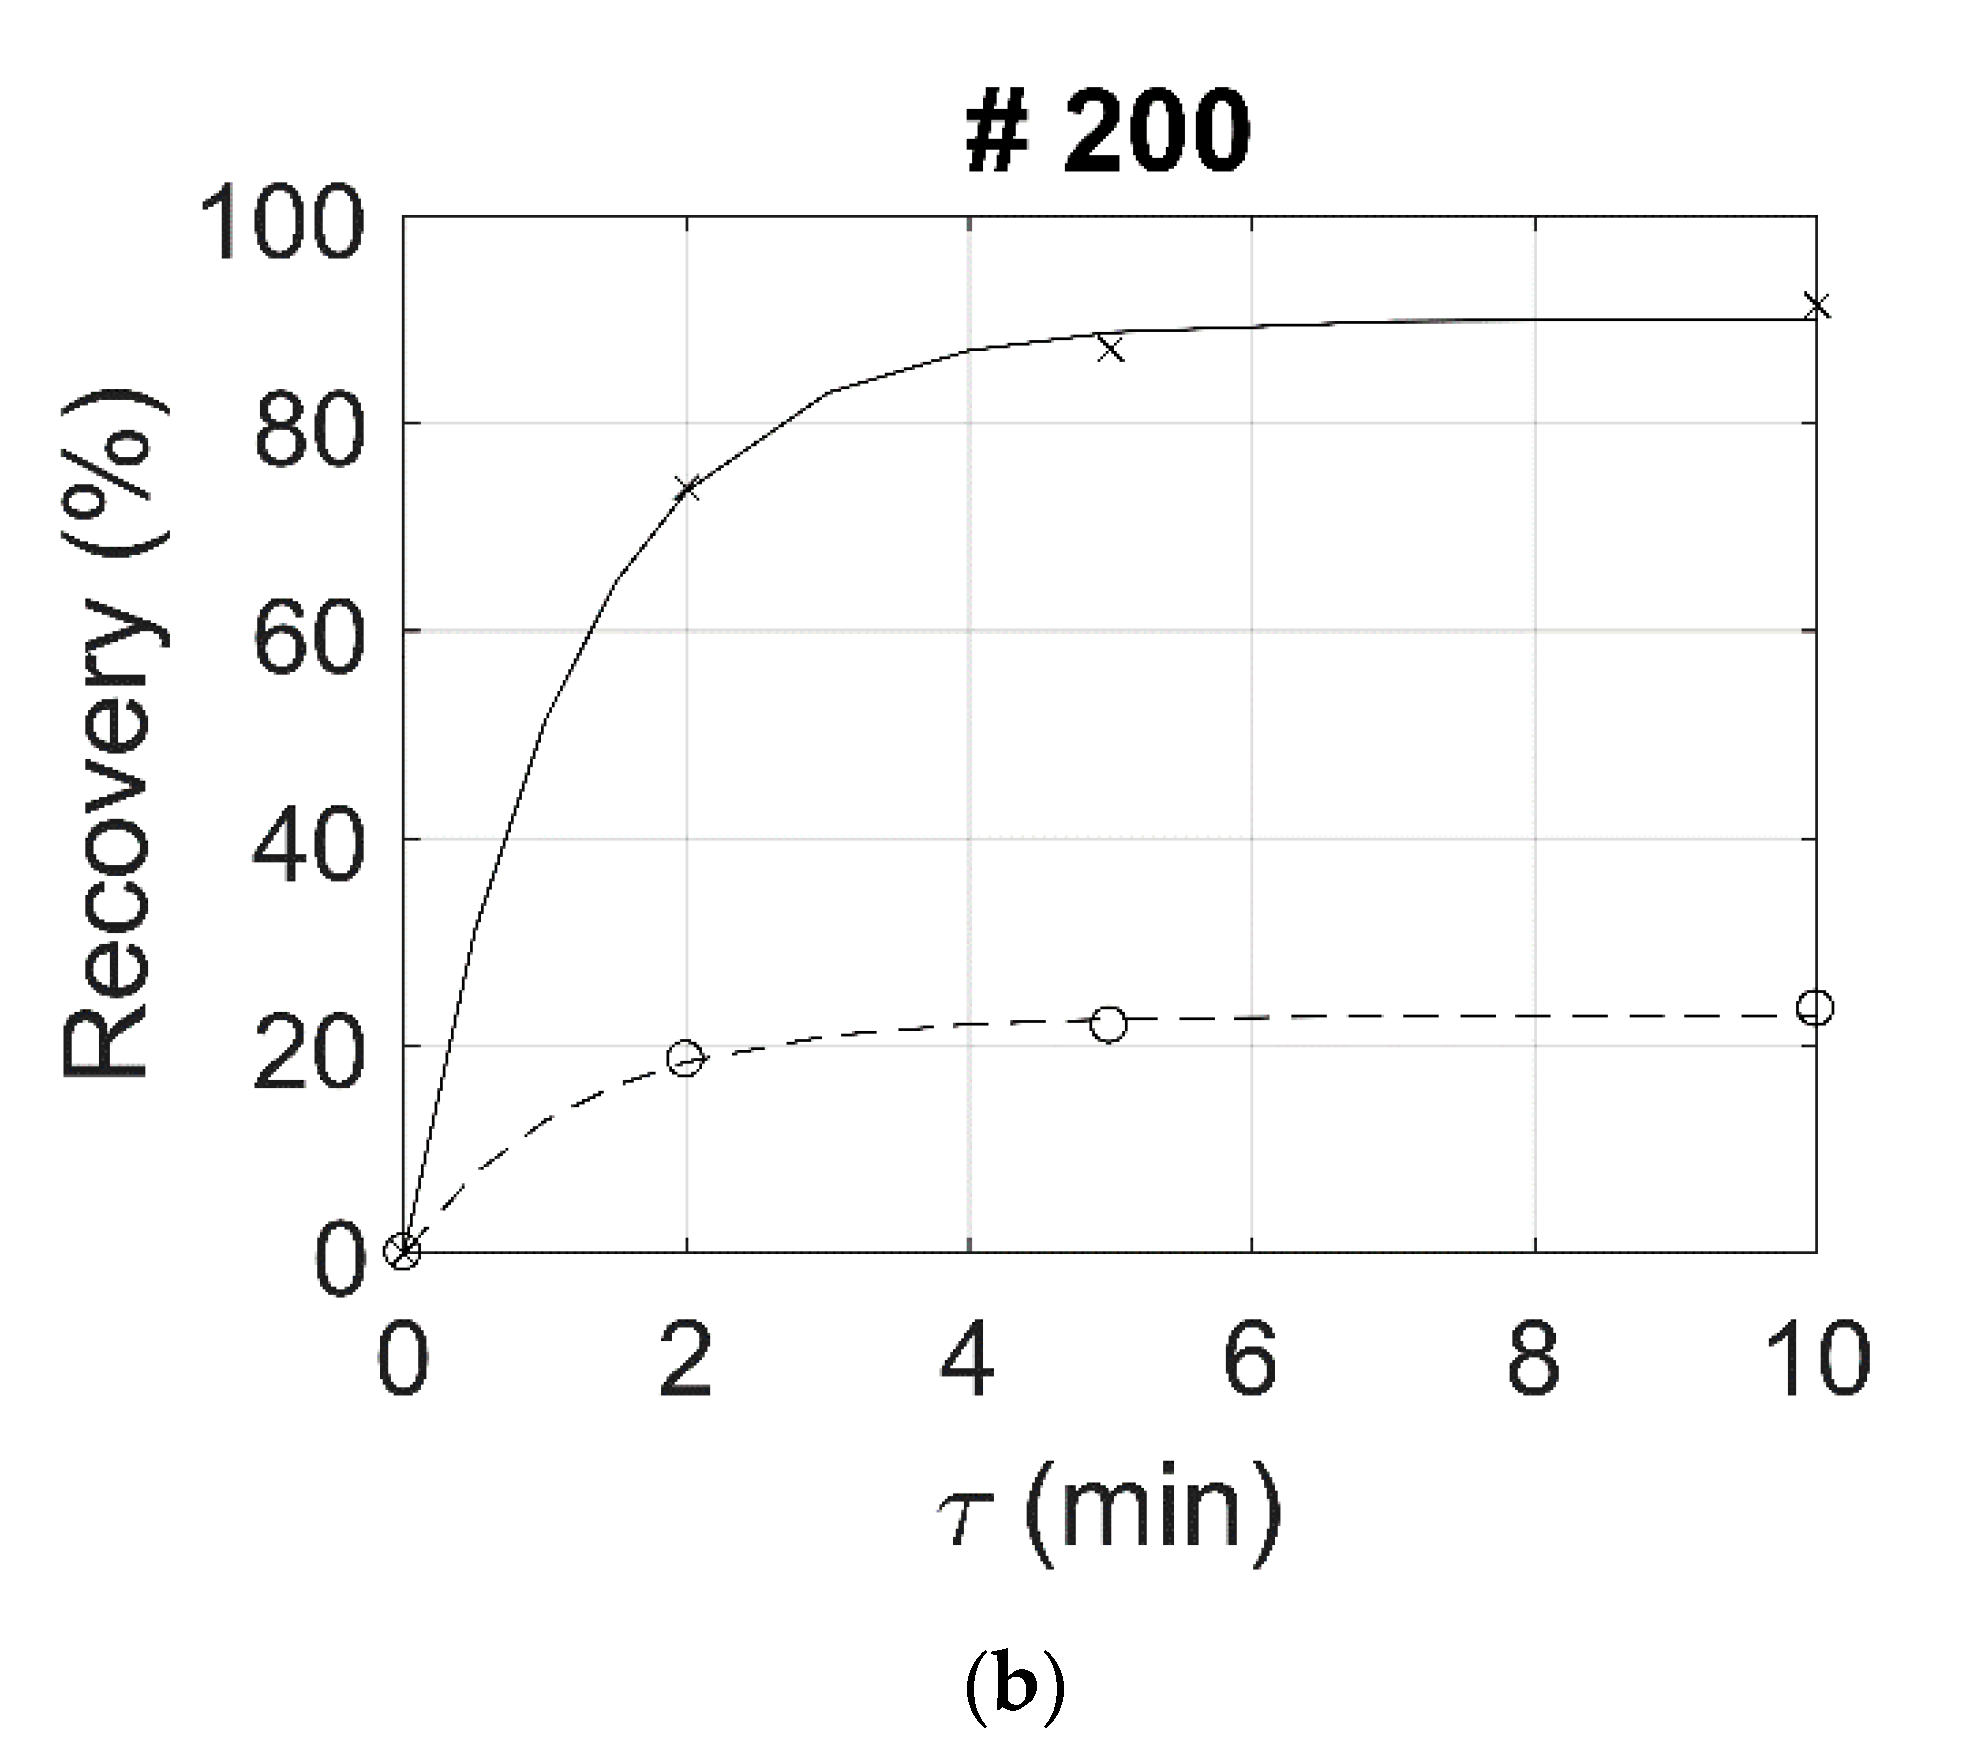
The kinetics of the two tests focused on the native flotation of talc from the ore (#100 and #200), which will be used as a comparison for the results measured in the presence of the other reagents, as is shown in Figure 1.
In both cases, the cumulative recovery of talc and gangue minerals increases with flotation time, even though most of the final recovery is achieved in the first five minutes of flotation. This is also the case of other tests with 91.3% ± 3.4% of the recoverable talc reporting to froth product within five minutes of the flotation separation. Therefore, the emphasis during the interpretation is put on the results achieved after five minutes of flotation.

3.1. Analysis of Variance and Covariance

Running the ANOVA test resulted in the calculation of the p-values summarized in Table 4. A significance level of 0.05 was chosen for the interpretation of the results.
Calculated covariance of the statistically significant factor–response variable pairs achieved after five minutes of flotation is summarized in Table 5. Only the sign of the calculated value is shown as no conclusions can usually be drawn from magnitudes of the values.
From the combination of the ANOVA test (Table 4) and covariance (Table 5), the following conclusions can be drawn:
  • MIBC increases froth yield by increasing the recovery of talc. This has a positive effect on separation efficiency.
  • SHMP lowers the yield of the froth product by lowering the recovery of both talc and gangue minerals. However, the drop in gangue minerals recovery is relatively higher, which positively affects froth grade. Effect of SHMP on separation efficiency cannot be statistically proven by the ANOVA test.
  • SS negatively affects froth yield by lowering the recovery of both talc and gangue minerals, like SHMP. However, the use of SS results in unambiguously lower separation efficiency.
While the conclusions noted above are correct, such an evaluation did not provide an answer on the effect of SHMP on separation efficiency. It was already noted that SHMP was used in the two flotation tests with the highest calculated separation efficiency and we expected this to bounce back. Therefore, such an evaluation may be insufficient.

3.2. Response Surface Methodology

A more robust statistical approach was employed in order to more deeply understand the effects of the investigated factors, mainly the effect of SHMP on separation efficiency. Seeing that several previous papers aimed at optimization of froth flotation performance have successfully used the response surface methodology [25,32,33,34], we opted for the same approach.
Calculated coefficients of the response surface (Equation (4)) are summarized in Table 6. Only models with R2 > 0.9 between the experimental and model values are shown.
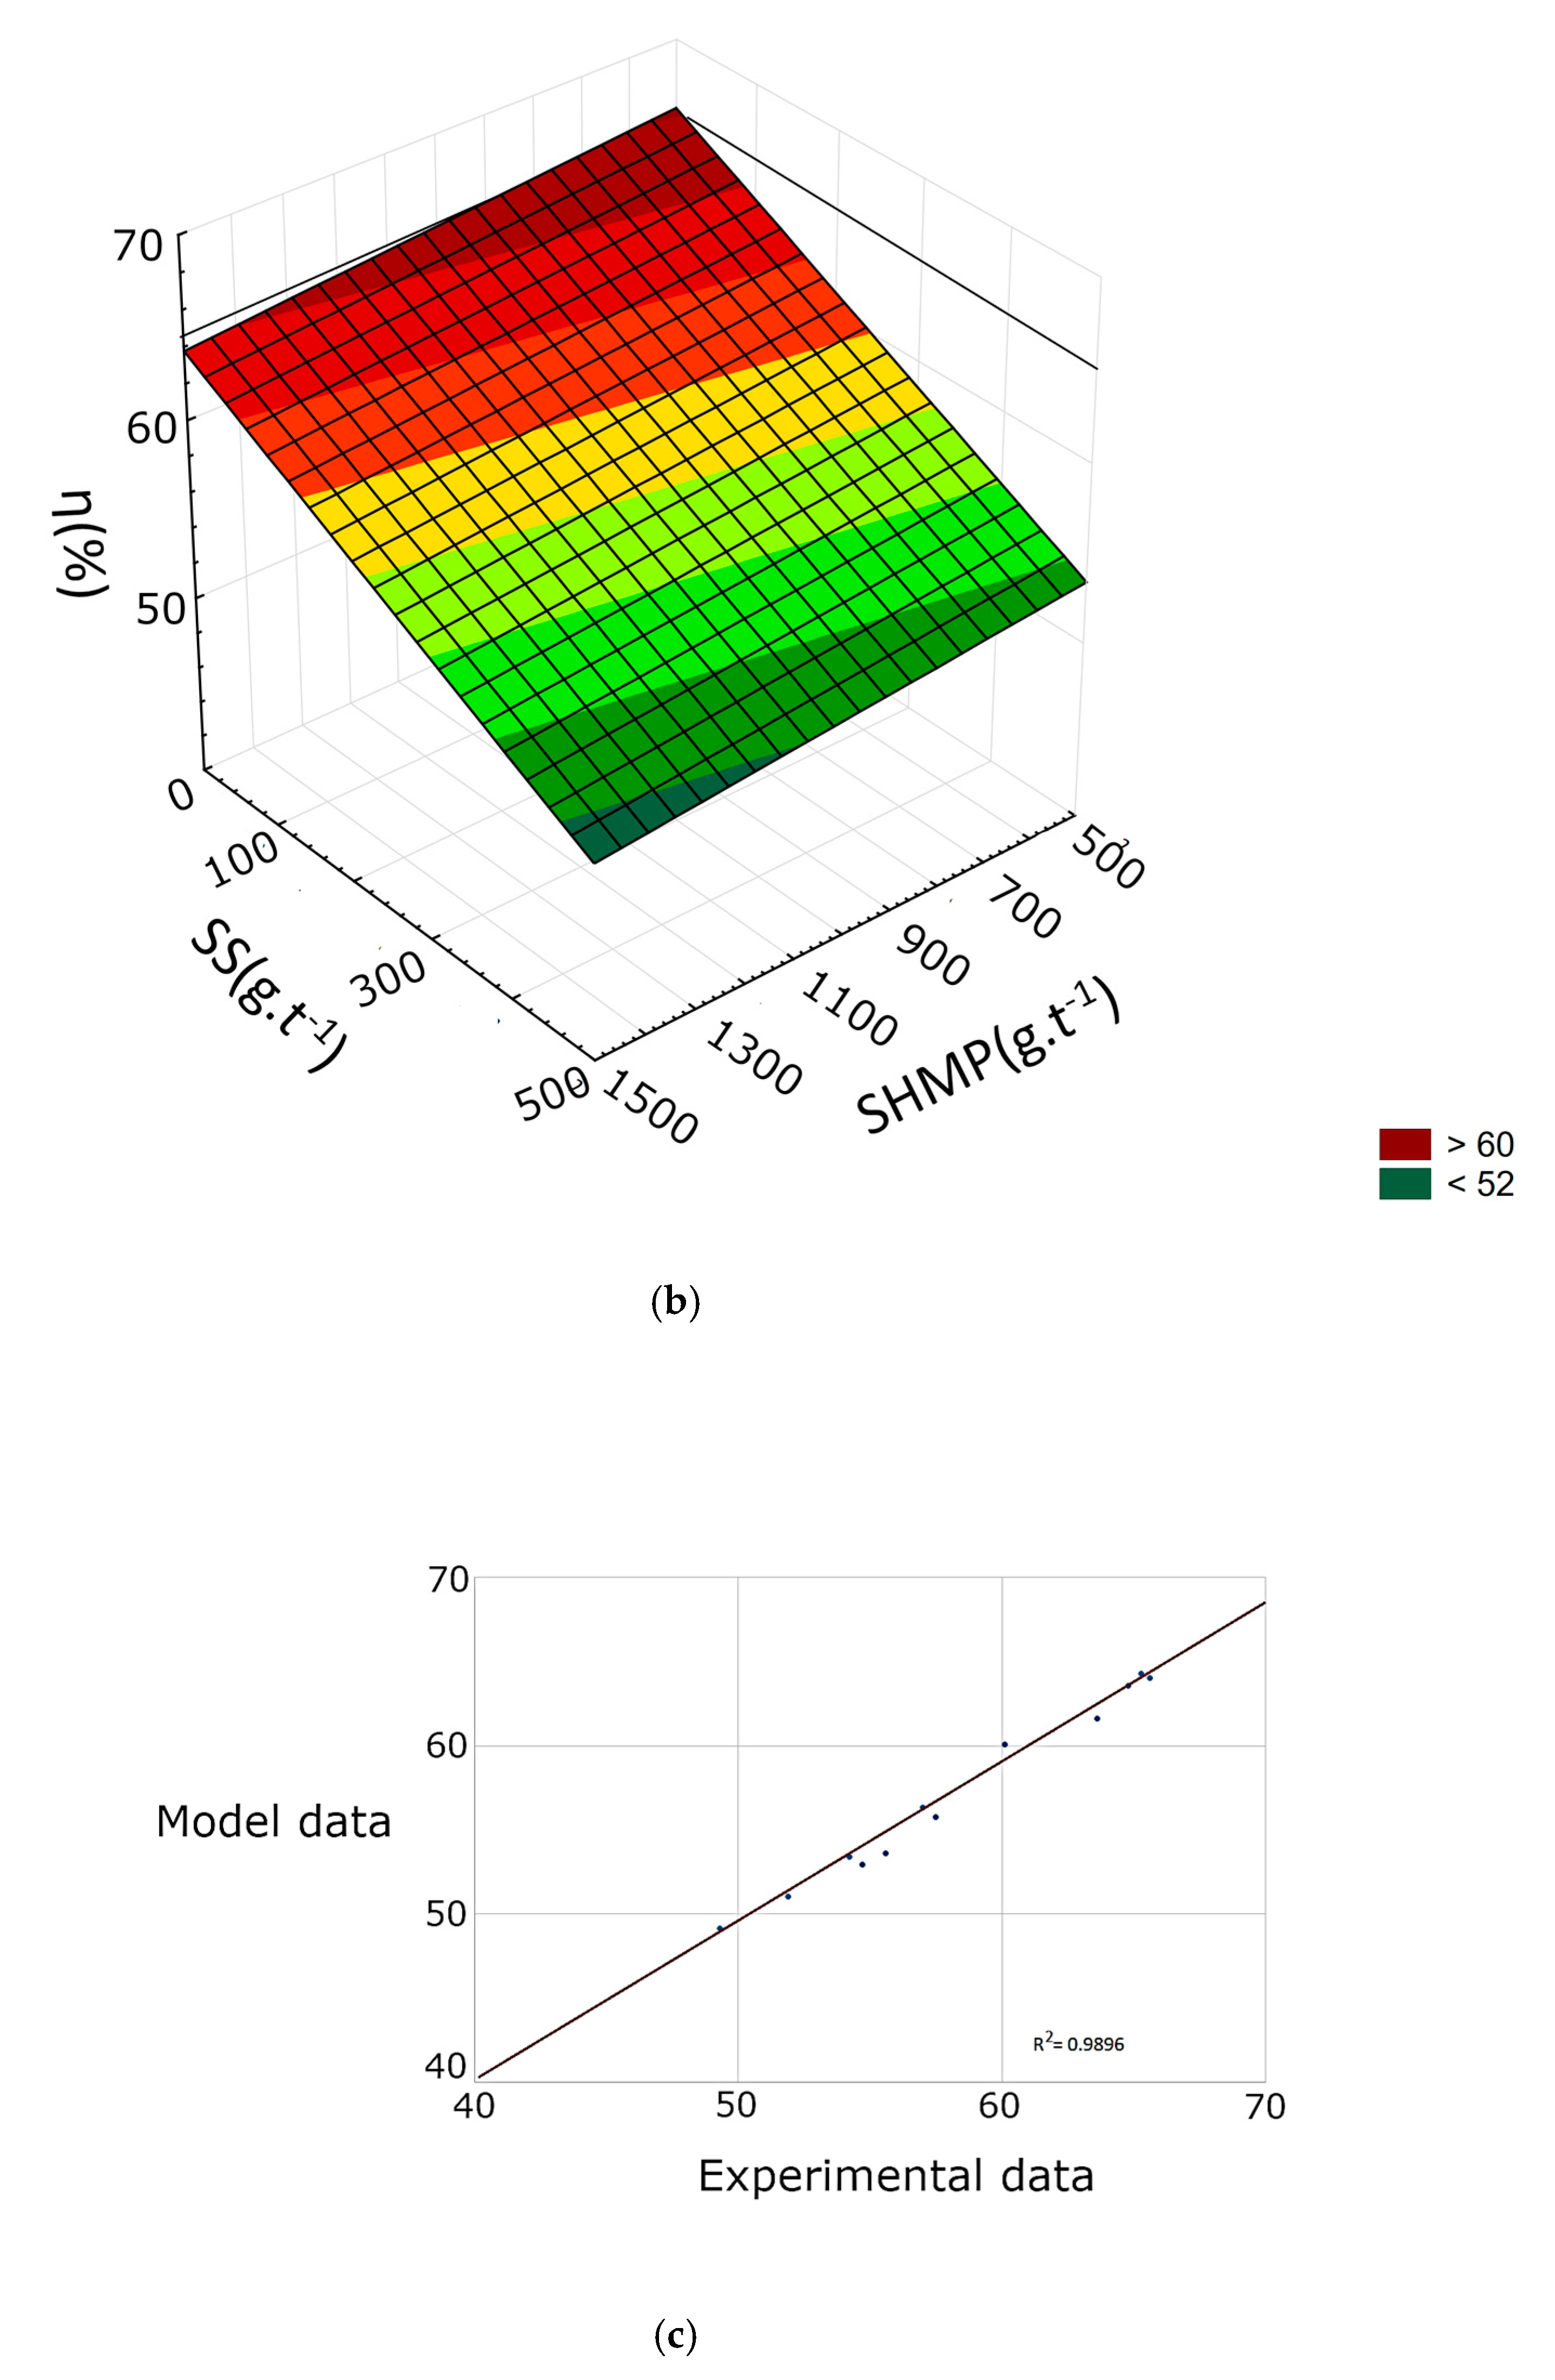
Using the response surface methodology, we were able to model the yield of the froth product, talc recovery, and separation efficiency with a satisfactory goodness of fit. A quick comparison of the R2 values displayed in Table 6 while also considering the omitted ones (with R2 < 0.9) suggests that the goodness of fit between the experimental data and model values declines in the following order: η > Et > γ > Eg > c. Separation efficiency is thus the response variable best resembled by the chosen response surface equation. At all three flotation times, the fitted function reaches R2 > 0.95, and after τ = 5 min the R2 = 0.9896 suggesting a very strong relationship between the predicted and experimental values. Moreover, residuals of 5γ and 5Et are as high as 4% in absolute terms, while in the case of 5η they only reach about 1% (see Figure 2c, Figure 3c, and Figure 4c).
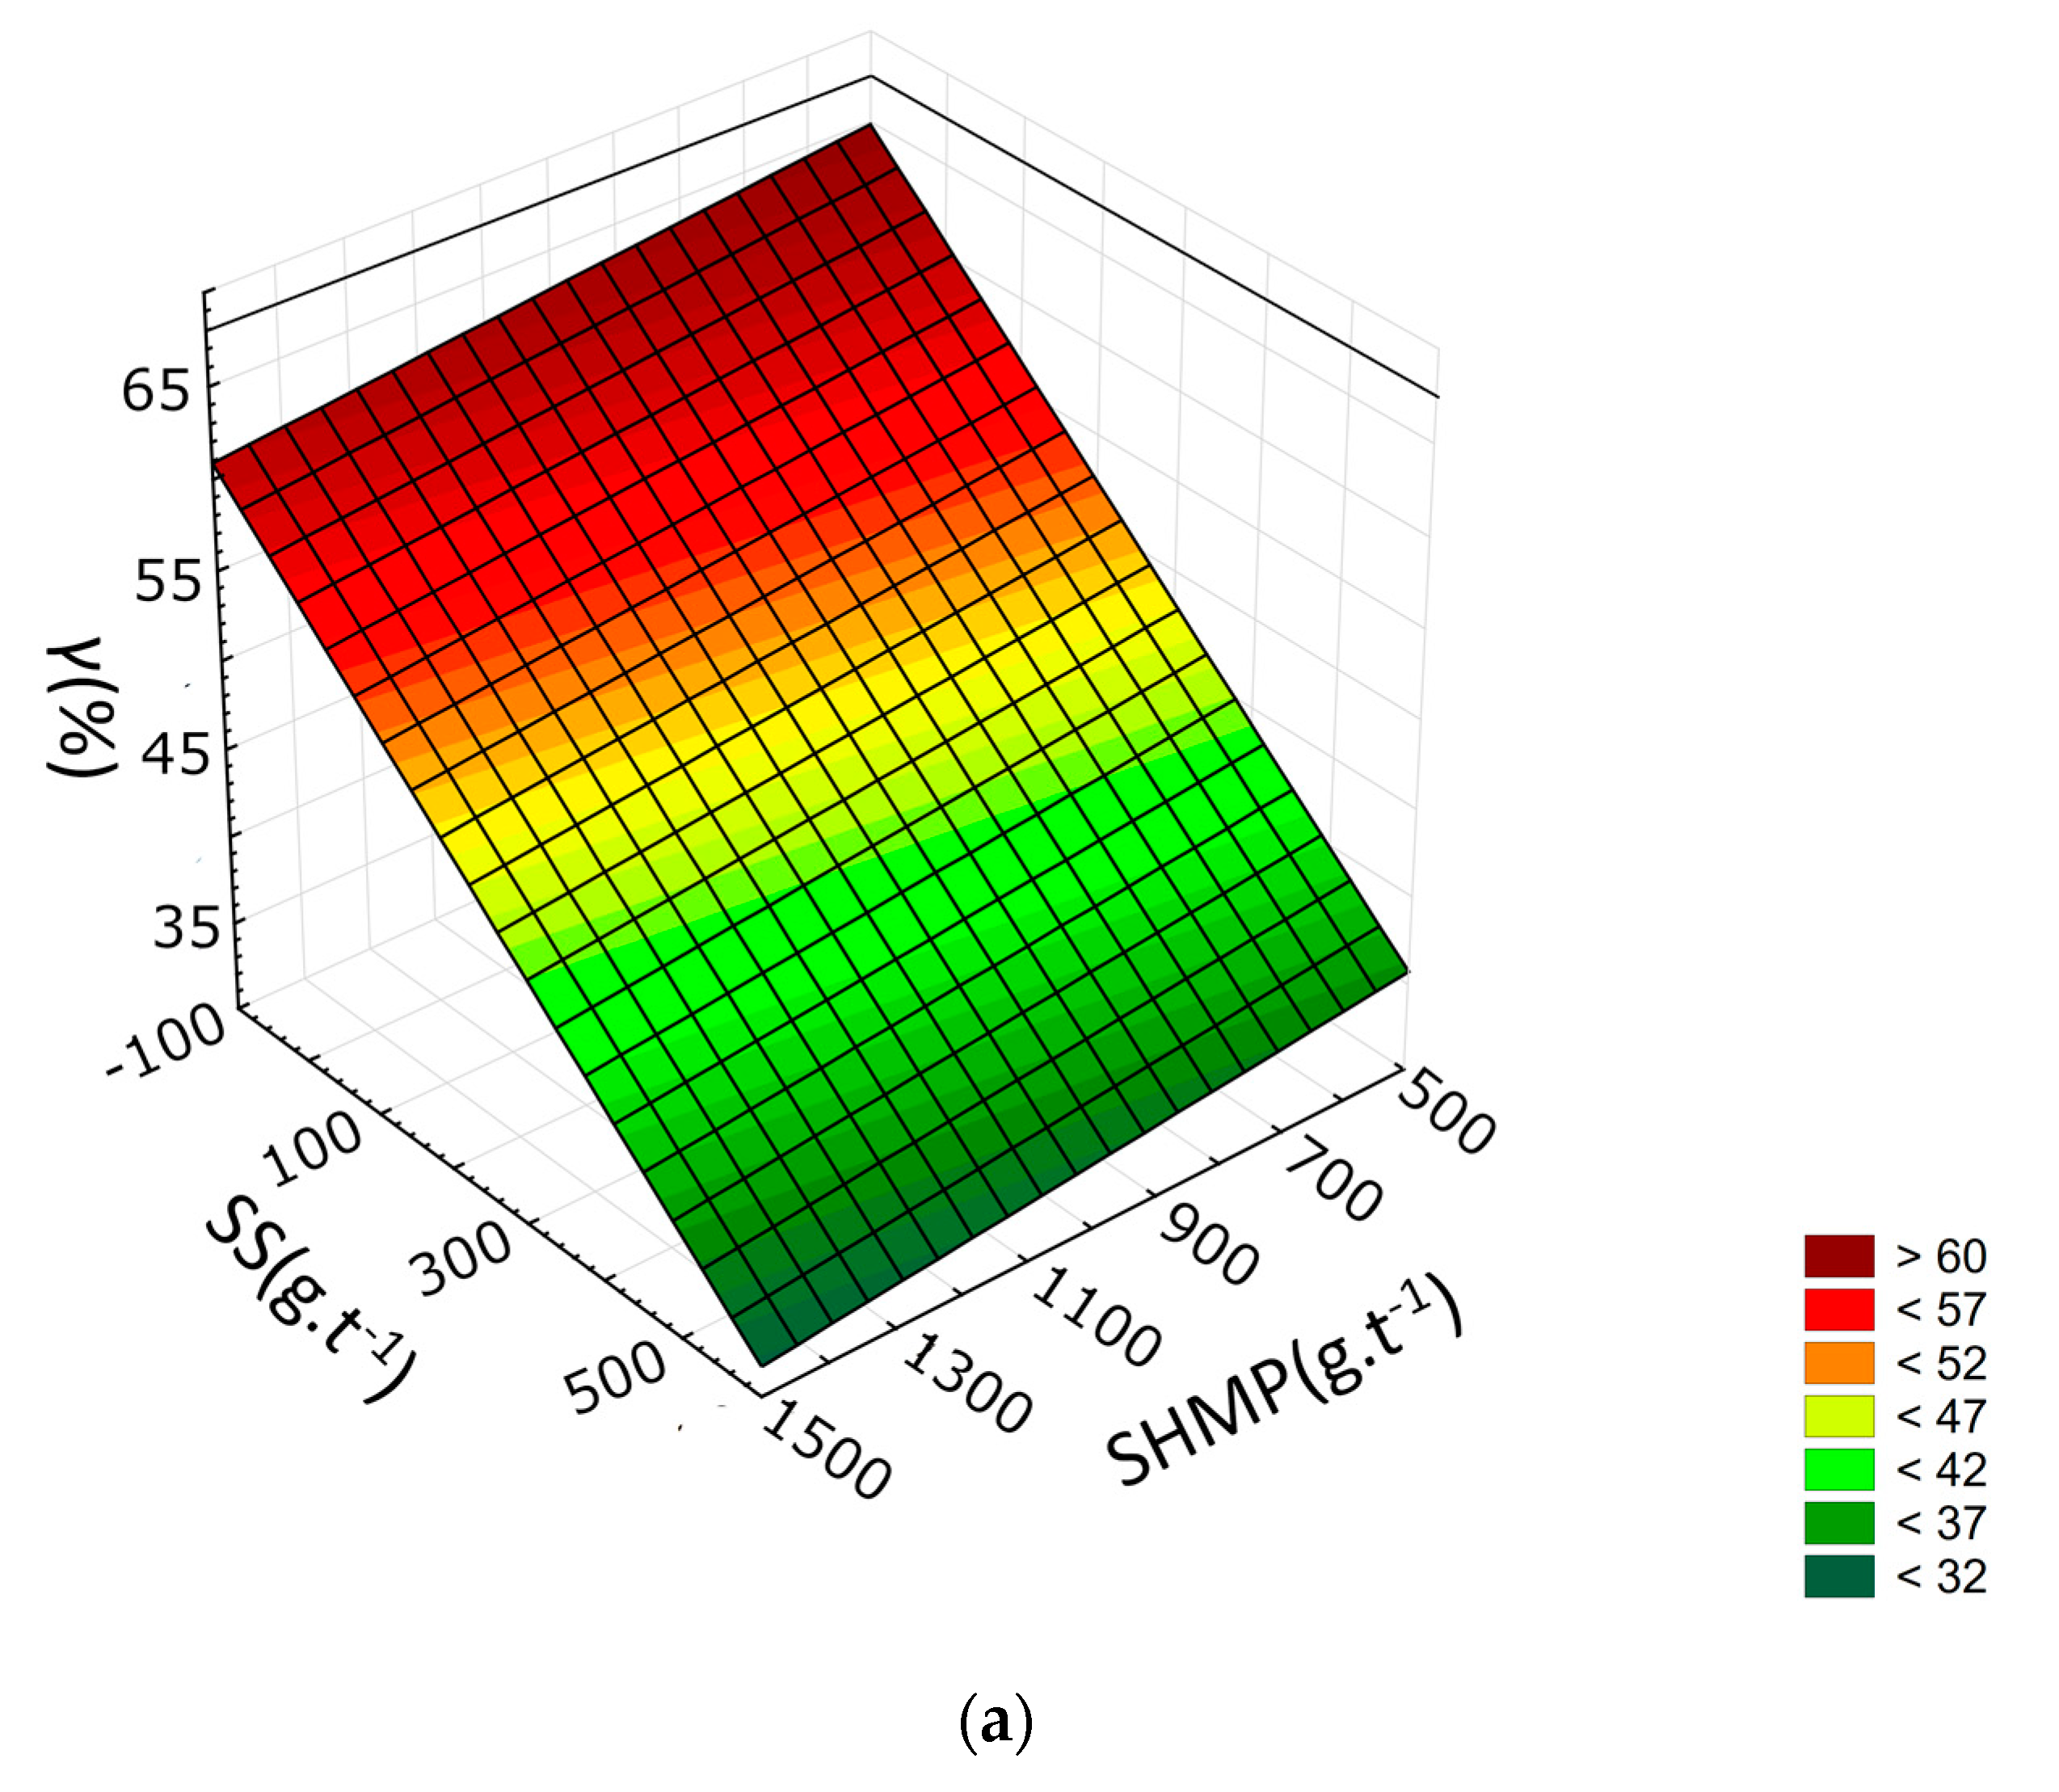
Although the DoE contained two test runs with MIBC as the only reagent, i.e., native flotation of talc, which was also included in the calculation of the response surfaces, these are only displayed in the graphical interpretation of the results as a quasi-plane circumscribed by thick black lines. From the resulting Figure 2a,b, it can be concluded that the effect of SS on the yield of the froth product is much stronger when compared to the effect of SHMP. Moreover, there is almost no decrease in τ caused by SHMP in the presence of the highest doses of SS coupled with a higher dose of MIBC (see Figure 2b). In contrast, the dosage of 500 g.t−1 SS causes a significant drop in the τ of over 20%, regardless of the MIBC dosage. Although the decrease in the froth yield does not automatically mean a negative effect, if the drop was caused mainly by the decreased recovery of the gangue minerals rather than recovery of talc, the overall effect would be positive.
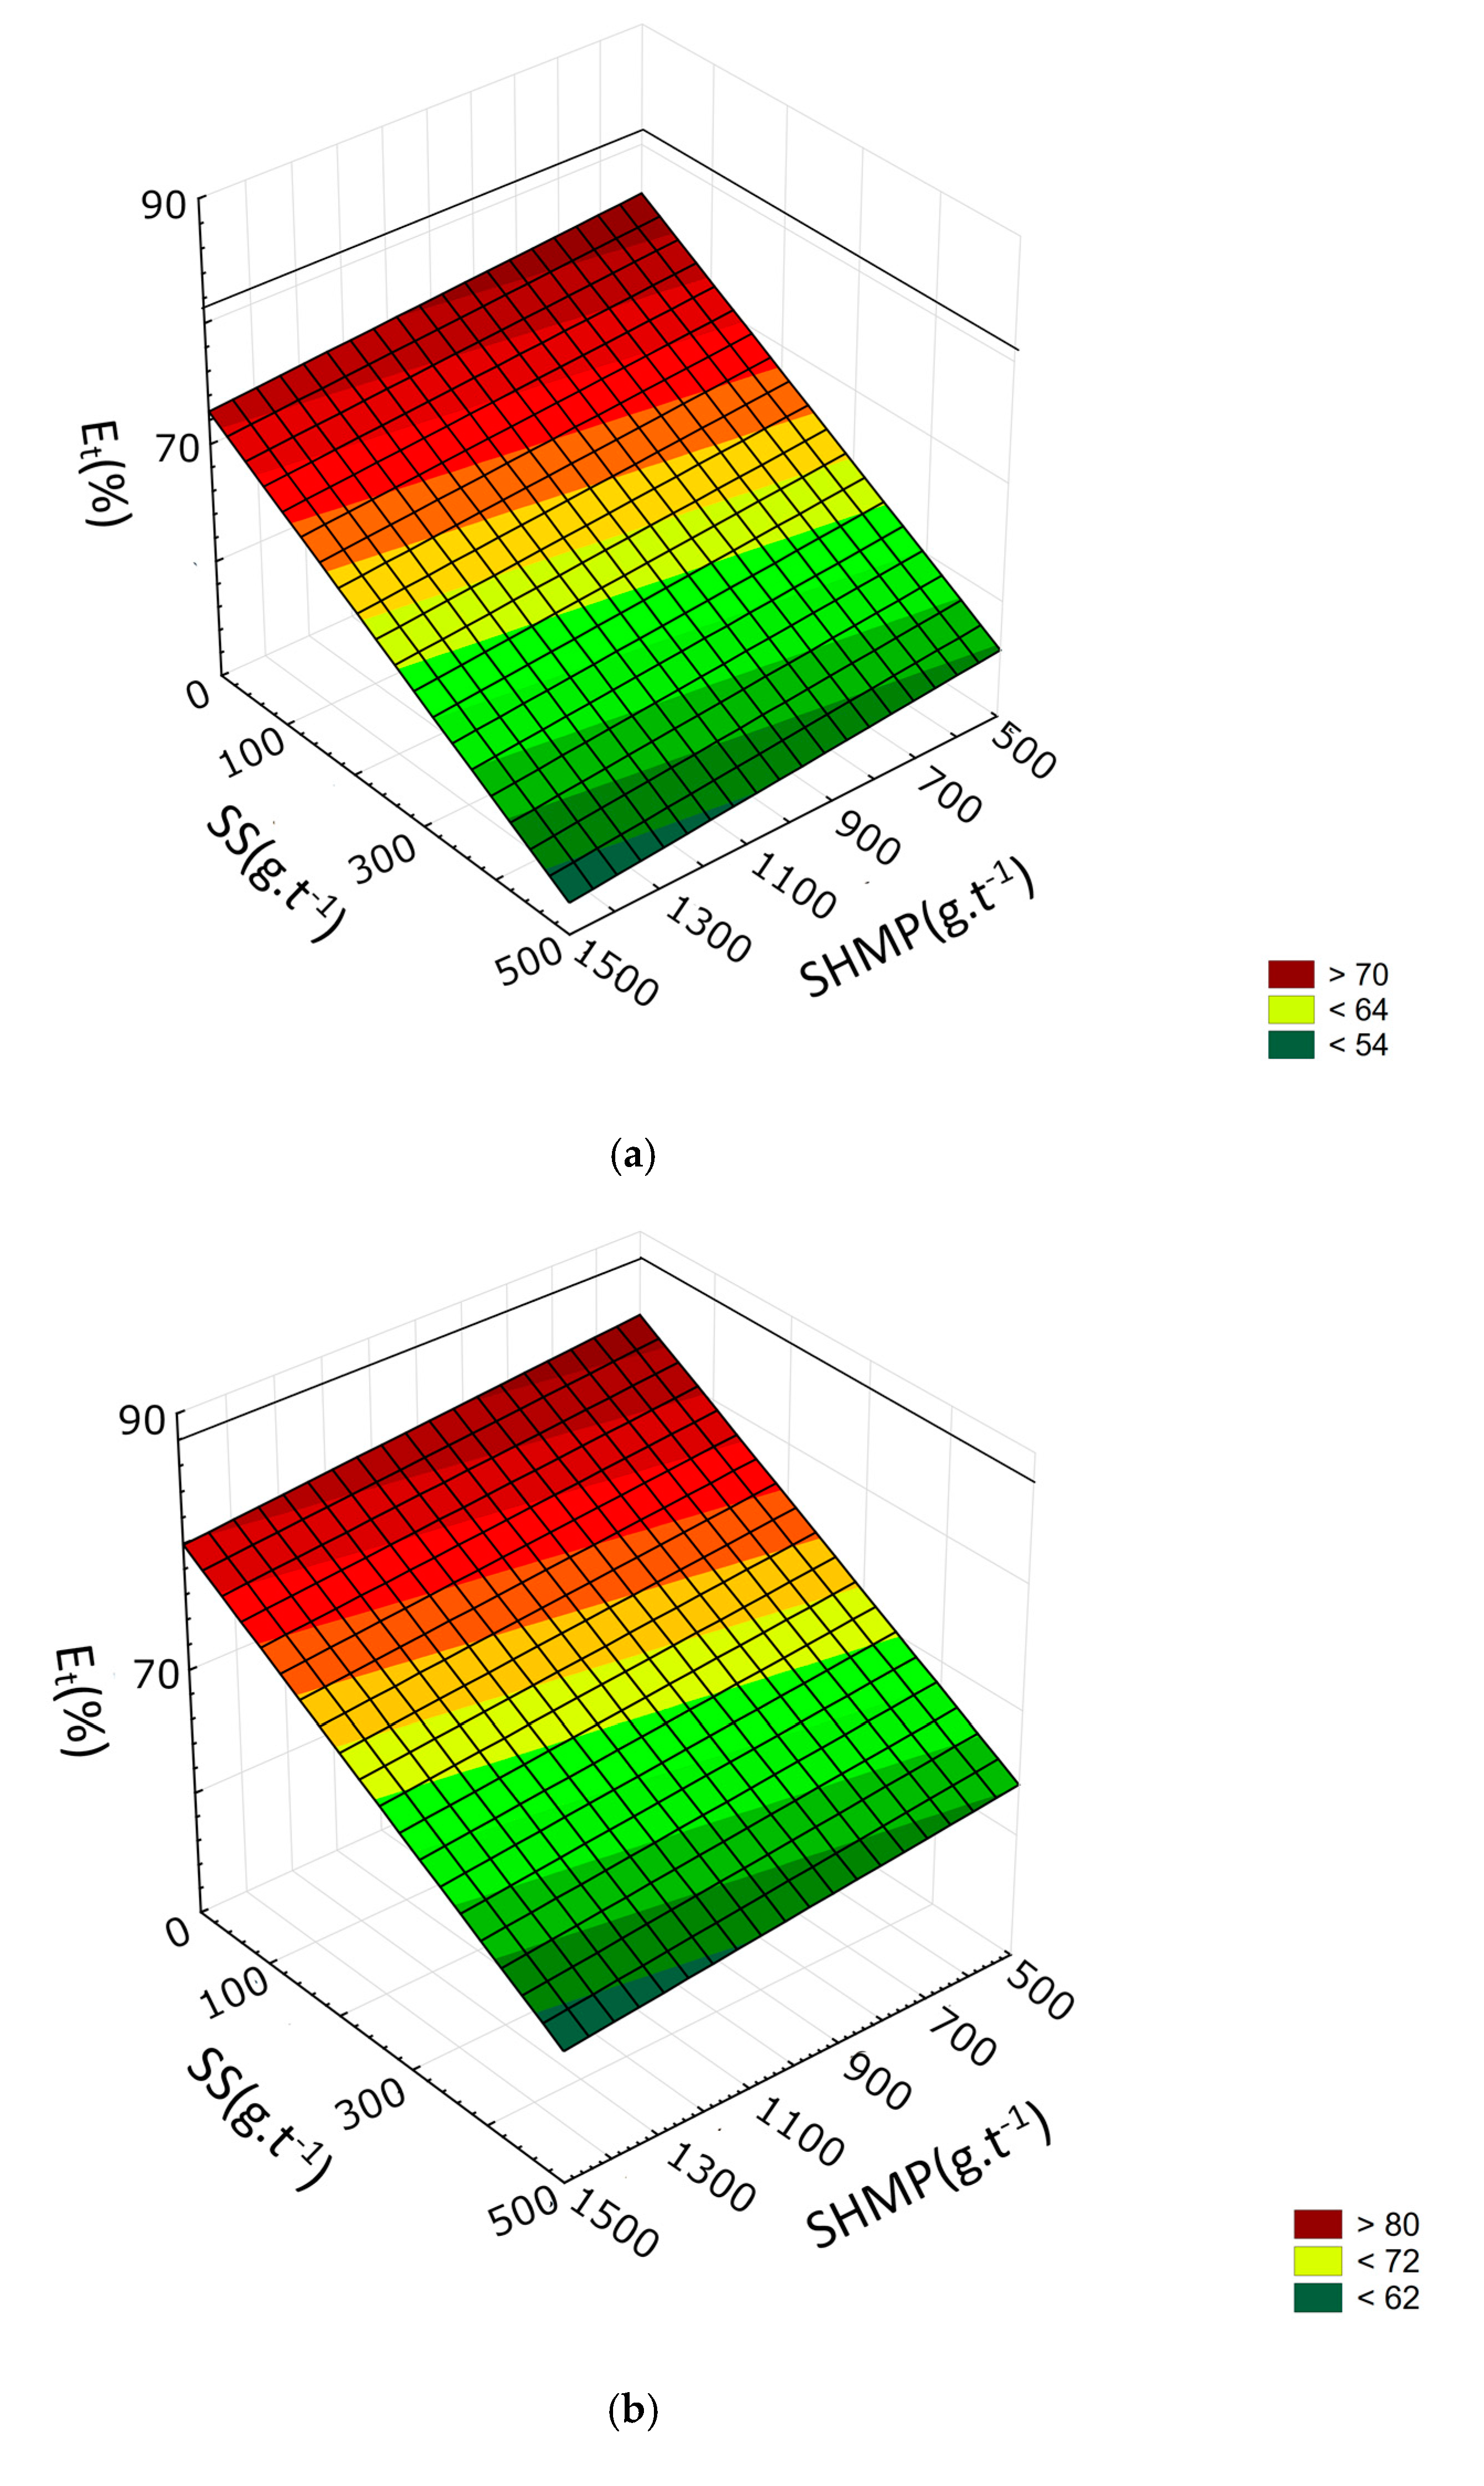
However, a quick look at the effect of the reagents on the recovery of talc shown in Figure 3a,b reveals that this is not the case. The drop in the yield of the froth product in the presence of SS is mostly caused by the declined recovery of talc. Although the addition of SHMP also causes a decrease in achieved recovery of talc, the effect is not dramatic as in the case of SS.
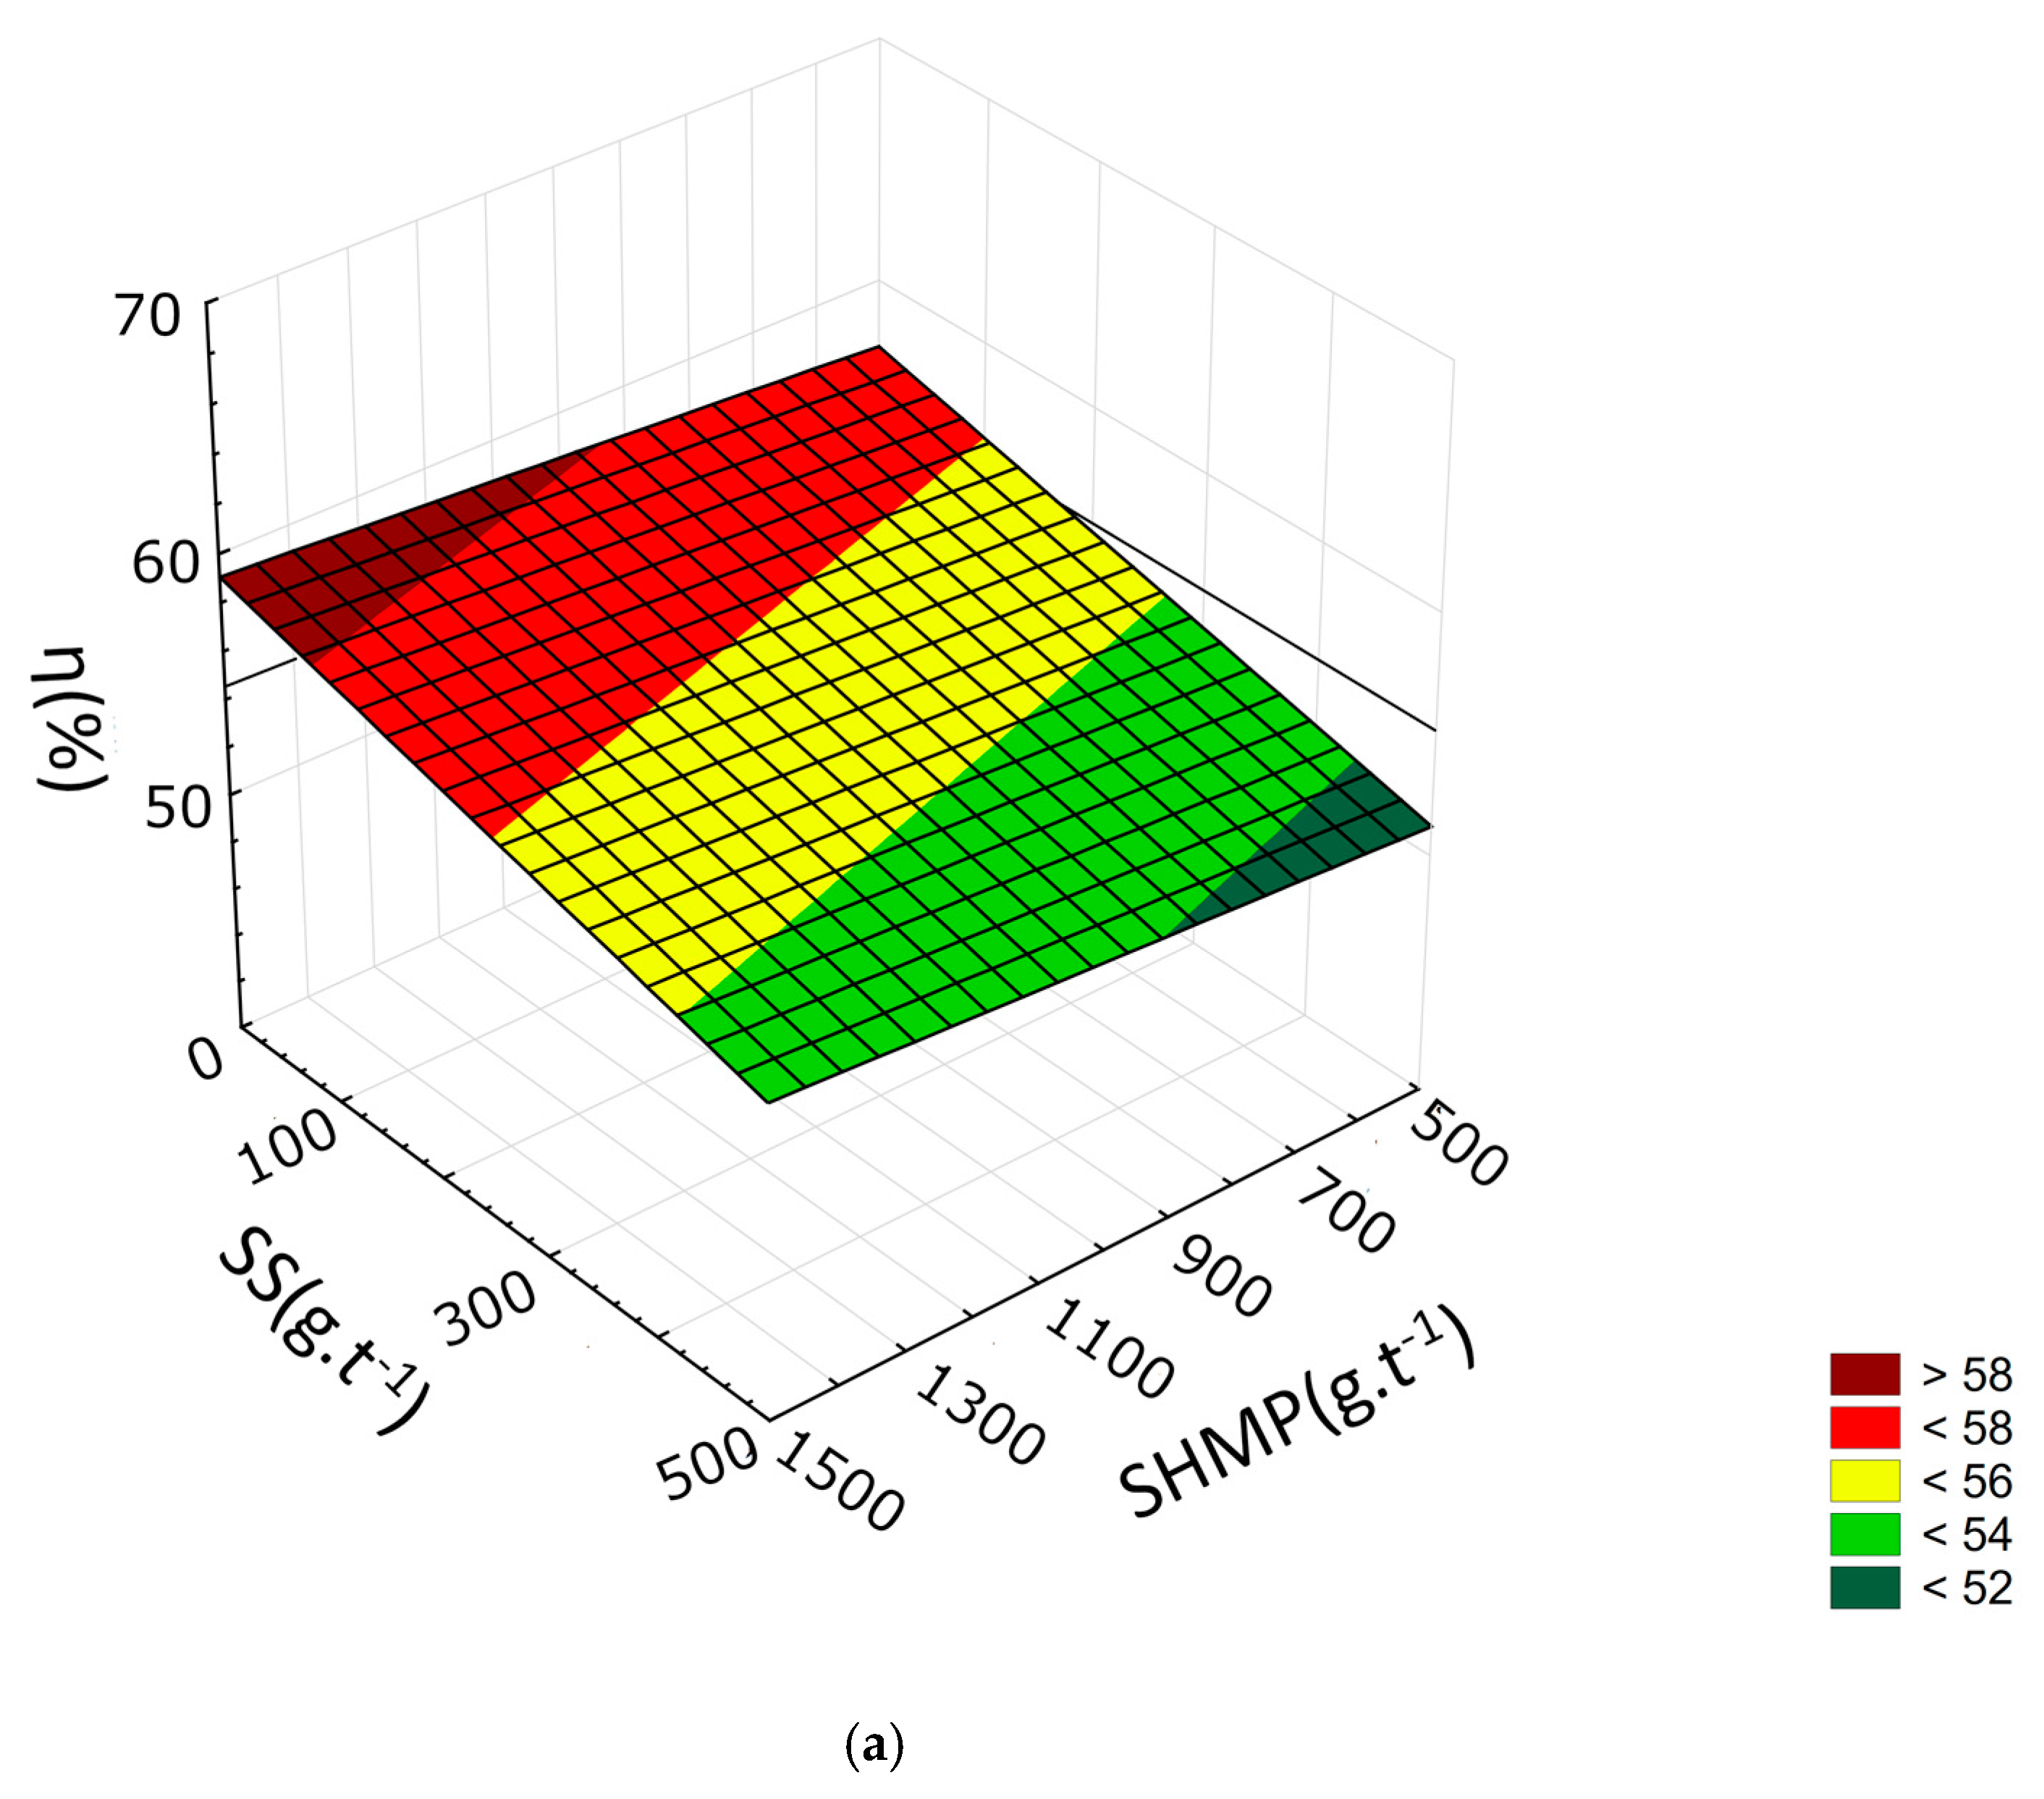
All the above-discussed effects are in concurrence with the conclusions drawn from the results of the ANOVA test. However, the goodness of fit between the model and experimental values of separation efficiency encouraged us to evaluate the results based mainly on this figure. Response surfaces showing the changes in achieved separation efficiency with varying dosage of SHMP and SS reagents are shown in Figure 4a,b.
Again, we observe the strong effect of SS dosage. In all cases, the use of SS results in a gradual decrease in separation efficiency. On the contrary, SHMP alone increases the efficiency over native flotation although the effect is only noticeable at a lower dosage of the MIBC frother (see Figure 4a). When 80 g.t−1 of MIBC is used (see Figure 4b), SHMP does not seem to significantly affect separation efficiency. Lower achieved recoveries of the valuable mineral are compensated by other parameters considered in Equation (3), i.e., yield and grade of the froth product. However, in the presence of SS, SHMP further decreases the efficiency already lowered using SS. It is therefore not advisable to use a combination of SHMP and SS reagents in any case other than in the production of high-grade concentrate using the least number of technological operations (i.e., cleaner flotations), where the low recovery of the valuable mineral is not a concern.
As a next step, we also tried adding log τ as a fourth parameter and fitting the extended Equation (5). This gives more coefficients with which to calculate, and the results of predicted value are more appropriate. We were able to model three of the investigated response variables with the goodness of fit defined by the coefficient of determination R2 > 0.9. The results of these calculations are summarized in Table 7.
These are the same three response variables as in the case of the non-time dependent model, i.e., froth yield, talc recovery, and separation efficiency. Considering the goodness of fit of Equation (4) between the experimental and predicted τη values at all three flotation times (R2 > 0.95), however, the order based on R2 is different, with γ better resembled by the time-dependent model than Et. Separation efficiency is again the best performing response variable with R2 = 0.9769 based on the 36 experimental values. This indicates the creation of a robust and accurate model for the estimation of separation efficiency at any flotation time. The differences between measured and predicted values are shown in Figure 5, with the exception of one value within 2% in absolute terms as can be seen in the residuals plot.
Such a model could be used in the modeling and simulation for predicting the outcomes of froth flotation processing. This approach could also be helpful in maintaining the process outcomes (by adjusting the dosage of the reagents) based on the actual feed composition.
Another possible utilization is for process optimization, i.e., the determination of the reagent dosage and flotation time necessary for the preparation of concentrate with desired properties, or for optimization of the process economics. Nevertheless, it also acknowledges our belief that separation efficiency is a valuable metric for the evaluation of froth flotation results.

4. Conclusions

While ANOVA is good as the first step in the statistical evaluation of the effect of factors on response variables in froth flotation processing, it proves insufficient in some cases. The main drawback is that it may not reveal all of the effects of the studied factors. ANOVA only reveals the effects that are the same under all conditions (i.e., the decrease in talc recovery caused by SS regardless of the MIBC or SHMP dosage). In such a case, the conclusions drawn from ANOVA and RSM are consistent.
However, if the effects oppose each other under different conditions, ANOVA evaluates the effect as statistically not significant. This was also the reason we were not able to prove the effect of SHMP on separation efficiency for froth flotation processing of the investigated talc ore. The two opposing effects (mainly noticeable when the lower dosage of MIBC frother was used), i.e., the positive effect of SHMP alone and the negative effect of SHMP in the presence of SS, were responsible for the inability of ANOVA to detect the effect.
The effect of SHMP on separation efficiency was only revealed when the results of the flotation experiments were evaluated using the RSM. This approach allowed us to also comment on the significance of the factors in terms of their effects on the values of the response variables.
The following conclusions can be drawn regarding the effect of SHMP in froth flotation of talc ore:
  • SHMP lowers the yield of the froth product by lowering the recovery of both talc and gangue minerals. However, the drop in gangue minerals recovery is relatively higher. SHMP can thus be used to improve froth grade.
  • SHMP positively affects separation efficiency, but the effect is more noticeable at lower dosages of the frother. When higher frother dosage is used, there is only a minor increase in separation efficiency caused by SHMP.
  • It is not recommended to use SHMP along with SS as it further decreases separation efficiency and only has a minor positive effect on the froth grade.
Another advantage of the RSM is the calculation of the models that can be used in the modeling and simulation of the separation process. Froth yield, talc recovery, and separation efficiency were modeled with a satisfactory goodness of fit (R2 > 0.9) at the three studied flotation times when the dosages of the three reagents were considered factors. Separation efficiency was best resembled by the model (R2 > 0.95 in all three cases), followed by talc recovery and froth yield. The kinetics of three response variables were also modeled adding the common logarithm of the flotation time as a fourth parameter. This resulted in the calculation of the models with a high coefficient of determination between the experimental and model values of 0.924, 0.942, and 0.977 for talc recovery, froth yield, and separation efficiency, respectively. Separation efficiency can thus be regarded as a valuable metric in the evaluation of the results of froth flotation processing.
We believe that our findings may encourage more researchers to use the separation efficiency metric in the evaluation of the froth flotation process and also to consider more in-depth statistical analysis of the results in order not to overlook possible effects.

Author Contributions

Conceptualization, M.S. and M.M.; methodology, M.S.; software, D.K.; validation, D.K., I.Ď., and T.H.; formal analysis, M.S.; investigation, M.S.; resources, M.M.; data curation, I.Ď.; writing—original draft preparation, T.H.; writing—review and editing, M.M.; visualization, D.K.; supervision, M.S.; project administration, M.S.; funding acquisition, M.S. All authors have read and agreed to the published version of the manuscript.

Funding

This research was funded by the Slovak Scientific Grant Agency (VEGA), grant number 1/0472/18, the Slovak Scientific Grant Agency (VEGA), grant number 1/0509/18, and the European Institute of Innovation and Technology (EIT), a body of the European Union, under the Horizon 2020, the EU Framework Programme for Research and Innovation, grant number 18259.

Conflicts of Interest

The authors declare no conflict of interest.

References

  1. Shean, B.; Cilliers, J. A review of froth flotation control. Int. J. Miner. Process. 2011, 100, 57–71. [Google Scholar] [CrossRef]
  2. Wang, G.; Nguyen, A.V.; Mitra, S.; Joshi, J.B.; Jameson, G.J.; Evans, G.M. A review of the mechanisms and models of bubble-particle detachment in froth flotation. Sep. Purif. Technol. 2016, 170, 155–172. [Google Scholar] [CrossRef] [Green Version]
  3. Bulatovic, S.M. Handbook of Flotation Reagents. In Handbook of Flotation Reagents; Elsevier: Amsterdam, The Netherlands, 2007. [Google Scholar]
  4. Brezani, I.; Zelenak, F.; Zelenak, M. Collectorless flotation of talc-magnesite ore with respect to particle size. Acta Montan. Slovaca 2013, 18, 176–183. [Google Scholar]
  5. Yuan, D.; Xie, L.; Shi, X.; Yi, L.; Zhang, G.; Zhang, H.; Liu, Q.; Zeng, H. Selective flotation separation of molybdenite and talc by humic substances. Miner. Eng. 2018, 117, 34–41. [Google Scholar] [CrossRef]
  6. Ahmed, M.M.; Ibrahim, G.A.; Hassan, M.M. Improvement of Egyptian talc quality for industrial uses by flotation process and leaching. Int. J. Miner. Process. 2007, 83, 132–145. [Google Scholar] [CrossRef]
  7. Yehia, A.; Al-Wakeel, M. Talc separation from talc-carbonate ore to be suitable for different industrial applications. Miner. Eng. 2000, 13, 111–116. [Google Scholar] [CrossRef]
  8. Zheng, X.; Manton, P. A potential application of collectorless flotation in a copper/gold operation. Miner. Eng. 2010, 23, 895–902. [Google Scholar] [CrossRef]
  9. Aghazadeh, S.; Mousavinezhad, S.K.; Gharabaghi, M. Chemical and colloidal aspects of collectorless flotation behavior of sulfide and non-sulfide minerals. Adv. Colloid Interface Sci. 2015, 225, 203–217. [Google Scholar] [CrossRef]
  10. Dey, S.; Bhattacharyya, K. Split and collectorless flotation to medium coking coal fines for multi-product zero waste concept. Fuel Process. Technol. 2007, 88, 585–590. [Google Scholar] [CrossRef]
  11. Ozdemir, O. Specific ion effect of chloride salts on collectorless flotation of coal. Physicochem. Probl. Miner. Process. 2013, 49, 511–524. [Google Scholar]
  12. Nguyen, A. Froth Flotation. In Reference Module in Chemistry, Molecular Sciences and Chemical Engineering; Elsevier: Amsterdam, The Netherlands, 2013. [Google Scholar]
  13. Zhang, J.; Subasinghe, N. Development of a flotation model incorporating liberation characteristics. Miner. Eng. 2016, 98, 1–8. [Google Scholar] [CrossRef]
  14. Gupta, A.; Yan, D. Chapter 16—flotation. In Mineral Processing Design and Operation; Gupta, A., Yan, D., Eds.; Elsevier: Amsterdam, The Netherlands, 2006. [Google Scholar]
  15. Lotter, N.; Whiteman, E.; Bradshaw, D. Modern practice of laboratory flotation testing for flowsheet development–A review. Miner. Eng. 2014, 66, 2–12. [Google Scholar] [CrossRef]
  16. Ruuska, J.; Lamberg, P.; Leiviskä, K. Flotation model based on floatability component approach–PGE minerals case. IFAC Proc. Vol. 2012, 45, 19–24. [Google Scholar] [CrossRef]
  17. Yianatos, J.; Carrasco, C.; Bergh, L.; Vinnett, L.; Torres, C. Modelling and simulation of rougher flotation circuits. Int. J. Miner. Process. 2012, 112, 63–70. [Google Scholar] [CrossRef]
  18. Yalcin, E.; Kelebek, S. Flotation kinetics of a pyritic gold ore. Int. J. Miner. Process. 2011, 98, 48–54. [Google Scholar] [CrossRef]
  19. Szczerkowska, S.; Wiertel-Pochopien, A.; Zawala, J.; Larsen, E.; Kowalczuk, P.B. Kinetics of froth flotation of naturally hydrophobic solids with different shapes. Miner. Eng. 2018, 121, 90–99. [Google Scholar] [CrossRef]
  20. Censori, M.; La Marca, F.; Carvalho, M.T. Separation of plastics: The importance of kinetics knowledge in the evaluation of froth flotation. Waste Manag. 2016, 54, 39–43. [Google Scholar] [CrossRef]
  21. Brezani, I.; Marcin, M.; Sisol, M. The effect of sodium hexametaphosphate on natural flotation kinetics of talc ore. In International Conference on Environment and Mineral Processing; Technical University of Ostrava: Ostrava, Czech Republic, 2017; Volume 21, pp. 49–54. ISBN 978-80-248-4049-9. [Google Scholar]
  22. Andreola, F.; Castellini, E.; Ferreira, J.; Olhero, S.; Romagnoli, M. Effect of sodium hexametaphosphate and ageing on the rheological behaviour of kaolin dispersions. Appl. Clay Sci. 2006, 31, 56–64. [Google Scholar] [CrossRef]
  23. Feng, B.; Lu, Y.; Feng, Q.; Zhang, M.; Gu, Y. Talc–serpentine interactions and implications for talc depression. Miner. Eng. 2012, 32, 68–73. [Google Scholar] [CrossRef]
  24. Schulz, N. Separation Efficiency. In Transactions of the Society for Mining Engineers, American Institute of Mining, Metallurgy and Exploration; Society for Mining Metallurgy: Englewood, CO, USA, 1970; Volume 247, pp. 81–87. [Google Scholar]
  25. Maldonado, M.; Araya, R.; Finch, J. Optimizing flotation bank performance by recovery profiling. Miner. Eng. 2011, 24, 939–943. [Google Scholar] [CrossRef]
  26. Zanin, M.; Lambert, H.; Du Plessis, C. Lime use and functionality in sulphide mineral flotation: A review. Miner. Eng. 2019, 143, 105922. [Google Scholar] [CrossRef]
  27. Zhang, N.-N.; Zhou, C.-C.; Pan, J.-H.; Xia, W.; Liu, C.; Tang, M.-C.; Cao, S.-S. The response of diasporic-bauxite flotation to particle size based on flotation to particle size based on flotation kinetic study and neural network simulation. Powder Technol. 2017, 318, 272–281. [Google Scholar] [CrossRef]
  28. Hadler, K. The link between froth surface grade and flotation feed grade. Miner. Eng. 2015, 78, 32–37. [Google Scholar] [CrossRef]
  29. Brezani, I.; Zelenak, F. Matlab real-time data acquisition for laboratory froth flotation automation. Acta Montan. Slovaca 2011, 18, 198–205. [Google Scholar]
  30. Wiese, J.; Becker, M.; Yorath, G.; O’Connor, C. An investigation into the relationship between particle shape and entrainment. Miner. Eng. 2015, 83, 211–216. [Google Scholar] [CrossRef]
  31. Wang, L.; Peng, Y.; Runge, K. Entrainment in froth flotation: The degree of entrainment and its contributing factors. Powder Technol. 2016, 288, 202–211. [Google Scholar] [CrossRef] [Green Version]
  32. Liu, C.; Zhang, W.; Song, S.; Li, H. A novel method to improve carboxymethyl cellulose performance in the flotation of talc. Miner. Eng. 2019, 131, 23–27. [Google Scholar] [CrossRef]
  33. Yadav, A.M.; Nikkam, S.; Gajbhiye, P.; Tyeb, M.H. Modeling and optimization of coal oil agglomeration using response surface methodology and artificial neural network approaches. Int. J. Miner. Process. 2017, 163, 55–63. [Google Scholar] [CrossRef]
  34. Vieceli, N.; Durão, F.; Guimarães, C.; Nogueira, C.A.; Pereira, M.; Margarido, F. Grade-recovery modelling and optimization of the froth flotation process of a lepidolite ore. Int. J. Miner. Process. 2016, 157, 184–194. [Google Scholar] [CrossRef]
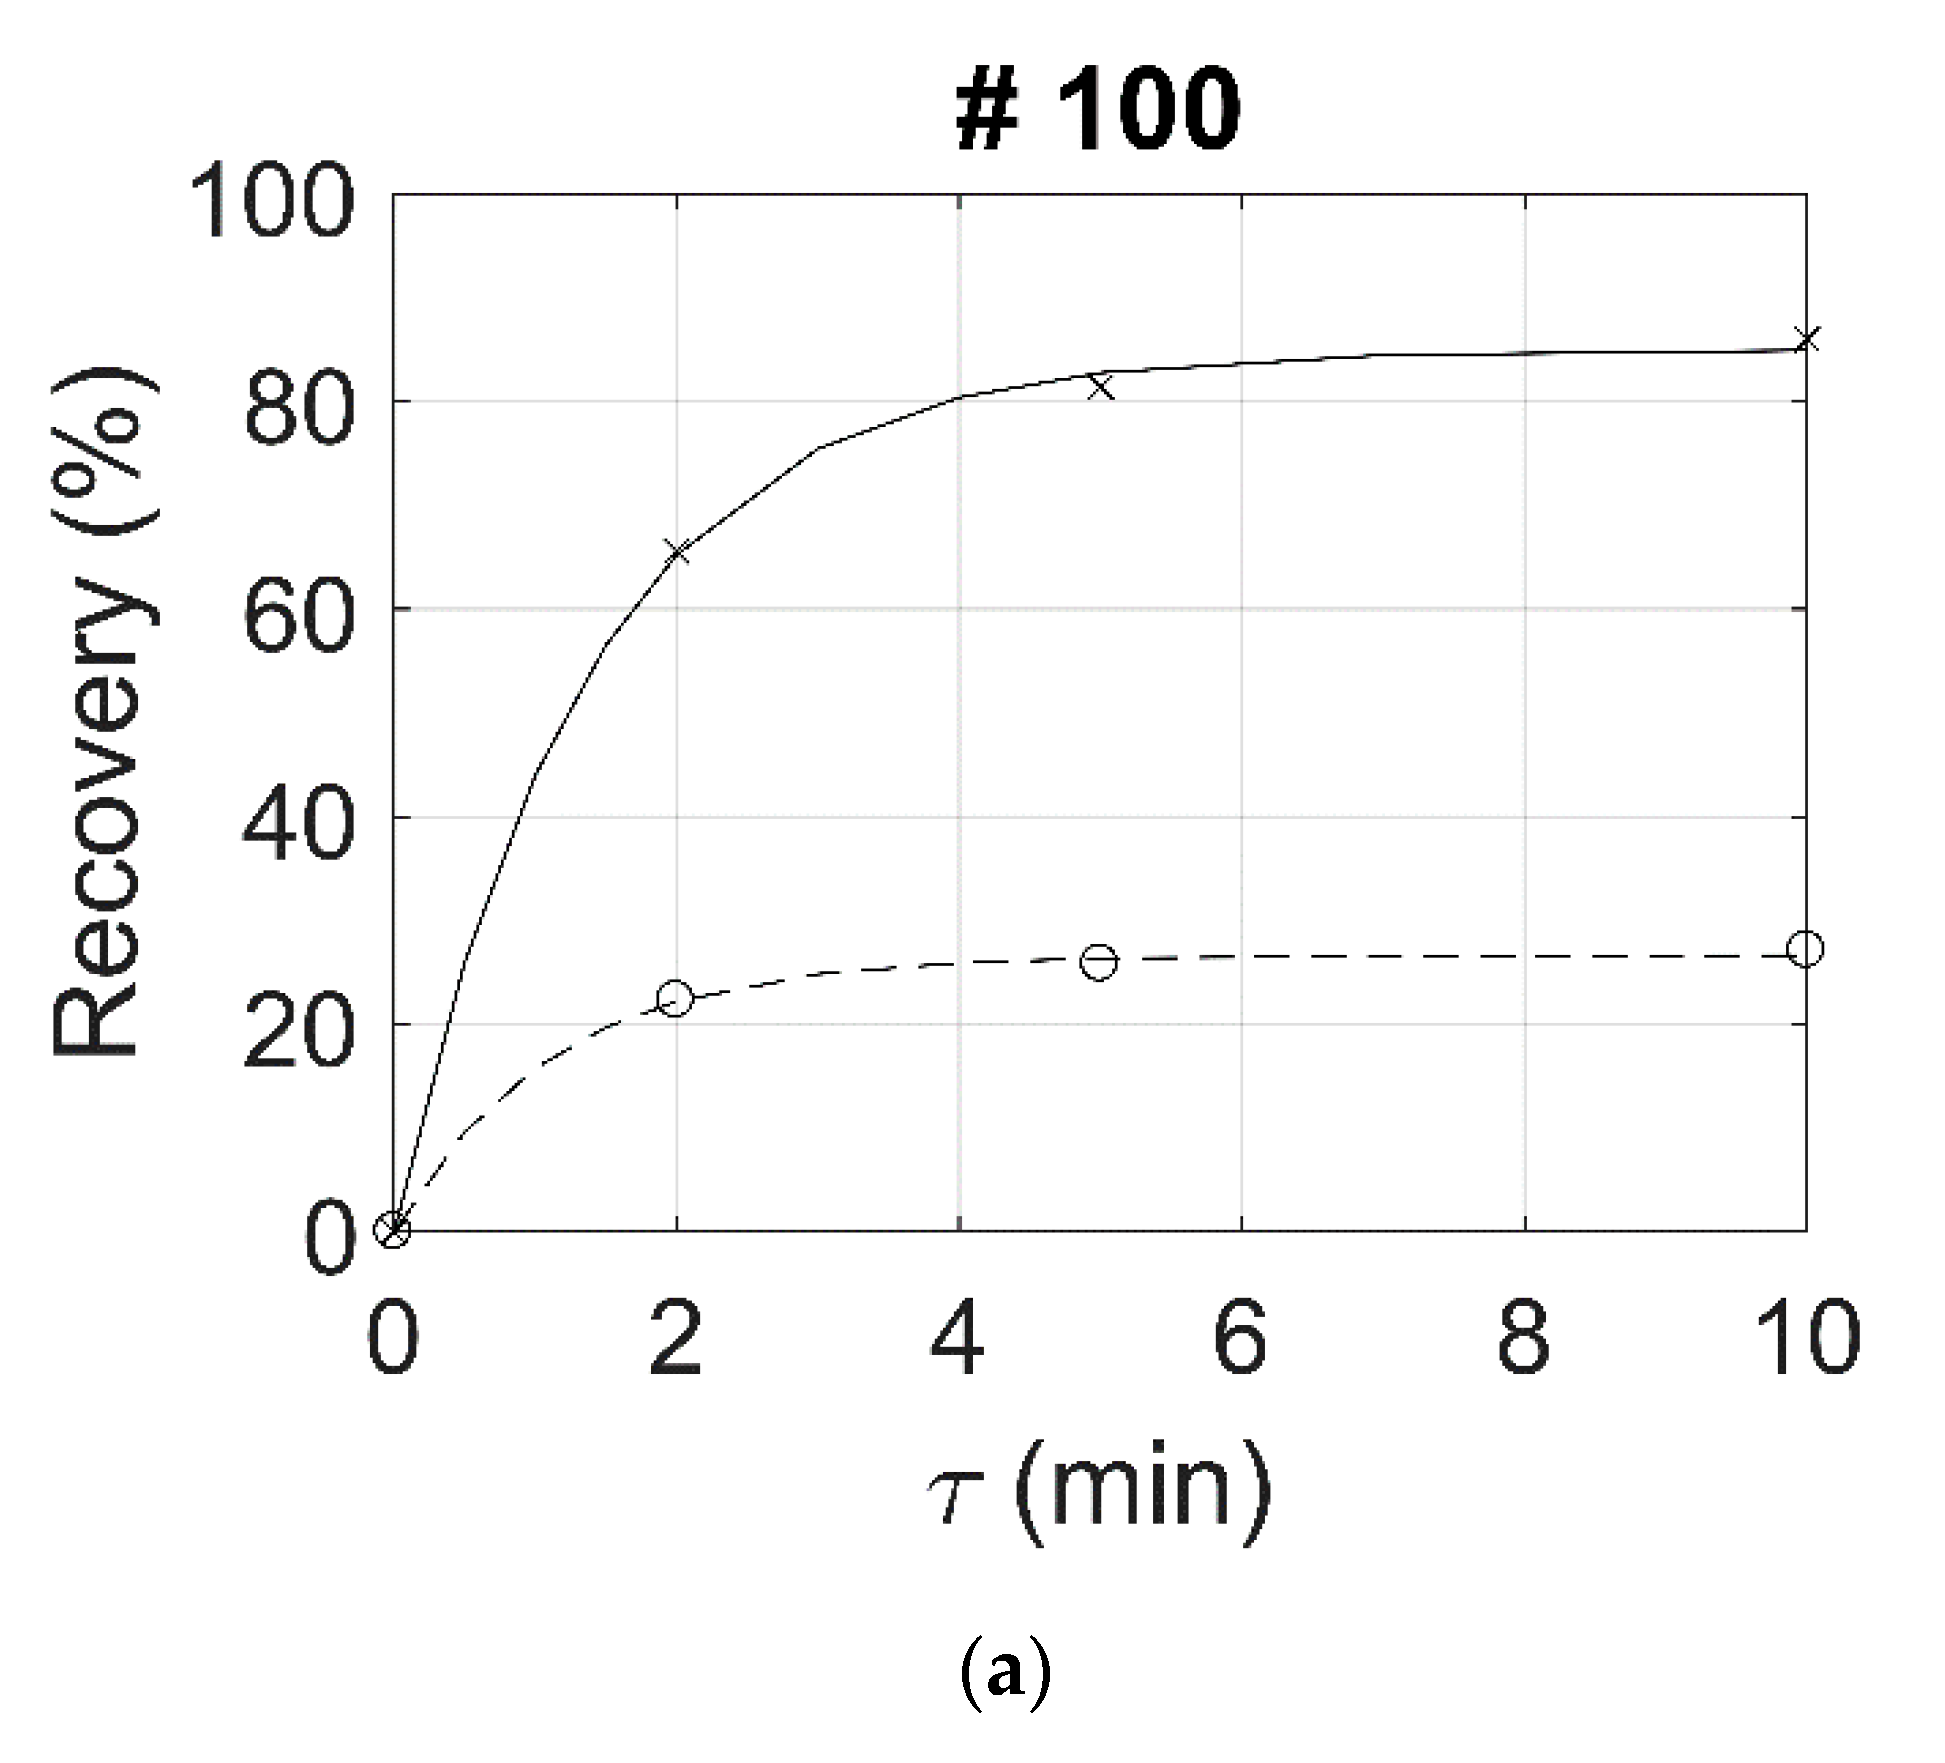
Figure 1. (a) (#100) (b) (#200). Native flotation kinetics of talc ore using methyl isobutyl carbinol (MIBC) frother. The (x) and (o) mark the recovery of talc and gangue minerals, respectively.
Minerals 10 01003 g001aMinerals 10 01003 g001b
Figure 2. (a) (50 g.t−1 MIBC), (b) (80 g.t−1 MIBC), (c) Response surfaces representing the effect of SHMP and SS on the yield of the froth product at different dosages of MIBC frother. The thick black lines represent the recovery of talc achieved using frother as the only reagent.
Minerals 10 01003 g002aMinerals 10 01003 g002b
Figure 3. (a) (50 g.t−1 MIBC), (b) (80 g.t−1 MIBC), (c): Response surfaces representing the effect of SHMP and SS on the recovery of talc to froth product at different dosages of MIBC frother. The thick black lines represent the recovery of talc achieved using frother as the only reagent.
Minerals 10 01003 g003aMinerals 10 01003 g003b
Figure 4. (a) (50 g.t−1 MIBC), (b) (80 g.t−1 MIBC), (c): Response surfaces representing the effect of SHMP and SS on separation efficiency at different dosages of MIBC frother. The thick black lines represent the recovery of talc achieved using frother as the only reagent.
Minerals 10 01003 g004aMinerals 10 01003 g004b
Figure 5. Goodness of fit between experimental and model data for separation efficiency.
Minerals 10 01003 g005
Table 1. Chemical analysis of minerals identified in the sample of the ore. Note: Loss on ignition (LOI) at 1000 °C.
TalcSilicate ISilicate IIQuartzDolomitePyrite
LOI(%)4.541.973.552.0947.5432.75
SiO2(%)61.3258.164.8285.323.44-
MgO(%)30.8410.4511.617.7419.75-
CaO(%)0.522.153.232.1527.46-
Fe2O3(%)0.872.963.450.690.9963.74
Al2O3(%)0.4217.5812.641.270.190.59
Mn(%)0.2020.2340.2450.1690.2150.312
Cu(%)0.0740.080.0950.0640.0540.115
Zn(%)0.0060.010.0120.0080.0090.006
Pb(%)0.0070.0120.0220.0150.0280.021
(%)98.79993.54699.67499.51699.67697.534
Table 2. Design of experiment (DoE) used in this study showing dosages of reagents (g.t−1) in individual flotation tests.
#100110111112120121200210211220221222
MIBC505050505050808080808080
SHMP0500500500150015000500500150015001500
SS002505000250002500250500
Note: The # notation based on 1, 2, and 0 digits represents low, high, and null factor values of the three investigated factors.
Table 3. Results of the laboratory froth flotation tests.
#Froth Yield
(%)
Froth Grade
(%)
Talc Recovery
(%)
Gangue Recovery
(%)
Efficiency
(%)
2γ5γ10γ2c5c10ccc2Εt5Εt10Εt2Εg5Εg10Εg2η5η10η
10054.266.770.589.289.889.934.965.681.486.022.325.827.143.355.658.9
11049.057.762.293.393.493.443.261.472.378.112.814.916.048.757.562.1
11134.045.752.495.595.295.143.446.161.770.75.27.58.740.954.262.0
11228.841.448.796.195.995.544.040.157.467.33.65.57.236.551.960.1
12048.057.261.393.293.493.539.161.873.879.111.813.714.550.060.164.6
12137.847.853.895.294.794.444.350.563.671.36.38.810.544.254.760.8
20057.467.871.290.390.490.220.973.887.291.418.621.923.555.165.367.9
21050.860.164.193.093.193.129.367.379.685.012.014.014.855.365.670.2
21145.455.260.694.594.r93.732.861.674.481.58.310.812.653.363.668.9
22053.061.665.792.992.892.730.169.180.285.513.115.416.655.964.868.9
22146.356.260.693.292.392.440.460.272.477.811.115.317.149.157.060.7
22232.644.151.193.893.192.744.644.259.268.56.69.912.137.649.356.4
Note: The left superscript is a cumulative flotation time in minutes and the c marks the cell product after 10 min of flotation. The # notation based on 1, 2, and 0 digits represents low, high, and null factor values of the three investigated factors.
Table 4. Results of the analysis of variance (ANOVA) test (p-values).
Froth YieldFroth GradeTalc RecoveryGangue RecoveryEfficiency
2γ5γ10γ2c5c10c2Εt5Εt10Εt2Εg5Εg10Εg2η5η10η
MIBC0.0090.0130.0120.1740.0820.0450.0020.0020.0010.3940.3230.2720.0040.0170.046
SHMP0.0970.0190.0120.0050.0080.0060.1950.0220.0160.0100.0120.0100.3830.4050.220
SS0.0000.0000.0010.0420.1750.3410.0000.0000.0000.0110.0420.0830.0020.0120.062
Table 5. Covariance of the statistically significant factor–response variable pairs (τ = 5 min).
5γ5c5Εt5Εg5η
MIBC+NA+NA+
SHMP+NA
SSNA
Note: Not Affected (NA).
Table 6. Calculated coefficients (based on Equation (4), using the coded values) of the response surfaces with R2 > 0.9.
Froth Yield
(%)
Talc Recovery
(%)
Separation Efficiency
(%)
2γ5γ10γ2Ε5Ε10Ε2η5η10η
R20.93320.90460.90050.95110.92480.92890.96310.98960.9546
b044.977358.877263.934447.538164.478470.700724.217237.610642.8651
b11.312 × 10−18.302 × 10−26.552 × 10−23.077 × 10−12.589 × 10−12.393 × 10−13.941 × 10−13.546 × 10−13.298 × 10−1
b2−4.137 × 10⁻³−7.963 × 10⁻³−7.758 × 10−31.528 × 10−3−2.632 × 10⁻³−2.161 × 10−31.366 × 10−21.142 × 10−21.245 × 10−2
b3−5.818 × 10⁻²−5.237 × 10⁻²−4.433 × 10⁻²−5.487 × 10⁻²−4.201 × 10⁻²−2.977 × 10⁻²−1.532 × 10−21.220 × 10−31.354 × 10⁻²
b123.023 × 10−56.560 × 10−56.407 × 10−5−4.588 × 10⁻⁵−1.150 × 10⁻⁵−1.576 × 10⁻⁵−1.672 × 10⁻⁴−1.542 × 10⁻⁴−1.576 × 10⁻⁴
b131.974 × 10−41.311 × 10−41.162 × 10−41.608 × 10−42.884 × 10−56.233 × 10−69.357 × 10−5−4.262 × 10⁻⁵−7.875 × 10⁻⁵
b233.585 × 10−66.964 × 10−66.208 × 10−6−2.345 × 10−68.731 × 10−7−1.039 × 10⁻⁶−1.753 × 10⁻⁵−1.842 × 10⁻⁵−2.134 × 10⁻⁵
Table 7. Calculated coefficients (based on Equation (5)) of the response surfaces with R2 > 0.9.
γΕtη
R20.94190.92350.9769
b039.126739.869114.7392
b11.35863.3401 × 10−14.4712 × 10⁻¹
b2−5.4260 × 10−39.5193 × 10−41.4026 × 10⁻²
b3−6.2395 × 10⁻²−5.8103 × 10⁻²−1.3931 × 10⁻²
b42.5204 × 1013.1809 × 1013.0238 × 101
b125.3303 × 10−5−2.5306 × 10⁻⁵−1.5965 × 10⁻⁴
b131.4821 × 10−46.6291 × 10⁻⁵−9.2658 × 10⁻⁶
b14−6.3902 × 10⁻²−9.8966 × 10⁻²−1.3145 × 10⁻¹
b235.5854 × 10−6−8.6916 × 10⁻⁷−1.9094 × 10⁻⁵
b24−1.7899 × 10⁻³−2.9662 × 10⁻³−2.4739 × 10⁻³
b341.6149 × 10−22.4385 × 10−22.0616 × 10−2
Publisher’s Note: MDPI stays neutral with regard to jurisdictional claims in published maps and institutional affiliations.