Article

Phase Relations in the FeO-Fe3C-Fe3N System at 7.8 GPa and 1350 °C: Implications for Oxidation of Native Iron at 250 km

by
Aleksei N. Kruk
1,*,
Alexander G. Sokol
1,*,
Yurii V. Seryotkin
1,2 and
Yuri N. Palyanov
1,2
1
Sobolev Institute of Geology and Mineralogy, Siberian Branch of Russian Academy of Sciences, 630090 Novosibirsk, Russia
2
Department of Geology and Geophysics, Novosibirsk State University, 630090 Novosibirsk, Russia
*
Authors to whom correspondence should be addressed.
Minerals 2020, 10(11), 984; https://doi.org/10.3390/min10110984
Submission received: 12 October 2020 / Revised: 2 November 2020 / Accepted: 2 November 2020 / Published: 4 November 2020

Abstract

:
Oxidation of native iron in the mantle at a depth about 250 km and its influence on the stability of main carbon and nitrogen hosts have been reconstructed from the isothermal section of the ternary phase diagram for the FeO-Fe3C-Fe3N system. The results of experiments at 7.8 GPa and 1350 °C show that oxygen increase in the system to > 0.5 wt % provides the stability of FeO and leads to changes in the phase diagram: the Fe3C, L, and Fe3N single-phase fields change to two-phase ones, while the Fe3C + L and Fe3N + L two-phase fields become three-phase. Carbon in iron carbide (Fe3C, space group Pnma) is slightly below the ideal value and nitrogen is below the EMPA (Electron microprobe analysis) detection limit. Iron nitride (ε-Fe3N, space group P63/mmc) contains up to 2.7 wt % C and 4.4 wt % N in equilibrium with both melt and wüstite but 2.1 wt % C and 5.4 wt % N when equilibrated with wüstite alone. Impurities in wüstite (space group Fm 3 ¯ m) are within the EMPA detection limit. The contents of oxygen, carbon, and nitrogen in the metal melt equilibrated with different iron compounds are within 0.5–0.8 wt % O even in FeO-rich samples; 3.8 wt % C and 1.2 wt % N for Fe3C + FeO; and 2.9 wt % C and 3.5 wt % N for Fe3N + FeO. Co-crystallization of Fe3C and Fe3N from the O-bearing metal melt is impossible because the fields of associated C- and N-rich compounds are separated by that of FeO + L. Additional experiments with excess oxygen added to the system show that metal melt, which is the main host of carbon and nitrogen in the metal-saturated (~0.1 wt %) mantle at a depth of ~250 km and a normal heat flux of 40 mW/m2, has the greatest oxygen affinity. Its partial oxidation produces FeO and causes crystallization of iron carbides (Fe3C and Fe7C3) and increases the nitrogen enrichment of the residual melt. Thus, the oxidation of metal melt in the mantle enriched in volatiles may lead to successive crystallization of iron carbides and nitrides. In these conditions, magnetite remains unstable till complete oxidation of iron carbide, iron nitride, and the melt. Iron carbides and nitrides discovered as inclusions in mantle diamonds may result from partial oxidation of metal melt which originally contained relatively low concentrations of carbon and nitrogen.

1. Introduction

Metal saturation at mantle depths below 250 (± 30) km has been supported by multiple lines of theoretical and experimental evidence [1,2,3,4]. The mechanism of stable metal saturation consists in progressive disproportionation by the reaction 3Fe2+→2Fe3+ + Fe0 maintained by the stability of Fe3+ in silicate phases (subcalcic pyroxene or majoritic garnet) increasing with pressure [1,2]. The stability of the metal phase in the mantle was proven by findings of metallic iron in inclusions from diamonds and other mantle minerals. One of the earliest cases was reported from diamonds in three kimberlite pipes of Yakutia [5] where metal inclusions contained >98 wt % Fe and <0.4 wt % Ni and were coated with magnetite in some samples. The presence of native iron together with olivine, high-Cr pyrope, and chromite was related to the dunite-harzburgite paragenesis of the inclusions [5]. A number of other findings followed later on. Wüstite inclusions of uncertain origin were discovered in many Yakutian diamonds [6]. Spherical metal inclusions (metallic iron, wüstite, and magnetite) in diamonds were reported from the Mwadui kimberlite in the Central African Craton; the metal phase contained only 0.15 wt % Ni, too low for equilibrium with mantle peridotite [7]. Eclogitic/pyroxenitic garnets from a polycrystalline diamond aggregate in the Venetia kimberlite from the Limpopo Belt in South Africa enclosed multiple spherules of iron carbide and metal (89 wt % Fe, 1.75 wt % Ni, and 4.5 wt % C), with minor troilite [8]. Inclusions in large Cullinan-like diamonds consisted of cohenite (Fe,Ni)3C, an interstitial Fe-Ni alloy, and iron sulfide, with a bulk atomic composition of Fe60–80Ni8–15C10–16S4–14 estimated from a range of relative phase abundances and compositions of individual phases [9]. Low-Ni iron carbide inclusions, with signatures of replacement by magnetite, were identified in eclogitic (Kfs, sulfide) and peridotitic (olivine) placer diamonds from the northeastern Siberian craton [10].
The presence of nitrogen in metal inclusions remained uncertain until Kaminsky and Wirth [11] revealed it in some grains of iron carbide that were identified in association with native iron, graphite, and magnetite in a diamond from the Juina area, Brazil. The analyzed iron carbide grains contained 7.3–9.1 at % N, along with 0–1.3 at % Cr and Ni 0–0.5 at %; a minor nitrogen impurity was found in native iron as well. Kaminsky and Wirth [11] hypothesized that the inclusions crystallized from a C- and N-rich iron melt, while iron carbides and native iron had been partially oxidized to magnetite before being encapsulated in diamond. Later, the same authors [12] found inclusions of Fe3N and Fe2N iron nitrides intergrown with iron carbide, silicon carbide, Cr-Mn-Fe and Mn-Fe oxides, and graphite in diamond from the same region.
In general, the compositions of inclusions in diamond indicate the presence of excess oxygen—besides carbon, nitrogen, and other volatiles—in the diamond growth medium within metal-bearing mantle. Oxygen, along with Fe0 and iron carbides and nitrides, can maintain the formation of wüstite and magnetite [5,7,9,10,11,12]. Oxidation processes may occur even in reduced mantle domains, due to two possible mechanisms: (1) fO2 increase in garnet-bearing rocks by reduction of Fe3+ in silicate minerals during upwelling and adiabatic decompression [4]; (2) interaction of reduced Fe0-bearing mantle with slab-derived oxidized carbonate-bearing rocks/melts [10,13,14,15,16].
The metal phase can play a key role in the fate of carbon and nitrogen which are siderophile elements [17,18,19,20,21,22]. On the other hand, oxidation is expected to cause change in the C and N hosts that are stable in strongly reduced mantle: metal melt and iron carbides or nitrides may convert to wüstite, magnetite, diamond, fluid, and carbonates [13,14,15,21]. Thus, oxidation can control deep cycles of carbon and nitrogen in a moderately reduced mantle environment.
The formation conditions of iron carbides, nitrides, and oxides can be reconstructed with reference to experimental evidence of phase relations in the FeO-Fe3C-Fe3N system at a pressure of 7.8 GPa corresponding to the boundary of metal precipitation/oxidation in the mantle about 250 km [3] and a temperature of 1350 °C corresponding to the 40 mW/m2 mantle heat flux [23,24]. Among systems that may have bearing on the formation conditions of metal-oxide inclusions in diamond, only the Fe-FeO one was studied experimentally [25,26]. According to those experiments, the association of iron and wüstite is stable at a normal upper mantle thermal regime, while Fe-rich liquid appears in equilibrium with FeO at 5–10 GPa only above 1600 °C [25]. As pressure increases, FeO becomes more soluble in molten iron and eutectic compositions gain more oxygen [25,27]. We investigate phase relations in the Fe-Fe3C-Fe3N system at 7.8 GPa and 1350 °C and demonstrate a key role of metal melt as a host of carbon and nitrogen at the temperature corresponding to the 40 mW/m2 mantle geotherm [20]. As far as we know, the FeO-Fe3C-Fe3N system has never been studied before in high-pressure experiments.

2. Materials and Methods

The experiments with the FeO-Fe3C-Fe3N system followed the same basic approaches as in our previous work with the system Fe-Fe3C-Fe3N [20]. In the same way, the samples saturated or undersaturated with respect to carbon were placed into graphite and ceramic containers, respectively. Proceeding from the previous experience, the 1 h run duration was chosen to minimize the loss of volatiles.

2.1. Starting Composition

The starting composition included FeO powder, iron carbide (Fe3C) synthesized at 6.3 GPa and 1400 °C from iron and graphite, and iron nitride (Fe2-4N); all components were of >99.9% pure chemical grade. The iron nitride we used contained 7.1 wt % N, according to quantitative analysis on a Carlo Erba-1106 (La Métairie, France) CHN analyzer. This content of nitrogen was assumed later when plotting the ternary phase diagram. The powders were stored in a vacuum desiccator at ~100 mbar. In an additional series of experiments, > 99.9% pure chemical grade Fe2O3 powder was used instead of FeO.
The starting mixtures (Table 1 and Figure 1) were prepared immediately before the experiments (to avoid oxidation), placed in thick-walled graphite or ceramic capsules, and then loaded in the high-pressure cell. The graphite capsules were made from >99.99% pure graphite, and the ceramic capsules were made from high-quality natural talc from the Onot deposit (Irkutsk region, Russia) converted to quartz-enstatite ceramics by annealing at 900 °C. The capsules were 2.4 mm high cylinders 7 mm in diameter, with two 2.0 mm holes (for charges) in each, sealed with 0.5 mm discs of the same material on both sides. Two capsules, of the 6.8 mm total height, were stacked upside down into the center of a low gradient furnace zone.

2.2. High-Pressure Apparatus

Experiments at 7.8 GPa were carried out in a split-sphere multi-anvil high-pressure apparatus [28]. The multi-anvil sphere of 8/6-type consisted of two anvils with square faces on top and bottom and four side anvils with rectangular faces placed in an octahedral cavity formed by truncating the vertices of eight steel anvils. The size of the high-pressure cells was 19 × 19 × 22 mm; graphite heaters had inner diameters of 9.2 mm and heights of 14.8 mm. Pressure was calibrated by recording the change in the resistance of Bi at 2.55 GPa and PbSe at 4.0 and 6.8 GPa [29] at room temperature and at 1350 °C by bracketing the graphite-diamond equilibrium [30] in the Ni0.7-Fe0.3-C system. Temperature was monitored in each run with a PtRh6/PtRh30 thermocouple calibrated at 6.3 GPa using the melting points of Al, Ag [31]. The pressure and temperature measurements were accurate to ± 0.1 GPa and ± 20 °C, respectively.

2.3. Analytical Methods

After experiments, the samples were treated following the method from [32] and then examined on a Tescan MIRA 3 LMU (Brno, Czech Republic) scanning electron microscope (SEM) and under a Carl Zeiss Stemi 2000-C optical microscope. To make the analysis easier, the polished surfaces were etched using Nital (5 vol % nitric acid in ethanol) containing 0.1 vol % HCl [33].
Element abundances in the samples were determined by electron microprobe analysis (EMPA) on a Jeol JXA-8100 (Tokyo, Japan) microanalyzer at 15 kV accelerating voltage, 200 nA beam current, and 1 to 2 µm beam diameters for solids and 100 µm for quenched liquids. The samples were coated with 10 nm gold or chromium. The results were checked against Fe3N, Fe3C, Fe, and Fe2O3 standards. Measured intensities were converted to concentrations by the ZAF method. The C and N contents in solid phases were estimated to an accuracy of 5 rel %, and Fe and O were accurate to 2 rel %. The detection limit for C, N, and O was 0.1 wt % at the applied analytical conditions. The errors in element contents were larger for quenched liquids because of enclosed coarse dendritic crystals. For this reason, the analytical quality was low even with the beam diameter 100 μm. Additionally, the metal phase compositions were analyzed using a Tescan MIRA 3 LMU scanning electron microscope coupled with an INCA EDS microanalysis system 450 with an Oxford Instruments liquid nitrogen-free large area EDS X-Max-80 Silicon Drift Detector (High Wycombe, UK). The instruments were operated at an accelerating voltage of 20 keV, a beam current of 1 nA, and a spot diameter of ~3–10 μm; the count time for spectra collection was 20 s. The EDS spectra were optimized for quantification using the standard XPP procedure built into the INCA Energy 450 software.
The synthesized phases were identified by X-ray powder diffraction on a Stoe IPDS-2T (Darmstadt, Germany) diffractometer (MoKα radiation, graphite monochromator) in the Gandolfi mode. Two-dimensional X-ray patterns were radially integrated using the XArea software package. The diffraction profiles were processed in WinXPow (Stoe). For the phase analysis, the database of PDF-4 Minerals was used.
X-ray single-crystal diffraction (XRD) analysis of the synthesized phases was performed on a Stoe IPDS-2T diffractometer (MoKα radiation, graphite monochromator). Diffraction data were collected with ω scans, at a step of 1° and 240 s per frame, and processed in CrysAlis Pro [34]. A semi-empirical absorption correction was applied using the multi-scan technique. The structure was determined with the SHELX program package [35]. Analytical studies were performed in the Sobolev Institute of Geology and Mineralogy SB RAS and at the analytical center for multi-elemental and isotope research SB RAS.

3. Results

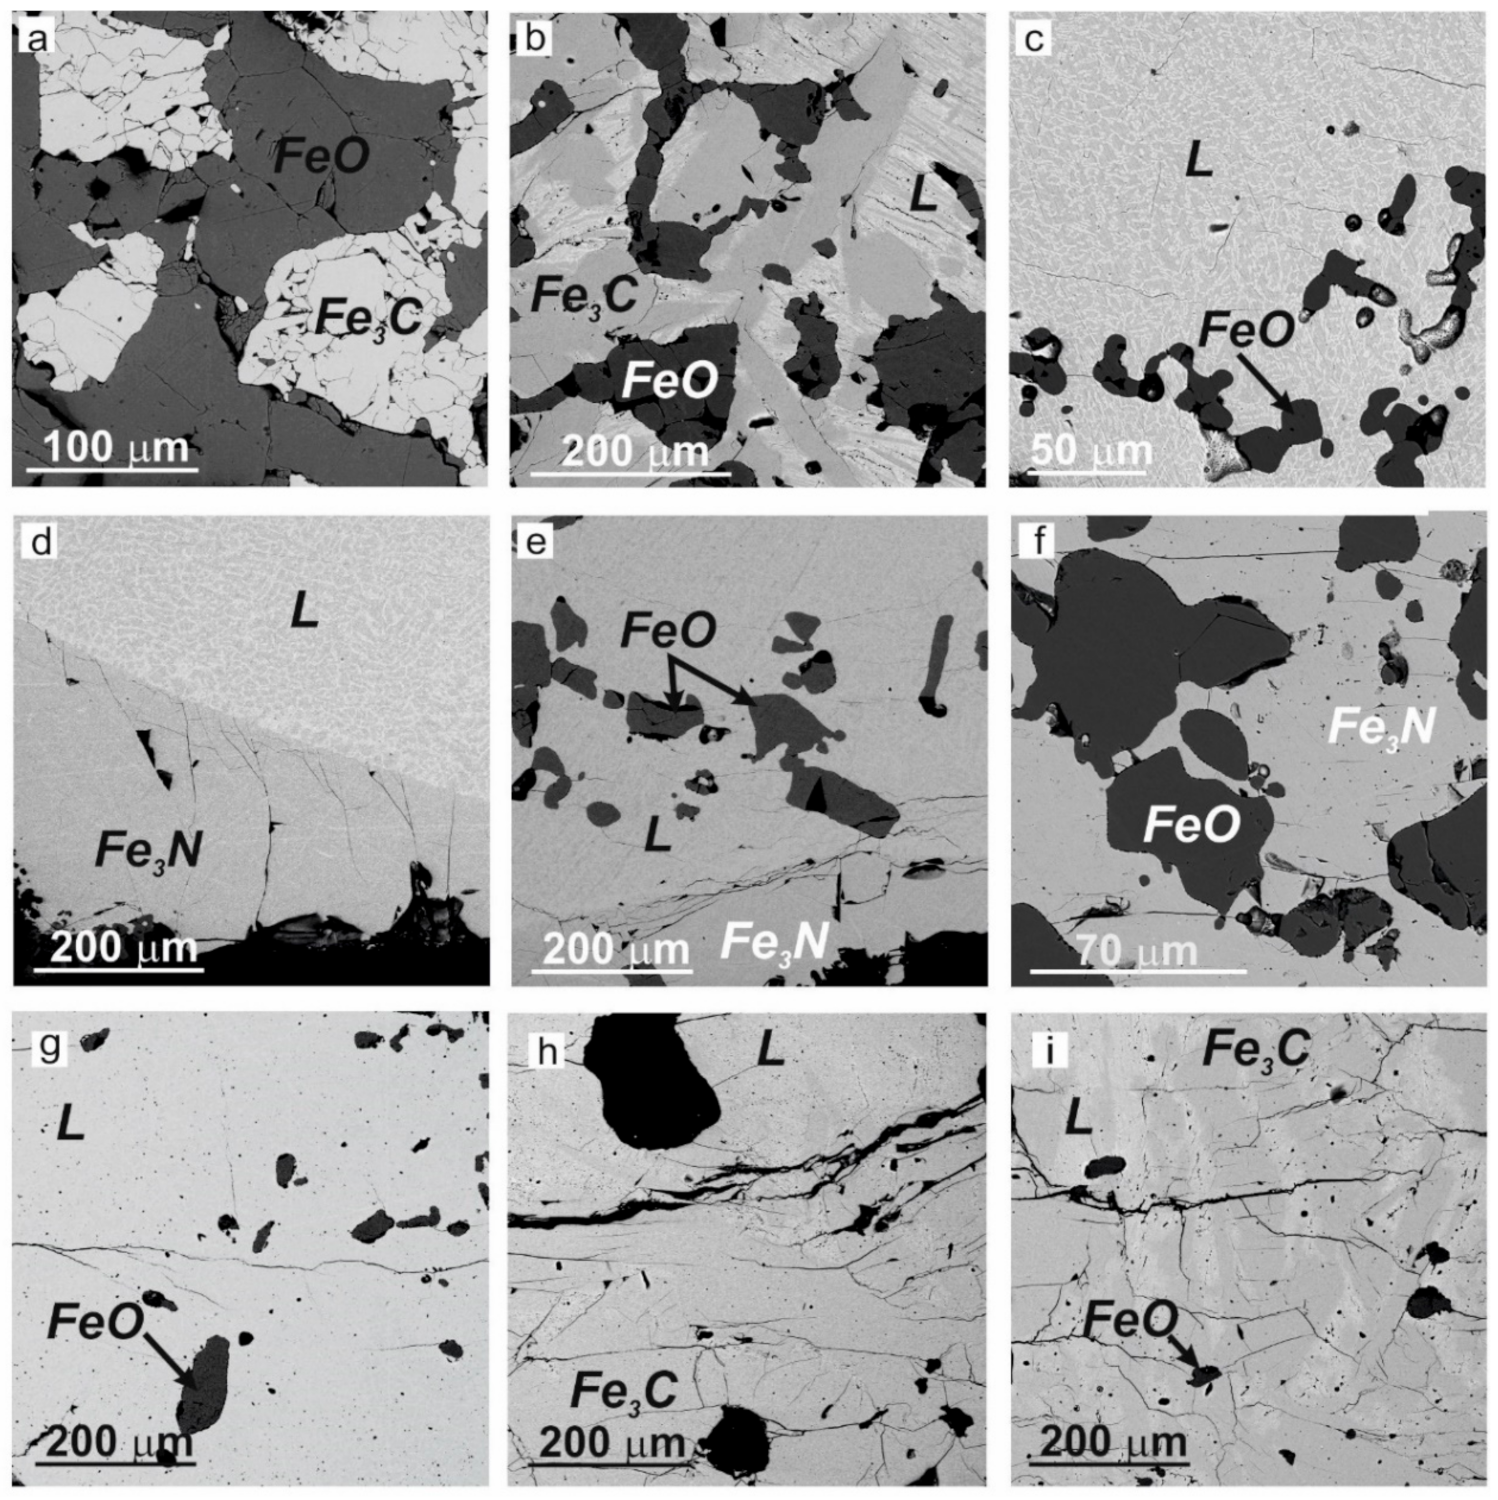
3.1. Textures of Experimental Samples

The obtained quenched melts generally produced a dendritic network, with blades and an interstitial lamellar quench texture (Figure 2b–d). In a few samples, however, no quench textures appeared in SEM images though a dendritic network came out upon etching with 5% Nital for 2–4 min (Figure 2e,g). Depending on starting compositions, exsolution lamelli varied in size from ~10–30 μm (Figure 2c,d) in almost fully molten samples to 100 μm in the case of partially molten charges (Figure 2b).
FeO occurred as anhedral grains with sizes from 20–70 μm in oxygen-poor samples to 100–200 μm in oxygenated samples (Figure 2). Wüstite was uniformly distributed over the samples, irrespective of O concentration in the system. Fe3C likewise formed 50–200 μm subhedral or sometimes anhedral grains (Figure 2a–c). Iron nitride equilibrated with melt was localized in a layer of anhedral grains in the cold part of the samples (Figure 2d,e) and was intergrown with wüstite in the absence of quenched melt (Figure 2f). Few anhedral Fe7C3 carbide grains formed in several samples that were synthesized from systems with added oxygen.
SEM and optical microscopy of polished surfaces (etched in some cases) revealed six types of textures (Table 2 and Figure 2):
  • one phase: granular solid FeO, with straight grain boundaries and equilibrium 120° dihedral angles;
  • two phases: granular solid FeO + Fe3C or FeO + Fe3N (Figure 2a,f);
  • two phases: anhedral FeO + quenched melt (Figure 2c);
  • three phases: anhedral or subhedral Fe3C + anhedral FeO + quenched melt (Figure 2b);
  • three phases: anhedral FeO + anhedral Fe3N + quenched melt (Figure 2d,e);
  • four phases: non-equilibrium association of anhedral FeO + Fe3C + few Fe7C3 grains (X-ray powder diffraction data) + quenched melt, obtained in a series of experiments with excess oxygen (Figure 2h,i).

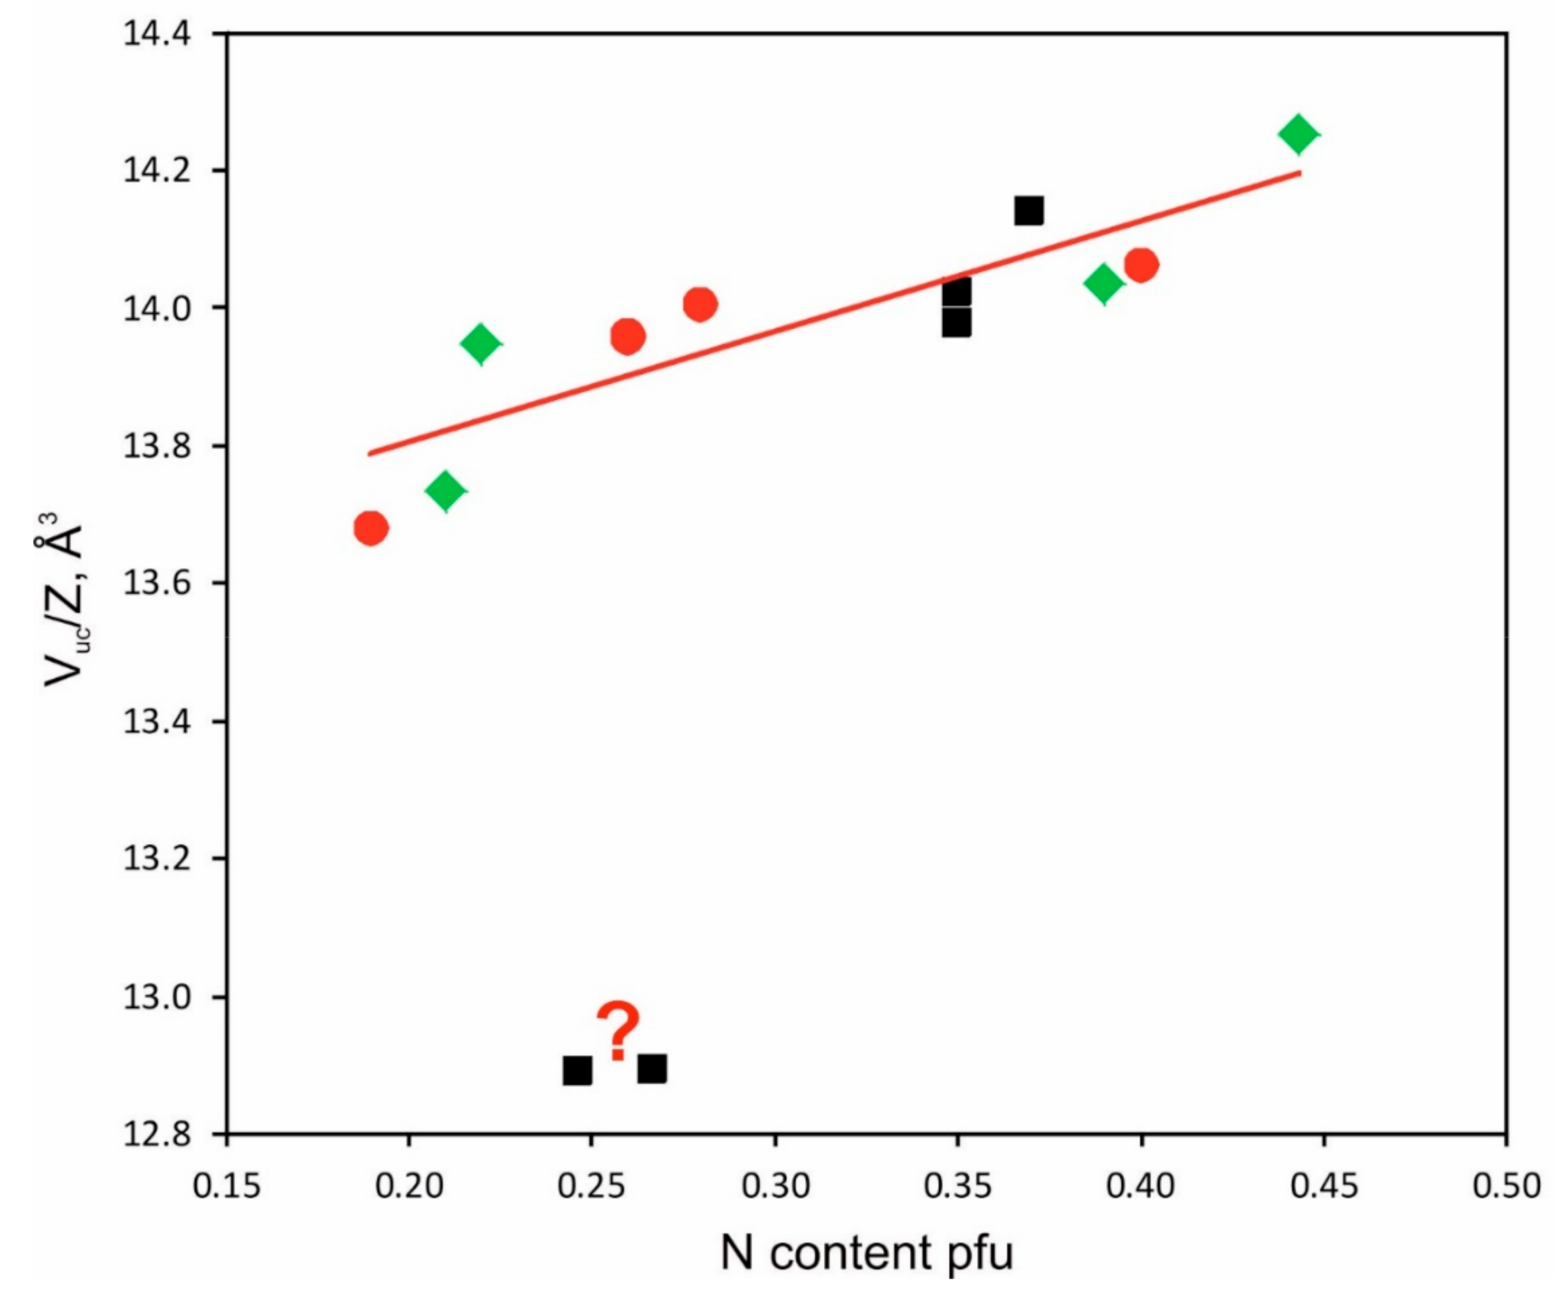
3.2. Crystal Structure and Compositions of Phases

The results of single-crystal experiments in the system FeO-Fe3C-Fe3N are presented in Table 3 and Table 4; Figure 3 shows the unit-cell parameters of iron nitride per formula unit, with the respective values for FeNx obtained earlier [20,21] given for comparison. The previous and new data fall within the same trend, except for two points with low contents of nitrogen in iron nitride in run 1036_7_2 of [20], which may result from bad choice of quench crystals. Without these two points, the approximating relationship Vfu(Nx) plotted using data of three experimental series in the systems Fe-Fe3C-Fe3N, FeO-Fe3C-Fe3N, and Fe (Fe3C)-fluid receives solid grounds. According to single-crystal XRD, the FexO number of Fe (x) in wüstite increases from 0.863 to 1.000 while the unit-cell volume slightly decreases (Table 4).
The phases in the two-phase region FeO + Fe3C have a fixed composition revealed by EMPA, because of low solubilities: nitrogen in Fe3C (at the level of detection limit), as well as carbon and nitrogen in FeO. The solubility of carbon in Fe3N is quite high and reaches 2.7 wt % in association with FeO, which marks the respective solid solution limit. In the three-phase region FeO + Fe3C + L, the concentrations of C and N in Fe3C and quench melt fit two points in the diagram with a deviation around ± 0.1 wt % (Table 2). These points limit the respective two-phase fields in the ternary diagram (Figure 4). The quenched melt of four samples with different relative percentages of FeO, Fe3C and L contains 3.7 wt % C and 1.2 wt % N. The composition of iron carbide in these samples is identical, within the error, to that in the two-phase association FeO + Fe3C. The situation with the three-phase region FeO + Fe3N + L is the same. The compositions of Fe3N and L, with errors of ± 0.2 wt % for C and ± 0.1 wt % for N, fit the points in the diagram. The quenched melt equilibrated with FeO and Fe3N consists of 91.0–92.5 wt % Fe, 2.7 wt % C, and 3.5 wt % N in three samples, while the composition of iron nitride in these samples is 92.0–92.5 wt % Fe, 2.1 wt % C, and 4.5 wt % N. On the other hand, the concentrations of carbon and nitrogen in the melt from two-phase samples FeO + L vary from 2.1 to 3.7 wt % and 1.2 to 3.5 wt %, respectively. Oxygen in the melt equilibrated with FeO varies from 0.4 to 0.6 wt % in all cases.
Melts that formed in three runs of the additional experimental series (Table 2; Figure 5), with excess oxygen added to the Fe-Fe3C-Fe3N system, fit into the field FeO + L (3–4 wt % C and 1.5–3.5 wt % N), but contain Fe3C and Fe7C3 in two cases. The composition of Fe3C is close to ideal, with a minor nitrogen impurity (0.2 wt % N) and Fe7C3. The phase compositions of samples obtained in two runs with the greatest oxygen enrichment (1606_3_5 and 1806_3_6) correspond to the fields Fe3N + FeO and Fe3C + FeO, while the phases approach the equilibrium.

4. Discussion

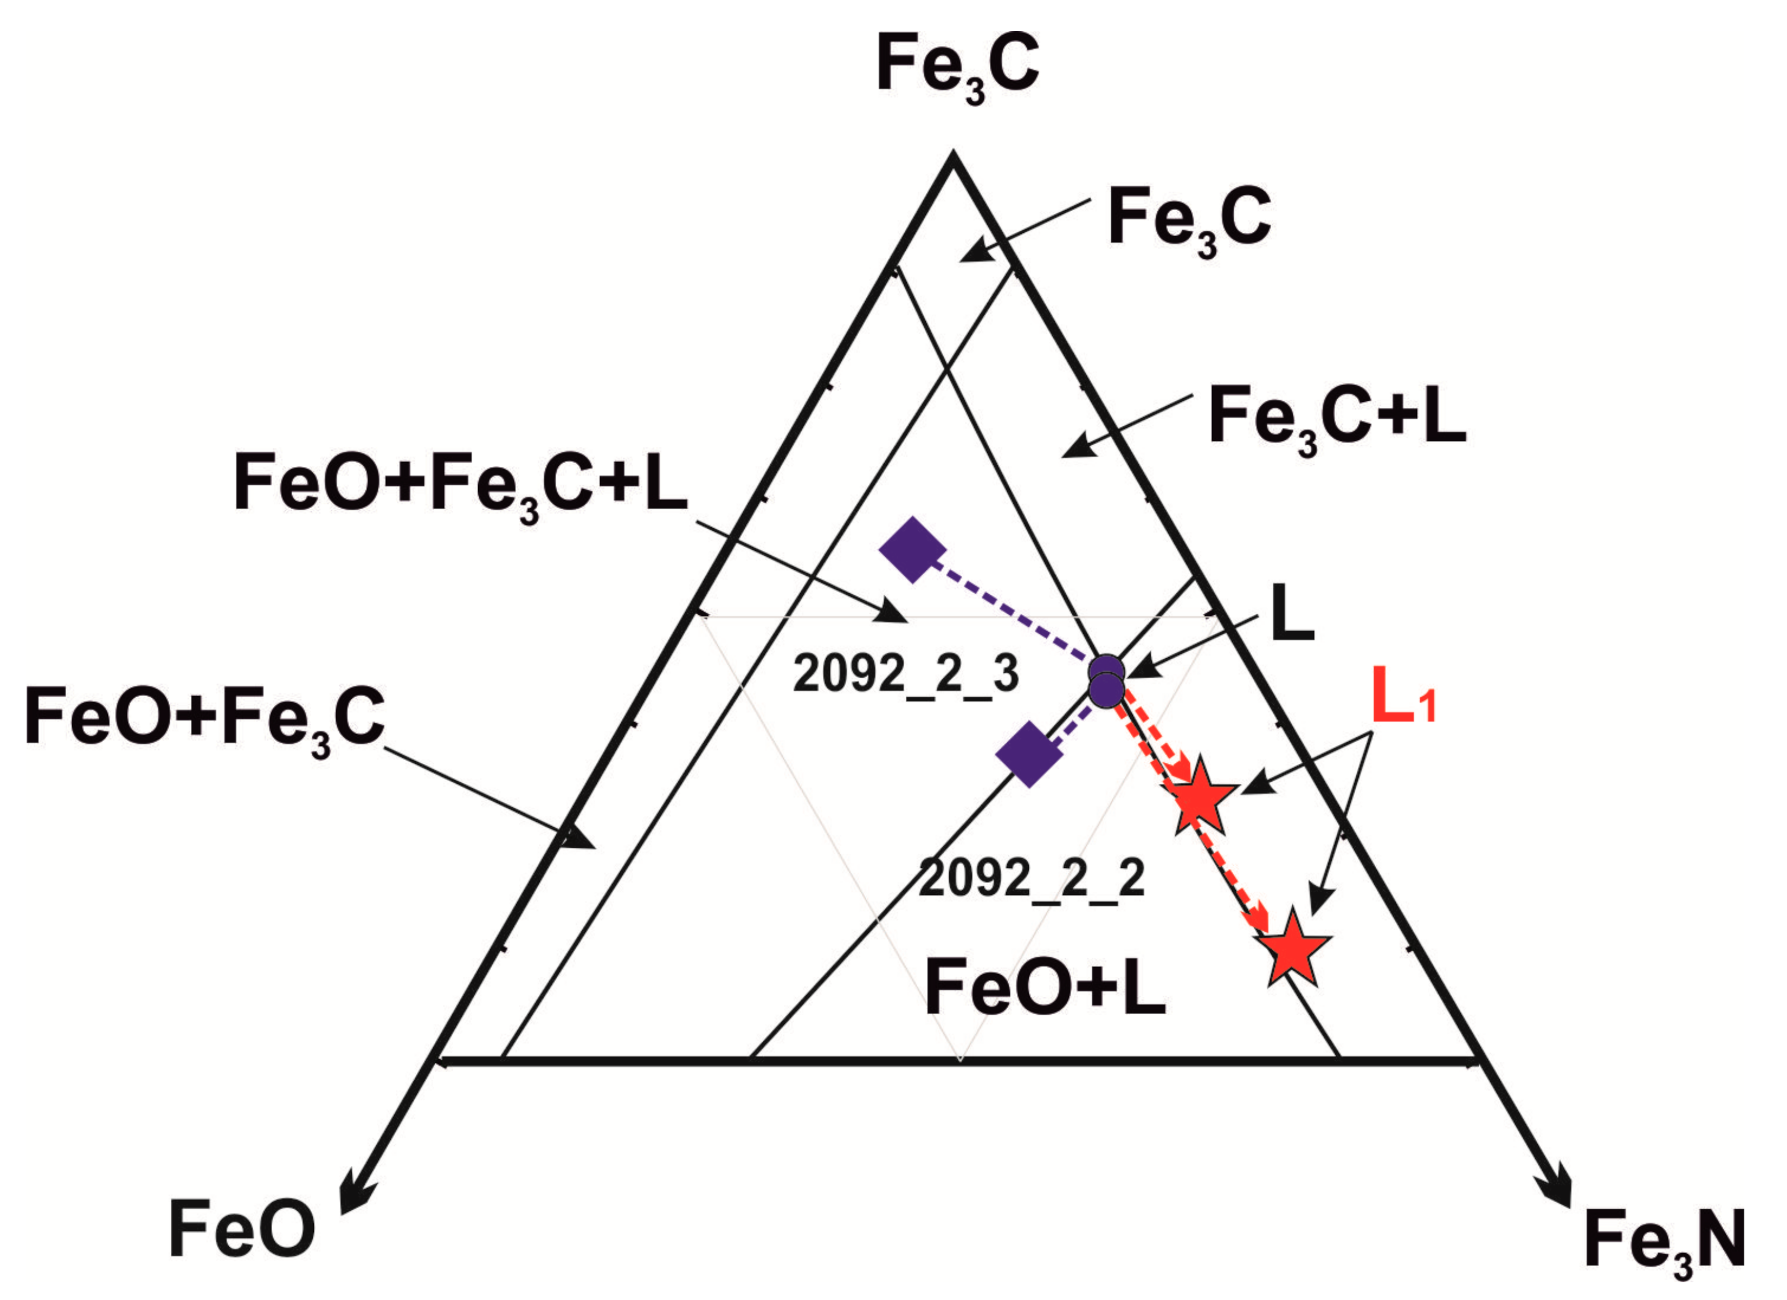
4.1. Phase Relations in System FeO-Fe3C-Fe3N

The experimental results have revealed phase relations in the FeO-Fe3C-Fe3N system and were used to plot the isothermal section in the respective ternary diagram. The boundaries of one-, two-, and three-phase fields were outlined according to changes in the set of equilibrium phases (Figure 1 and Figure 4). Specifically, the boundaries of the fields of phases associated with liquid were reconstructed from data on the compositions of the quenched melt equilibrated with solids. Wüstite is unstable in the system at 7.8 GPa and 1350 °C, at ≤0.5 wt % O. At these conditions, the phase relations in the FeO-Fe3C-Fe3N system (Figure 1 and Figure 4) become similar to those in the Fe-Fe3C-Fe3N system we studied before [20]. As oxygen increases to exceed 0.5–0.8 wt %, the Fe3C, L, and Fe3N single-phase fields change to those of two phases (FeO-Fe3C, FeO + L, and FeO-Fe3N), while the originally two-phase fields Fe3C + L and Fe3N + L move to three phases: Fe3C + FeO + L and Fe3N + FeO+L in the regions of high C and N, respectively (Figure 1 and Figure 4).
The synthesized wüstite (space group Fm 3 ¯ m) lacks impurities exceeding the detection limit of EMPA. The concentration of nitrogen in iron carbide was likewise below the EMPA detection limit. It was hard to select relatively large fragments from the samples consisting of fine-grained aggregates. Single-crystal analysis of one suitable carbide grain revealed unit-cell parameters of Fe3C, space group Pnma. According to our previous data of the CHN analyzer [20], iron carbide in the Fe-Fe3C-Fe3N system at 7.8 GPa and 1350 °C in equilibrium with an N-rich melt contained 0.3 to 0.5 wt % nitrogen. N-bearing iron carbide of this kind had a 7–11% larger formula-unit volume than the initial N-free carbide. In EMPA data, carbon in the FeO-Fe3C-Fe3N system was slightly below the ideal value for Fe3C. The concentrations of N and C in phase ε-Fe3N, space group P63/mmc (Table 3), vary in a large range. The phase is identical to iron nitride obtained earlier in experiments with the Fe-Fe3C-Fe3N system under the same P-T conditions. It contains up to 2.7 wt % C and 4.4 wt % N in equilibrium with both C-rich melt and wüstite but 2.1 wt % C and 5.4 wt % N in the case of equilibrium with wüstite alone. Note that at 1 atm ε-Fe3N can accommodate a large amount of carbon within the octahedral interstices of the structure, which leads to its transformation to ε-Fe3(C/N) [36]. C-bearing iron nitride obtained at high pressure should be considered as carbonitride.
Iron carbide and nitride equilibrated with melt in the FeO-Fe3C-Fe3N system have their stability fields separated by a two-phase field of FeO + L and thus cannot be co-crystallized from the same melt. Metal melt enriched in carbon and nitrogen is stable within the FeO range from a few fractions of percent to 90 wt % (Figure 1 and Figure 4). The contents of carbon and nitrogen in this melt are, respectively, 3.8 wt % C and 1.2 wt % N if it is in equilibrium with Fe3C and FeO but 2.9–3.0 wt % C and 3.5–3.6 wt % N in the case of equilibrium with Fe3N and FeO. Oxygen in the melt remains within 0.5–0.8 wt % at any bulk contents of O, C, and N. Thus, oxygen increase leads to greater FeO percentages in the run products but not to the formation of magnetite (Fe3O4).

4.2. Formation Conditions of Iron Oxide, Carbide, and Nitride Inclusions in Natural Diamonds

The conditions P = 7.8 GPa and T = 1350 °C used for the experiments in our work correspond to the 1300 °C adiabat [23] at a depth of 250 km. Thus, our data can be used to reconstruct the mechanism of native iron oxidation in the upwelling process in the sublithospheric mantle at adiabatic temperatures. Potential temperatures in the near subduction slab zones can be significantly lower. Therefore, additional research is needed to investigate phase equilibria in the FeO-Fe3C-Fe3N system in the temperature range from 1000 °C to 1350 °C. The obtained experimental evidence demonstrates that partial oxidation of a metal phase containing low carbon and nitrogen in the mantle depleted in volatiles at a depth about 250 km can produce FeO with minor amounts of Fe3C; the latter then becomes fully oxidized with release of C0 [22]. If the mantle is rich in volatiles, the process may lead to the formation of a FeO + Fe3C + L association. According to experiments with additional oxygen inputs to the system, oxidation begins with the melt, because it has the greatest oxygen affinity. The melt exposed to oxidation loses iron but gains carbon and nitrogen, which is favorable for the onset of crystallization of Fe3C and even Fe7C3. Therefore, it is reasonable to hypothesize that diamond may crystallize from the melt which undergoes rapid oxidation and becomes supersaturated with respect to carbon. Fe3C and Fe7C3 can become unstable as the content of Ni in the metal phase increases to 10 at % at 5.7 GPa [37] and to 20 at % at 10 GPa [15]. Upon further oxidation of the system, it may acquire ever more FeO while the percentage of melt decreases. Note that the concentration of nitrogen in the system increases as well, while the contents of carbon and oxygen remain invariable due to crystallization of FeO and iron carbides. Proceeding from nitrogen partitioning between diamond and iron melt rich in volatiles at DNDm/Met = 0.013–0.024 [38], one can expect nitrogen increase in diamond that crystallizes from the oxidizing metal melt.
Accumulation of nitrogen in the melt subject to oxidation may lead to crystallization of iron nitride and complete melt consumption. At normal thermal conditions in the mantle, crystallization of C-bearing iron nitride (or carbonitride) is possible in the presence of an N- and C-bearing melt within the three-phase field FeO + Fe3N + L. This mechanism can explain the formation of coexisting iron nitrides and oxides found as inclusions in mantle diamonds [11,12]. Complete oxidation of the melt and iron nitride can liberate nitrogen which remained fixed in metal phases before. In this case, it can release in the form of N2 and, being almost insoluble in silicates at high fO2 [39], rise to the surface as part of a fluid by degassing. Such behavior of nitrogen differs markedly from the fate of carbon after the oxidation of iron carbide or the metal melt which are the main carbon hosts in the reduced mantle. As the metal phases become oxidized, carbon remains in mantle rocks either in the elemental form C0 (graphite or diamond) or being bound in carbonates or carbonate-silicate melts.
Inclusions in both peridotitic and eclogitic natural diamonds often contain magnetite along with iron carbide and metallic iron [5,7,8,10,11,12]. Some authors [10,11,12] infer that magnetite can crystallize from a metal growth medium of diamond before the encapsulation of inclusions. Note that magnetite inclusions were found in diamonds synthesized in the Fe-Ni-C system at 1400 °C and 5.0–6.5 GPa [40]. Our data on phase relations in the FeO-Fe3C-Fe3N system and on oxidation of its different phases in the presence of excess oxygen provide direct evidence that metal melt is stable at 7.8 GPa and 1350 °C, i.e., at the P-T parameters corresponding to the conditions near the metal phase precipitation boundary at a depth of 250 km. However, only FeO can crystallize from the melt subject to oxidation until complete consumption of the latter.
It is pertinent to discuss the formation mechanism of magnetite in diamond-hosted inclusions. As it was shown by [41], magnetite is out of equilibrium with C0 and begins to reduce until wüstite at 7.7 GPa and >1150 °C. Thus, the reverse process of wüstite oxidation to magnetite is possible at ≤ 1150 °C. The lowest temperature, at which diamond can crystallize from the metal melt which compositionally corresponds to inclusions of native iron, has been a subject of extensive research. In the system Fe-Fe3C, the estimated eutectic temperature was slightly below 1350 °C at 5.7 GPa [37] and was inferred to be 1364 °C at 7.8 GPa by interpolation of data from [17]. Inclusions of native iron in diamond often contain nickel and sulfur impurities [5,7,8,10,11,12] which can extend considerably the stability field of the metal melt, both in temperature and composition. Eutectic temperatures in systems that simulate native iron can fall below 1200 °C at high contents of sulfur [42]. At 6 GPa and <1200 °C, magnetite potentially can crystallize together with iron carbides from a metal melt containing 18–23 wt % S [42]. However, diamond cannot crystallize from such an S-rich melt at these P-T conditions [43], and metastable graphite crystallizes instead. Meanwhile, oxygen excess in the metal melt causes no influence on its diamond-forming ability [44]. Thus, magnetite, at the temperature of its stability, hardly can co-crystallize with diamond from a metal melt corresponding in composition to metal inclusions.
A more realistic hypothesis is that magnetite crystallizes at temperatures below the iron alloy solidus. Then, the final crystallization of diamond at ≤1200 °C is possible from a relatively oxidized H2O-CO2 fluid or from a carbonate-silicate melt [14,45,46,47,48,49,50,51]. In this case, the diamond growth medium can be at the same time a source of oxygen for the reaction 3FeO + 1/2O2→Fe3O4. The formation of oxidized fluids or carbonate melts can result from upwelling of metal-bearing peridotite to the depths where majorite garnet is unstable [4] or from oxidized carbonate-bearing metapelite in subduction zones [16]. Note that the formation of magnetite from wüstite by the disproportionation reaction 4FeO→Fe3O4+Fe0 does not require additional oxygen sources. This reaction can easily occur within an already entrapped inclusion but is possible only below 700 °C at pressures below 10 GPa [51]. However, the disproportionation of wüstite, or wüstite associated with metallic iron, would produce a mixture of phases with ≤ 0.5 mole fraction of magnetite, which does not occur in reality judging by data of [10].

5. Conclusions

The phase relations in the FeO-Fe3C-Fe3N system revealed in experiments at 7.8 GPa and 1350 °C have implications for the process of native iron oxidation in the mantle near the 250 km boundary. Wüstite (space group Fm 3 ¯ m) turns out to be the only stable iron oxide in equilibrium with iron carbide. Its co-crystallization with Fe3C (space group Pnma), ε-Fe3N (space group P63/mmc), or with metal melt begins if the system contains > 0.5 wt % O and stops once the system attains complete oxidation. No magnetite has been found in the run products. At pressures and temperatures corresponding to the ~250 km mantle depth and at a normal heat flux of 40 mW/m2, the metal melt is less stable to oxidation than iron carbide or nitride. Co-crystallization of Fe3C and Fe3N from an oxidizing melt is impossible because the fields of coexisting phases rich in carbon and nitrogen are separated by that of FeO + L. Additional inputs of oxygen into the system lead to the formation of FeO, to the crystallization of Fe3C and Fe7C3, and to nitrogen enrichment of the residual melt. In the mantle containing 250 ppm C and 100 ppm N, this process can induce crystallization of iron nitride. The reported results show that iron carbides and nitrides found enclosed in mantle diamonds may have formed by oxidation of metal melts that originally contained quite small amounts of carbon and nitrogen.

Author Contributions

Conceptualization, A.N.K. and A.G.S.; Data curation, A.N.K. and A.G.S.; Formal analysis, A.N.K. and. Y.V.S.; Funding acquisition, A.G.S.; Investigation, A.N.K., A.G.S. and Y.V.S.; Methodology, A.G.S. and Y.N.P.; Project administration, A.N.K. and A.G.S.; Visualization, A.N.K. and Y.V.S.; Writing—original draft, A.N.K., A.G.S., and Y.V.S.; Writing—review and editing, Y.N.P. All authors have read and agreed to the published version of the manuscript.

Funding

This research was funded by the Russian Science Foundation, grant number 16-17-10041, and by state assignment of IGM SB RAS (effect of excess oxygen on phase equilibrium in the system).

Acknowledgments

We wish to thank Yury Borzdov and Alexander Khokhryakov for assistance throughout the study.

Conflicts of Interest

The authors declare no conflict of interest. The funders had no role in the design of the study; in the collection, analyses, or interpretation of data; in the writing of the manuscript, or in the decision to publish the results.

References

  1. Frost, D.J.; Liebske, C.; Langenhorst, F.; McCammon, C.A.; Trønnes, R.G.; Rubie, D.C. Experimental evidence for the existence of iron-rich metal in the Earth’s lower mantle. Nature 2004, 428, 409–412. [Google Scholar] [CrossRef] [PubMed]
  2. Rohrbach, A.; Ballhaus, C.; Golla-Schindler, U.; Ulmer, P.; Kamenetsky, V.S.; Kuzmin, D.V. Metal saturation in the upper mantle. Nature 2007, 449, 456–458. [Google Scholar] [CrossRef] [PubMed]
  3. Rohrbach, A.; Schmidt, M.W. Redox freezing and melting in the Earth’s deep mantle resulting from carbon-iron redox coupling. Nature 2011, 472, 209–212. [Google Scholar] [CrossRef] [PubMed]
  4. Stagno, V.; Ojwang, D.O.; McCammon, C.A.; Frost, D.J. The oxidation state of the mantle and the extraction of carbon from Earth’s interior. Nature 2013, 493, 84. [Google Scholar] [CrossRef] [PubMed]
  5. Sobolev, N.V.; Efimova, E.S.; Pospelova, L.N. Native iron in Yakutian diamonds and its mineral assemblage. Sov. Geol. Geophys. 1981, 22, 25–28. [Google Scholar]
  6. Bulanova, G.P. The formation of diamond. J. Geochem. Explor. 1995, 53, 1–23. [Google Scholar] [CrossRef]
  7. Stachel, T.; Harris, J.W.; Brey, G.P. Rare and unusual mineral inclusions in diamonds from Mwadui, Tanzania. Contrib. Mineral. Petrol. 1998, 132, 34–47. [Google Scholar] [CrossRef]
  8. Jacob, D.E.; Kronz, A.; Viljoen, K.S. Cohenite, native iron and troilite inclusions in garnets from polycrystalline diamond aggregates. Contrib. Mineral. Petrol. 2004, 146, 566–576. [Google Scholar] [CrossRef]
  9. Smith, E.M.; Shirey, S.B.; Nestola, F.; Bullock, E.S.; Wang, J.; Richardson, S.H.; Wang, W. Large gem diamonds from metallic liquid in Earth’s deep mantle. Science 2016, 354, 1403–1405. [Google Scholar] [CrossRef] [PubMed] [Green Version]
  10. Shatsky, V.S.; Ragozin, A.L.; Logvinova, A.M.; Wirth, R.; Kalinina, V.V.; Sobolev, N.V. Diamond-rich placer deposits from iron-saturated mantle beneath the northeastern margin of the Siberian Craton. Lithos 2020, 364–365, 1–12. [Google Scholar] [CrossRef]
  11. Kaminsky, F.V.; Wirth, R. Iron carbide inclusions in lower-mantle diamond from Juina, Brazil. Can. Mineral. 2011, 49, 555–572. [Google Scholar] [CrossRef] [Green Version]
  12. Kaminsky, F.; Wirth, R. Nitrides and carbonitrides from the lowermost mantle and their importance in the search for Earth’s “lost” nitrogen. Am. Min. 2017, 102, 1667–1676. [Google Scholar] [CrossRef]
  13. Bataleva, Y.V.; Palyanov, Y.N.; Sokol, A.G.; Borzdov, Y.M.; Bayukov, O.A. The role of rocks saturated with metallic iron in the formation of ferric carbonate-silicate melts: Experimental modeling under PT-conditions of lithospheric mantle. Russ. Geol. Geophys. 2015, 56, 143–154. [Google Scholar] [CrossRef]
  14. Palyanov, Y.N.; Bataleva, Y.V.; Sokol, A.G.; Borzdov, Y.M.; Kupriyanov, I.N.; Reutsky, V.N.; Sobolev, N.V. Mantle–slab interaction and redox mechanism of diamond formation. Proc. Natl. Acad. Sci. USA 2013, 110, 20408–20413. [Google Scholar] [CrossRef] [Green Version]
  15. Rohrbach, A.; Ghosh, S.; Schmidt, M.W.; Wijbrans, C.H.; Klemme, S. The stability of Fe-Ni carbides in the Earth’s mantle: Evidence for a low Fe-Ni-C melt fraction in the deep mantle. Earth Planet. Sci. Lett. 2014, 388, 211–221. [Google Scholar] [CrossRef]
  16. Schmidt, M.W.; Poli, S. Devolatilization during Subduction. Treatise on Geochemistry, 2nd ed.; Elsevier: Amsterdam, The Netherlands, 2014; pp. 669–697. [Google Scholar]
  17. Lord, O.T.; Walter, M.J.; Dasgupta, R.; Walker, D.; Clark, S.M. Melting in the Fe-C system to 70 GPa. Earth Planet. Sci. Lett. 2009, 284, 157–167. [Google Scholar] [CrossRef] [Green Version]
  18. Roskosz, M.; Bouhifd, M.A.; Jephcoat, A.P.; Marty, B.; Mysen, B.O. Nitrogen solubility in molten metal and silicate at high pressure and temperature. Geochim. Cosmochim. Acta 2013, 121, 15–28. [Google Scholar] [CrossRef]
  19. Dalou, C.; Hirschmann, M.M.; von der Handt, A.; Mosenfelder, J.; Armstrong, L.S. Nitrogen and carbon fractionation during core–mantle differentiation at shallow depth. Earth Planet. Sci. Lett. 2017, 458, 141–151. [Google Scholar] [CrossRef] [Green Version]
  20. Sokol, A.G.; Palyanov, Y.u.N.; Tomilenko, A.A.; Bul’bak, T.A.; Palyanova, G.A. Carbon and nitrogen speciation in nitrogen-rich C-O-H-N fluids at 5.5–7.8 GPa. Earth Planet. Sci. Lett. 2017, 460, 234–243. [Google Scholar] [CrossRef]
  21. Sokol, A.G.; Tomilenko, A.A.; Bul’bak, T.A.; Kruk, A.N.; Sokol, I.A.; Palyanov, Y.N. Fate of fluids at the base of subcratonic lithosphere: Experimental constraints at 5.5–7.8 GPa and 1150–1350 deg C. Lithos. 2018, 318, 419–433. [Google Scholar] [CrossRef]
  22. Grewal, D.S.; Dasgupta, R.; Sun, C.; Tsuno, K.; Costin, G. Delivery of carbon, nitrogen, and sulfur to the silicate Earth by a giant impact. Sci. Adv. 2019, 5, eaau3669. [Google Scholar] [CrossRef] [PubMed] [Green Version]
  23. Hasterok, D.; Chapman, D.S. Heat production and geotherms for the continental lithosphere. Earth Planet. Sci. Lett. 2011, 307, 59–70. [Google Scholar] [CrossRef]
  24. Pearson, D.G.; Canil, D.; Shirey, S.B. Mantle samples included in volcanic rocks: Xenoliths and diamonds. Treatise Geochem. (Second Ed.) 2014, 3, 169–253. [Google Scholar]
  25. Ohtani, E.; Ringwood, A.E.; Hibberson, W. Composition of the core, II. Effect of high pressure on solubility of FeO in molten iron. Earth Planet. Sci. Lett. 1984, 71, 94–103. [Google Scholar] [CrossRef]
  26. Wriedt, H.A. The Fe-O (Iron-Oxygen) System. J. Phase Equilibria 1991, 12, 170–200. [Google Scholar] [CrossRef]
  27. Komabayashi, T. Thermodynamics of melting relations in the system Fe-FeO at high pressure: Implications for oxygen in the Earth’s core. J. Geophys. Res. Solid Earth 2014, 119, 4164–4177. [Google Scholar] [CrossRef]
  28. Palyanov, Y.N.; Borzdov, Y.M.; Khokhryakov, A.F.; Kupriyanov, I.N.; Sokol, A.G. Effect of nitrogen impurity on diamond crystal growth processes. Cryst. Growth Des. 2010, 10, 3169–3175. [Google Scholar] [CrossRef]
  29. Turkin, A.I. Lead selenide as a continuous internal indicator of pressure in solid-media cells of high-pressure apparatus in the range of 4–6.8 GPa. High Temp.-High Press. 2004, 36, 371–376. [Google Scholar] [CrossRef]
  30. Day, H.W. A revised diamond-graphite transition curve. Am. Min. 2012, 97, 52–62. [Google Scholar] [CrossRef]
  31. Sokol, A.G.; Borzdov, Y.u.M.; Palyanov, Y.u.N.; Khokhryakov, A.F. High-temperature calibration of a multi-anvil high-pressure apparatus. High. Press. Res. 2015, 35, 139–147. [Google Scholar] [CrossRef]
  32. Sokol, A.G.; Kruk, A.N.; Seryotkin, Y.V.; Korablin, A.A.; Palyanov, Y.N. Phase relations in the Fe-Fe3C-Fe3N system at 7.8 GPa and 1350 °C: Implications for carbon and nitrogen hosts in Fe0-saturated upper mantle. Phys. Earth Plan. Int. 2017, 265, 43–53. [Google Scholar] [CrossRef]
  33. Wells, A. Metallographic analysis of compound layers on ferritic nitrocarburized plain low carbon steel. J. Mater. Sci. 1985, 20, 2439–2445. [Google Scholar] [CrossRef]
  34. Rigaku Oxford Diffraction. CrysAlisPro Software System, v. 1.1; Rigaku Corporation: Oxford, UK, 2016. [Google Scholar]
  35. Sheldrick, G. SHELXT—Integrated space-group and crystal structure determination. Acta Crystallogr. A Found. Adv. 2015, 71, 3–8. [Google Scholar] [CrossRef] [Green Version]
  36. Jack, K.H. Binary and Ternary Interstitial Alloys. II. The Iron-Carbon-Nitrogen System. Proc. R. Soc. Lond. A. 1948, 195, 41. [Google Scholar]
  37. Strong, H.M.; Chrenko, R.M. Diamond growth rates and physical properties of laboratory-made diamond. J. Phys. Chem. 1971, 75, 1838–1843. [Google Scholar] [CrossRef]
  38. Sokol, A.G.; Khokhryakov, A.F.; Borzdov, Y.M.; Kupriyanov, I.N.; Palyanov, Y.N. Solubility of carbon and nitrogen in a sulfur-bearing iron melt: Constraints for siderophile behavior at upper mantle conditions. Am. Min. 2019, 104, 1857–1865. [Google Scholar] [CrossRef]
  39. Li, Y.; Wiedenbeck, M.; Shcheka, S.; Keppler, S. Nitrogen solubility in upper mantle minerals. Earth Planet. Sci. Lett. 2013, 377–378, 311–323. [Google Scholar] [CrossRef]
  40. Pal’yanov, Y.N.; Khokhryakov, A.F.; Borzdov, Y.M.; Doroshev, A.M.; Tomilenko, A.A.; Sobolev, N.V. Inclusions in synthetic diamond. Dokl. Akad. Nauk. 1996, 338, 78–80. [Google Scholar]
  41. Frost, D.J.; Wood, B.J. Experimental measurements of the properties of H2O-CO2 mixtures at high pressures and temperatures. Geochim. Cosmochim. Acta 1997, 61, 3301–3309. [Google Scholar] [CrossRef]
  42. Dasgupta, R.; Buono, A.; Whelan, G.; Walker, D. High-pressure melting relations in Fe-C-S systems: Implications for formation, evolution, and structure of metallic cores in planetary bodies. Geochim. Cosmochim. Acta 2009, 73, 6678–6691. [Google Scholar] [CrossRef]
  43. Palyanov, Y.N.; Borzdov, Y.M.; Khokhryakov, A.F.; Bataleva, Y.V.; Kupriyanov, I.N. Effect of sulfur on diamond growth and morphology in metal-carbon systems. CrystEngComm 2020, 22, 5497–5508. [Google Scholar] [CrossRef]
  44. Palyanov, Y.N.; Borzdov, Y.M.; Kupriyanov, I.N.; Bataleva, Y.V.; Nechaev, D.V. Effect of Oxygen of Diamond Crystallization in Metal-Carbon Systems. ACS Omega 2020, 5, 18376–18383. [Google Scholar] [CrossRef]
  45. Pal’Yanov, Y.N.; Sokol, A.G.; Borzdov, Y.M.; Khokhryakov, A.F.; Shatsky, A.F.; Sobolev, N.V. The diamond growth from Li2CO3, Na2CO3, K2CO3 and Cs2CO3 solvent-catalysts at P = 7 GPa and T = 1700–1750 °C. Diam. Relat. Mater. 1999, 8, 1118–1124. [Google Scholar] [CrossRef]
  46. Kumar, M.S.; Akaishi, M.; Yamaoka, S. Formation of diamond from supercritical H2O-CO2 fuid at high pressure and high temperature. J. Cryst. Growth. 2000, 213, 203–206. [Google Scholar] [CrossRef]
  47. Yamaoka, S.; Kumar, M.D.S.; Akaishi, M.; Kanda, H. Reactions between carbon and water under diamond-stable high pressure and high tempreture conditions. Diam. Relat. Mater. 2000, 9, 1480–1486. [Google Scholar] [CrossRef]
  48. Sokol, A.G.; Pal’Yanov, Y.N.; Pal’Yanova, G.A.; Khokhryakov, A.F.; Borzdov, Y.M. Diamond and graphite crystallization from C-O-H fluids under high pressure and high temperature conditions. Diam. Relat. Mater. 2001, 10, 2131–2136. [Google Scholar] [CrossRef]
  49. Palyanov, Y.N.; Sokol, A.G. The effect of composition of mantle fluids/melts on diamond formation processes. Lithos 2009, 112, 690–700. [Google Scholar] [CrossRef]
  50. Bureau, H.; Langenhorst, F.; Auzende, A.L.; Frost, D.J.; Estève, I.; Siebert, J. The growth of fibrous, cloudy and polycrystalline diamonds. Geochim. Cosmochim. Acta 2012, 7, 202–214. [Google Scholar] [CrossRef]
  51. Bureau, H.; Frost, D.J.; Bolfan-Casanova, N.; Leroy, C.; Esteve, I.; Cordier, P. Diamond growth in mantle fluids. Lithos 2016, 265, 4–15. [Google Scholar] [CrossRef] [Green Version]
Figure 1. Ternary diagram corresponding to phase relations in the system FeO-Fe3C-Fe3N. White sectors in the symbols: phase absent; colored sectors: phase present. Position of symbols in the diagram marks bulk composition of starting samples.
Minerals 10 00984 g001
Figure 2. Photomicrographs of samples after experiments. (a): cohenite (Fe3C) and wüstite, sample 1930_2_2; (b): quenched melt, cohenite and wustite, sample 1940_2_4; (c): quenched melt and wüstite, sample 1963_2_3 ; (d): Iron nitride and quenched melt, sample 1982_2_2; (e): iron nitride and wüstite with quenched melt 1982_2_3; (f): iron nitride and wüstite, sample 1963_2_5; (g): quenched melt and wüstite, sample 2092_2_1; (h): cohenite and quenched melt, sample 2092_2_2; (i): quenched melt, cohenite and wüstite, sample 2092_3.
Minerals 10 00984 g002
Figure 3. Volume of ε-phase Fe3N1 vs. number of nitrogen atoms (x) per FeNx formula unit. Solid line is linear polynomial obtained by approximation over all points (see text for explanation); circles are new data; squares and rhombs are our previous data from [32] and [21], respectively.
Minerals 10 00984 g003
Figure 4. FeO-Fe3C-Fe3N ternary phase diagram at 7.8 GPa and 1350 C (mol %) and compositions of phases obtained in experiments.
Minerals 10 00984 g004
Figure 5. Fragment of FeO-Fe3C-Fe3N phase diagram at 7.8 GPa and 1350 °C (mol %), with trends of melt composition changing in response to oxygen inputs. Rhombs are bulk compositions of starting samples. L = melt corresponding to initial composition of samples, without excess oxygen; L1 = actual melt.
Minerals 10 00984 g005
Table 1. Starting compositions (mol %).
Fe2O3
Run IDFe3CFe3NFeOO
1940_2_111.580.28.3-
1940_2_44138.820.3-
1930_2_140.747.511.8-
1982_2_608515-
1930_2_479.2119.8-
1930_2_592.443.7-
1963_2_312.84047.2-
1982_2_3152956-
1982_2_4551431-
1982_2_2031.2568.75-
1963_2_144.152.92.9-
1982_2_55950-
1930_2_286.413.60-
1940_2_211.48.180.5-
1963_2_412.81770.3-
1963_2_530.12.967-
1963_2_630.11752.9-
1930_2_835.16.158.7-
2092_2_13643147
2092_2_26318126
2092_2_3748126
1606_3_52035125
1606_3_62235226
Table 2. Average compositions (wt %) of synthesized phases.
Run IDPhaseNumber of AnalysesFeCNOTotal
1963_2_1Cohenite792.6(3)6.5(5)-0.6(3)99.7
Wüstite975.0(3)--24.3(1)99.3
1982_2_5Cohenite893.7(4)6.3(5)-0.5(3)100.5
Wüstite876.2(1)--24.2(1)100.4
1930_2_2Cohenite893.4(3)6.6(4)-0.3(5)100.3
Wüstite975.7(3)--25.0(1)100.7
1940_2_2Iron nitride891.8(1)2.7(1)5.3(4)0.4(1)100.2
Wüstite775.5(3)--25.3(4)100.8
1963_4_2Iron nitride791.4(5)2.7(1)4.9(3)0.5(3)99.6
Wüstite776.9(5)--22(3)98.9
1963_2_5Iron nitride892.2(3)2.1(5)5.4(2)0.4(1)100.1
Wüstite776.4(2)--22.6(1)99
1963_2_6Iron nitride991.7(3)2.3(5)5.3(5)0.4(5)99.7
Wüstite975.4(2)--23.5(5)98.9
1930_2_8Iron nitride992.0(3)2.3(3)5.0(1)0.4(4)99.7
Wüstite1074.9(1)--24.8(5)99.7
1940_2_1Cohenite992.0(1)6.8(2)-0.5(1)99.3
Wüstite774.5(2)--25.6(3)100.1
Quenched melt993.6(3)3.8(3)1.2(5)0.7(3)99.3
1940_2_4Cohenite991.9(4)6.6(4)-0.3(3)98.8
Wüstite875.3(2)--24.2(4)99.5
Quenched melt994.3(1)3.7(5)1.3(2)0.6(2)99.9
1930_2_1Cohenite793.9(3)6.4(3)-0.4(2)100.7
Wüstite1074.9(2)--25.1(4)100
Quenched melt995.4(3)3.7(3)1.3(5)0.5(5)100.9
1982_2_6Cohenite793.6(2)6.7(1)0.1(2)0.5(4)100.9
Wüstite975.0(1)--25.8(4)100.8
Quenched melt794.2(3)3.8(4)1.4(2)1.0(4)100.4
1930_2_4Wüstite775.1(2)--25.6(1)100.7
Quenched melt894.2(1)3.8(2)2.0(4)0.6(2)100.6
1930_2_5Wüstite1074.8(2)--25.5(4)100.3
Quenched melt1094(3)3.6(4)1.9(5)0.5(2)100
1963_2_3Wüstite775.2(1)--24.4(3)99.6
Quenched melt791.3(3)3.7(3)3(3)0.6(3)98.6
1982_2_3Iron nitride792.2(2)2.4(3)4.6(3)0.5(5)99.7
Wüstite1075.3(3)--23.5(1)98.8
Quenched melt792.0(4)3.0(2)3.5(1)0.6(2)99.1
1982_2_4Wüstite1075.3(2)--23.7(3)99
Iron nitride892.1(1)2.4(2)4.6(3)0.5(2)99.6
Quenched melt892.1(3)2.8(2)3.5(1)0.6(3)99
1982_2_2Iron nitride791.9(2)2.1(2)4.5(2)0.5(3)99
Wüstite975.2(4)--24.1(3)99.3
Quenched melt1092.5(5)2.9(2)3.6(1)0.6(3)99.6
2092_2_1Wüstite774.9 (6)--24.0 (2)99.1
Quenched melt1692.7 (2)3.1 (3)3.5 (1)0.40 (4)99.7
2092_2_2Cohenite891.8 (1)6.5 (1)0.3 (1)0.4 (1)99.6
Wüstite574.3 (2)--24.6 (2)99.1
Quenched melt1993.3 (3)3.9 (3)2.0 (1)0.4 (2)100.4
2092_2_3Cohenite891.9 (5)6.7 (2)0.21 (3)0.31 (2)99.1
Wüstite575.0 (5)--24.1 (5)99.1
Quenched melt1293.9 (3)4.0 (4)1.5 (2)0.31 (6)99.4
1606_3_5Cohenite991.9 (9)7.0 (5)0.3 (1)0.3 (1)99.5
Wüstite574.5 (7)--24.6 (6)99.2
1606_3_6Iron nitride889.8 (9)2.4 (3)6.5 (4)0.5 (1)99.2
Wüstite573.5 (4)--23.7 (7)97.2
StandardFe3C1093.6(2)6.6(2)-0.1(1)100.2
StandardFe3N1092.1(2)-7.6(1)0.1(1)99.8
Table 3. Results of X-ray single-crystal analysis of Fe(C,N)n.
SampleUnit-Cell Parameters, Space Group, Formula Unit NumberFormula Unit *Vuc/Z (Å3)
1963_2_1a = 5.0814(6), b = 6.7465(8), c = 4.5173(6) Å, V = 154.86(3) Å3, Pnma, Z = 12FeC0.293(4)12.905
1982_2_3a = 2.6901(7), c = 4.3658(13) Å, V = 27.361(18) Å3, P63/mmc, Z = 2FeN0.19(4)13.681
1963_2_4a = 2.7199(3), c = 4.3717(6) Å, V = 28.008(6) Å3, P63/mmc, Z = 2FeN0.28(2)14.004
1963_2_5a = 2.7241(2), c = 4.3760(5) Å, V = 28.123(5) Å3, P63/mmc, Z = 2FeN0.40(2)14.062
1963_2_6a = 2.7152(2), c = 4.3730(5) Å, V = 27.921(4) Å3, P63/mmc, Z = 2FeN0.26(6)13.961
1940_2_2a = 2.7158(3), c = 4.3697(5) Å, V = 27.911(5) Å3, P63/mmc, Z = 2FeN0.26(2)13.956
* inferred from refined structure data.
Table 4. Results of X-ray single-crystal analysis of wüstite FeO.
SampleUnit-Cell Parameters, Space Group, Formula Unit NumberFormula Unit *
1963_2_1a = 4.3135(2) Å, V = 80.259(12) Å3, F m 3 ¯ m , Z = 4Fe0.946(7)O
1940_2_1a = 4.31845(11) Å, V = 80.535(6) Å3, F m 3 ¯ m , Z = 4Fe1.000(5)O
1940_2_4a = 4.3204(2) Å, V = 80.642(12) Å3, F m 3 ¯ m , Z = 4Fe0.863(8)O
* inferred from refined structure data.
Publisher’s Note: MDPI stays neutral with regard to jurisdictional claims in published maps and institutional affiliations.

