Article

Integrated Magnetic Analyses for the Discrimination of Urban and Industrial Dusts

1
Institute of Geophysics, Polish Academy of Sciences, ks. Janusza 64, 01-452 Warsaw, Poland
2
Institute of Environmental Engineering, Polish Academy of Sciences, M. Skłodowskiej-Curie 34, 41-819 Zabrze, Poland
3
Istituto Nazionale di Geofisica e Vulcanologia, Via di Vigna Murata 605, 00143 Rome, Italy
*
Author to whom correspondence should be addressed.
Minerals 2020, 10(12), 1056; https://doi.org/10.3390/min10121056
Submission received: 15 October 2020 / Revised: 20 November 2020 / Accepted: 21 November 2020 / Published: 26 November 2020
(This article belongs to the Special Issue Natural and Technogenic Magnetic Particles in the Environment)

Abstract

:
Industrial and urban dusts were characterized by investigating their magnetic properties. Topsoil composed of technogenic magnetic particles (TMP) originating from areas affected by three ironworks, street dust mainly composed of traffic-related pollution, and particulate matter (PM) from urban agglomeration in Warsaw, Poland were investigated. Several magnetic methods, namely magnetic susceptibility, thermomagnetic curves, hysteresis loops, decomposition of isothermal remanent magnetization acquisition curves, and first-order reversal curves, were performed to evaluate the magnetic fraction of dust. Magnetite was the main magnetic phase in all types of samples, with a small amount of high-coercive hematite within ironworks and street dust samples. Significant differences were observed in the domain structure (grain size) of industrial and traffic-related magnetic particles. The grain size of TMP obtained from steel production was in the range of 5–20 µm and was predominated by a mixture of single-domain (SD) and multidomain (MD) grains, with the prevalence of SD grains in the topsoil affected by Třinec ironwork. The traffic-related dust contained finer grains with a size of about 0.1 µm, which is characteristic of the pseudo-single-domain (PSD)/SD threshold. Street dusts were composed of a slightly higher proportion of MD grains, while PM also revealed the typical behavior of superparamagnetic particles.

1. Introduction

Environmental pollution due to the continuous and rapid advancement of industrialization and urbanization has adversely increased over the last few years. Many studies have reported that dust and solid waste from different pollution sources are composed of a significant amount of ferrimagnetic components [1,2,3,4]. The deposition and input of these magnetic particles in the surrounding environment leads to the magnetic enhancement of topsoils, atmospheric air, and street dust within industrial and urban areas and nearby the pollution sources [5,6,7]. It is well documented that biomass burning, coal burning, metal smelting, solid waste recycling, and similar industrial processes can increasingly pollute the surrounding environment. Road traffic is another major source of magnetic particles in urban areas, which results in a magnetic enhancement of roadside soils [5,6,7,8,9,10,11,12,13,14]. The Fe-rich magnetic particles originating from non-natural sources are known as “technogenic magnetic particles” (TMP) [10,15,16].
The urban and industrial dusts are composed of natural and anthropogenic components containing fractions of magnetic minerals with specific magnetic properties. Magnetic parameters such as magnetic susceptibility are commonly used to quantify the magnetic particles in dust for assessing the pollution level. The detailed magnetic characterization of dust may also provide proxies for identifying the possible sources of pollution. Two specific features, the mineralogy and domain state of magnetic phases in variable mixtures of dusts, could be considered when identifying different types of magnetic particles and distinguishing their (natural and/or anthropogenic) sources.
The iron-containing minerals formed during high-temperature technological processes depending on temperature and reduction–oxidation conditions [15,17,18] can significantly differ from the natural minerals in terms of morphology, stoichiometry, and crystallographic structure. Magnetic carriers of fly ash particles produced by combustion processes exhibit a relatively high coercivity due to the high stress developed during rapid cooling after formation [19]. These specific spherical-shaped particles with high coercivity can act as the tracers of industrial dust deposition in the topsoils [20,21,22,23].
Metallic and/or oxidized iron particles resulting from traffic-related processes, such as wear on brakes, tires, and other parts of the vehicle are relatively coarse-grained [24,25,26,27,28,29,30]. The coarse Fe-rich particles are within the multidomain (MD) range, and a low coercivity might be expected [10,11,31] if the coercivity is not increased by surface oxidation [32,33,34]. Spassov et al. [31] identified different types of magnetic particles and distinguished their sources in urban airborne particulate matter (PM) by magnetic methods by measuring the demagnetization curves of an anhysteretic remanent magnetization (ARM). The authors showed that the distribution coercivity, a low- and a high-coercivity component, corresponds to the contribution of different sources of magnetic particles to the total PM mass. Natural dust and non-exhaust traffic emission, dust resuspended by the turbulence due to moving vehicles and other human activities, have been indicated as the possible sources of the low-coercivity magnetic phases. On the other hand, the higher coercivity fraction of PM corresponds to the chemically estimated PM mass contributed by exhaust emissions [11,31,35,36,37].
The broader context of our research, which concerns the study of magnetic properties of TMPs originating from various sources, includes the expansion of knowledge about factors that negatively affect the ecosystem, i.e., the environment and living organisms. The pollutants that are most harmful for the environment and human health (e.g., Pb, Cd, Zn, and Cr, PAHs, black carbon) can be easily incorporated into the surface of TMP or can be exchanged in their crystal lattice when they are formed during high-temperature processes. The harmful effect of the above-mentioned chemical components of pollution is well known and has been described in the literature [38,39]. For example, heavy metals have a devastating effect, primarily on the circulatory and respiratory systems, and even a short human exposure to dust pollution containing these metals can cause measurable negative effects on health.
Magnetic nanoparticles, which are common in urban airborne PM, were recently found even in human brain, where they can enter directly through the olfactory nerve. Thus, they are implicated in the production of damaging reactive oxygen species, which are causally linked to neurodegenerative diseases such as Alzheimer’s disease [40]. Exposure to up to ~22 billion magnetic nanoparticles/g of ventricular tissue appears to be directly associated with early and significant cardiac damage in children and young adults [41].
This study aimed to determine the magnetic fingerprint, magnetic composition, and grain size, inferred from the domain state of various types of magnetic particles originating from urban and industrial sources. We report the magnetic properties of airborne PM10 resuspended mainly by traffic (moving vehicles) and other human activities in urban areas and particles settled on the surface of the street and released by exhaust and non-exhaust traffic emission. The industrial dust is contained in the topsoil, which is the main sink of technogenic particles derived from three ironworks.
The composition of the magnetic fraction of dust was examined by complementary magnetic methods, namely by determining the Curie temperature of individual magnetic phases from the curve of the temperature dependence of magnetic susceptibility, by identifying the components of remanence associated with the magnetic phases from the thermal demagnetization of saturation isothermal magnetization (SIRM) curves, and by determining the magnetic components from the isothermal remanent magnetization (IRM) acquisition curves. The grain size (domain state) distribution was determined from the hysteresis ratios in the Day–Dunlop diagram [34,42,43,44] to identify the prevailing domain state when the mineralogy is dominated by magnetite as well as from the first-order reversal curve (FORC) diagrams providing additional information on the coercivity distribution and the magnetic interactions [45,46,47].

2. Materials and Methods

2.1. Topsoil Collected in the Vicinity of Ironworks

2.1.1. Sampling Area

The topsoil samples for the study were collected from forest areas surrounding the three iron/steelworks located in southern Poland and northern Moravia (Czech Republic) (Figure 1). Details of the tested samples are summarized in Table 1. The first sampling area (IW-1) was located in the forest complex which is approximately 5.5 km to the northeast of the Třinec ironworks and approximately 20 km to the northwest of the Dětmarovice power plant. The Třinec iron plant is the biggest steel mill in the Czech Republic, which began its operation in 1839, with the production of foundry pig iron in the charcoal blast furnace, thereby becoming the largest in the areas of Cieszyn Silesia. In the 1920s, the plant was one of the most up-to-date, integrated steelmakers in Central Europe during the Second World War, and its technology has been oriented toward processing the steel produced mainly in oxygen converters to form a wide range of long rolled products.
The second sampling area (IW-2) was located in the forest complex, approximately 2 km to the northeast of the Ostrowiec ironworks. This plant, which also began its operation in 1839, is located in Central Poland, in the city Ostrowiec Świętokrzyski (Holy Cross Province). In the interwar period, the plant produced railway wagons, pipes, parts for ravines, cars, tanks, cannons, and other steel structures. Currently, the Ostrowiec ironworks involve a casting melt shop, rolling mill of bars, and rolling mill of profile and forged products division equipped with melt shop and modern machines producing finished products by mechanical and thermal treatment.
The last study area (IW-3) was also located in the forest complex, approximately 3 km to the northeast of the Katowice ironwork and nearby Coking Plant Przyjaźń. “Katowice Steelworks” is located in southern Poland, in the city Dąbrowa Górnicza (Silesian Province), which is approximately 20 km to the northeast of Katowice city, located on the boundary between the historical provinces of Lesser Poland and Upper Silesia. The first unit of the steel plant was opened in 1975 as “Katowice Steelworks.” At present, at the ArcelorMittal Poland, the steelwork is equipped with three blast furnaces, two rolling mills, three continuous steel casting lines, and its own heat and power plant. In Poland, it is the primary steelwork producing tram and rail rails.

2.1.2. Collection and Preparation of Topsoil Material

The study samples were randomly collected from the uppermost 30 cm of forest soil nearby iron/steelworks, using a HUMAX SH 300 sampler equipped with plastic tubes (35 mm in diameter). The vertical distribution of volume magnetic susceptibility (κ) was measured in the laboratory of the Institute of Environmental Engineering (IEE), Polish Academy of Sciences (PAS) in Zabrze (Poland), using a MS2C Bartington sensor with a resolution of 1 cm. Regardless of the sampling site, the vertical distribution of κ was similar with the highest values within the uppermost 10 cm and strong decrease in κ in the deeper part of the core. Such distribution of magnetic susceptibility is typical for profiles strongly affected by TMP, which accumulate mainly in the uppermost layer of soil (see Supplementary Figure S1). Each soil core was cut with a ceramic knife, and the soil material (named as the topsoil sample) obtained from the layers exhibiting the highest κ value was used for subsequent magnetic measurements. The collection of topsoil consisted of 44 samples, 15 samples from IW-1, 13 samples from IW-2, and 16 samples from IW-3. Each soil ore was cut with a ceramic knife, and the soil material (named as the topsoil sample) obtained from the layers exhibiting the highest κ value was used for subsequent magnetic measurements. The collection of topsoil consisted of 44 samples, 15 samples from IW-1, 13 samples from IW-2, and 16 samples from IW-3.
The topsoil samples were dried at a temperature of 40 °C, sieved through a 2 mm sieve, and about 100 g of material was placed into coded self-sealing polythene bags. Each homogenized sample was divided into two subsamples: the first material was studied in the laboratory at the IEE, PAS in Zabrze (Poland), and the second was studied in the paleomagnetic and environmental magnetism laboratory at the Institute of Geophysics, PAS in Warsaw (Poland).

2.2. Street Dust

2.2.1. Sampling Area

The street dust was sampled in Warsaw, which is the largest city in Poland (517. 24 km2) having a population of approximately 2.070 million and an average density of 4003 inhabitants/km2 [48]. The town is situated on the Vistula River in the lowlands (78–112 m a.s.l.) of the Masovia region in Poland. The city is highly urbanized and has a dense network of high-traffic rail and roads. The highest number of cars in Poland is in Warsaw, approximately 673 cars/1000 inhabitants. The sampling site is a built-up area and represents a typical urban, slightly industrialized location characterized by high intensity traffic. However, there are a few point sources including Siekierki and Żerań power and heating plants. Siekierki power plant is the largest heat- and power-generating plant in Poland and the second-largest plant of this type in Europe with a thermal power capacity of 2078 MW and an electrical power capacity of 620 MW [49].

2.2.2. Collection and Preparation of Street Dust Material

Street dust was collected from 70 sampling sites in the Warsaw urban area, which were selected specifically to represent a significant density of motor traffic on a transit road with modern infrastructure. The samples were gathered on rainless days during June–July 2013. Dust was collected from an area measuring about 1 m2 of the road surface using a clean plastic brush and dustpan, and the sampling sites were geolocalized using a handheld Global Positioning System. For each site, about 500 g of dust was collected, placed into coded self-sealing polythene bags, and transported to the laboratory. Samples were naturally air-dried at room temperature and then sieved through a 1 mm mesh to remove waste and small stones. The details of the location of sampling sites and other procedures used for the preparation of street dust from Warsaw are provided in another paper [28].

2.3. Particulate Matter

2.3.1. Sampling Area

PM was collected at only one site in Warsaw. The sampling site is located in IG, PAS, at approximately 5 km from the city center, in a busy street with tramways and buses not far from the highway but close to the large park.

2.3.2. Collection and Preparation of PM

PM with a particle diameter of <10 μm was collected on glass filters by the low-volume air sampler PNS-15 (Atmoservice, Poznań, Poland) operating from December 2018 to April 2019. The collection involved 28 filters. PM was collected on each filter for 72 h (3 days) with an effective air-flow volume of 2.32 m3/h. The sampler consisted of automatic changer of filters with cartridge containing 15 filters covering 45 days of measurements. Moreover, the air sampler automatically measured the 3-day average of the meteorological parameters: average temperature and humidity. According to our laboratory procedure, before being placed in cartridge, the clean filters were dried in a desiccator for 7 days and were weighted. When the PM was completely accumulated on the last filter in the cartridge, the cartridge was transported to the laboratory. Each filter was separately placed in the protective envelopes, labeled, and then stabilized/conditioned in a desiccator for 7 days. The mass of PM was calculated by subtracting the mass of the clean filter from the mass of the filter with PM. The mass of filters was measured twice using a laboratory scale (MYA 4Y.F PLUS microbalance, Radwag, Poland) at an accuracy of 1 μg.

2.4. Description of Magnetic Methods

2.4.1. Magnetic Susceptibility (χ), Anhysteretic Remanent Susceptibility (χARM), and S-ratio

Low-field mass-specific magnetic susceptibility (χ) describes the ability of materials to change their magnetization when influenced by the external magnetic field. It depends on the concentration of magnetic particles, their mineralogy, and the grain size [50]. In environmental studies, mass-specific magnetic susceptibility is used as a proxy of the concentration of anthropogenic magnetic particles with ferro-, ferri-, and antiferromagnetic properties. The low-field volume magnetic susceptibility of the topsoil samples was measured at a frequency of 470 Hz, using dual-frequency MS2B Bartington sensor. Subsequently, mass-specific magnetic susceptibility was calculated by normalizing volume magnetic susceptibility on the sample mass. The low-field volume magnetic susceptibility of street dust and filters with PM was measured at a frequency of 976 Hz with a sensitivity of 2 × 10⁻⁸ SI at a magnetic field (H) intensity of 200 A/m using the multifunction Kappabridge MFK1-FA (AGICO, Brno, Czech Republic). For street dust, each measurement was repeated three times the calculated average value of κ. According to the procedure developed at the IG, PAS in Warsaw (Poland), the measurement of magnetic susceptibility of PM filters is always repeated ten times for one filter to obtain good statistics and a relatively low measurement error (usually less than 1%). In these studies, the average value of κ was calculated for each filter.
ARM was achieved at 100 mT of alternating current magnetic field and 100 μT of direct current (DC) magnetic field using LDA-3 (AGICO) and was measured by SQUID magnetometer (2G Enterprises, Sunnyvale, CA, USA). The values of χARM were calculated by dividing ARM by the value of the DC bias magnetic field H = 79.62 A/m.
S-ratio is used to quantify the relatively large variations of high-coercivity “hard” remanence to low-coercivity, “soft” remanence minerals [50,51,52]. The procedure for measuring this parameter consists of two steps. Firstly, the sample was exposed to the forward direction of a high magnetic field of about 7 T to achieve the saturation isothermal remanent magnetization (SIRM). In the second step, a back-field of −300 mT was applied to reverse the isothermal remanent magnetization (IRM−300mT) contributed by magnetite and/or maghemite. S-ratio is calculated by dividing the value of the −IRM−300mT by SIRM [52]. Its value close to unity indicates a predominance of low-coercivity minerals, such as magnetite and/or maghemite. On the other hand, an S-ratio of zero or its negative values shows a significant contribution of high-coercivity minerals such as hematite and/or goethite [52]. SIRM and IRM−300mT were achieved using MMPM-10 pulse magnetizer (Magnetic Measurements LTD, Aughton, UK) and measured by a SQUID magnetometer.

2.4.2. Hysteresis Loops

Hysteresis parameters and ratios can be used to determine the mineralogy and concentration of magnetic minerals and the dominant magnetic grain size expressed by the domain state [53]. For the samples of topsoil and street dust, the measurements were made at IG, PAS in Warsaw (Poland) using alternating gradient magnetometer (MicroMag AGM 2900, Princeton Measurement Corporation, Princeton, NJ, USA) operating at the maximum magnetic field of 1 T. For PM, the hysteresis loops were measured at Istituto Nazionale di Geofisica e Vulcanologia (INGV) in Rome (Italy) using a vibrating sample magnetometer (MicroMag VSM 3900, Princeton Measurement Corporation, Princeton, NJ, USA). The saturation magnetization (Ms), saturation remanence (Mrs), and coercive field (Bc) were determined from the hysteresis loops after subtracting the high-field linear trend. The coercivity of remanence (Bcr) was determined from the curve of DC back-field demagnetization after applying a saturation IRM. The Ms and Mrs values, which are concentration-dependent, were normalized on the sample mass.

2.4.3. IRM(B) Acquisition Curves and Component Analysis

IRM(B) curves were acquired stepwise up to the magnetic field of 1 T using an alternating gradient magnetometer (MicroMag AGM 2900, Princeton Measurement Corporation, Princeton, NJ, USA). Furthermore, the measured IRM curves were analyzed following the cumulative log-Gaussian functions for statistical analysis according to Kruiver et al. [54]. Three parameters describe the magnetic components obtained from the statistical analysis: SIRM proportional to the mineral content in the sample, the mean coercivity (B1/2) at which half of the SIRM is reached, and the dispersion parameter (DP) corresponding to the individual cumulative log-normal distribution.

2.4.4. FORC Diagrams

In addition to the hysteresis loops, the FORC of selected topsoil samples were measured using an alternating gradient magnetometer (MicroMag AGM 2900, Princeton Measurement Corporation, Princeton, NJ, USA). These measurements were done in steps of 2.0 mT, with an averaging time of 150 ms and a saturation field of 0.5 T [46]. Moreover, FORC diagrams for street dust and PM were measured using VSM at INGV in Rome (Italy) with the same settings. The diagrams were processed, smoothened, and drawn using FORCINEL software [55,56].

2.4.5. Thermomagnetic Curves of κ(T)

The temperature changes of the magnetic susceptibility—κ(T) curve—were measured for identifying the magnetic minerals of the studied samples. The κ(T) curve for topsoil was measured in an argon atmosphere using Multifunction MFK1 Kappabridge (AGICO, Brno, Czech Republic) equipped with a CS-4 high-temperature furnace over the temperature range of 30–700 °C. The κ(T) curves for steed dust and PM were measured in an air atmosphere at a heating rate of 11 °C/min using KLY-3 Kappabridge (AGICO, Brno, Czech Republic) coupled with a CS-3 high-temperature furnace over the temperature range of 30–700 °C. The magnetic phases were determined by estimating the Curie temperature (TC) for ferromagnetic and ferrimagnetic phases or Neél temperature (TN) for antiferromagnetic phases. The Curie temperature was estimated by the differential method based on the maximum curvature in the thermomagnetic curve [57].

2.4.6. Thermomagnetic Curves of SIRM(T)

Two thermomagnetic curves of SIRM(T) were measured for selected samples. The first curve was measured for the SIRM imparted along the z-axis of the sample, in a 7 T DC magnetic field, which is high enough to saturate the hardest magnetic minerals. For the second curve, the sample was saturated along the z-axis, in a 7 T DC magnetic field, and subsequently, it was demagnetized along three orthogonal axes with a maximum alternating field peak of 40 mT. This procedure eliminated the low-coercivity magnetic phases dominating the sample and eventually revealed the high-coercivity phases contributing to the SIRM. The SIRM(T) curves were measured in a zero magnetic field by heating in air to 750 °C and cooling to room temperature using a device built by Electronics Warsaw (TUS), Poland. The components of remanence related to the magnetic phases were identified by their unblocking temperature (Tub) [58].

3. Results

3.1. Magnetic Mineralogy

3.1.1. Identification of Magnetic Minerals in Topsoil Polluted by Technogenic Particles Emitted by the Ironworks

The mineralogy of TMP accumulated in the topsoil nearby the ironworks was determined by the estimated Curie point (TC) from the high-temperature curves of κ(T). The curves were measured for all topsoil samples, representative curves for topsoil samples collected in the area affected by each ironwork (16 samples from IW-1, 22 from IW-2, and 33 from IW-3) are shown in Figure 2a,c,e. All the curves displayed a similar trend, with a very slow rise in the range of 30–260 °C, followed by a wide peak near 500 °C. The Curie point approached at 570–590 °C indicating the presence of a magnetite-like phase with TC = 580 °C [59]. The wide peak before TC can be interpreted as a Hopkinson-like peak. According to Muxworthy et al. [60], such a wide Hopkinson peak suggests a wide grain size distribution of fine particles of various minerals. At 600 °C, κ was reduced to zero indicating the paramagnetic phase of magnetite. The other magnetic phases with a Curie temperature above 600 °C, such as maghemite (TC = 645 °C) or hematite (TC = 675 °C), did not appear in the heating curves of κ(T). During cooling below 600 °C, magnetic susceptibility increased above those values obtained from the heating curve, which is a typical feature indicating the presence of new magnetite formed from magnetically weak minerals during heating.
The curves of κ(T) revealed magnetite as the major magnetic phase in all topsoil samples. If the highly magnetic phase is dominant in the samples, it is almost impossible to observe the relatively low contribution of weak magnetic phases (e.g., hematite) on κ(T). Hence, additional SIRM(T) thermal decomposition curves were measured following an experimental procedure (described in Section 2.4.6) that eliminated most of the low-coercivity components from the sample. The normalized SIRM(T) curves for selected topsoil samples (16, 22, and 33) are shown in Figure 2b,d,f. The first curve (black) was measured for samples saturated along the z-axis and represents all the remanence-carrying phases. The second one (red) reveals the contribution of high-coercivity and/or other magnetic phases after partial demagnetization of the sample. For all samples, the first SIRM(T) curves displayed the remanence-carrying component of SIRM unblocked in the temperature range of 580–590 °C, which is characteristic of magnetite. The second curves of samples revealed the remanence-carrying component that is saturated in a high magnetic field. The unblocking temperature value of this component (Tub ~680 °C) indicates the presence of hematite-like phase. However, for sample 22 (Figure 2d), the signal in the second curve was almost two times weaker than that of samples 16 and 33, which showed the relatively low contribution of high-coercivity phases.
The contribution of magnetic mineral phases in the topsoil samples was assessed by the decomposition of IRM acquisition curves [54]. The results of the IRM component are listed in Table S1, average values are presented in Table 2, and linear acquisition plots and gradient acquisition plots for a representative topsoil sample taken from each area affected by ironworks (IW-1: sample 16, IW-2: sample 22, and IW-3: sample 33) are shown in Figure 3. Two distinct magnetic components with variable contributions to the total IRM were identified in the topsoil samples from Ostrowiec (IW-2) and Katowice (IW-3) ironworks. In the topsoil from Třinec (IW-1) ironwork, the number of fitted components was higher, equal to three. At all ironworks, component 1 had a mean coercivity (B1/2) between 40 and 60 mT and a quite narrow DP range of 0.3–0.35 mT, and showed the highest contribution to the IRM (usually >80%, Supplementary Table S1). This component can be interpreted as magnetite. Component 2 was characterized by a high coercivity with a wide range of coercivity spectra and DP (B1/2~0.1–1.4 T; DP~0.4–0.9 mT). Generally, the contribution of component 2, identified as hematite, did not exceed 10% for Ostrowiec ironwork and 18% in the remaining two smelters. The third component, observed in all samples from Třinec, exhibited the lowest B1/2 values <20 mT and a narrow DP (0.12–0.20 mT) (Supplementary Table S1). This extremely soft component whose input did not exceed 10% could be either maghemite (defected magnetite) or coarse-grained magnetite.

3.1.2. Identification of Magnetic Minerals in Street Dust

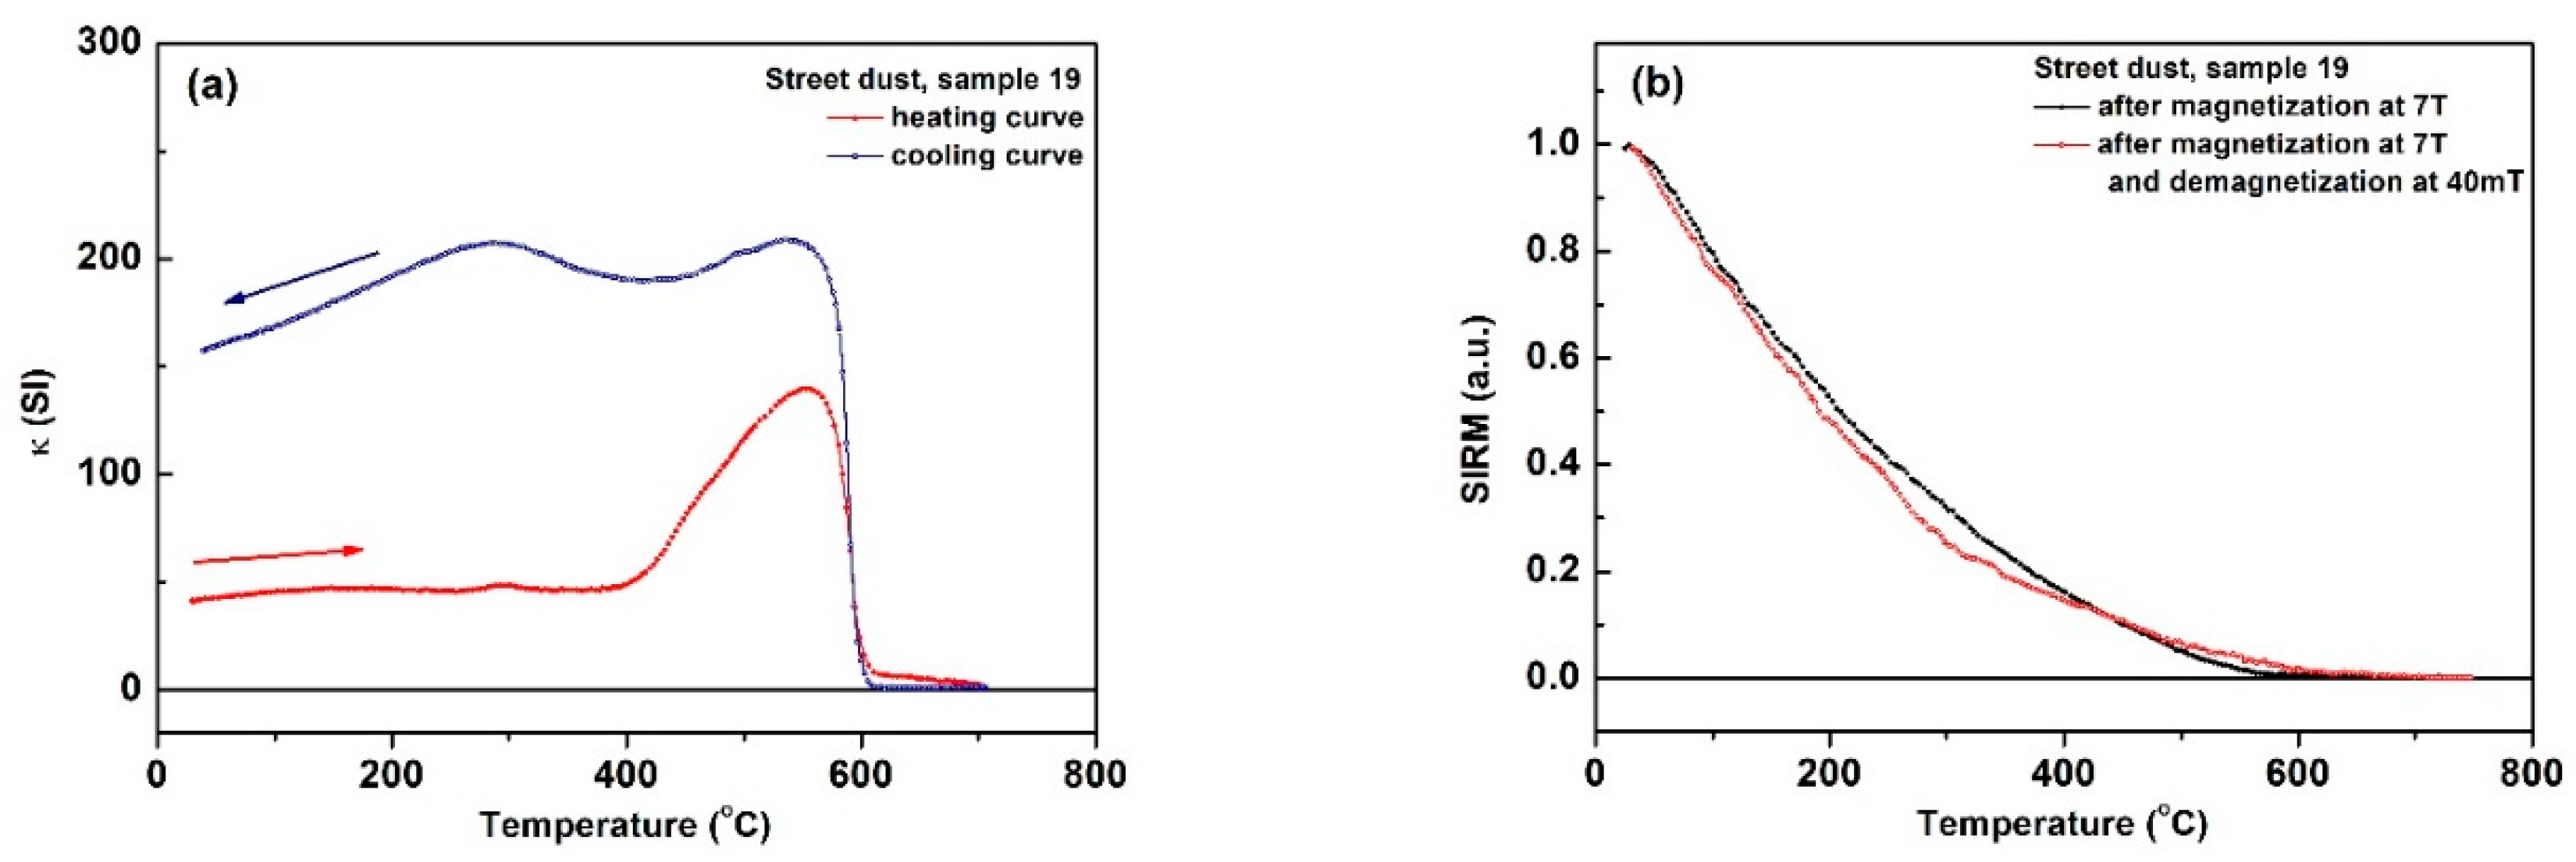
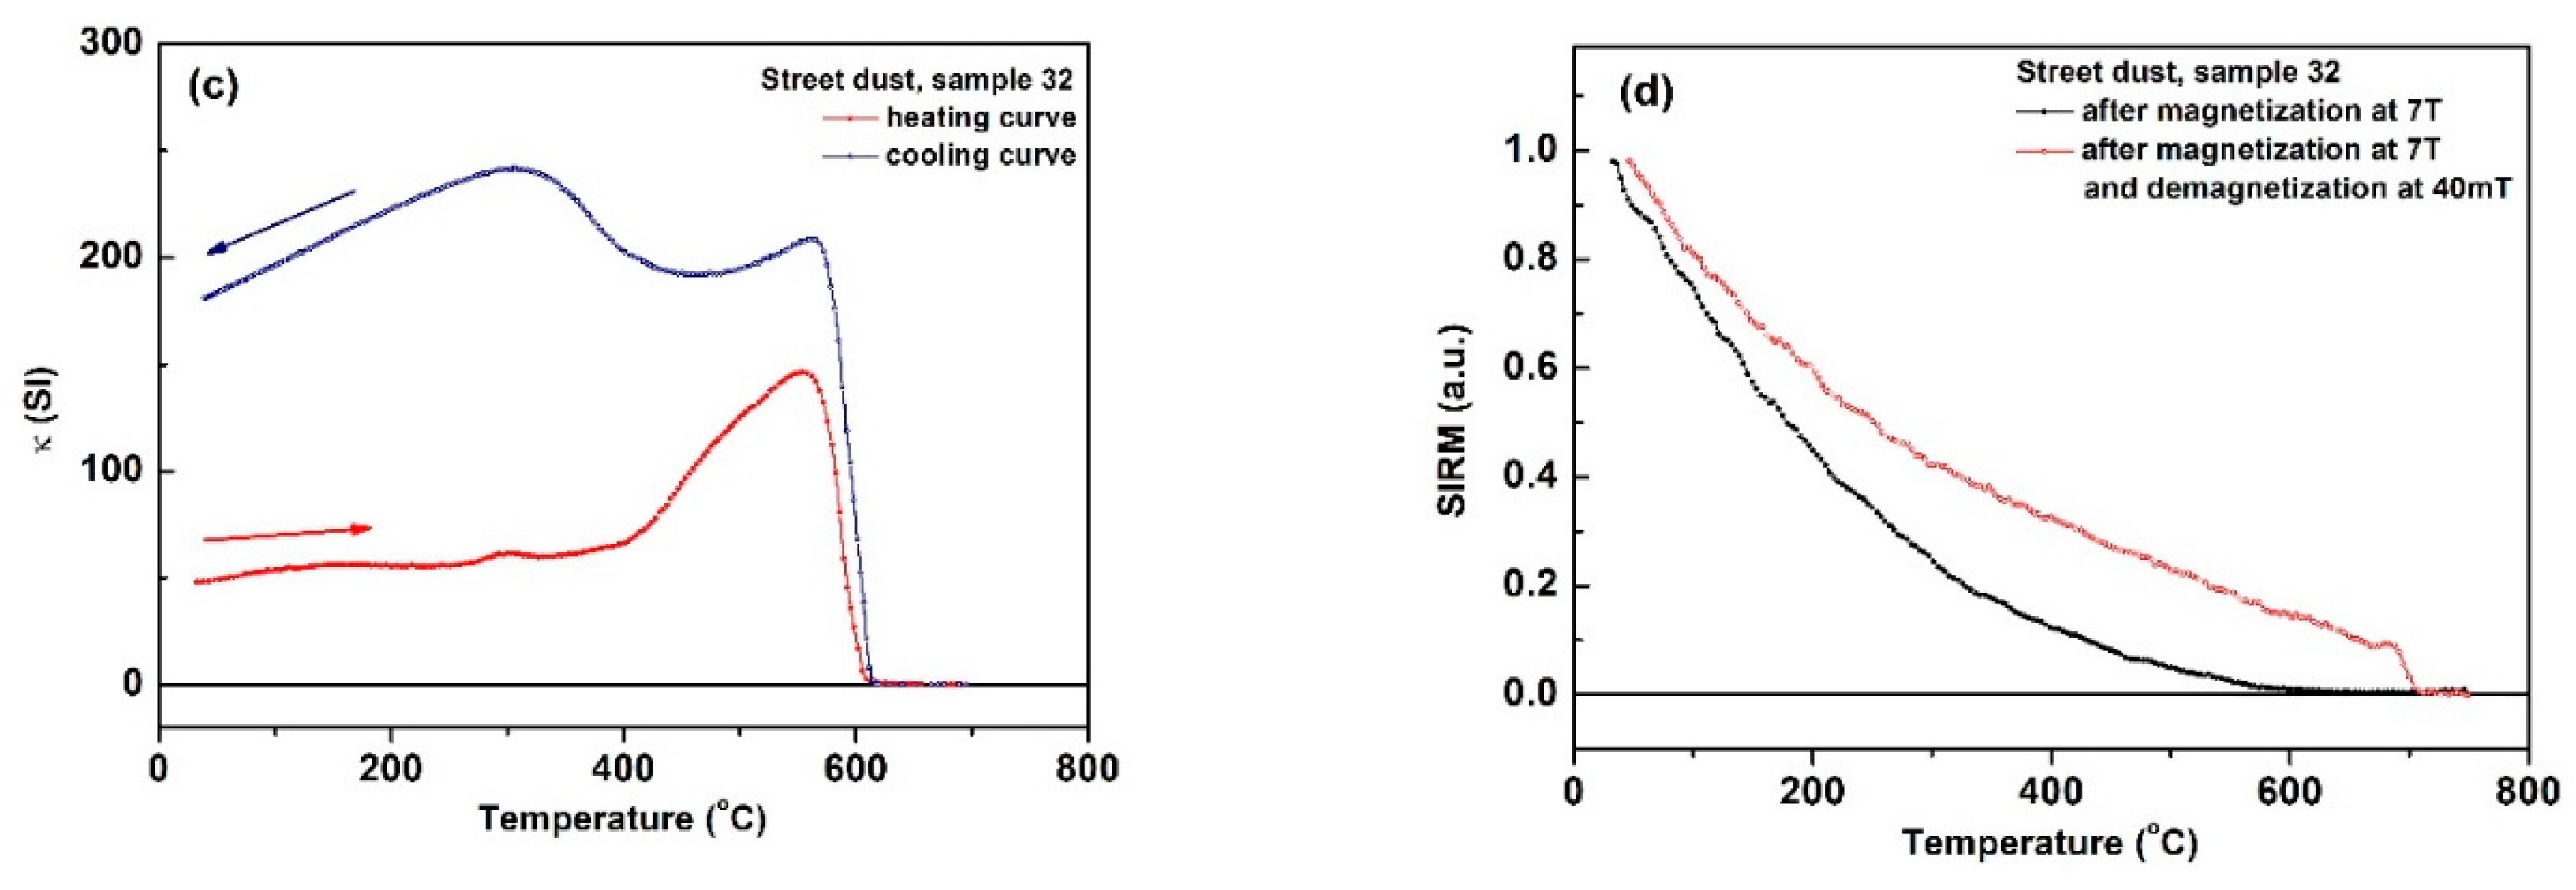
Two distinctive behaviors of thermomagnetic curves of κ(T) and SIRM(T) were observed for street dust, the first is represented by sample 19 (Figure 4a,b), while the second by sample 32 (Figure 4c,d). The Curie temperature of ~580 °C detected on the κ(T) (Figure 4a,c) indicates that magnetite is the dominant magnetic phase in the street dust. Meanwhile, a continuous decrease of magnetic susceptibility up to 700 °C for sample 19 can be observed, suggesting the presence of a high-temperature magnetic phase. According to previous studies on the magnetic mineralogy of street dust from Warsaw [27,28], this tail on the curve of κ(T) between 600 and 700 °C indicates the presence of metallic iron, which exhibits a Curie temperature of 780 °C [50,60,61,62]. The heating curve of κ(T) for sample 32 does not show metallic Fe as the value of κ above the TC for magnetite is almost zero. The cooling curves of κ(T) run above the heating ones indicating the formation of new magnetite during heating.
The SIRM curves of street dust exhibit two different behaviors. For sample 19 (Figure 4b), the first heating curve of the SIRM (acquired at 7 T) is totally thermally demagnetized at an unblocking temperature of ~580 °C, corresponding to magnetite. The second curve represents the SIRM(T) for the component with a higher coercivity than 40 mT that demagnetized just above 600 °C. For sample 32 (Figure 4d), the first heating curve of SIRM(T) confirms the prominence of magnetite in street dust, but the second curve indicates the presence of a high-coercivity phase with Tub ~690 °C, which can be identified as hematite. If the sample is dominated by magnetite with significant magnetic properties, the presence of hematite (in a relatively low amount) is not detected on the curves of κ(T). In this case, the presence of hematite is obscured by the much higher magnetic susceptibility of the magnetite.
Based on the modeling of the IRM decomposition curves, the street dust samples can be divided into two groups. For most of these samples, single-component distribution (Supplemantary Table S1, Figure 5a,b) with the mean coercivity ranging between 40 and 60 mT is proposed due to small contribution (usually <4%) of the hard magnetic fraction which percentage contribution is in the range of statistical error. For those samples, the hypothesis that the identified soft components can be further decomposed to two more components with a similar coercivity range cannot be excluded (Supplementary Table S1 and Figure S2) [31]. The second group, consisting of seven street dust samples, showed a higher contribution of the hard fraction (>4%, four of them >10%) with a mean coercivity in the range of 250–300 mT (Figure 5c,d, Supplementary Table S1). These samples remained unsaturated at a given field of 1 T used in the experiment.

3.1.3. Identification of Magnetic Minerals in PM

The high-temperature curve of κ(T) for PM10 displays behavior similar to that of the curves for topsoil and street dust, with a weak peak at ~500 °C, before decreasing sharply in the range of 570–600 °C (Figure 6). Above 600 °C, κ remains constant, almost close to zero. The estimated TC indicates the presence of magnetite as the dominant magnetic phase in PM10. During cooling, the curve displays a magnetic phase with TC ~585 °C, indicating the presence of the newly formed magnetite. The behavior of the cooling curve is similar to that of the curves for topsoils and street dust with the formation of new magnetite during heating. Due to the very low mass of dust on the filter (usually a few milligrams), the SIRM signal was very weak and rather noisy, and the SIRM(T) curves were not measurable.
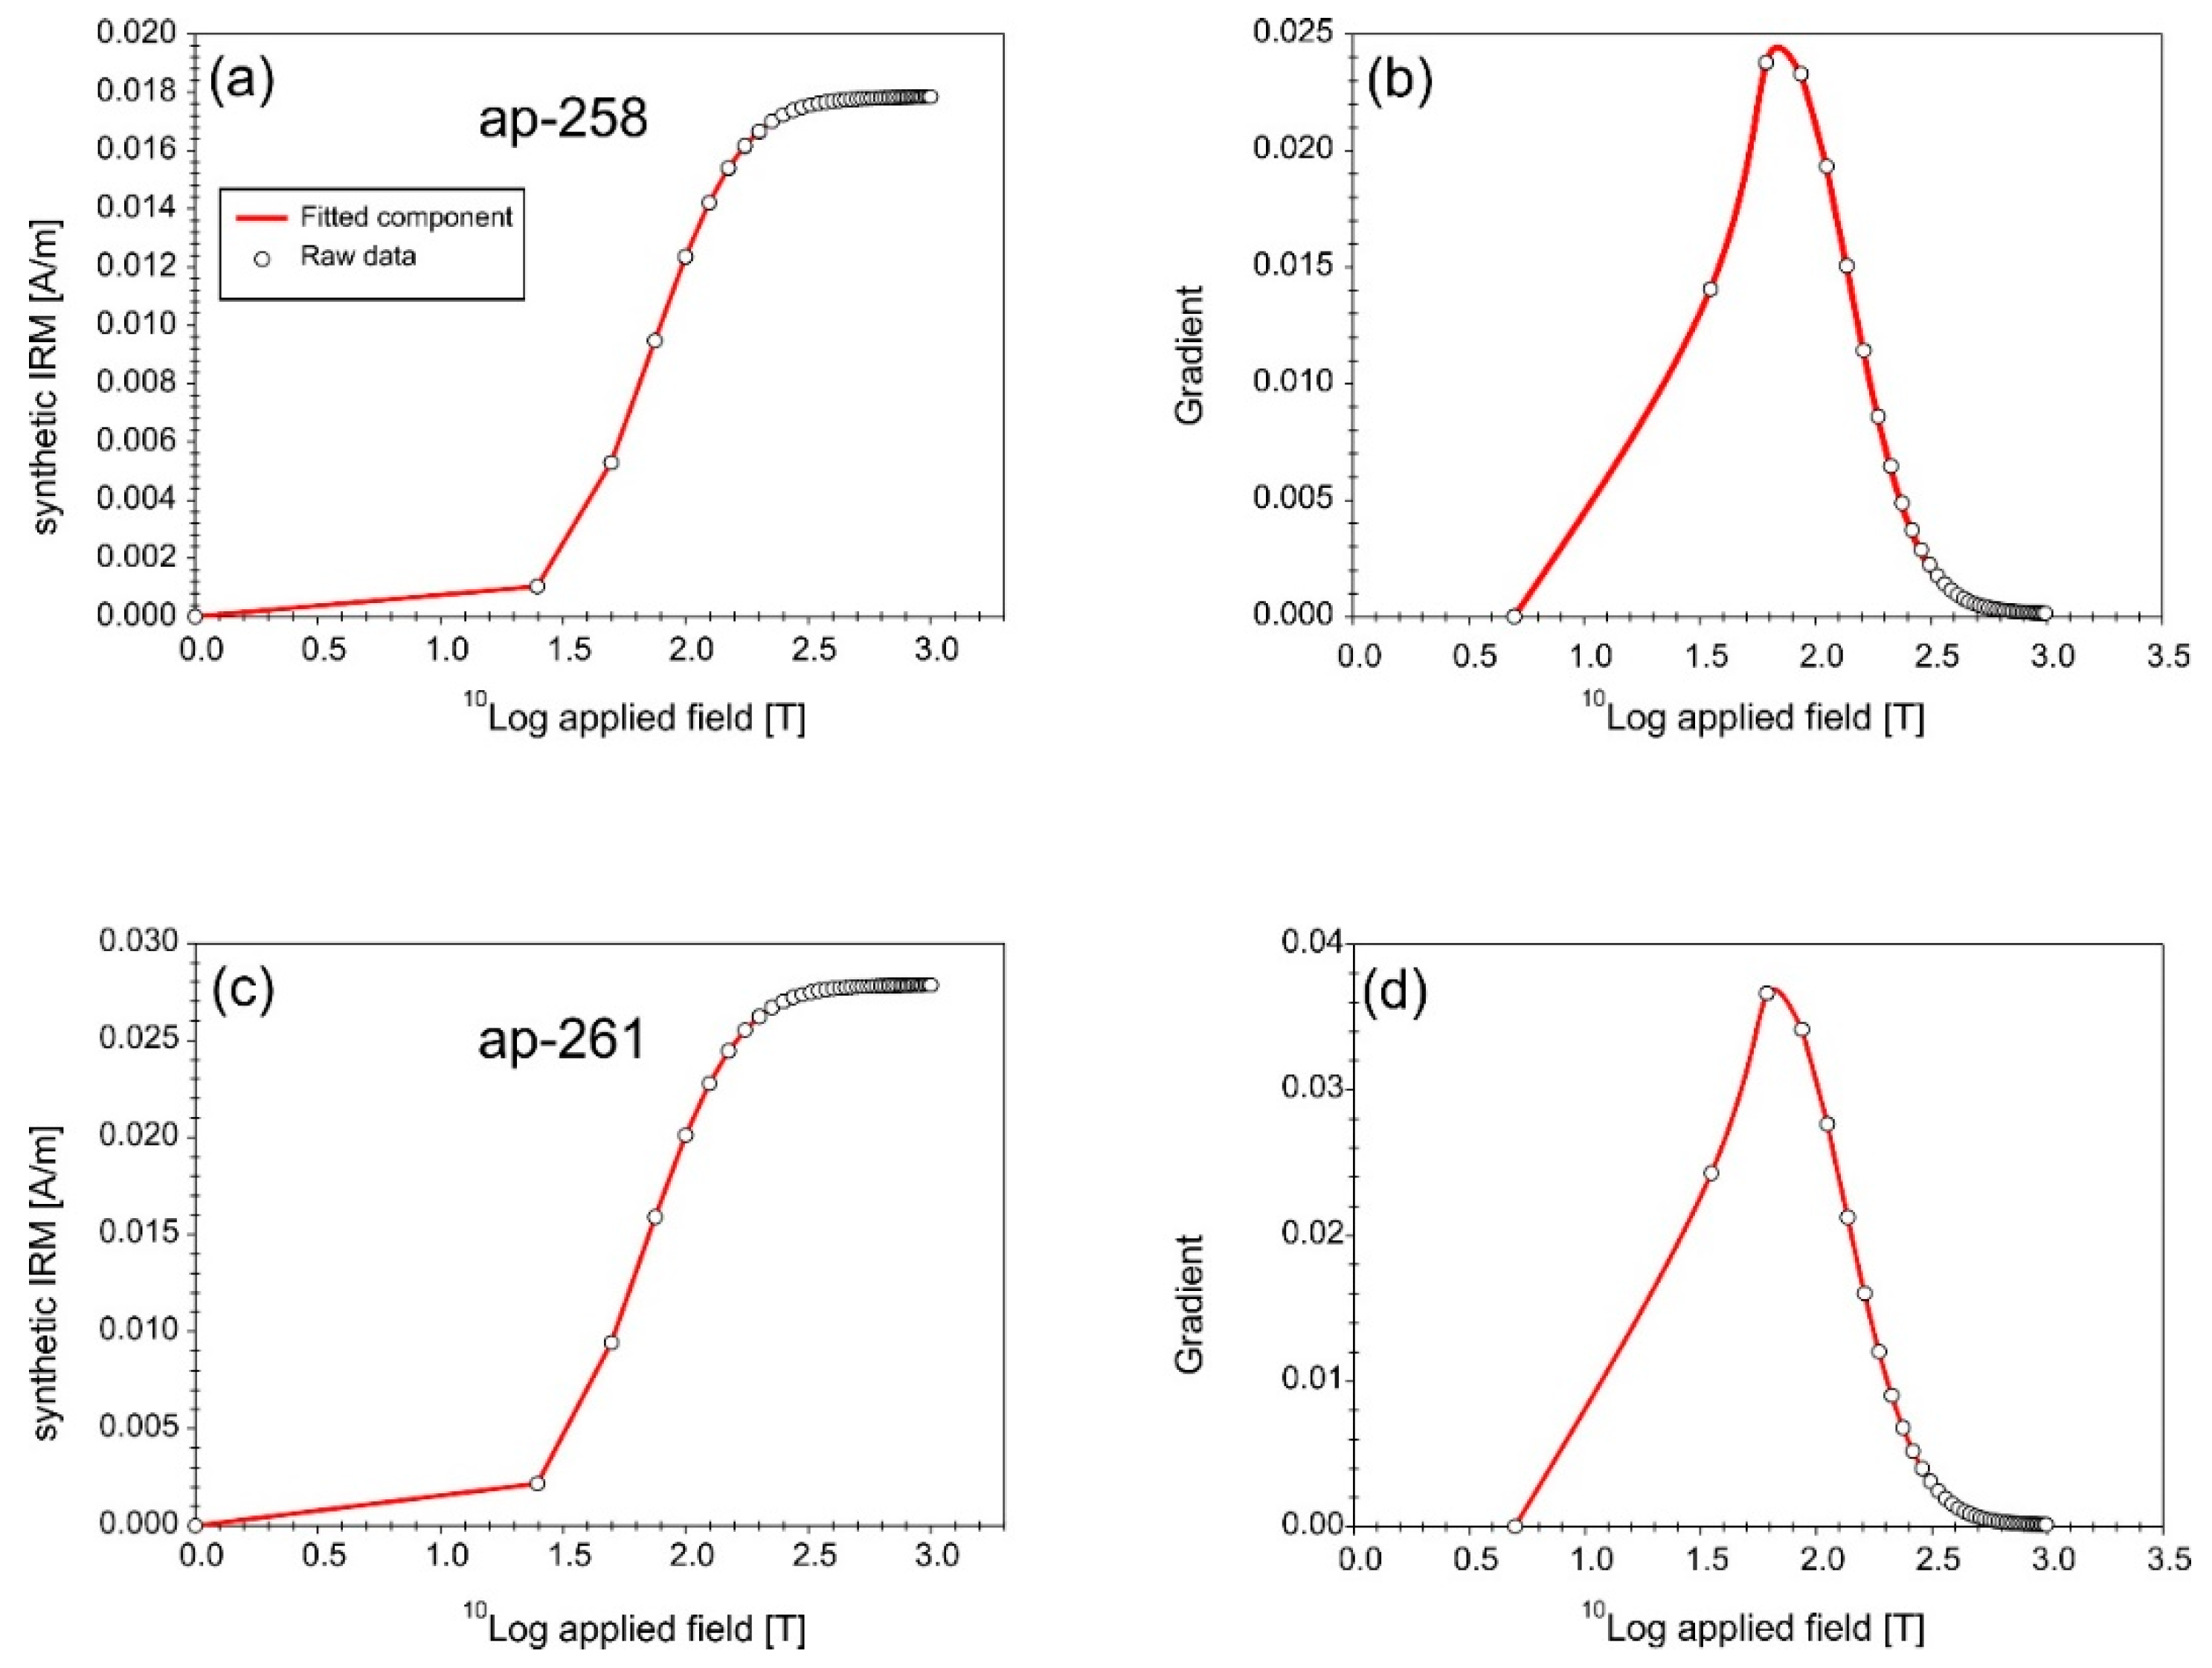
For PM10 accumulated on filters, single-component distribution is favored (Figure 7, Supplementary Table S1) with a mean coercivity of 65–70 mT. This soft component is most likely magnetite. Considering the possible statistical error, all fittings having <4% contribution of other components were treated as one-component fit.

3.2. Magnetic Properties and Grain Size Analyses

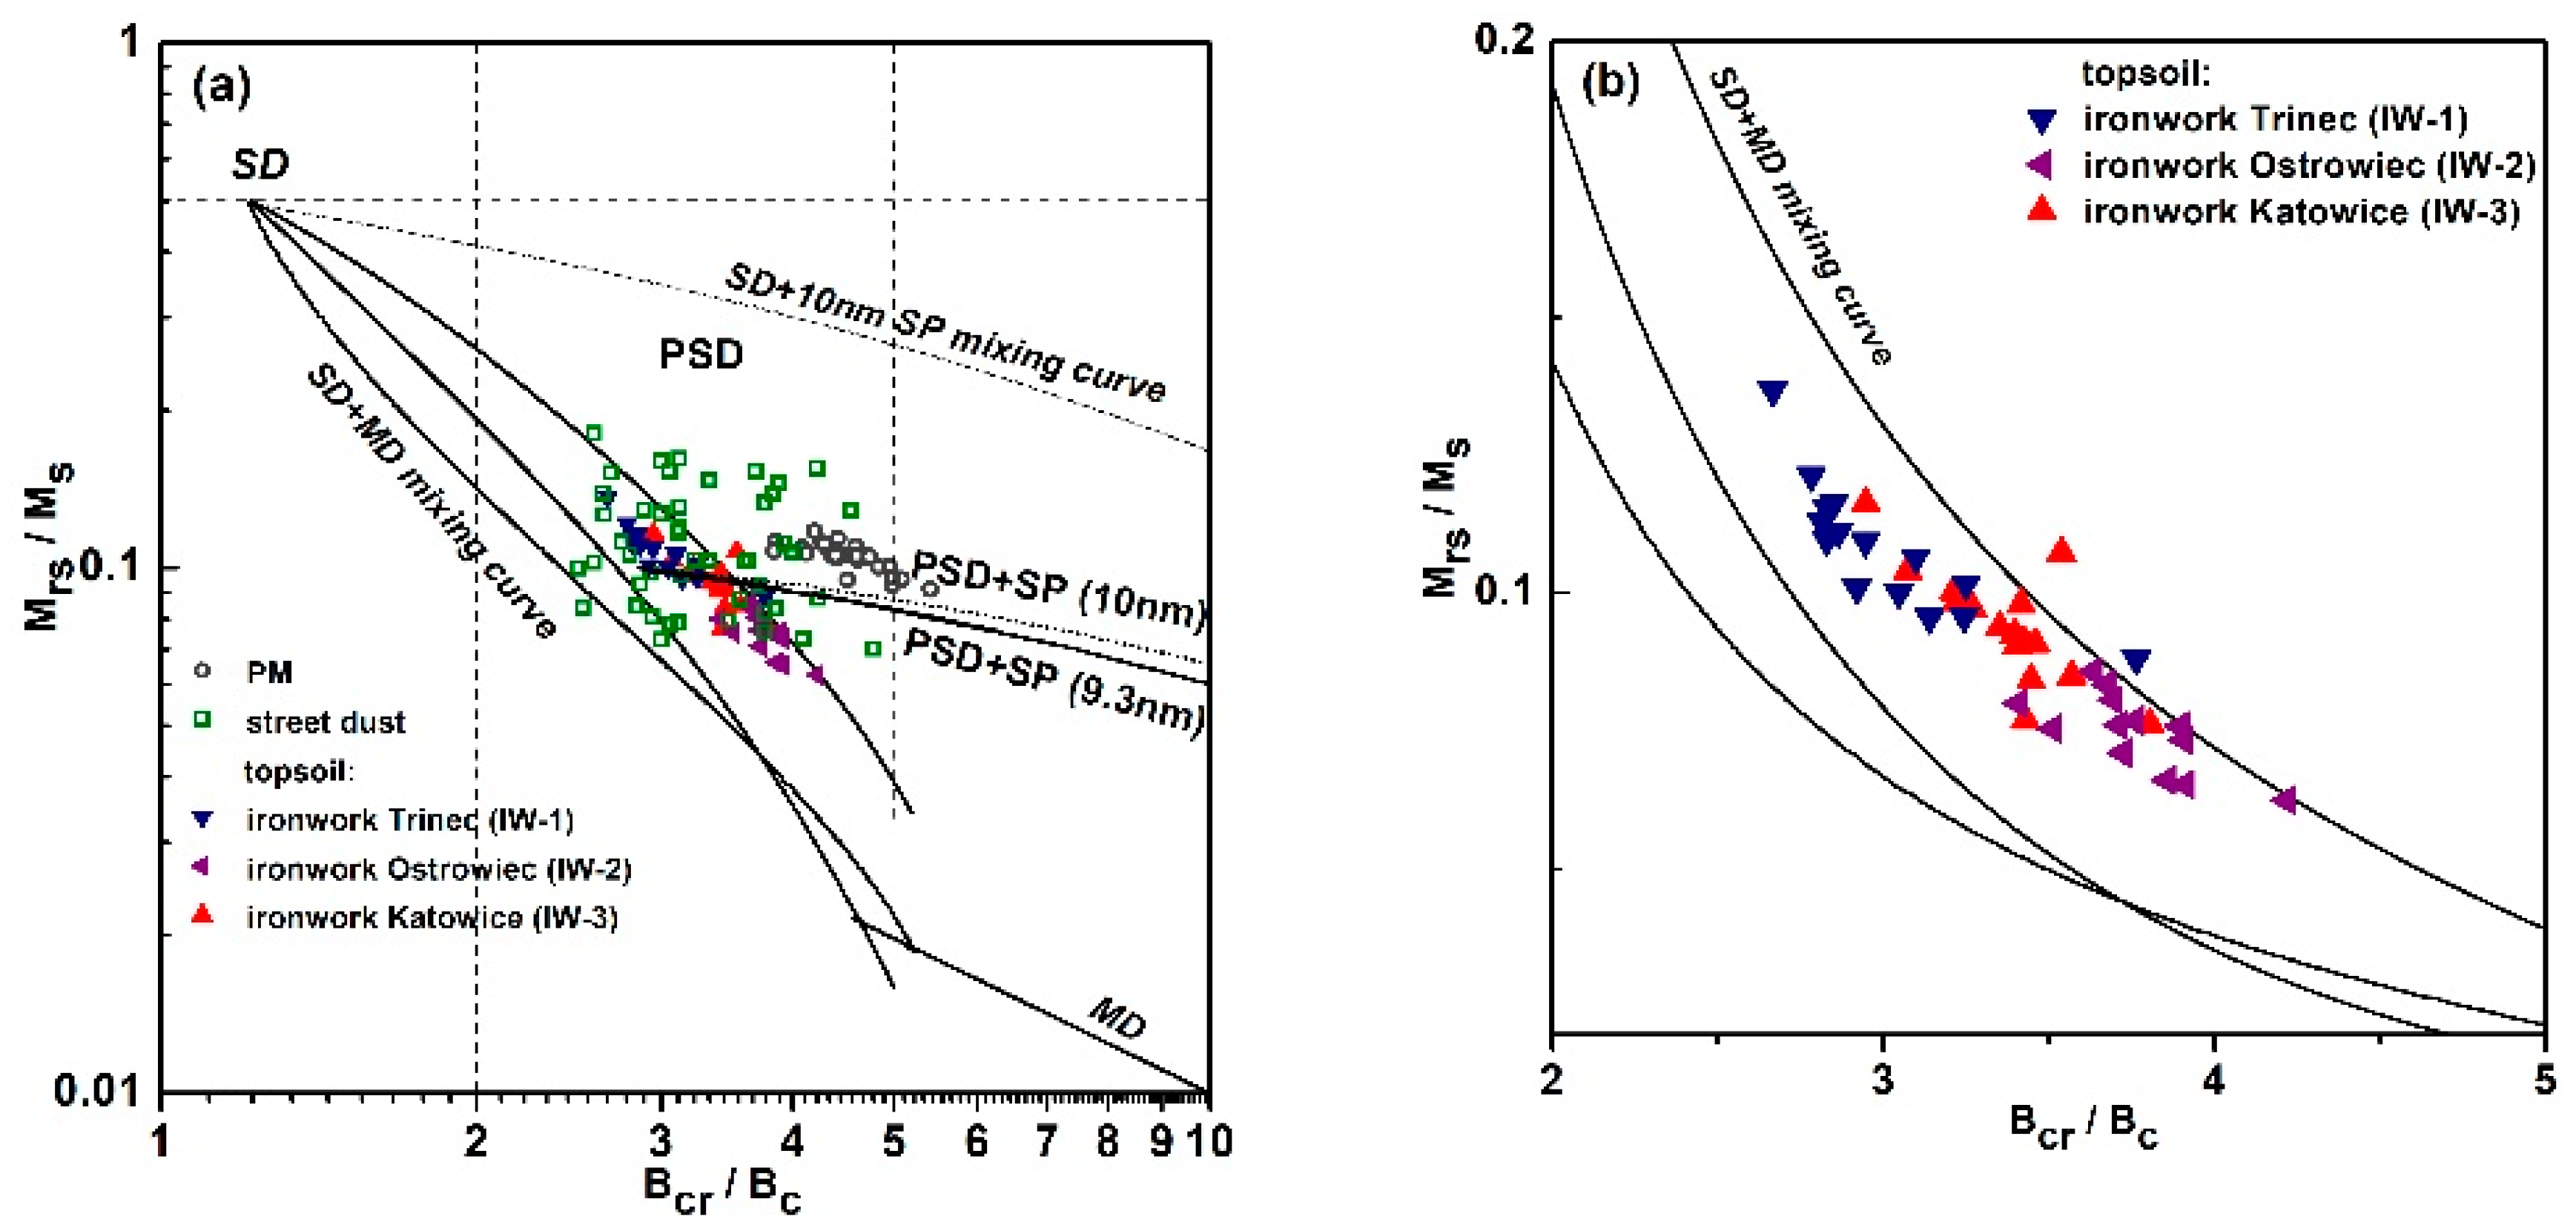
The relative grain size distribution can be determined based on the ratios of hysteresis parameters and their biplots. The Day diagram [42] modified by Dunlop [43,44] is a tool used for the rapid determination of domain state by plotting Mrs/Ms against Bcr/Bc and referring to theoretical magnetite. Supplementary Table S2 presents the values of the hysteresis parameters and Mrs/Ms Bcr/Bc ratios used in the Day–Dunlop diagram (Figure 8a,b) for topsoil, PM, and street dust samples. The topsoil samples from individual ironworks are distributed along three clusters in the SD + MD mixing curve for magnetite. The concentration of SD particles, with respect to MD coarser grains, is apparently the highest for the TMP produced by Třinec ironworks (IW-1) and respectively decreases for IW-3 and IW-2 (Figure 8b).
The position of PM samples in the Day–Dunlop diagram (Figure 8a) is different from that of the topsoil samples. Their points are distributed in a relatively narrow Bcr/Bc range of 3.84–5.41 and Mrs/Ms range of 0.09–0.12. They are placed along the mixing curve of pseudo-SD (PSD) grains with ultrafine 10 nm superparamagnetic (SP) particles. The magnetic fraction of street dust is indicated in the central part of the plot, in PSD area, being characterized by a relatively wide range of Mrs/Ms and Bcr/Bc ratios. The grain size distribution of the magnetic particles from the street dust is very diverse, which is probably due to the presence of MD and SD grains in variable proportions, with a possible further contribution from the ultrafine SP grains.
The mass-specific magnetic susceptibility of the studied samples (Supplementary Table S2) ranged as follows: 72–518 × 10−8 m3/kg (mean value = 214 × 10−8 m3/kg) for street dust, 157–2143 × 10−8 m3/kg (mean value = 736 × 10−8 m3/kg) for PM, and 191–304 × 10−8 m3/kg (mean value = 238 × 10−8 m3/kg) for topsoil IW-1, 77–331 × 10−8 m3/kg (mean value = 211 × 10−8 m3/kg) for topsoil IW-2, and 96–190 × 10−8 m3/kg (mean value = 150 × 10−8 m3/kg) for topsoil IW-3.
Since Mrs/Ms (squareness, [57]) can be interpreted due to either magnetic mineralogy or magnetic grain size, it could be a useful parameter for qualitatively assessing the magnetic mineralogy if combined with Bcr or Bc [50]. For the topsoil and PM samples, the values of coercivity are in the narrow range of 7–11 mT, typical of soft magnetic minerals such as magnetite (Figure 9a). For some street dust samples, the values of Bc (3–15 mT) may indicate the presence of both softer and harder magnetic fractions compared to PM and topsoil. It is evident, from the position of all samples, that Mrs/Ms ratios increase with increasing coercivity. The coercivity of remanence for all the samples varies in a relatively wide range between 15 and 55 mT (Figure 9b). Bcr is independent of the concentration of magnetic minerals and can be used to identify the magnetic mineralogy and particle size variations. Mrs/Ms varies between 0.036 and 0.333, which, together with Bcr values, indicates the similar mineral composition of street dust dominated by soft magnetic mineral components. The PM samples are characterized by narrow Mrs/Ms ratios ranging between 0.09 and 0.12, whereas Bcr is more diversified, displaying values between 34 and 50 mT (Figure 9b). The topsoil samples display a relatively narrow range of Bc and Bcr.
When magnetite dominates in a sample, the dimensionless ratio between the susceptibility of χARM and low-field magnetic susceptibility of χ would provide information on the grain size with the use of King’s plot, where constant values of χARM/χ ratios define straight lines for a specific grain size [51,63]. The distribution of data points in King’s plot is very diverse (Figure 10a,b). Street dust, PM, and topsoil from IW-1 are located in the area with a grain size between <0.1 and 5 μm. The magnetite-like grains of size ranging from 0.2 to 5 μm are attributed to coarse SD and fine MD grains, whereas the magnetic grains of size <0.1 μm are related to SD-like grains with high remanence [64]. The magnetic fraction of topsoil from areas affected by IW-2 and IW-3 ironworks contains larger grains that range in size from 5 to 20 μm, which is typical of PSD grains.
The first-order reversal curve diagrams are used to investigate the magnetic interactions, coercivity distribution, and domain state. These diagrams of selected topsoil samples collected nearby the ironworks (Figure 11) exhibit a slightly asymmetrical shape typical of PSD (vortex) state with closed peak structures at lower fields and open contours that spread along the Bu axis [47]. The main coercivity peak is located below 40 mT with tail reaching up to 120 mT. Topsoil samples (33 and 37) from IW-3 (Figure 11e,f) display more open contours compared to the remaining two sites, indicating the presence of MD-type grains.
Typical FORC diagrams obtained for the fine granulometric fraction of street dust with a grain diameter between 0.1 and 0.071 mm are shown in Figure 12a,b. The signal for total street dust was weak and noisy. Therefore, the measurements were performed for the fraction of fine particles, which, in accordance with the results of a previous study [28], is enriched with magnetic fractions. All the FORC diagrams revealed the presence of coarse MD grains, with open contours that diverge toward the Bu axis and the main peak close to the origin. The slight asymmetry of the diagram, evident in the vertical profile (Figure 12b), might suggest the presence of an additional SP fraction [46]. The central ridge in these samples is not well developed, with a coercivity tail that continues up to 80 mT.
The FORC diagrams of PM are generally very weak and noisy. However, two magnetic components are indicated (Figure 12c). The first has a very low coercivity (<10 mT) and is elongated along the Bu axis, possibly indicating SP contribution. The second component has a clearly indicated central ridge and tail spreading along the Bc axis up to 100 mT suggesting the presence of grains in a vortex (PSD) state. The vortex state is apparently confirmed by a ridge at 135° for negative Bu, which is not clearly developed due to the noisy diagram.

4. Discussion

In the urban environment, anthropogenic dust is mostly dominated by human activities, including the movement of vehicles, production of heat and electricity, and industrial production. Distinguishing the sources of these activities is more often a challenge addressed to recognize the diagnostic features of particles (pollutants) from individual sources. Since moving vehicles, power and heating plants, and industrial components, such as ironworks, emit dust containing magnetic particles, it seems very reasonable that their specific magnetic properties should reflect their sources. The present study showed that it is possible to indicate individual magnetic features—mineralogy and domain state of magnetic particles—for distinguishing their sources.
In this study, the TMP accumulated in the topsoil nearby the ironworks contained a large proportion of magnetite (91.2% on average), which was clearly observed on the κ(T) curves (Figure 2a,c,e, Table 2). A high contribution of anthropogenic origin magnetite with significant magnetic properties led to high values of magnetic susceptibility and hysteresis parameters Ms and Mrs (Supplementary Table S2) in the upper layers of soil nearby the studied ironworks. A small amount of magnetically hard hematite (5–10% on average) was observed in topsoil in all the studied areas. However, its contribution was very diverse. The highest input was observed for topsoil nearby the Katowice ironworks (~10%), whereas for topsoils from Třinec and Ostrowiec ironworks, the contribution was estimated as 8% and 5% on average, respectively (Table 2). An additional component was identified in the topsoil affected by Třinec ironworks. It could be highly coarse-grained magnetite, as indicated by its relatively low values of mean coercivity (B1/2 = 17.3 ± 1.1 mT). A probable source of this component may be an additional agent of local origin (e.g., hard coal combustion). Szuszkiewicz et al. [65] pointed out the presence of a component with a low mean coercivity (B1/2 ~17.8 mT) in the fly ashes collected from the electrostatic precipitators of power plant by hard coal combustion. The closest power plant is located in Dětmarovice, which is approximately 20 km from the studied area and is relatively new, operating since the middle of the 1970s. The coarse fractions of TMP should be captured by installed electrostatic precipitators. More realistic sources related to hard coal combustion are domestic heating installations from nearby housing areas. Coarse iron particles should fall into the MD range, and a low coercivity might be expected for them if the coercivity is not increased by surface oxidation [31,33]. Therefore, the other hypothesis that these particles are the tracers of the historical activity of the Třinec ironworks, from the period the plant was not equipped with any dedusting system, is less probable.
The magnetically hard component exhibiting weak magnetic properties corresponds to hematite. However, significant differences were found in the values of mean coercivity between the three areas affected by ironworks (see Supplementary Table S1). For IW-2 and IW-3, the average B1/2 values were relatively high: 400 ± 285 and 440 ± 200 mT, respectively. On the other hand, for the Třinec ironwork, it is almost halved to 160 ± 80 mT. A relatively large standard deviation from mean B1/2 indicates a large variation of this parameter between individual topsoil samples. Figure 13a presents the S-ratio versus the SIRM/χ ratio. S-ratio is independent of the concentration of magnetic particles and reflects the relative proportion of ferrimagnetic to antiferromagnetic phases [66]. Its distribution proved the contribution of antiferromagnetic hematite in the samples from IW-1 and IW-3. In the vicinity of Ostrowiec ironwork, the S-ratio close to 1 indicates the insignificant contribution of high-coercivity hematite to the magnetic fraction of topsoil. The linear relationship between SIRM and χ presented in Figure 13b depends only on the content of ferrimagnetic grains, while the position of samples in relation to the straight line reflects the predominance of ferrimagnetic or antiferromagnetic grains. The position of the IW-2 samples in the upper part of the plot and above the solid line in Figure 13b confirms the prominence of ferrimagnetic minerals in those samples compared to the IW-1 and IW-3 samples. These results are in good agreement with the IRM decomposition curves that indicated the lowest hematite content in the IW-2 samples (Table 2 and Supplementary Table S1). Moreover, the presence of hematite is barely detected on the SIRM(T) curve after the elimination of the high-remanence-carrying components from the sample (Figure 2d). In contrast, IW-3 samples, which lie below the solid line fitted for all the samples, are composed of a greater percentage of antiferromagnetic grains. The analysis of IRM components confirmed that the highest percentage contribution of hematite to the whole magnetization is approximately 10% (Table 2) in IW-3 samples. The presence of hematite in these samples was easily detected on the SIRM(T) curve (Figure 2f). The prominence of magnetite with a small contribution of magnetically hard hematite in TMP derived from iron metallurgy is apparently in line with the work of Magiera et al. [15], who studied dust from various industrial activities. The authors identified the prominence of magnetite in dust resulting from the combustion of lignite and coking plants. However, the presence of small portions of maghemite and/or magnetically harder phase, probably hematite, was detected as well. Zhou et al. [67] identified predominantly ferrimagnetic minerals, such as magnetite and maghemite, in the soil collected nearby the power plant and hematite in the topsoil collected from areas affected by the cement plant.
In addition to the mineral composition, the domain state of magnetic particles may allow identifying TMP according to their source of origin. The grain distribution analysis proposed in our work is based on the combination of different magnetic methods, namely FORC diagrams, Day–Dunlop plot, and different biplots, such as King’s plot, and SIRM/χ. This approach indicates that the TMP contain a mixture of MD and SD grains in different proportions. The position of the samples along the diagonal line on the graph (Figure 13b, solid line) shown for the relationship of SIRM and χ indicates that TMP from the area affected by IW-1 consist of finer grains, with a size of about 0.1 µm, falling within a wide range of PSD grains, and being in the SD/PSD threshold size [64], which results from both the distribution of the samples in the Day–Dunlop diagram (Figure 8) and the value of their χ/χARM ratios (Figure 10). The samples IW-1 exhibit the high Bc values (Figure 9a), which according to Roberts et al. [34] and Tauxe [57] can suggest the relatively large fragmentation of magnetic grains. On the other hand, IW-2 samples exhibit the lowest Bc (Figure 9a) values, indicating the prevalence of coarse MD, of a size around 20 µm, which was deduced from King’s diagram. The Bc and Bcr for IW-3 samples, which are intermediates between IW-1 and IW-2 samples, indicate the presence of rather fine MD grains. The aforementioned analysis is confirmed by the position of the individual populations of samples (IW-1, IW-2, and IW-3) in Figure 13b against the diagonal line constructed according to Thomson and Oldfield [50]. The topsoil samples from the areas affected by Ostrowiec and Katowice ironworks are above the diagonal line, whereas those from the areas affected by Třinec ironworks are below, thus confirming the presence of the finest magnetic grains in the latter topsoil. The FORC diagrams for all ironworks show similar behavior, indicating vortex state-dominated grains with a low coercivity (Figure 12) in the samples. On the other hand, IW-3 samples exhibit divergent contour patterns, suggesting a higher contribution of MD grains [68]. The presence of hematite, which was modeled on IRM(H) and seen on SIRM(T) curves, was not observed on the FORC diagrams due to its low concentration [69]. However, the MD-like behavior in the IW-3 samples might be an indicator of the higher contribution of high-coercivity minerals in comparison to other ironworks, as IW-3 exhibited the highest contribution of hematite among all.
The differences in the composition of the mineral fractions observed between the TMP accumulated in the soil around the Polish and Czech smelters may be due to the differences in the composition of iron ores used in technological processes. Nevertheless, this hypothesis requires more detailed research and information on the technological processes as well as the properties of the iron ores used in the smelter.
Magnetic particles from urban activity might exhibit very similar mineralogy to TMP produced by ironworks. However, subtle differences indicating the origin of individual particles are identifiable. The magnetic fraction of PM is almost mono-mineral, and the magnetic component analysis showed that the magnetic particles consist mainly of magnetite with the highest mean coercivity of B1/2 = 67 ± 2 mT among all the studied dust samples. Relatively large amounts of magnetic particles of spherical shape were found in the indoor dust of buildings in Warsaw, the composition of which is highly affected by the outdoor pollution [70,71]. There are two large heat- and power-generating plants with hard coal combustion operating within the city limits, so it should be expected that despite the protection offered by electrostatic precipitators, a certain portion of particles, especially the smallest ones, are suspended in the atmosphere. The spherical-shaped magnetic particles exhibit a high value of coercivity, which is a consequence of high stresses resulting from rapid cooling during their formation. Thus, the presence of high-temperature magnetic particles in suspended atmospheric dust in the urban regions of Warsaw seems very plausible.
In addition, particles of the magnetic fraction of PM have a different domain structure. Both the FORC diagrams (Figure 12c) and the distribution of PM samples in the Day–Dunlop diagram (Figure 8) showed the mixed presence of two types of grains, namely the typical PSD grains and the fine SP grains. Sagnotti et al. [72] investigated the magnetic properties of PM accumulated on air filters from monitoring stations from Latium Region (Italy) and found that the hysteresis ratios indicated a fairly homogeneous grain size distribution, with data plotting in a restricted region of the Day plot, in between the mixing trends for single-domain (SD)/MD and SD/SP magnetite grains. The same trend was found for powders directly collected from the disk brakes of moving vehicles in Rome, which was only moderately affected by the PSD gasoline dusts, and for Quercus ilex leaves grown along high-traffic roads [37]. Very recently, the same results, pointing out that brakes are the main source of PM in urban areas, were achieved in a magnetic biomonitoring study performed on lichens exposed in Milan [29]. This “intermediate” and recurring position in the Day plot of urban PM samples with prevailing brake emissions might depend on both the chemically impure composition of the magnetite-like particles and the coexistence of SP and MD granulometric fractions.
Conversely, in the study of Sagnotti and Winkler [73], the SP behavior was mainly related to local stress in the oxidized outer shell surrounding the unoxidized core of the MD magnetite-like grains. Street dust showed the greatest variation in the mineral composition of the magnetic fraction. In all the street dust samples, magnetite was dominant. However, depending on the place of sample collection, the magnetite was mixed with hematite and/or metallic iron. The soft magnetic component was identified as magnetite with a mean coercivity B1/2 of about 45 mT. Among the 21 samples for which the IRM components were analyzed, a high-coercive component (B1/2 = 284 ± 22 mT) with a 4–25% contribution to the magnetic fraction was found for one-third. It was related to the presence of hematite, a significant amount of which was easily visible on the thermal demagnetization curve of SIRM(T) after the elimination of low-field remanence-carrying components. On the other hand, in the majority of the studied street dust samples, the contribution of hematite was insignificant. Very often, it was limited by the possibility of hematite detection by the applied magnetic methods. However, for street dust, the κ(T) curves show the presence of an additional high-temperature phase, identified as metallic iron. The presence of metallic Fe and/or its alloys indicates the impact of traffic-related sources. Many authors [27,28,36,60] have shown that the presence of metallic iron in street dust can indicate mobile sources, i.e., pollution resulting from moving vehicles, electric street trams, and railways. The most common metallic Fe in street dust is derived from the abrasion of metal parts of vehicles and is related to the presence of toxic heavy metals. Magnetite is believed to result mainly from the abrasion of asphalt and partly from vehicle car systems.
Of all the studied dust samples, the domain structure of the magnetic grains of street dust is the most diverse as it contains mixtures of SD and MD magnetite particles (Figure 8a, green squares). However, some individual samples are shifted toward the PSD + SP mixing curves. This may indicate that the composition of street dust is dominated by several components, such as traffic-related and airborne dust (the contribution of SP grains inferred from the FORC diagrams), as well as dust from high-temperature industrial processes. These results are in general agreement with other studies on street dust. The FORC measurements for street dust accumulated in roadside snow in southern Finland [11] do not reveal the presence of the SD grains. The distribution seemed to be related to the MD and SP particles. Finally, Goddu et al. [2] performed the FORC measurements for spherical and irregular particles separated from street dust from Visakhapatnam (India) and revealed the MD properties mixed with the SD/PSD-like behavior.

5. Conclusions

The magnetic properties of industrial and urban dusts were examined for identifying the methodologies and parameters for the detection of the source apportionment. With the use of complementary magnetic methods, some subtle differences were found in the magnetic properties of dust originating from urban and industrial activities.
Two magnetic mineral phases were clearly identified in the topsoil in the vicinity of the three investigated ironworks. IRM was mainly achieved by magnetite, with a small (about 10–5%) contribution ascribed to hematite. The low-coercivity component, with a mean coercivity B1/2 (defined as the field necessary to achieve half of the saturation IRM) of about 48 mT, related to the presence of magnetite, was typical for the topsoil samples collected in the areas nearby all the studied ironworks. The high-coercivity component recognized as hematite showed large variations in B1/2 values: for IW-1, they were relatively low, at around 160 mT, whereas for IW-2 and IW-3 samples, the values were significantly higher, on average around 400 and 440 mT, respectively. The domain state of technogenic particles was predominated by the mixture of SD and MD grains, with the prevalence of SD grains in the topsoil collected in the area nearby the Třinec ironwork. The magnetic particles incorporated in PM10 collected in an urban environment consisted mainly of magnetite with a relatively high mean coercivity (B1/2 around 70 mT). A mixture of pseudo-SD and superparamagnetic grains seems to be a typical feature of PM10.
Magnetite (mean coercivity between 40 and 60 mT) mixed with metallic iron, which is usually related to public transportation, is the main magnetic phase in street dust. However, in about one-third of the dust samples, a certain amount of hematite (4–25%) with a mean coercivity in the range of 250–300 mT was also detected. Street dust revealed the greatest variation in the domain structure of the magnetic grains, in which the mixture of SD and MD grains predominated, and the presence of a small portion of SP grains could not be excluded. It is evident that the variation in the properties of street dust can be due to more than one source of magnetic particles originating from different urban activities.
The application of complementary magnetic methods in combination with bivariate plots of different magnetic parameters is an efficient approach to distinguish between dusts originating from urban and industrial sources. However, the comparison with previous studies on PM and street dusts from other urban areas highlighted that local variability in the emissions may interfere with the determination of unambiguous source appointment criteria based only on magnetic analyses.

Supplementary Materials

The following are available online at https://www.mdpi.com/2075-163X/10/12/1056/s1, Figure S1: Vertical distribution of volume magnetic susceptibility(κ) for soil cores collected in the area affected by ironwork Třinec (IW-1) (a), ironwork Ostrowiec (IW-2) and (c) ironwork Katowice (IW-3). There is marked the topsoil layer from which the material (called topsoil samples) was taken for magnetic studies. Figure S2: One-component (a,b) and two-component (c,d) fit of the same sample of street dust. Linear acquisition plot (left) and gradual acquisition plot (right), Table S1: Results of the IRM decomposition for representative samples from the iron works. Abbreviations: SIRM—saturation isothermal remanent magnetization; B1/2—mean coercivity; DP—dispersion parameter; the percentage of remanence contribution; SD—standard deviation, Table S2: Data of magnetic parameters for studied samples: topsoil, street dust and PM. X mass-specific magnetic susceptibility, Mrs—remanet magnetization, Ms—Saturation magnetization, Bc—coercivity, Bcr—remanece coercivity, XARM—anhysteretic magnetic susceptibility, S-ratio calculated by dividing the value of the -IRM-300mT by SIRM, SIRM—saturation isothermal remanent magnetization.

Author Contributions

Conceptualization, B.G.-K. and T.M.; methodology, K.D., S.D. and B.G.-K.; software, K.D.; validation, A.W.; formal analysis, T.M.; investigation, K.D., S.D., M.W., B.G.-K., T.M. and A.W.; writing—original draft preparation, B.G.-K., A.W., K.D., S.D. and T.M.; writing—review and editing, B.G.-K., K.D., S.D., A.W., T.M. and M.W.; visualization, B.G.-K. and K.D. All authors have read and agreed to the published version of the manuscript.

Funding

The study was funded by the National Science Centre (NCN), Poland, in the frame of scientific project No. 2016/23/B/ST10/02814 and supported by statutory activities No. 3841/E-41/S/2020 of the Ministry of Science and Higher Education of Poland. The paleomagnetic and environmental magnetism laboratory at the Institute of Geophysics, PAS in Warsaw (Poland) was financially supported by the project called EPOS-PL (No POIR.04.02.00-14-A003/16) co-financed by the European Union from the funds of the European Regional Development Fund (ERDF).

Acknowledgments

The authors would like to thank Radwag company (Poland) and Sławomir Janas for cooperation in measuring PM mass of filters using MYA 4Y.F PLUS microbalance. We thank Translmed Publishing Group (Bedford, NH, USA), a proofreading and copyediting company, for helping in copy-editing this manuscript. We acknowledge two anonymous Reviewers for their constructive comments and suggestions that improved the manuscript.

Conflicts of Interest

The authors declare no conflict of interest.

References

  1. Querol, X.; Alastuey, A.S.; Lopez-Soler, A.; Mantillai, E.; Plana, F. Mineral Composition of atmospheric particulates around a large coal-fired powerstation. Atmos. Environ. 1996, 30, 3557–3572. [Google Scholar] [CrossRef]
  2. Goddu, S.R.; Appel, E.; Jordanova, D.; Wehland, F. Magnetic properties of road dust from Visakhapatnam (India)-relationship to industrial pollution and road traffic. Phys. Chem. Earth 2004, 29, 985–995. [Google Scholar] [CrossRef]
  3. Jordanova, D.; Jordanova, N.; Hoffmann, V. Magnetic mineralogy and grain-size dependence of hysteresis parameters of single spherules from industrial waste products. Phys. Earth Planet. Inter. 2006, 154, 255–265. [Google Scholar] [CrossRef]
  4. Lu, S.G.; Bai, S.Q. Study on the correlation of magnetic properties and heavy metals content in urban soils of Hangzhou City, China. J. Appl. Geophys. 2006, 60, 1–12. [Google Scholar] [CrossRef]
  5. Hoffmann, V.; Knab, M.; Apple, E. Magnetic susceptibility mapping of roadside pollution. J. Geochem. Explor. 1999, 99, 313–326. [Google Scholar] [CrossRef]
  6. Hanesch, M.; Scholger, R.; Rey, D. Mapping dust distribution around an industrial site by measuring magnetic parameters of tree leaves. Atmos. Environ. 2003, 37, 5125–5133. [Google Scholar] [CrossRef]
  7. Yang, T.; Liu, Q.S.; Chan, L.S.; Cao, G.D. Magnetic investigation of heavy metals contamination in urban topsoils around the East Lake, Wuhan city, China. Geophys. J. Int. 2007, 171, 603–612. [Google Scholar] [CrossRef] [Green Version]
  8. Matzka, J.; Maher, B.A. Magnetic biomonitoring of roadside tree leaves: Identification of spatial and temporal variations in vehicle-derived particulates. Atmos. Environ. 1999, 3, 4565–4569. [Google Scholar] [CrossRef]
  9. Kim, W.; Doh, S.J.; Yu, Y. Anthropogenic contribution of magnetic particulates in urban roadside dust. Atmos. Environ. 2009, 43, 3137–3144. [Google Scholar] [CrossRef]
  10. Yang, T.; Liu, Q.; Li, H.; Zeng, Q.; Chan, L. Anthropogenic magnetic particles and heavy metals in the road dust: Magnetic identification and its implications. Atmos. Environ. 2010, 44, 1175–1185. [Google Scholar] [CrossRef]
  11. Bućko, M.S.; Magiera, T.; Johanson, B.; Petrovský, E.; Pesonen, L.J. Identification of magnetic particulates in road dust accumulated on roadside snow using magnetic, geochemical and micro-morphological analyses. Environ. Pollut. 2011, 159, 1266–1276. [Google Scholar] [CrossRef]
  12. Wawer, M.; Magiera, T.; Ojha, G.; Appel, E.; Kusza, G.; Hu, S.; Basavaiah, N. Traffic-related pollutants in roadside soils of different countries in Europe and Asia. Water Air Soil Pollut. 2015, 226, 216. [Google Scholar] [CrossRef]
  13. Ma, M.; Hu, S.; Wang, L.; Appel, E. The distribution process of traffic contamination on roadside surface and the influence of meteorological conditions revealed by magnetic monitoring. Environ. Monit. Assess 2016, 188, 650. [Google Scholar] [CrossRef] [PubMed]
  14. Łuczak, K.; Kusza, G. Magnetic susceptibility in the soils along communication routes in the town of Opole. J. Ecol. Eng. 2019, 20, 234–238. [Google Scholar]
  15. Magiera, T.; Jabłońska, M.; Strzyszcz, Z.; Rachwał, M. Morphological and mineralogical forms of technogenic magnetic particles in industrial dusts. Atmos. Environ. 2011, 45, 4281–4290. [Google Scholar] [CrossRef]
  16. Catinon, M.; Ayrault, S.; Boudouma, O.; Bordier, L.; Agnello, G.; Reynaud, S.; Tissut, M. Isolation of technogenic magnetic particles. Sci. Total Environ. 2014, 475, 39–47. [Google Scholar] [CrossRef] [PubMed]
  17. Kukier, U.; Ishak, C.F.; Sumner, M.E.; Miller, W.P. Composition and element solubility of magnetic and non-magnetic fly ash fractions. Environ. Pollut. 2003, 123, 255–266. [Google Scholar] [CrossRef]
  18. Gupta, S.; Dubikova, M.; French, D.; Sahajwalla, V. Characterization of the origin and distribution of the minerals and phases in metallurgical cokes. Energy Fuels 2007, 21, 303–313. [Google Scholar] [CrossRef]
  19. Flanders, P. Identifying fly ash at a distance from fossil fuel power stations. Environ. Sci. Technol. 1999, 33, 528–532. [Google Scholar] [CrossRef]
  20. Blaha, U.; Appel, E.; Stanjek, H. Determination of anthropogenic boundary depth in industrially polluted soil and semi-quantification of heavy metal loads using magnetic susceptibility. Environ. Pollut. 2008, 156, 278–289. [Google Scholar] [CrossRef]
  21. Magiera, T.; Kapička, A.; Petrovský, E.; Strzyszcz, Z.; Fialová, H.; Rachwał, M. Magnetic anomalies of forest soils in the Upper Silesia–Northern Moravia region. Environ. Pollut. 2008, 156, 618–627. [Google Scholar] [CrossRef] [PubMed]
  22. Sapkota, B.; Cioppa, M.T. Using magnetic and chemical measurements to detect atmospherically-derived metal pollution in artificial soils and metal uptake in plants. Environ. Pollut. 2012, 170, 131–144. [Google Scholar] [CrossRef] [PubMed]
  23. Xia, D.; Wang, B.; Yu, Y.; Jia, J.; Nie, Y.; Wang, X.; Xu, S. Combination of magnetic parameters and heavy metals to discriminate soil-contamination sources in Yinchuan—A typical oasis city of Northwestern China. Sci. Total Environ. 2014, 485, 83–92. [Google Scholar] [CrossRef]
  24. Bućko, M.S.; Magiera, T.; Pesonen, L.J.; Janus, B. Magnetic, geochemical, and microstructural characteristics of road dust on roadsides with different traffic volumes—Case study from Finland. Water Air Soil Pollut. 2010, 209, 295–306. [Google Scholar] [CrossRef]
  25. Grigoratos, T.; Martini, G. Brake wear particle emissions: A review. Environ. Sci. Pollut. Res. 2015, 22, 2491–2504. [Google Scholar] [CrossRef] [PubMed] [Green Version]
  26. Ojha, G.; Appel, E.; Wawer, M.; Magiera, T. Monitoring-based discrimination of pathways of traffic-derived pollutants. Stud. Geophys. Geod. 2015, 59, 594–613. [Google Scholar] [CrossRef]
  27. Górka-Kostrubiec, B.; Werner, T.; Dytłow, S.; Szczepaniak-Wnuk, I.; Jeleńska, M.; Hanc-Kuczkowska, A. Detection of metallic iron in urban dust by using high-temperature measurements supplemented with microscopic observations and Mössbauer spectra. J. Appl. Geophys. 2019, 166, 89–102. [Google Scholar] [CrossRef]
  28. Dytłow, S.; Winkler, A.; Górka-Kostrubiec, B.; Sagnotti, L. Magnetic, geochemical and granulometric properties of street dust from Warsaw (Poland). J. Appl. Geophys. 2019, 169, 58–73. [Google Scholar] [CrossRef]
  29. Winkler, A.; Contardo, T.; Vannini, A.; Sorbo, S.; Basile, A.; Loppi, S. Magnetic emissions from brake wear are the major source of airborne particulate matter bioaccumulated by lichens exposed in Milan (Italy). Appl. Sci. 2020, 10, 2073. [Google Scholar] [CrossRef] [Green Version]
  30. Gonet, T.; Maher, B.A.; Kukutschová, J. Source apportionment of magnetite particles in roadside airborne particulate matter. Sci. Total Environ. 2020, 752, 141828. [Google Scholar] [CrossRef]
  31. Spassov, S.; Egli, R.; Heller, F.; Nourgaliev, D.K.; Hannam, J. Magnetic quantification of urban pollution sources in atmospheric particulate matter. Geophys. J. Int. 2004, 159, 555–564. [Google Scholar] [CrossRef] [Green Version]
  32. Cui, Y.; Verosub, K.L.; Roberts, A.P. The effect of low-temperature oxidation on large multi-domain magnetite. Geophys. Res. Lett. 1994, 21, 757–760. [Google Scholar] [CrossRef]
  33. Van Velzen, A.J.; Dekkers, M.J. Low-temperature oxidation of magnetite in loess-paleosol sequences: A correction of rock magnetic parameters. Stud. Geophys. Geod. 1999, 43, 357–375. [Google Scholar] [CrossRef]
  34. Roberts, A.P.; Tauxe, L.; Heslop, D.; Zhao, X.; Jiang, Z. A critical appraisal of the “Day” diagram. J. Geophys. Res. Solid Earth 2018, 123, 2618–2644. [Google Scholar] [CrossRef]
  35. Kim, W.; Doh, S.J.; Park, Y.H.; Yun, S.T. Two-year magnetic monitoring in conjunction with geochemical and electron microscopic data of roadside dust in Seoul, Korea. Atmos. Environ. 2007, 41, 7627–7641. [Google Scholar] [CrossRef]
  36. Zheng, Y.; Zhang, S. Magnetic properties of street dust and topsoil in Beijing and its environmental implications. Chin. Sci. Bull. 2008, 53, 408–417. [Google Scholar] [CrossRef]
  37. Sagnotti, L.; Taddeucci, J.; Winkler, A.; Cavallo, A. Compositional, morphological, and hysteresis characterization of magnetic airborne particulate matter in Rome, Italy. Geochem. Geophys. Geosyst. 2009, 10. [Google Scholar] [CrossRef]
  38. Jaishankar, M.; Tseten, T.; Anbalagan, N.; Mathew, B.B.; Beeregowda, K.N. Toxicity: Mechanism and health effects of some heavy metals. Interdiscip. Toxicol. 2014, 7, 60–72. [Google Scholar] [CrossRef] [Green Version]
  39. Janssen, N.A.; Hoek, G.; Simic-Lawson, M.; Fischer, P.; van Bree, L.; ten Brink, H.; Keuken, M.; Atkinson, R.W.; Anderson, H.R.; Brunekreef, B.; et al. Black carbon as an additional indicator of the adverse health effects of airborne particles compared with PM10 and PM2.5. Environ. Health Perspect. 2011, 119, 1691–1699. [Google Scholar] [CrossRef] [Green Version]
  40. Maher, B.A.; Ahmed, I.A.; Karloukovski, V.; MacLaren, D.A.; Foulds, P.G.; Allsop, D.; Manne, D.M.A.; Torres-Jardón, R.; Calderon-Garciduenas, L. Magnetite pollution nanoparticles in the human brain. Proc. Natl. Acad. Sci. USA 2016, 113, 10797–10801. [Google Scholar] [CrossRef] [Green Version]
  41. Calderón-Garcidueñas, L.; González-Maciel, A.; Mukherjee, P.S.; Reynoso-Robles, R.; Pérez-Guillé, B.; Gayosso-Chávez, C.; Torres-Jardón, R.; Cross, J.V.; Ahmed, I.A.M.; Karloukovski, V.V.; et al. Combustion- and friction-derived magnetic air pollution nanoparticles in human hearts. Environ. Res. 2019, 76, 108567. [Google Scholar] [CrossRef] [PubMed]
  42. Day, R.; Fuller, M.; Schmidt, V.A. Hysteresis properties of titanomagnetites: Grain-size and compositional dependence. Phys. Earth Planet. Inter. 1977, 13, 260–267. [Google Scholar] [CrossRef]
  43. Dunlop, D.J. Theory and application of the Day plot (Mrs/Ms versus Hcr/Hc) 1. Theoretical curves and tests using titanomagnetite data. J. Geophys. Res. Solid Earth 2002, 107, 2056. [Google Scholar] [CrossRef] [Green Version]
  44. Dunlop, D.J. Theory and application of the Day plot (Mrs/Ms versus Hcr/Hc) 2. Application to data for rocks, sediments, and soils. J. Geophys. Res. Solid Earth 2002, 107, 2057. [Google Scholar] [CrossRef] [Green Version]
  45. Pike, C.R.; Roberts, A.P.; Verosub, K.L. Characterizing interactions in fine magnetic particle systems using first order reversal curves. J. Appl. Phys. 1999, 85, 6660–6667. [Google Scholar] [CrossRef] [Green Version]
  46. Roberts, A.P.; Pike, C.R.; Verosub, K.L. First-order reversal curve diagrams: A new tool for characterizing the magnetic properties of natural samples. J. Geophys. Res. 2000, 105, 2847–28461. [Google Scholar] [CrossRef]
  47. Roberts, A.P.; Heslop, D.; Zhao, X.; Pike, C.R. Understanding fine magnetic particle systems through use of first-order reversal curve diagrams. Rev. Geophys. 2014, 52, 557–602. [Google Scholar] [CrossRef]
  48. Warsaw City Hall Comunity Office, Szacunek Ludności i Kierunki Mobilności—Raport z Badania. Available online: https://www.um.warszawa.pl/o-warszawie/warszawa-w-liczbach/szacunek-ludno-ci-i-kierunki-mobilno-ci (accessed on 7 October 2020).
  49. PGNiG TERMIKA Offcial Website. Available online: https://termika.pgnig.pl (accessed on 7 October 2020).
  50. Thompson, R.; Oldfield, F. Environmental Magnetism; Allen and Unwin: London, UK, 1986. [Google Scholar]
  51. Evans, M.E.; Heller, F. Environmental Magnetism: Principles and Applications of Environmagnetics; Academic Press: Oxford, UK, 2003. [Google Scholar]
  52. Liu, Q.; Roberts, A.; Torrent, J.; Horng, C.S. What do the HIRM and S-ratio really measure in environmental magnetism? Geochem. Geophys. Geosyst. 2007, 8, Q09011. [Google Scholar] [CrossRef]
  53. Maher, B. Characterization of soils by mineral magnetic measurements. Phys. Earth Planet. Inter. 1986, 42, 76–92. [Google Scholar] [CrossRef]
  54. Kruiver, P.P.; Dekkers, M.J.; Heslop, D. Quantification of magnetic coercivity components by the analysis of acquisition curves of isothermal remanent magnetization. Earth Planet. Sci. Lett. 2001, 89, 269–276. [Google Scholar] [CrossRef]
  55. Harrison, R.J.; Feinberg, J.M. FORCinel: An Improved algorithm for calculating first-order reversal curve distributions using locally weighted regression smoothing. Geochem. Geophys. Geosyst. 2008, 9, Q05016. [Google Scholar] [CrossRef]
  56. Egli, R.; Florindo, F.; Roberts, A.P. Introduction to magnetic iron minerals in sediments and their relation to geologic processes, climate, and the geomagnetic field. Glob. Planet. Chang. 2013, 110, 259–263. [Google Scholar] [CrossRef]
  57. Tauxe, L. Paleomagnetic Principles and Practice; Kluwer Academic Publishers: Dordrecht, The Netherlands, 1998. [Google Scholar]
  58. Kądziałko-Hofmokl, M.; Kruczyk, J. Complete and partial self-reversal of natural remanent magnetization in basaltic rocks from Lower Silesia. Pure Appl. Geophys. 1976, 114, 207–213. [Google Scholar] [CrossRef]
  59. Dunlop, D.; Özdemir, Ö. Rock Magnetism: Fundamentals and Frontiers; Cambridge University Press: Cambridge, UK, 1997. [Google Scholar] [CrossRef]
  60. Muxworthy, A.R.; Schmidbauer, E.; Petersen, N. Magnetic properties and Mössbauer spectra of urban atmospheric particulate matter: A case study from Munich, Germany. Geophys. J. Int. 2002, 150, 558–570. [Google Scholar] [CrossRef] [Green Version]
  61. Zhang, C.; Qiao, Q.; Piper, J.D.A.; Huang, B. Assessment of heavy metal pollution from a Fe-smelting plant in urban river sediments using environmental magnetic and geochemical methods. Environ. Pollut. 2011, 159, 3057–3070. [Google Scholar] [CrossRef]
  62. Górka-Kostrubiec, B.; Szczepaniak-Wnuk, I. Magnetic study of a mixture of magnetite and metallic iron in indoor dust samples. Air Qual. Atmos. Health 2017, 10, 105–116. [Google Scholar] [CrossRef] [Green Version]
  63. King, J.; Banerjee, S.K.; Marvin, J.; Özdemir, Ö. A comparison of different magnetic methods for determining the relative grain size of magnetite in natural materials: Some results from lake sediments. Earth Planet. Sci. Lett. 1982, 59, 404–419. [Google Scholar] [CrossRef]
  64. Moskowitz, B. Hitchhiker’s Guide to Magnetism. 2007. Available online: http://www.irm.umn.edu/hg2m/hg2m.pdf (accessed on 30 March 2019).
  65. Szuszkiewicz, M.; Magiera, T.; Kapička, A.; Petrovský, E.; Grison, H.; Gołuchowska, B. Magnetic characteristics of industrial dust from different sources of emission: A case study of Poland. J. Appl. Geophys. 2015, 16, 84–92. [Google Scholar] [CrossRef]
  66. Bloemendal, J.; King, J.W.; Hall, F.R.; Doh, S.J. Rock magnetism of late Neogene and Pleistocene deep-sea sediments: Relationship to sediment source, diagenetic processes, and sediment lithology. J. Geophys. Res. 1992, 97, 4361–4375. [Google Scholar] [CrossRef]
  67. Zhou, H.Y.; Wang, X.S.; Shan, A.Q. Discriminating soil-contamination sources using combination of magnetic parameters. Environ. Earth Sci. 2015, 74, 5805–5811. [Google Scholar] [CrossRef]
  68. Roberts, A.P.; Liu, Q.; Rowan, C.J.; Chang, L.; Carvallo, C.; Torrent, J.; Horng, C.S. Characterization of hematite (a-Fe2O3), goethite (a-FeOOH), greigite (Fe3S4), and pyrrhotite (Fe7S8) using first-order reversal curve diagrams. J. Geophys. Res. 2006, 111, B12S35. [Google Scholar] [CrossRef]
  69. Ahmadzadeh, M.; Romero, C.; McCloy, J. Magnetic analysis of commercial hematite, magnetite, and their mixtures. AIP Adv. 2018, 8, 056807. [Google Scholar] [CrossRef] [Green Version]
  70. Górka-Kostrubiec, B. The magnetic properties of indoor dust fractions as markers of air pollution inside buildings. Build. Environ. 2015, 90, 186–195. [Google Scholar] [CrossRef]
  71. Jeleńska, M.; Górka-Kostrubiec, B.; Werner, T.; Kądziałko-Hofmokl, M.; Szczepaniak-Wnuk, I.; Gonet, T.; Szwarczewski, P. Evaluation of indoor/outdoor urban air pollution by magnetic, chemical and microscopic studies. Atmos. Pollut. Res. 2017, 8, 754–766. [Google Scholar] [CrossRef]
  72. Sagnotti, L.; Macrì, P.; Egli, R.; Mondino, M. Magnetic properties of atmospheric particulate matter from automatic air sampler stations in Latium (Italy): Toward a definition of magnetic fingerprints for natural and anthropogenic PM sources. J. Geophys. Res. 2006, 111, B12S22. [Google Scholar] [CrossRef]
  73. Sagnotti, L.; Winkler, A. On the magnetic characterization and quan-tification of the superparamagnetic fraction of traffic-related urban airborne PM in Rome, Italy. Atmos. Environ. 2012, 59, 131–140. [Google Scholar] [CrossRef]
Figure 1. The location of the sampling sites—IW-1 Třinec ironworks (Czech Republic), IW-2 Ostrowiec (Ostrowiec Świętokrzyski ironworks, Poland), and IW-3 Katowice (Dąbrowa Górnicza ironworks, Poland), and sampling of particulate matter and street dust from Warsaw (Poland).
Minerals 10 01056 g001
Figure 2. Thermomagnetic curves of magnetic susceptibility—κ(T) for the topsoil samples (a,c,e); heating curve (red line) and cooling curve (blue line). Thermal demagnetization of saturation remanent magnetization—SIRM(T) curves for the topsoil samples (b,d,f). The black curve obtained after sample saturation at a magnetic field intensity of 7 T; the red curve obtained after saturation at 7 T and demagnetization of low-coercivity phases along three orthogonal axes with a maximum alternating field peak of 40 mT. SIRM(T) curves are normalized to the maximum and minimum values of SIRM. The samples 16 collected from the area nearby Třinec ironworks (IW-1), sample 22 collected from the area nearby Ostrowiec ironworks (IW-2), and samples 33 collected from the area nearby Katowice ironworks (IW-3).
Minerals 10 01056 g002aMinerals 10 01056 g002b
Figure 3. Isothermal remanent magnetization (IRM) decomposition plots for representative topsoil samples from the areas affected by Třinec (a,b), Ostrowiec (c,d), and Katowice (e,f) ironworks. Linear acquisition plots (LAP) are shown in the left column, and gradient acquisition plots (GAP) are on the right.
Minerals 10 01056 g003
Figure 4. Thermomagnetic curves of magnetic susceptibility—κ(T) for the street dust samples (a,c). Thermal demagnetization of saturation remanent magnetization—SIRM(T) curves for the street dust samples (b,d). Description of the κ(T) and SIRM (T) curves is the same as in Figure 2.
Minerals 10 01056 g004aMinerals 10 01056 g004b
Figure 5. Isothermal remanent magnetization (IRM) decomposition plots for the representative street dust (sd) samples show linear acquisition plots (LAP) (a,c) and gradient acquisition plots (GAP) (b,d).
Minerals 10 01056 g005
Figure 6. Thermomagnetic curves of magnetic susceptibility—κ(T) for PM10 collected in Warsaw: heating curve (red line) and cooling curve (blue line).
Minerals 10 01056 g006
Figure 7. Isothermal remanent magnetization (IRM) decomposition plots for the representative particulate matter samples show linear acquisition plots (LAP) (a,c) and gradient acquisition plots (GAP) (b,d).
Minerals 10 01056 g007
Figure 8. The Mrs/Ms and Bcr/Bc ratios on the Day–Dunlop plot (a,b): green open squares for the street dust from Warsaw, black open circles for the atmospheric PM10 from Warsaw, blue triangle for Třinec ironworks (IW-1), purple triangles for Ostrowiec ironworks (IW-2), and red triangle for Katowice ironworks (IW-3). The single-domain (SD), pseudo-single-domain (PSD), and multidomain (MD) regions are marked after Day [42]. The theoretically calculated mixing curves for SD + MD, for magnetite, are marked after Dunlop [43,44].
Minerals 10 01056 g008
Figure 9. Distribution of Mrs/Ms ratio versus the parameters coercivity (Bc) (a) and remanence coercivity (Bcr) (b).
Minerals 10 01056 g009
Figure 10. King’s plot of χARM versus χ for the topsoil samples (King et al., 1982) [59] (a,b).
Minerals 10 01056 g010
Figure 11. First-order reversal curve (FORC) diagrams for selected samples collected from areas nearby the three ironworks: Třinec (a,b), Ostrowiec (c,d), and Katowice (e,f). Smoothing factors: Sc0 = 4, Sb0 = 3, Sc1 = Sb1 = 4, and λ = 0.1.
Minerals 10 01056 g011
Figure 12. Example of the first-order reversal curve (FORC) diagrams for the street dust fraction of grain diameter between 0.1 and 0.071 mm (a,b) and particulate matter (PM) (c). Smoothing factors for street dust: Sc0 = 4, Sb0 = 3, Sc1 = Sb1 = 4, and λ = 0.1: single domain (SD) 9 (a) and SD 14 (b). FORC diagram of a representative sample of PM (ap-258). Smoothing parameters for PM: Sc0 = 4, Sb0 = 6, Sc1 = Sb1 = 10, and λ = 0.08. It should be noted that PM is not mass-normalized.
Minerals 10 01056 g012
Figure 13. S-ratio versus SIRM/χ ratio (a) and χ versus SIRM (b) for topsoil samples collected nearby the ironworks. In figure (b), the solid line was fitted to the topsoil samples for all the areas affected by ironworks. The diagonal line (dashed) reflecting the concentration of magnetite and grain size distribution was constructed according to Thompson and Oldfield [50].
Minerals 10 01056 g013
Table 1. Details of the subsoil types and dust samples, time period, location and sample collection method.
Type of DustSampling LocationNumber of SamplesPeriod of CollectingDescription of Collecting Method
Ironworks Třinec (IW-1)Topsoil from the uppermost 30 cm of forest soil core collected by HUMAX SH 300 sampler. Topsoil samples were taken from the layers exhibiting the highest magnetic susceptibility,
i.e., from the layers mostly accumulated technogenic magnetic particles.
Industrial dust from steel production,Třinec,
Czech Republic, Northern Moravia
18 topsoil samplesMay 2018
Ironworks Ostrowiec (IW-2)
Industrial dust from steel productionOstrowiec Świętokrzyski, Poland,
Holy Cross Province
13 topsoil samplesMay 2018
Ironworks Katowice (IW-3)
Industrial dust from steel productionDąbrowa Górnicza, Poland,
Silesia Province
16 topsoil samplesMay 2018
Street dust
Urban dust from traffic-related sourcesWarsaw, Poland, Masovia Region70 dust samplesJune–July 2013Dust was collected from an area measuring about 1 m2 of the road surface using a clean plastic brush and dustpan
Particulate matter
Atmospheric dust from the urban area.Warsaw, Poland, Masovia Region28 filters collected in one locationFrom December 2018
to April 2019
PM with a particle diameter of <10 μm was collected on glass filters by the low-volume air samplers. PM was collected on each filter for 72 h (3 days)
Table 2. Average values of percentage contribution, mean coercivity (B1/2) at which half of the saturation isothermal remanent magnetization is reached, and dispersion parameter (DP) for the components of isothermal remanent magnetization acquisition curves measured for the topsoil samples.
Component 1Component 2Component 3
Ironworks Třinec (IW-1)
Contribution (%)86 ± 68 ± 45 ± 2
B1/2 (mT)44.9 ± 1.7160 ± 8017.3 ±1.1
DP (mT)0.33 ± 0.010.59 ± 0.130.16 ± 0.02
Ironworks Ostrowiec (IW-2)
Contribution (%)94 ± 25 ± 1
B1/2 (mT)49.4 ± 2.3400 ± 200
DP (mT)0.32 ± 0.010.75 ± 0.06
Ironworks Katowice (IW-3)
Contribution (%)90 ± 310 ± 3
B1/2 (mT)50.5 ± 2.8440 ± 285
DP (mT)0.32 ± 0.010.75 ± 0.03
Publisher’s Note: MDPI stays neutral with regard to jurisdictional claims in published maps and institutional affiliations.