Abstract
We investigated geochemical processes controlling uranium release in neutral-pH (pH ≥ 6) rock drainage (NRD) at a prospective gold deposit hosted in granite, schist, and gneiss. Although uranium is not an economic target at this deposit, it is present in the host rock at a median abundance of 3.7 µg/g, i.e., above the average uranium content of the Earth’s crust. Field bin and column waste-rock weathering experiments using gneiss and schist mine waste rock produced circumneutral-pH (7.6 to 8.4) and high-alkalinity (41 to 499 mg/L as CaCO3) drainage, while granite produced drainage with lower pH (pH 4.7 to >8) and lower alkalinity (<10 to 210 mg/L as CaCO3). In all instances, U release was associated with calcium release and formation of weakly sorbing calcium-carbonato-uranyl aqueous complexes. This process accounted for the higher release of uranium from carbonate-bearing gneiss and schist than from granite despite the latter’s higher solid-phase uranium content. In addition, unweathered carbonate-bearing rocks having a higher sulfide-mineral content released more uranium than their oxidized counterparts because sulfuric acid produced during sulfide-mineral oxidation promoted dissolution of carbonate minerals, release of calcium, and formation of calcium-carbonato-uranyl aqueous complexes. Substantial uranium attenuation occurred during a sequencing experiment involving application of uranium-rich gneiss drainage into columns containing Fe-oxide rich schist. Geochemical modeling indicated that uranium attenuation in the sequencing experiment could be explained through surface complexation and that this process is highly sensitive to dissolved calcium concentrations and pCO2 under NRD conditions.
1. Introduction
Uranium contamination in water is a global concern due to this element’s chemical toxicity towards humans and other living organisms [1]. Water-quality guidelines for U in Canada are 20 µg/L for drinking water and 15 µg/L for the protection of aquatic life (long-term exposure) [2,3]. Contamination of water by U frequently involves U mining and milling [4,5,6] but can also arise through natural weathering of rocks enriched in U through magmatic differentiation, such as granites and rhyolites [7,8,9,10,11].
Uranium(aq) mobility is controlled by pH, redox conditions, aqueous complexation, interactions with mineral surfaces, and dissolution/precipitation of minerals [12,13,14]. The two dominant oxidation states of U are U(VI) and U(IV), with U(IV) being generally insoluble pH > 3 [14]. Under reducing conditions, U(VI) is converted to U(IV) via microbial and abiotic reduction [14,15]. Uranium(VI) forms the uranyl aquo cation (UO22+), which is soluble at a wider pH range but can be attenuated via sorption onto clays, organic matter, and hydrous ferric oxides (HFO) [13,16,17,18,19,20,21,22]. Hydrous ferric oxides are a particularly important uranyl sorbent in mine wastes [23]. Recent work suggests that HFO sequesters uranyl via a bidentate inner-sphere uranyl complex at pH 3 to pH 9 [20]. From pH 7 to pH 9 and in waters containing dissolved inorganic carbon (DIC), uranyl dicarbonate UO2(CO3)22−] also sorbs onto HFO via outer-sphere complexation [20]. However, uranyl sorption is considerably weakened by formation of the calcium-carbonato-uranyl aqueous complexes Ca2UO2(CO3)3 and CaUO2(CO3)32− (henceforth referred to as CCU) under neutral to alkaline-pH conditions, where U mobility can present a concern [18,24,25]. Analogous Mg-uranyl-carbonate species also exist [25], although their influence on U mobility is less-studied.
Under oxidizing conditions in mine wastes, U mobility depends upon a series of geochemical reactions involving dissolution of sulfide and carbonate minerals after the exposure of waste rock or tailings to oxygen and water. These reactions ultimately govern solution pH, redox, aqueous U complexation, and sorption site availability. First, sulfide minerals in the presence of atmospheric O2 and water undergo oxidation, which produces HFO and sulfuric acid (Reaction (1)). Second, in the presence of carbonate minerals, acidity is buffered via carbonate-mineral dissolution (Reaction (2)) [23]:
(1) pyrite oxidation
4FeS2 pyrite + 15O2(aq) + 14H2O → 4Fe(OH)3 ferrihydrite + 8SO42−(aq) + 16H+(aq)
(2) carbonate-mineral dissolution by acid attack
CaCO3 calcite + 2H+(aq) ⇌ Ca2+(aq) + H2CO3(aq)
Dissolved inorganic carbon (DIC) and Ca released in Reaction (2) can become available to complex uranyl and increase its mobility through Reaction (3), below [18]. Calcium release could also theoretically increase U mobility by competing for HFO sorption sites, although experimental evidence suggests this effect is negligible [26].
U(VI)O22+(aq) + x Ca2+(aq) + 3 HCO3−(aq) ⇌ CaxU(VI)O2(CO3)32x−4 + 3 H+(aq); (x = 1 or 2)
Conversely, generation of HFO from sulfide-mineral oxidation might decrease U mobility by increasing sorption-site availability (Reaction (1)) [16,17,27].
The interplay of Reactions (1) to (3) has important ramifications for U behavior in sulfide- and carbonate-bearing mine wastes, yet their cumulative outcome on net U mobility is uncertain. Although there are many studies of U geochemistry in mine wastes, these have predominantly focused on acidic drainage (pH < 6) where CCU complexation is negligible [12,18,19,27,28,29,30,31,32,33,34,35,36,37]. Neutral-rock drainage (NRD) (e.g., pH ≥ 6 [38]) is typically characterized by high alkalinity (hundreds of mg/L as CaCO3) and dissolved Ca reaching hundreds of mg/L, i.e., orders-of-magnitude above typical fresh groundwaters [39,40,41,42,43,44]. Under these conditions, CCU complexation (Reaction (3)) might exacerbate U release. The role of Ca in mobilizing U has only received attention since the relatively recent discoveries of the importance of CCU in controlling U sorption [15,18,25] but this process has not yet been considered in NRD despite its Ca-rich characteristics.
Additionally, past studies on U behavior in a mining context have largely focused on wastes derived from U mining [12,28,30,36,45,46,47], yet magmatically differentiated rocks hosting a wide variety of ores (e.g., REE, Li) can also contain elevated U that could be mobilized through mine-waste weathering [48]. Thus, NRD-producing magmatically differentiated rocks may be particularly susceptible to U leaching due to the combination of a solid-phase source of U and leachate chemistry that enhances CCU complexation.
The objective of this work is, therefore, to evaluate the geochemical processes that control U mobility in Ca-rich NRD resulting from weathering of granitic and metamorphic rocks enriched in U. A combination of geochemical data gathered from exploration drill-core and kinetic leaching tests on a proposed mine’s waste rock are analyzed to assess the outcomes of Reactions (1) through (3) above on U release in this setting.
2. Study Site and Geological Setting
The study site is located at the Coffee gold deposit in subarctic Yukon, northwest Canada (Figure 1). This deposit formed ca. 97 million years ago through interaction of Au-As-Sb-S bearing fluid with metamorphic and granitic country rock along structurally controlled faults and fractures [49,50]. The deposit is located in the Dawson Range, wherein plutonic and metamorphic rocks are regionally enriched in U relative to typical crustal rocks [51]. Weathering of these rocks produces baseline U concentrations that can exceed 500 µg/L in groundwater and 300 µg/L in surface water, i.e., an order of magnitude above water-quality guidelines, making U an element of regional environmental concern [51]. The dominant local geological units are the Permian-aged Sulphur Creek orthogneiss, Klondike schist, and Snowcap schist, which were intruded by the Cretaceous-aged Coffee Creek biotite granite [49]. Minor expressions of marble and younger dykes are also present. Extensively weathered bedrock and the absence of Pleistocene glaciation has produced a deep oxidation front in the deposit, reaching depths of up to 300 m.
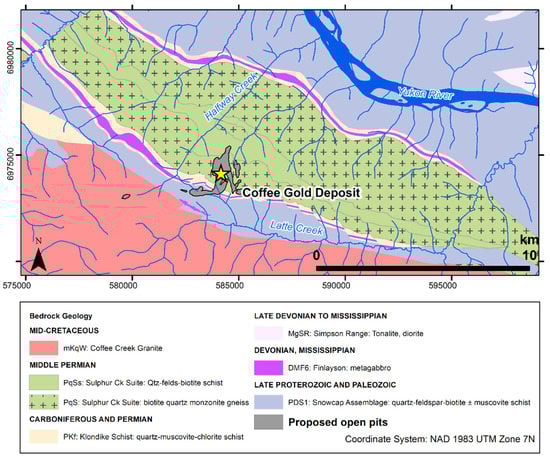
Figure 1.
Geological map showing the bedrock geology underlying the Coffee deposit and the proposed mine pit locations. Bedrock geology from ref. [50].
The extent of oxidation in drill-core samples at the Coffee deposit is used to categorize rocks into three weathering facies: the “oxide” facies corresponds to rocks with >95% of surfaces showing visible oxidation and the presence characteristic limonite/hematite stains or cubic vugs that remain after pyrite oxidation; the “transition” facies corresponds to 5% to 50% of surface with visible oxidation on pyrite grains, and the “fresh facies” is defined by samples where <5% of surfaces are oxidized and there is only minor joint-controlled oxidation that does not extend into adjacent rock.
3. Methods
3.1. Drill-Core Characterization
Geochemical characteristics of the rock types and weathering facies were established using a dataset of 479 drill-core samples collected at the Coffee deposit. All samples were classified by field exploration geologists based on rock type (gneiss, schist, or granite) and weathering facies (oxide, transition, or fresh). In the laboratory, samples were pulverized for geochemical analyses of elemental abundances using an aqua regia digestion followed by analysis via inductively coupled plasma mass spectrometry (ICP-MS), total inorganic carbon (TIC), and total sulfur. Analyses were either conducted at a commercial lab (ALS, North Vancouver, BC, Canada), or at the Pacific Centre for Isotopic and Geochemical Research (University of British Columbia, Vancouver, BC, Canada).
The acid-neutralization potential ratio (NPR), which is a standard parameter used to assess the likelihood that mine wastes produce acidic-rock drainage [38], was calculated from TIC and total sulfur results. In this calculation, the acid-generation potential is calculated from total sulfur assuming that all S can be released as H2SO4, which consumes 1 mol of CaCO3 per mol H2SO4. Acid-neutralization potential is calculated from TIC assuming that all TIC is CaCO3. The NPR reflects the ratio of acid-neutralization potential to acid-generation potential, both expressed as kg CaCO3 per ton rock as per the NPR equation [38]:
Rocks with a NPR < 1 are classified as potentially acid generating (PAG), rocks with a NPR >> 1 are classified as non-acid generating (NAG), and rocks with a NPR near or slightly above 1 (e.g., 1 < NPR < 2) are classified as uncertain [38].
The oxidation state of U in select rock samples representing each major lithology (gneiss, schist, and granite) and weathering facies (oxide, transition, fresh) was determined by X-ray absorption near-edge spectroscopy (XANES). Data were collected on the Hard X-ray Micro-Analysis beamline (HXMA, 061D-1) at the Canadian Light Source (CLS, Saskatoon, SK, Canada). The X-ray beam was calibrated to a Y foil at the first inflection point of the Y K-edge (17,038 eV) and U spectra were collected at the L3 edge (17,166 eV) over 5 energy regions: −200 eV to −160 eV, 10 eV steps; −160 eV to −100 eV, 0.5 eV steps (covering the yttrium foil calibration standard); −100 eV to −30 eV, 10 eV steps; −30 eV to +40 eV (U L3 edge), 0.5 eV steps; and +40 eV to 14.2 K, 0.05 K steps. The dwell time was 1 s per step. Data were collected in fluorescence mode with a 32-element Ge detector. Multiple spectra were collected for each sample and to correct for potential beam drift. Each analysis featured a Y-foil calibration measurement. We also collected XANES spectra of uranyl nitrate and uraninite standards using the same beamline settings as samples. To estimate the relative proportion of U redox species in each sample, linear combination fitting was conducted using the ATHENA software suite (Demeter v. 0.9.22) [52] and the uranyl nitrate and uraninite as standards.
3.2. Rock-Weathering Experiments
3.2.1. Experimental Design
Relationships between lithological characteristics, aqueous geochemistry, and U release were assessed with rock weathering experiments that included “field bins” and columns wherein rock was exposed to water and oxygen and the resulting leachate was characterized. These experiments were conducted under water-unsaturated conditions to mimic field waste-rock weathering conditions where fluid exchange with atmospheric oxygen leads to the oxidation of sulfide minerals as per Reaction (1). Field-bin experiments have a longer water residence time and lower water/rock ratio than columns, which leads to better representation of secondary sorption and mineral precipitation reactions that occur in full-scale waste-rock weathering environments in comparison with columns. Composite rock samples representing the various lithologies (granite, gneiss, schist) and weathering facies (oxide, transition, fresh) were prepared for these experiments (Supplementary Table S1).
The field bins consisted of 119 L HDPE barrels that were filled with approximately 200 kg of dry crushed rock, sieved to a grain size < 6 mm, and exposed from 2013 to 2018 to outdoor temperature and precipitation conditions in Whitehorse, Yukon, Canada (Supplementary Figure S1) [53,54]. Field bins were initially irrigated with 28 L of de-ionized water, after which atmospheric precipitation was the only source of water. Leachates were collected into closed plastic containers that were sampled approximately monthly for geochemical analyses.
The column experiments involved application of 400 mL of Nanopure™ water purified through distillation and de-ionization (DDI water) onto to Plexiglas® reactors containing 10 kg of crushed and sieved (<6 mm) waste rock every 14 days. Columns were 21 cm in inner diameter and 20.5 cm tall and were operated at a lab temperature of 4 °C to reflect the subarctic climate of the field site. A nylon mesh overlying a perforated Plexiglas® disk at the base of the columns was used to retain the rock in the columns.
Three “Phases” of column experiments were performed. Phase 1 involved application of DDI water to the columns every 2 weeks between 2014 and 2018, with the leachate collected for chemical analysis. During a 6-month period in Phase 1 and beginning in May 2015, the effluent from the base of the columns was collected and then re-applied to the top columns once. Upon the second pass of water through the column, samples were withdrawn for chemical analyses. This recirculation procedure was included to increase the water contact time with the rock such that it is closer to field conditions in waste-rock storage facilities (WRSF). After January 2016, chemical concentrations stabilized and thus the recirculation procedure was removed: thereafter, DDI water was applied as influent once and the resulting leachate collected for analysis without recirculation.
Phases 2 and 3 were designed to investigate U mobility controls during interaction of leachate produced by one rock type with another rock’s solids. In Phase 2, leachate from high-alkalinity and U-poor schist-bearing columns was used as influent for U-rich gneiss-bearing columns, which was hypothesized to drive U desorption via CCU complexation. In Phase 3, this order was reversed, to assess whether the Fe-rich schist could attenuate U from gneiss leachate via sorption. Phases 2 and 3 were conducted using gneiss and schist pairings, with one experimental set devoted to oxide-facies rocks and another to transition-facies rocks (Supplementary Table S1).
3.2.2. Geochemical Analyses
Column and field bin leachates were sampled for pH, alkalinity, anions, and metals analyses at SGS Canada Inc. (Burnaby, BC, Canada). Alkalinity and anions were determined on filtered (0.45 µm) sample aliquots using titration with H2SO4 and ion chromatography, respectively. Metals were analyzed on filtered (0.45 µm) and acidified (HNO3 to pH < 2) sample aliquots using inductively coupled plasma mass spectrometry. Each water-sample batch was accompanied by a method blank, a duplicate sample analysis to monitor precision, and a matrix spike to monitor accuracy. Lab QA/QC criteria at SGS include matrix spike recoveries better than 70% for metals and 75% for anions, and reproducibility between duplicate samples better than 20%.
The grain-size distribution and geochemical composition of rocks used in weathering experiments was also determined by SGS Canada. Metals were analyzed by ICP-MS after aqua-regia digestion of pulverized samples. Analyses of duplicate and reference materials (OREAS 260 and OREAS502B, Melbourne Australia) yielded ICP-MS reproducibility and accuracy were ≤5%. Total inorganic carbon (TIC) was measured by treating rock sample powders with HClO4 to convert C to CO2, which was measured by coulometry. Rock total sulfur content was determined by Leco combustion analysis. Sulfide was measured by first leaching sulfate with NaCO3 and analyzing the residual sample with the Leco analyzer. Shake-flask extractions were conducted by SGS on rock samples using distilled de-ionized water at a 3:1 water:rock ratio shaken for 24 h, with the leachate analyzed for U content by ICP-MS.
Mineralogical abundances were quantified by powder X-ray diffraction (XRD) at the CLS (analytical details in Section S.1. of the Supplementary Materials) or by SGS Canada Inc (Burnaby, BC, Canada). Quantitative evaluation of materials by scanning electron microscopy (QEMSCAN) analysis was used at SGS to quantify the proportions of Fe-minerals found as oxides, and of S-minerals as sulfides, respectively. QEMSCAN analyses were conducted on samples pulverized to 80% passing <106 µm and then graphite-impregnated into polished thin sections.
At the end of column experiments, residues were also characterized for elemental abundances (ICP-MS) and shake-flask extractable U as described above. Sequential chemical extractions (SCEs) were conducted on the residues from the two schist columns (C3-ScO and C4-ScT) using a 5-step protocol based on the method of Tessier et al. [55] (procedural details in Section S.2. of the Supplementary Materials).
3.3. Geochemical Modeling
The geochemical code PHREEQC [56] was used to calculate aqueous speciation and mineral saturation indices (SI) on field-bin and column effluents. We also conducted a series of simulations in PHREEQC to investigate U sorption during Phase 3 of the column experiments. A detailed explanation of the modeling approach is given in the Supplementary Materials (Section S.4). Briefly, U sorption was assumed to be dominated by surface complexation and it was modeled using a 2-step approach. In the first step, HFO availability was calibrated for the schist columns using Phase 1 major-ion chemistry data, the rock/water ratio, QEMSCAN quantification of Fe-oxides, and U solid-phase abundance data from aqua regia and sequential chemical extractions. These calibrated HFO compositions for the schist were then used in simulations of Phase 3, which involved batch reactions with gneiss influent solution and residual porewater in the schist column in the presence of HFO, calcite, and H2SO4 (assumed to be sourced from sulfide-mineral oxidation). Changes in major-ion chemistry (pH, alkalinity, Ca, sulfate) were considered by allowing dissolution/precipitation of calcite, dissolution/exsolution of CO2, and addition of H2SO4 along with surface complexation with HFO (full details in Supplementary Materials Section S.4.2).
PHREEQC simulations were conducted using the wateq4f.dat database, which was amended with association constants for the Ca-carbonato-uranyl and Mg-carbonato-uranyl aqueous complexes from Dong and Brooks [24] and the surface complexation constants for HFO-uranyl and HFO-carbonate species as per Mahoney et al. [18,57] (Supplementary Table S2). Surface complexation was modeled using the Dzombak–Morel diffuse-double layer with a 50:1 ratio of strong and weak sorption sites [57,58].
4. Results and Discussion
4.1. Uranium, Sulfur, and Carbonate Content of the Coffee Deposit
Drill-core geochemical analyses indicate that rock at the Coffee deposit is generally NAG owing to excess of TIC over sulfur, which average 0.5 wt.% and <0.07 wt.%, respectively. 97.5% of samples are classified as NAG with NPR > 1 (Supplementary Figure S2). Rock types can generally be characterized as follows: schist is typically the most enriched in sulfur and TIC, granite has low sulfur and low TIC, and gneiss has intermediate sulfur and TIC content (Figure 2). Sulfide contents are minimal in oxide-facies samples of all rock types: median values are 0.005 wt.% in granite-oxide and gneiss-oxide, and 0.01 wt.% for schist-oxide. Gneiss-oxide and especially granite-oxide rocks are also depleted in TIC relative to their less-weathered counterparts, with median TIC values of 0.2 wt.% and 0.1 wt.%, respectively, although they generally are NAG (Supplementary Figure S2). Weathering of the deposit over geological timescales has therefore created an oxidized zone that is depleted in sulfide minerals yet has maintained excess TIC to create NAG rock.
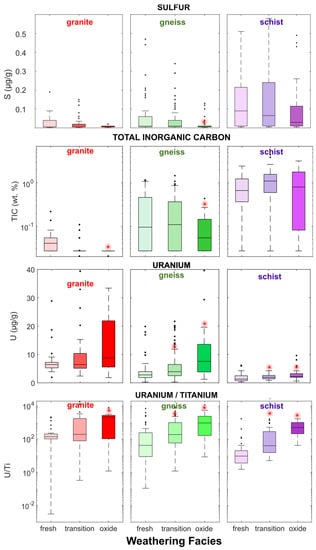
Figure 2.
Sulfur, total inorganic carbon (TIC), U, and U/Ti by rock type and by weathering facies in Coffee drill-core samples. Red stars indicate median U or U/Ti is significantly higher (p < 0.05); or TIC and sulfur content is significantly lower (p < 0.05) in transition or oxide facies than in fresh facies for a given rock type (Mann–Wilcox Test).
Rocks at the Coffee deposit are modestly enriched in U relative to typical crustal rocks, with a median abundance of 3.7 µg/g and a maximum of 144 µg/g (Table 1), both above the 2.7 µg/g average of Earth’s upper crust [59]. The deposit is also enriched in U in comparison with regional country rocks: Sulphur Creek suite orthogneiss and Whitehorse suite granite samples collected outside the Coffee deposit have median abundances of 3.3 and 3.2 µg/g, respectively [51]. The lack of clear relationships between U and hydrothermally sourced elements As, S, and Sb in fresh-facies rocks in the deposit suggests that its U was not sourced from the hydrothermal system (Supplementary Figure S3).

Table 1.
Uranium abundance at the Coffee deposit by rock type and weathering facies (all units µg/g).
The strongest enrichment in U is found the oxide facies of each major lithology (granite, gneiss and schist; Table 1), where median values are 8.9, 7.6, and 2.2 µg/g, respectively (Supplementary Table S1). This enrichment of oxide-facies rocks in U may indicate of retention of U transported by the groundwater flow system. This hypothesis is supported by significantly higher U/Ti in the oxide facies (p < 0.05, Mann–Wilcox test) in comparison with the fresh facies across all lithologies (Figure 2) because Ti is relatively immobile in groundwater but not U.
Uranium redox speciation of select gneiss and schist samples determined by linear combination fitting (LCF) of the XANES spectra show that samples from all weathering facies have an appreciable U(VI) content, with proportionally more U(VI) in oxide-facies rocks than in transition- and fresh-facies rocks (Figure 3 and Supplementary Table S3). These results suggest the presence of U(IV) phases in unoxidized portions of the deposit, while rock oxidation has liberated U that was transported and re-deposited as U(VI) in oxide-facies rocks.
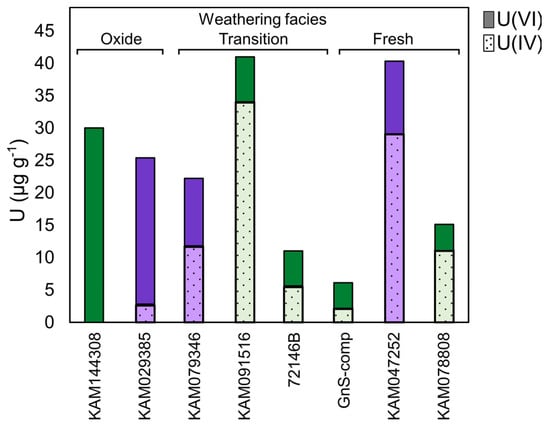
Figure 3.
Uranium redox speciation in select Coffee drill-core samples determined by XANES-LCF. Solid fill = U(VI); hatched fill = U(IV); green = gneiss; purple = schist. Full LCF model results and quality of LCF fits (R-factor) are presented in Supplementary Table S3. The LCF error is estimated at ±10%.
4.2. Rock Weathering Experiments
Fresh-facies rocks for a given rock type used in kinetic tests contained the highest sulfide and carbonate mineral content, while oxide-facies rocks were depleted in sulfide and carbonate minerals, reflecting observations from the larger drill-core dataset (Figure 4). All rocks used in kinetic tests were NAG, with NPRs ranging from 6.5 to 81, except the granite-transition which had an NPR of 0.7 (Supplementary Table S1). Carbonate minerals included calcite, dolomite, and ankerite, the sum of which varied in the order schist > gneiss > granite (Supplementary Table S1). Carbonates comprised 9.7 to 24 wt.% in schist and ranged from below XRD detection limits to 4.3 wt.% in gneiss, while no carbonates were detected in granite (Supplementary Tables S1 and S4). Pyrite and arsenopyrite were the dominant sulfide minerals observed by XRD and QEMSCAN analyses with abundances below 1 wt.%. The Fe-oxide content determined by QEMSCAN was notably higher in the schist-oxide at 2.0 wt.% in comparison with other rocks which had 0.20 to 0.56 wt.% Fe-oxide (Supplementary Table S1). Fe-oxide abundance was generally greater in oxide-facies rocks for a given lithology than in their transition-facies and fresh-facies counterparts. No U minerals were identified by XRD. The initial solid-phase U content was higher in the gneiss and granite (5.5 to 7.6 µg/g) than in the schist (2.6 to 3.2 µg/g) (Figure 4).
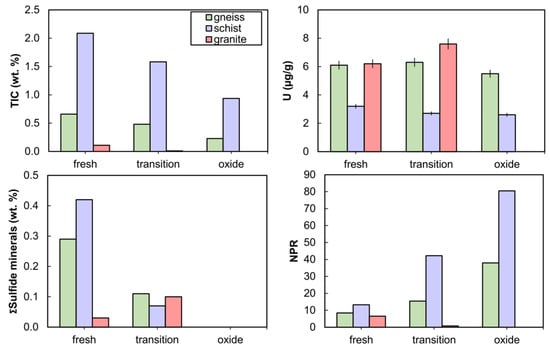
Figure 4.
Solid-phase composition of rocks used in kinetic tests: total inorganic carbon (TIC), uranium, sum of sulfide minerals (from quantitative evaluation of materials by scanning electron microscopy, QEMSCAN), and neutralization potential ratio (NPR) as a function of rock type and weathering facies. Error bars on U abundance are ±5%.
Leachate pH and alkalinity were distinctly lower in granite weathering experiments in comparison with gneiss and schist experiments (Figure 5), owing to the minimal carbonate content in the granite. Granite-transition rock produced leachate pH ca. 7.5 in the column, and pH < 6 in the field bin, with alkalinity concentrations being close to detection limits. In contrast, the carbonate-rich gneiss and schist produced drainage in the pH 7.6 to 8.4 range, and several hundred mg/L of alkalinity (as CaCO3) (Figure 5). Geochemical modeling indicated that leachates were near calcite saturation in all column experiments, with mineral saturation indices (SI) typically ranging between −0.25 and +0.50, except the granite-transition column where calcite was undersaturated (SI −1 to −3). All columns were undersaturated with respect to gypsum (SI < −0.8). Thus, gneiss and schist drainage can generally be described as high-alkalinity NRD, while granite drainage is circum-neutral to moderately acidic with low alkalinity.
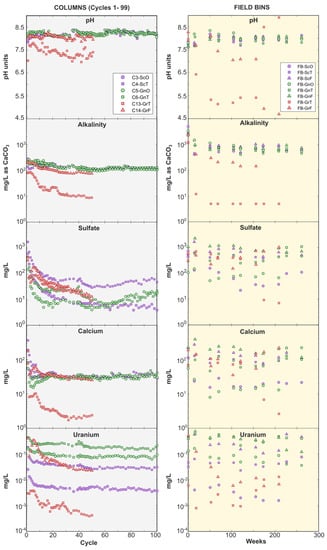
Figure 5.
Column (left panel) and field bin (right panel) leachate pH, alkalinity, sulfate, Ca, and U. For column tests, only cycles representing Phase 1, i.e., prior to the sequencing experiments, are shown (i.e., cycles 1 to 99). Note differences in y-axis scale between left and right panels. Symbol shape indicates weathering facies: triangles = fresh; squares = transition; circles = oxide. Color indicates lithology: green = gneiss; red = granite; purple = schist.
Within a given weathering facies, U concentrations followed the order gneiss > schist > granite (Figure 5). Leachates in the gneiss and schist field bins contained tens to hundreds of µg/L U, while all granite U concentrations remained <10 µg/L. This lithological control was also observed in column experiments: in the gneiss-transition and schist-transition columns, U concentrations stabilized between ca. 180 µg/L and ca. 30 µg/L respectively, while they rapidly declined below 1 µg/L in the granite columns (Figure 5). Comparable lithological controls and U concentration ranges occur in groundwater around the Coffee deposit, where monitoring wells screened in gneiss can produce water containing several hundred µg/L U while those in schist and granite typically have lower concentrations that range from ca. 30 to 80 µg/L, and ca. 4 to 75 µg/L, respectively [60]. There was an additional effect of weathering facies, with oxide-facies rocks releasing the least U. In gneiss-oxide and schist-oxide field bins, U concentrations were <10 µg/L, while they ranged from 23 to 750 µg/L in the transition- and fresh-facies experiments (Figure 5).
Uranium, Ca, and sulfate release rates in field bins also correlated with rock weathering facies, with the highest rates produced in the least oxidized rocks (Figure 6). This was not the case for alkalinity, which was released at the lowest rate in the fresh facies for each rock type (Figure 6). Lower alkalinity release rates in fresh-facies rocks can be explained by their higher sulfide-mineral content, which led to sulfide-mineral oxidation, sulfuric acid (and sulfate) generation, and alkalinity consumption. (Figure 6). Calcium release rates followed sulfate release rates because Ca was released from carbonate-mineral dissolution reactions that buffered H2SO4 (Figure 6). While there is longstanding knowledge of the relationship between alkalinity and U release due to aqueous complexation of U by bicarbonate [13], the lack of correlation between alkalinity and U release rates in our experiments indicate that alkalinity was not a limiting factor in forming mobilizing U. Rather, greater U release from fresh-facies rocks may be explained by their higher Ca release that promoted formation of weakly sorbing CCU complexes (Reaction (3)) [18]. This hypothesis is supported by the higher proportion of U associated with CCU complexes in fresh- and transition-facies field bins in comparison with their oxide-facies counterparts (Supplementary Figure S4).
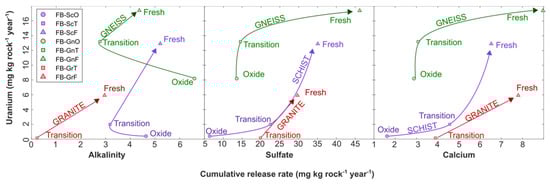
Figure 6.
Cumulative U release rate in field-bin experiments against release rates of alkalinity (left), sulfate (middle) and calcium (right). Arrows indicate trend from oxide to transition to fresh weathering facies in each rock type.
Uranium release rates were also decoupled from solid-phase U content: despite granite-transition and granite-fresh rock having the highest U abundances, they released substantially less U than their gneiss and schist counterparts (Figure 6). For the granite-transition field bin, the disproportionally low U release rate relative to the U abundance can be explained by its pH (ca. 5) and low alkalinity (<10 mg/L as CaCO3). Under these conditions, speciation calculations in PHREEQC suggest that a substantial proportion of U was present as UO22+ and UO2OH+, which can effectively sorb onto HFO through inner-sphere complexation [20] (Supplementary Figure S4). In the granite-fresh experiment, the concentration of these species was negligible but between 1% and 27% of U(aq) was in the form of uranyl carbonates, predominantly as UO2(CO3)22−, which also sorbs onto HFO through outer-sphere complexation [20]. In contrast, in the higher-alkalinity schist and gneiss field bins, 91% to 99% of U(aq) was speciated as CCU, which are essentially unavailable for U sorption [18,20], while only a minor proportion of more sorption-reactive UO22+, UO2OH+, and uranyl carbonate species were present, promoting higher U release rates (Supplementary Figure S4).
4.2.1. Controls on U Surface Complexation during Column Sequencing Experiments
Upon application of leachate from the schist-transition column to the gneiss-transition column in Phase 2, a pronounced increase in U concentrations in gneiss effluent was observed, reaching up to 272 µg/L (Figure 7). In the transition-facies columns and prior to Phase 2 and 3 sequencing experiments, drainage from the schist-transition column had produced considerably higher major-ion concentrations, including dissolved Ca and sulfate, than the gneiss-transition column (Figure 7). Alkalinity concentrations were slightly lower for the schist than for the gneiss. Uranium concentrations were notably higher for the gneiss—ca. 150 µg/L—in comparison with values of approximately 30 µg/L for the schist. Given the lower alkalinity in the schist-transition leachate, alkalinity was not responsible for driving the U released during the schist-to-gneiss sequencing experiment. The increase in U concentrations during Phase 2 is instead hypothesized to be attributed to elevated Ca in the schist effluent that promoted CCU formation and U desorption after this effluent was circulated through the gneiss column.
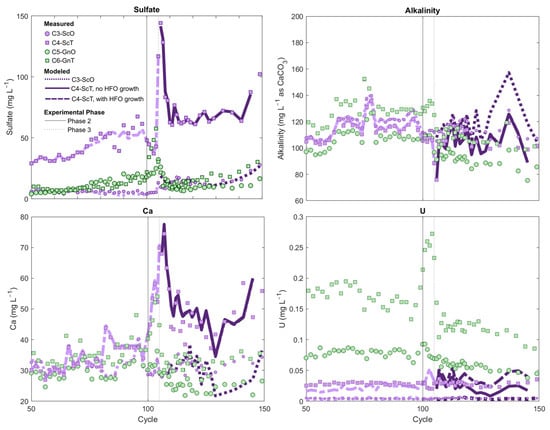
Figure 7.
Column leachate composition during the sequencing experiments for transition (square symbols) and oxide (circular symbols) gneiss and schist columns. Sequencing experiments are described in Supplementary Table S1. Lines represent modeled concentrations: dotted lines = schist-oxide model; solid lines = schist-transition model with hydrous ferric oxides (HFO) growth; dashed line = schist-transition model with a fixed HFO composition. Light and dark line colors differentiate Phase 1 and Phase 3 model outputs.
In the analogous oxide-facies columns, circulation of leachate from the schist-oxide column through the U-rich gneiss-oxide column also produced an increase in U concentrations in the gneiss-oxide effluent, albeit more modest than in the transition-facies column, from ca. 80 µg/L prior to the sequencing experiment up to 93 µg/L in the first two cycles of Phase 2. A greater Fe-oxide content in the oxide-facies gneiss might explain the more muted release of U observed in comparison with the gneiss-transition column during Phase 2 of the sequencing experiment (Supplementary Table S1).
Upon reversal of the order of flow in Phase 3, marked U attenuation from the U-rich gneiss column was observed in both transition-facies and oxide-facies sequencing experiments (Figure 7). In the transition-facies experiment, despite application of gneiss leachate with U concentrations of >100 µg/L into the schist column, schist U effluent steadily remained in the 30 to 40 µg/L range (i.e., similar to concentrations prior to sequencing experiments) with no sign of elevated U breakthrough. Although it is impossible to explicitly discriminate between U mass release within the schist and U sourced from the gneiss feed solution, mass-balance calculations show that at least 83% of the U originating from the gneiss solution was retained if U inputs from the schist are assumed to be zero. If the per-cycle U release rate from within the schist is assumed to have remained unchanged during Phase 3 relative to the rate observed at the end of Phase 1 (cycles 90 to 99, when U concentrations were stable), this estimate increases to >100%. As U retention cannot in fact exceed 100%, these calculations suggest that the 30 to 40 µg/L U in schist effluent reflected an equilibrium control threshold concentration that was maintained even after application of the U-rich gneiss leachate to the schist column.
In the oxide-facies Phase 3 sequencing experiment, U attenuation was even greater: U concentrations in the U-rich gneiss-oxide effluent declined from ca. 80 µg/L to ca. 5 µg/L after circulation through the schist-oxide column (Figure 7). Schist-oxide effluent U concentrations were also unchanged during Phase 2 in comparison with the stable concentrations observed toward the end of Phase 1 in that column, similar to the transition-series Phase 3 result (Figure 7). Mass-balance calculations give a lower limit of 94% U retention within the schist-oxide column during Phase 3; this estimate increases to 99% if per-cycle U release from schist solids is assumed to have remained unchanged relative to the rate observed at the end of Phase 1 (cycles 90–99). Additional net U release within the schist during Phase 3 of the oxide sequencing experiment was, therefore, likely negligible. The lack of U breakthrough from the schist-oxide is consistent with its exceptionally high Fe-oxide content relative to other rocks, making it capable of retaining U through sorption despite elevated porewater Ca and alkalinity (Supplementary Table S1).
Shake-flask and SCE of schist-transition and schist-oxide column residues at the end of the sequencing experiments provided an indication of U attenuation via sorption processes. Shake-flask extractable U increased from < 0.014 µg/g prior to column experiments to values ranging from 0.29 to 0.49 µg/g (Supplementary Figure S5). Residue SCE analyses indicated that between 16% and 24% of the U at the end of the experiments was soluble in the chemical reagents MgCl2, Na-acetate, and hydroxylamine-hydrochloride which nominally target weakly sorbed, carbonate-bound and exchangeable, and crystalline phases [55]. In both columns, U contents recovered in the MgCl2 and Na-acetate extractions were highest in the upper 10 cm of column residues and decreased in deeper intervals of the columns, suggesting limited downward transport of U in the column after it received gneiss-oxide U-rich leachate (Supplementary Figures S5 and S6).
4.2.2. Modeling Sorption during the Application of U-Rich Gneiss Effluent to Schist Columns
The role of sorption on U attenuation during Phase 3 of column-sequencing experiments was further investigated with geochemical models. In these models, the HFO composition of schist-oxide and schist-transition rocks were calibrated from QEMSCAN Fe-oxide results, scaled to reproduce Phase 1 U concentration data (calibration details in Supplementary Materials Section S.4 and presented visually in Supplementary Figures S7 and S8), and yielded 21 g/L HFO and 4.7 g/L HFO, respectively. These HFO abundances correspond to the Fe-oxide content determined by QEMSCAN in these rocks multiplied by a calibration factor of 0.08 and 0.15, respectively (Supplementary Materials Section S.4.1) and they are consistent with the expectation of more HFO in more oxidized rock facies (Supplementary Table S1).
To simulate aqueous geochemistry of the schist-oxide sequencing experiment during Phase 3, the calibrated HFO concentration in the schist was allowed to interact with a mixture of influent gneiss-oxide leachate and residual porewater in the schist, the proportions of which were estimated from water mass balance. This solution-HFO mixture was forced to match the pCO2 and calcite SI observed in schist effluent at each cycle in batch reactions by allowing calcite dissolution/precipitation and CO2 dissolution/exsolution. These reactions ensured that the measured pH, Ca, and alkalinity concentrations were reproduced in the model (Supplementary Materials Section S.4.2). These simulations indicated that the marked U attenuation observed in Phase 3 of the schist-oxide experiment could be explained through a surface-complexation model that provided a reasonable fit of observed major ion, pH and U concentrations [root-mean square error (RMSE) 0.0011 for U measured vs. U modeled] (Figure 7).
A similar modeling approach was used to examine U attenuation during Phase 3 of transition-facies experiment, except that this model also required consideration of processes related to sulfide-mineral oxidation. Sulfate concentrations were approximately one order of magnitude higher in the schist-transition column experiment in comparison with its schist-oxide counterpart (Figure 1). Sulfate concentrations also showed a steady increase after cycle 60 (Figure 1 and Supplementary Figure S9). These trends in sulfate concentration, along with the higher initial sulfide-mineral content of the schist-transition rock as seen in QEMSCAN analyses (Supplementary Table S1), suggested that sulfide-mineral oxidation was occurring in the schist-transition column as the experiment progressed. Calcium concentrations from the schist-transition effluent were also consistently above those of the gneiss-transition feed solution during Phase 3, suggesting that sulfide-mineral oxidation may have driven calcite dissolution within the schist after the application of gneiss leachate, because of H2SO4 production associated with sulfide oxidation (Figure 7). Therefore, we accounted for calcite dissolution and sulfide-mineral oxidation in a model wherein gneiss influent solution and residual schist porewater were mixed in the presence of HFO, while any excess sulfate in schist-transition effluent above that expected from conservative mixing was attributed to H2SO4 gained from pyrite oxidation (full details in Supplementary Materials Section S.3.2). The HFO-solution-H2SO4 system was forced to match schist effluent calcite saturation indices and pCO2 by allowing calcite dissolution-precipitation and CO2 dissolution-exsolution.
Similar to the schist-oxide modeling results, these simulations closely reproduced effluent pH, alkalinity, Ca, and sulfate concentrations in the schist-transition experiment (Figure 7). The decrease in U concentrations observed between column influent (gneiss-transition leachate) and effluent was also reproduced in this model, substantiating the hypothesis that sorption was driving U attenuation during the experiment. However, U concentrations in the model were on average 35% above measured effluent concentrations, and the model fit (RMSE = 0.012) was poorer than in the schist-oxide experiment.
We considered an additional series of simulations to assess whether the oxidation of sulfide minerals in the schist-transition column could have led to growth in HFO over time (as per Reaction (1)), and thus increased U sorption capacity during the experiment. Quantifying HFO growth as pyrite oxidation progresses is highly complex given the evolution in surface area/volume and the possible Fe-oxide phase transformation and recrystallization reactions that occur with ageing [61]. Growth in HFO was modeled by assuming that the rise in sulfate concentrations in the schist-transition column between cycles 60 and 99, which was highly linear (Supplementary Figure S9), translated to proportional and linear growth in HFO availability over time. By applying an HFO growth rate that was 1/100th the rate of per-cycle sulfate concentration increase between cycles 60 and 99, and assuming that this growth rate remained constant during Phase 3, the PHREEQC model provided a better match to experimental U data (RMSE = 0.012) (Figure 7). These simulations suggest that addition of Fe(III)-(oxyhydr)oxides during oxidation of this rock might have led to increasing U sorption capacity, while this effect was unlikely in the schist-oxide experiment where the lack of sulfide-mineral weathering precluded HFO genesis.
4.3. Simulating the Effect of Pyrite-Oxidation/Calcite-Dissolution Reactions on U Concentrations in Neutral-Rock Drainage (NRD)
Column experiments produced leachate with lower dissolved Ca and sulfate concentrations and pCO2 than those which commonly occur in full-scale waste-rock storage facilities (WRSF) that contain carbonate and sulfide minerals. Higher rock/water ratios and longer water residence times in NRD-producing WRSFs can yield Ca and sulfate concentrations in the hundreds and thousands of mg/L, respectively [23,39,40,41,42,43]. Under these conditions, gypsum (CaSO4∙2H2O) precipitation can limit the concentrations of Ca. Additionally, pCO2 can reach up to two orders of magnitude above atmospheric pCO2 in WRSFs because of carbonate-mineral dissolution and limitations on gas exchange with the atmosphere [44,62,63,64,65,66]. Given the dependence of U sorption on Ca concentrations and pCO2 [16,19,20,67], we assessed how a U-HFO system would respond in hypothetical scenarios wherein pyrite oxidation and carbonate-mineral dissolution reactions progressed to a higher degree, i.e., to the point at which Ca concentrations became controled by gypsum mineral saturation.
These scenarios correspond to a theoretical sulfide- and carbonate-rich oxidative weathering setting without any effects of transport (e.g., mixing, dilution), reaction kinetics, or other site-specific considerations (temperature, hydrology, geochemical heterogeneity, particle size or facility construction and design). Simulations were run in PHREEQC in a series of batch reactions in which a U-HFO system was titrated by incremental steps of FeS2 oxidation with infinite access to atmospheric O2 and carbonate-mineral dissolution until Ca(aq) concentrations became limited by gypsum saturation. The HFO used in these simulations and initial U(VI) abundance was that of the the gneiss-transition column because this rock released the most U in column experiments (Figure 5). The HFO of this rock was calibrated in the same way as described above for the schist sorption model (HFO calibration results in Supplementary Materials Section S.4.1). The HFO-U system was equilibrated with leachate chemistry representative of steady-state concentrations in the gneiss-transiton column (i.e., at cycle 89 of the experiment) prior to pyrite and calcite titration simulations.
Four simulations are presented (Table 2). The base case (Case 1) involved pyrite oxidation in the presence of U(VI) and HFO under atmospheric pCO2 conditions (10−3 atm) and with calcite as the carbonate mineral. In Cases 2A and 2B, we replaced calcite with a hypothetical Mg-bearing calcite of the same solubility constant as calcite (log K = −8.48) to investigate whether Mg-uranyl-carbonate complexes could sustain elevated aqueous U after Ca concentrations become controlled by gypsum saturation. In Case 2A the Ca/Mg molar ratio of the Mg-bearing calcite was fixed at 9:1, and in Case 2B this ratio was decreased to 1.5:1 to match the Ca/Mg ratios observed in the gneiss-transition leachates. In Case 4C, the effect of CO2 buildup was investigated by fixing the pCO2 to 10−2.7 atm (ca. 2000 ppm).
Table 2.
Hypothetical PHREEQC models examining U sorption behavior as a function of pyrite oxidation in a pyrite-carbonate-HFO system initially containing 0.077 mmol of U(VI) and 3.29 g/L HFO (surface area 600 m2/g, 40:1 ratio of weak:strong sorption sites).
Progressive pyrite oxidation and carbonate-mineral disolution in these simulations produced NRD conditions (pH 8.15 to pH 7.75) with Ca(aq) reaching >580 mg/L before gypsum saturation was attained (Figure 8). Alkalinity concentrations rose in all simulations to several hundred mg/L (as CaCO3), yet this rise was decoupled from U(VI) desorption. Instead, U desorption directly followed Ca(aq) concentrations, which increased until gypsum saturation was reached (Figure 8). The relationship between Ca and U release corresponds with observations and sorption modeling of the column and field-bin experiments. Reactive-transport processes in actual WRSFs tend to yield effluent with higher sulfate/Ca ratios and lower alkalinity than is presented in these models owing to the more conservative behavior of sulfate over alkalinity and Ca(aq). Nevertheless, under oxidizing conditions and in the concentration ranges of 100 to 580 mg/L Ca and 100 to 400 mg/L alkalinity (as CaCO3), these simulation highlight the role of Ca(aq) in driving U(VI) release through desorption, consistent with kinetic experiments as well as previous laboratory studies of U mobility aqueous environments [18,19,68].
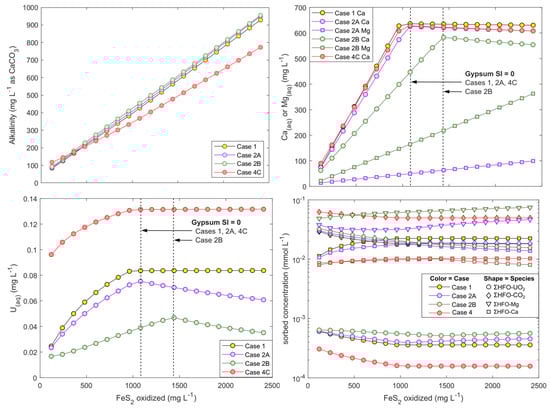
Figure 8.
Modeled alkalinity (top left), Ca and Mg (top right), and U (bottom left) concentrations, and sorbed species (bottom right) onto HFO in hypothetical batch reactions involving FeS2 oxidation in the presence of excess carbonate. Arrows indicate approximately when gypsum mineral saturation index reaches 0. The different modeling scenarios are presented in Table 2. The HFO composition that are shown at bottom right are the respective millimolar sums of all U, DIC, Mg, and Ca species that are sorbed in each simulation.
Modeled aqueous U speciation in all simulations was overwhelmingly dominated by CCU complexes (>97%). Cases 2A and 2B (with Mg-carbonate) further demonstrated that when Ca(aq) was controlled by gypsum saturation, U desorption was not exacerbated by Mg2+ release and formation of Mg-uranyl-carbonate complexes. These complexes constituted <1% of aqueous U while CCU complexes overwhelmingly dominated U speciation even after Ca(aq) concentrations were controlled by gypsum precipitation. Rather than increasing U mobility through Mg-uranyl-carbonate complexation, replacing calcite with a Mg-calcite had the opposite effect of decreasing U mobility because of lower Ca(aq) concentrations than in Case 1 in which pure (Mg-free) calcite was used (Figure 8).
Case 4 shows that at higher pCO2, U mobilization is also dependent on Ca(aq) until the point of gypsum saturation and that U sorption is subsantially weaker at higher pCO2. This result is consistent with laboratory studies that show a narrowing of the uranyl-HFO sorption envelope under elevated pCO2 and neutral pH conditions (pH ca. 7 to 8.5) [16,19,20,67].
Overall, these models emphasized the role of Ca(aq) and pCO2 on U mobility under well-buffered and oxidizing conditions.
5. Conclusions and Implications for U mobility in NRD
Weathering experiments on granite, schist, and gneiss mine wastes indicated that waste rock containing µg/g levels of U can present a source for U release, in particular under NRD conditions. Weathering experiments and geochemical simulations suggested that U release in NRD was more sensitive to dissolved Ca concentrations than to alkalinity. The combined effects of sulfide-mineral oxidation, H2SO4 generation, and carbonate-mineral dissolution generated circumneutral to alkaline-pH drainage and released Ca that promoted formation of weakly sorbing calcium-carbonato-uranyl complexes. So long as the carbonate mineral dissolution rate matches the rate of acid generation, CCU complexation and U mobilization can be sustained. Thus, fresh (unweathered) rocks sustained higher U release rates when exposed to oxidizing conditions because they released more Ca and thus enhanced CCU complexation while also having lower sorption-site availability. Conversely, oxidized rocks effectively attenuated U because of a combination of higher sorption-site availability and lower carbonate and sulfide-mineral abundances. Sequencing experiments indicated that U concentrations could, therefore, be decreased by circulating U-rich NRD into HFO-rich oxidized rocks. Overall, these results indicate that the availability of carbonate and sulfide minerals and HFO can better predict U release than solid-phase U abundances alone. Future studies of U in NRD should also consider the potential for U desorption under higher pCO2 conditions, such as those often found in full-scale WRSFs.
Supplementary Materials
The following are available online at https://www.mdpi.com/2075-163X/10/12/1104/s1, Supplementary Sections: Section S.1. Detailed methods of powder X-ray diffraction analyses [69,70]. Section S.2. Sequential chemical extraction protocol and results. Section S.3. Additional supplementary figures and tables. Section S.4. PHREEQC model description for simulation of column experiments. Supplementary Tables: Supplementary Table S1. Solid-phase composition of rocks used in column and field bin experiments. Supplementary Table S2. Geochemical reactions added to the wateq4f.dat database for PHREEQC simulations [71]. Supplementary Table S3. Uranium redox speciation determination by XANES-LCF using uranyl nitrate and uraninite as U(VI) and U(IV) standards, respectively. Supplementary Table S4. Mineralogy of rocks used in kinetic tests determined by pXRD. Supplementary Figures: Supplementary Figure S1. Schematic diagram of field-bin experiment apparatus. Supplementary Figure S2. Acid-generating potential (calculated from total-sulfur) against carbonate neutralizing potential (calculated from TIC) in drill-core samples. Supplementary Figure S3. Bivariate plots of U against As, Sb, and S by rock type for Coffee drill-core samples from the fresh weathering facies. Supplementary Figure S4. Aqueous U speciation in field-bin leachates. Supplementary Figure S5. Uranium recovered by shake-flask extractions (SFE) in schist columns. Supplementary Figure S6. Sequential chemical extraction results for residues at the end of column experiments. Supplementary Figure S7. Schematic description of equilibrium sorption modeling of column experiments in PHREEQC. Supplementary Figure S8. Measured and modeled U concentrations in schist and gneiss effluent during Phase 1. Supplementary Figure S9. Sulfate concentrations in column experiments.
Author Contributions
Conceptualization, J.W.D. and E.K.S.; Methodology, J.W.D., E.K.S., V.F.B., J.M.M.; Data Analysis, E.K.S., J.W.D., J.M.M., V.F.B., K.U.M., R.D.B.; Writing—Original Draft Preparation, E.K.S.; Writing—Review & Editing, all co-authors. All authors have read and agreed to the published version of the manuscript.
Funding
This research was conducted with contributions from Mitacs (project IT5928 and IT12366) and Lorax Environmental Services Ltd. (Vancouver, BC, Canada), the Government of Yukon, and Newmont, and an NSERC Discovery Grant awarded to J. McBeth (RGPIN-2014-03719).
Acknowledgments
The authors thank Newmont for access to samples and data used in this research. X-ray absorption spectroscopy analyses were conducted at the Canadian Light Source (CLS), which is supported by the Canada Foundation for Innovation, NSERC, the University of Saskatchewan, the Government of Saskatchewan, Western Economic Diversification Canada, the National Research Council Canada, and the Canadian Institutes of Health Research. Ning Chen and Weifeng Chen are thanked for their assistance in the operation of the HXMA beamline at the CLS. Three anonymous reviewers and David Flather provided comments to improve the manuscript.
Conflicts of Interest
E.K.S. and J.W.D. have been involved as consultants for the Government of Yukon and Newmont. The funders had no role in the design of the study; in the collection, analyses, or interpretation of data; in the writing of the manuscript; or in the decision to publish the results.
References
- Goulet, R.R.; Spry, D.J.; Fortin, C. Uranium. Fish Physiol. 2011, 31, 391–428. [Google Scholar] [CrossRef]
- Health Canada Uranium in Drinking Water—Document for Public Consultation. 2017, p. 81. Available online: https://www.canada.ca/en/health-canada/programs/consultation-uranium-drinking-water/document.html (accessed on 15 October 2018).
- Canadian Council of Ministers of the Environment Canadian Water Quality Guidelines for the Protection of Aquatic Life—Uranium. Canadian Environment Quality Guidelines. 1999. Available online: http://st-ts.ccme.ca/en/index.html?lang=en&factsheet=225 (accessed on 15 October 2018).
- Wang, Y.; Bagnoud, A.; Suvorova, E.; Mcgivney, E.; Chesaux, L.; Phrommavanh, V.; Descostes, M.; Bernier-latmani, R. Geochemical Control on Uranium(IV) Mobility in a Mining-Impacted Wetland. Environ. Sci. Technol. 2014. [Google Scholar] [CrossRef] [PubMed]
- Smedley, P.L.; Smith, B.; Abesser, C.; Lapworth, D. Uranium occurrence and behaviour in British groundwater. In British Geological Survey Groundwater Systems & Water Quality Programme Commissioned Report CR/06/050; British Geological Survey: Keyworth, Nottigham, UK, 2006; p. 48. [Google Scholar]
- Waseem, A.; Ullah, H.; Rauf, M.K.; Ahmad, I. Distribution of natural uranium in surface and groundwater resources: A review. Crit. Rev. Environ. Sci. Technol. 2015, 45, 2391–2423. [Google Scholar] [CrossRef]
- Riedel, T.; Kübeck, C. Uranium in groundwater—A synopsis based on a large hydrogeochemical data set. Water Res. 2018, 129, 29–38. [Google Scholar] [CrossRef] [PubMed]
- Kim, Y.S.; Park, H.S.; Kim, J.Y.; Park, S.K.; Cho, B.W.; Sung, I.H.; Shin, D.C. Health risk assessment for uranium in Korean groundwater. J. Environ. Radioact. 2004, 77, 77–85. [Google Scholar] [CrossRef] [PubMed]
- Banks, D.; Røyset, O.; Strand, T.; Skarphagen, H. Radioelement (U, Th, Rn) concentrations in Norwegian bedrock groundwaters. Environ. Geol. 1995, 25, 165–180. [Google Scholar] [CrossRef]
- Gascoyne, M. Hydrogeochemistry, groundwater ages and sources of salts in a granitic batholith on the Canadian Shield, southeastern Manitoba. Appl. Geochem. 2004, 19, 519–560. [Google Scholar] [CrossRef]
- Frengstad, B.; Midtgård Skrede, A.K.; Banks, D.; Reidar Krog, J.; Siewers, U. The chemistry of Norwegian groundwaters: III. The distribution of trace elements in 476 crystalline bedrock groundwaters, as analysed by ICP-MS techniques. Sci. Total Environ. 2000, 246, 21–40. [Google Scholar] [CrossRef]
- Abdelouas, A. Uranium Mill Tailings: And Environmental Impact. Elements 2006, 2, 335–342. [Google Scholar] [CrossRef]
- Langmuir, D. Uranium solution-mineral equilibria at low temperatures with applications to sedimentary ore deposits. Geochim. Cosmochim. Acta 1978, 42, 547–569. [Google Scholar] [CrossRef]
- Cumberland, S.A.; Douglas, G.; Grice, K.; Moreau, J.W. Uranium mobility in organic matter-rich sediments: A review of geological and geochemical processes. Earth Sci. Rev. 2016, 159, 160–185. [Google Scholar] [CrossRef]
- Brown, S.T.; Basu, A.; Ding, X.; Christensen, J.N.; Depaolo, D.J. Uranium isotope fractionation by abiotic reductive precipitation. Proc. Natl. Acad. Sci. USA 2018, 115, 8688–8693. [Google Scholar] [CrossRef] [PubMed]
- Waite, T.D.; Davis, J.A.; Payne, T.E.; Waychunas, G.A.; Xu, N. Uranium(VI) adsorption to ferrihydrite: Application of a surface complexation model. Geochim. Cosmochim. Acta 1994, 58, 5465–5478. [Google Scholar] [CrossRef]
- Dublet, G.; Lezama Pacheco, J.; Bargar, J.R.; Fendorf, S.; Kumar, N.; Lowry, G.V.; Brown, G.E. Partitioning of uranyl between ferrihydrite and humic substances at acidic and circum-neutral pH. Geochim. Cosmochim. Acta 2017, 215, 122–140. [Google Scholar] [CrossRef]
- Stewart, B.D.; Mayes, M.A.; Fendorf, S.S. Impact of Complexes on Uranium(VI) Adsorption to Synthetic and Natural Sediments. Environ. Sci. Technol. 2010, 44, 928–934. [Google Scholar] [CrossRef] [PubMed]
- Fox, P.M.; Davis, J.A.; Zachara, J.M. The effect of calcium on aqueous uranium(VI) speciation and adsorption to ferrihydrite and quartz. Geochim. Cosmochim. Acta 2006, 70, 1379–1387. [Google Scholar] [CrossRef]
- Kobayashi, Y.; Fukushi, K.; Kosugi, S. A Robust Model for Prediction of U(VI) Adsorption onto Ferrihydrite Consistent with Spectroscopic Observations. Environ. Sci. Technol. 2020, 54, 2304–2313. [Google Scholar] [CrossRef]
- Tournassat, C.; Tinnacher, R.M.; Grangeon, S.; Davis, J.A. Modeling uranium(VI) adsorption onto montmorillonite under varying carbonate concentrations: A surface complexation model accounting for the spillover effect on surface potential. Geochim. Cosmochim. Acta 2018, 220, 291–308. [Google Scholar] [CrossRef]
- Bachmaf, S.; Planer-Friedrich, B.; Merkel, B.J. Effect of sulfate, carbonate, and phosphate on the uranium(VI) sorption behavior onto bentonite. Radiochim. Acta 2008, 96, 359–366. [Google Scholar] [CrossRef]
- Blowes, D.W.; Ptacek, C.J.; Jambor, J.L.; Weisener, C.G.; Paktunc, D.; Gould, W.D.; Johnson, D.B. The Geochemistry of Acid Mine Drainage. In Treatise on Geochemistry, 2nd ed.; Elsevier Ltd.: Amsterdam, The Netherlands; Oxford, UK; Waltham, MA, USA, 2014; Volume 11, ISBN 9780080983004. [Google Scholar]
- Dong, W.; Brooks, S. Determination of the Formation Constants of Ternary Complexes of Uranyl and Carbonate with Alkaline Ba Earth Metals (Mg2+, Ca2+, Sr2+, and Ba2+) Using Anion Exchange Method. Environ. Sci. Technol. 2006, 40, 4689–4695. [Google Scholar] [CrossRef]
- Bernhard, G.; Geipel, G.; Brendler, V.; Nitsche, H. Speciation of uranium in seepage waters of a mine tailing pile studied by tine-resolved laser-induced fluorescence spectroscopy (TRLFS). Radiochim. Acta 1996, 74, 87–91. [Google Scholar] [CrossRef]
- Langmuir, D. Adsorption of uranyl onto ferric oxyhydroxides: Application of the surface complexation site-binding model. Geochim. Cosmochim. Acta 1985, 49, 1931–1941. [Google Scholar] [CrossRef]
- Noubactep, C.; Chen-Braucher, D.; Schlothauser, T. Uranium release from a natural rock under near-natural oxidizing conditions. Eng. Life Sci. 2006, 267, 591–602. [Google Scholar] [CrossRef][Green Version]
- Blake, J.M.; Avasarala, S.; Ali, A.M.S.; Spilde, M.; Lezama-Pacheco, J.S.; Latta, D.; Artyushkova, K.; Ilgen, A.G.; Shuey, C.; Nez, C.; et al. Reactivity of As and U co-occurring in Mine Wastes in northeastern Arizona. Chem. Geol. 2019, 522, 26–37. [Google Scholar] [CrossRef] [PubMed]
- Bain, J.G.; Mayer, K.U.; Blowes, D.W.; Frind, E.O. Modelling the closure-related geochemical evolution of groundwater at a former uranium mine. J. Contam. Hydrol. 2001, 52, 109–135. [Google Scholar] [CrossRef]
- Boekhout, F.; Gérard, M.; Kanzari, A.; Michel, A.; Déjeant, A.; Galoisy, L.; Calas, G.; Descostes, M. Uranium migration and retention during weathering of a granitic waste rock pile. Appl. Geochem. 2015, 58, 123–135. [Google Scholar] [CrossRef]
- Gómez, P.; Garralón, A.; Buil, B.; Turrero, M.J.; Sánchez, L.; de la Cruz, B. Modeling of geochemical processes related to uranium mobilization in the groundwater of a uranium mine. Sci. Total Environ. 2006, 366, 295–309. [Google Scholar] [CrossRef] [PubMed]
- Larson, L.N.; Kipp, G.G.; Mott, H.V.; Stone, J.J. Applied Geochemistry Sediment pore-water interactions associated with arsenic and uranium transport from the North Cave Hills mining region, South Dakota, USA. Appl. Geochem. 2012, 27, 879–891. [Google Scholar] [CrossRef]
- Singh, S.P.; Hendry, M.J. Solid-phase distribution and leaching behaviour of nickel and uranium in a uranium waste-rock piles. Water Air Soil Pollut. 2013, 224. [Google Scholar] [CrossRef]
- Tayal, A.; Conradson, S.D.; Kanzari, A.; Lahrouch, F.; Descostes, M.; Gerard, M. Uranium speciation in weathered granitic waste rock piles: An XAFS investigation. RSC Adv. 2019, 9, 11762–11773. [Google Scholar] [CrossRef]
- Troyer, L.D.; Stone, J.J.; Borch, T. Effect of biogeochemical redox processes on the fate and transport of As and U at an abandoned uranium mine site: An X-ray absorption spectroscopy study. Environ. Chem. 2014, 11, 18–27. [Google Scholar] [CrossRef]
- Yin, M.; Dong, X.; Li, H.; Chen, Y.; Xiao, T.; Sun, J.; Song, G.; Liu, J.; Belshaw, N.; Xiao, E.; et al. Mechanism of uranium release from uranium mill tailings under long-term exposure to simulated acid rain: Geochemical evidence and environmental implication. Environ. Pollut. 2018, 244, 174–181. [Google Scholar] [CrossRef]
- Campbell, K.M.; Gallegos, T.J.; Landa, E.R. Biogeochemical aspects of uranium mineralization, mining, milling, and remediation. Appl. Geochemistry 2015, 57, 206–235. [Google Scholar] [CrossRef]
- International Network for Acid Prevention (INAP) Global Acid Rock Drainage Guide (GARD Guide). Available online: http://www.gardguide.com (accessed on 2 November 2020).
- Blowes, D.W.; Jambor, J.L.; Hanton-Fong, C.J.; Lortie, L.; Gould, W.D. Geochemical, mineralogical and microbiological characterization of a sulphide-bearing carbonate-rich gold-mine tailings impoundment, Joutel, Quebec. Appl. Geochem. 1998, 13, 687–705. [Google Scholar] [CrossRef]
- Vriens, B.; Peterson, H.; Laurenzi, L.; Smith, L.; Aranda, C.; Mayer, K.U.; Beckie, R.D. Chemosphere Long-term monitoring of waste-rock weathering at the Antamina mine, Peru. Chemosphere 2020, 215, 858–869. [Google Scholar] [CrossRef] [PubMed]
- Majzlan, J.; Števko, M.; Chovan, M.; Luptáková, J.; Milovská, S.; Milovský, R.; Jeleň, S.; Sýkorová, M.; Pollok, K.; Göttlicher, J.; et al. Mineralogy and geochemistry of the copper-dominated neutral mine drainage at the Cu deposit Ľubietová-Podlipa (Slovakia). Appl. Geochem. 2018, 92, 59–70. [Google Scholar] [CrossRef]
- Shahhosseini, M.; Doulati Ardejani, F.; Baafi, E. Geochemistry of rare earth elements in a neutral mine drainage environment, Anjir Tangeh, northern Iran. Int. J. Coal Geol. 2017, 183, 120–135. [Google Scholar] [CrossRef]
- Abongwa, P.T.; Atekwana, E.A.; Puckette, J.O. Hydrogeochemical Investigation of Metal Evolution in Circum-Neutral Mine Discharge. Water Air Soil Pollut. 2020, 231. [Google Scholar] [CrossRef]
- Kříbek, B.; Sracek, O.; Mihaljevič, M.; Knésl, I.; Majer, V. Geochemistry and environmental impact of neutral drainage from an uraniferous coal waste heap. J. Geochem. Explor. 2018, 191, 1–21. [Google Scholar] [CrossRef]
- Kanzari, A.; Gérard, M.; Boekhout, F.; Galoisy, L.; Calas, G.; Descostes, M. Impact of incipient weathering on uranium migration in granitic waste rock piles from former U mines (Limousin, France). J. Geochem. Explor. 2017, 183, 114–126. [Google Scholar] [CrossRef]
- Yin, M.; Tsang, D.C.W.; Sun, J.; Wang, J.; Shang, J.; Fang, F.; Wu, Y.; Liu, J.; Song, G.; Xiao, T.; et al. Critical insight and indication on particle size effects towards uranium release from uranium mill tailings: Geochemical and mineralogical aspects. Chemosphere 2020, 250, 126315. [Google Scholar] [CrossRef] [PubMed]
- Liu, B.; Peng, T.; Sun, H.; Yue, H. Release behavior of uranium in uranium mill tailings under environmental conditions. J. Environ. Radioact. 2017, 171, 160–168. [Google Scholar] [CrossRef] [PubMed]
- Li, Z.; Hadioui, M.; Wilkinson, K.J. Conditions affecting the release of thorium and uranium from the tailings of a niobium mine. Environ. Pollut. 2019, 247, 206–215. [Google Scholar] [CrossRef] [PubMed]
- MacWilliam, K. The Geology and Genesis of the Coffee Gold Deposit in West-Central Yukon, Canada: Implications for the Structural, Magmatic, and Metallogenic Evolution of the Dawson Range and Gold Exploration Models. Ph.D. Thesis, University of British Columbia, Vancouver, BC, Canada, 2018; 497p. [Google Scholar]
- Wainwright, A.J.; Simmons, A.T.; Finnigan, C.S.; Smith, T.R.; Carpenter, R.L. Geology of new gold discoveries in the Coffee Creek area, White Gold District, west-central Yukon. In Yukon Exploration and Geology; Yukon Geological Servey: Whitehorse, YT, Canada, 2010; pp. 233–248. Available online: http://data.geology.gov.yk.ca/Reference/50358#InfoTab (accessed on 8 December 2020).
- Skierszkan, E.K.; Dockrey, J.W.; Mayer, K.U.; Beckie, R.D. Release of geogenic uranium and arsenic results in water-quality impacts in a subarctic permafrost region of granitic and metamorphic geology. J. Geochem. Explor. 2020, 17. [Google Scholar] [CrossRef]
- Ravel, B.; Newville, M. ATHENA, ARTEMIS, HEPHAESTUS: Data analysis for X-ray absorption spectroscopy using IFEFFIT. J. Synchrotron Radiat. 2005, 12, 537–541. [Google Scholar] [CrossRef]
- Vriens, B.; Skierszkan, E.K.; St-Arnault, M.; Salzsauler, K.; Aranda, C.; Mayer, K.U.; Beckie, R.D. Mobilization of Metal(oid) Oxyanions through Circumneutral Mine Waste-Rock Drainage. ACS Omega 2019, 4, 10205–10215. [Google Scholar] [CrossRef]
- Hirsche, D.T.; Blaskovich, R.; Mayer, K.U.; Beckie, R.D. A study of Zn and Mo attenuation by waste-rock mixing in neutral mine drainage using mixed-material field barrels and humidity cells. Appl. Geochem. 2017, 84, 114–125. [Google Scholar] [CrossRef]
- Tessier, A.; Campbell, P.G.C.; Bisson, M. Sequential Extraction Procedure for the Speciation of Particulate Trace Metals. Anal. Chem. 1979, 51, 844–851. [Google Scholar] [CrossRef]
- Parkhurst, D.L.; Appelo, C.A.J. PHREEQC Version 3—A Computer Program for Speciation, Batch-Reaction, One-Dimensional Transport, and Inverse Geochemical Calculations. Available online: https://wwwbrr.cr.usgs.gov/projects/GWC_coupled/phreeqci/ (accessed on 15 November 2017).
- Mahoney, J.J.; Cadle, S.A.; Jakubowski, A.T. Uranyl adsorption onto hydrous ferric oxides—A re-evaluation for the diffuse layer model database. Environ. Sci. Technol. 2009, 43, 9260–9266. [Google Scholar] [CrossRef]
- Dzombak, D.A.; Morel, F. Surface Complexation Modeling: Hydrous Ferric Oxide; John Wiley & Sons: New York, NY, USA, 1990; ISBN 978-0-471-63731-8. [Google Scholar]
- Rudnick, R.L.; Gao, S. Composition of the Continental Crust. In Treatise on Geochemistry, 2nd ed.; Elsevier Ltd.: Amsterdam, The Netherlands; Oxford, UK; Waltham, MA, USA, 2014; Volume 4, ISBN 9780080983004. [Google Scholar]
- Dockrey, J.; Flather, D.; Findlater, L.; Jackson, S.; Helsen, J.; Scott, J.; Gjertsen, J. Elevated Uranium and Arsenic Concentrations in Baseline Water Quality at the Coffee Gold Project: Implications for Geochemical Predictions. In Proceedings of the 24th Annual BC MEND ML/ARD Workshop, Vancouver, BC, Canada, 29–30 November 2017. [Google Scholar]
- Cornell, R.M.; Schwertmann, H.C.U. The Iron Oxides: Structure, Properties, Reactions, Occurences and Uses, 1st ed.; Wiley-VCH Verlag GmbH & Co. KGaA: Weinheim, Germany, 2003. [Google Scholar]
- Lorca, M.E.; Mayer, K.U.; Pedretti, D.; Smith, L.; Beckie, R.D. Spatial and Temporal Fluctuations of Pore-Gas Composition in Sulfidic Mine Waste Rock. Vadose Zone J. 2016, 15. [Google Scholar] [CrossRef]
- Appels, W.M.; Wall, S.N.; Barbour, S.L.; Hendry, M.J.; Nichol, C.F.; Chowdhury, S.R. Pyrit Verwitterung im rekultivierten Abraum aus Schiefergestein eines Ölsandförderbetriebes in der Nähe von Fort McMurray, Kanada. Mine Water Environ. 2017, 36, 479–494. [Google Scholar] [CrossRef]
- Birkham, T.K.; Hendry, M.J.; Wassenaar, L.I.; Mendoza, C.A.; Seok Lee, E. Characterizing geochemical reactions in unsaturated mine waste-rock piles using gaseous O2, CO2, 12CO2, and 13CO2. Environ. Sci. Technol. 2003, 37, 496–501. [Google Scholar] [CrossRef] [PubMed]
- Vriens, B.; Arnault, M.S.; Laurenzi, L.; Smith, L.; Mayer, K.U.; Beckie, R.D. Localized Sulfide Oxidation Limited by Oxygen Supply in a Full-Scale Waste-Rock Pile. Vadose Zone J. 2018, 17, 180119. [Google Scholar] [CrossRef]
- Heikkinen, P.M.; Räisänen, M.L.; Johnson, R.H. Geochemical characterisation of seepage and drainage water quality from two sulphide mine tailings impoundments: Acid mine drainage versus neutral mine drainage. Mine Water Environ. 2009, 28, 30–49. [Google Scholar] [CrossRef]
- Morrison, S.J.; Spangler, R.R.; Tripathi, V.S. Adsorption of uranium(VI) on amorphous ferric oxyhydroxide at high concentrations of dissolved carbon(IV) and sulfur(VI). J. Contam. Hydrol. 1995, 17, 333–346. [Google Scholar] [CrossRef]
- Stewart, B.D.; Amos, R.T.; Nico, P.S.; Fendorf, S. Influence of uranyl speciation and iron oxides on uranium biogeochemical redox reactions. Geomicrobiol. J. 2011, 28, 444–456. [Google Scholar] [CrossRef]
- Toby, R.H.; Von Dreele, R.B. GSAS-II: The genesis of a modern open-source all purpose crystallography software package. J. Appl. Crystallogr. 2013, 46, 544–549. [Google Scholar] [CrossRef]
- Rietveld, H.M. A profile refinement method for nuclear and magnetic structures. J. Appl. Crystallogr. 1969, 2, 65–71. [Google Scholar] [CrossRef]
- Appelo, C.A.J.; Van der Weiden, M.J.J.; Tournassat, C.; Charlet, L. Surface complexation of ferrous iron and carbonate on ferrihydrite and the mobilization of arsenic. Environ. Sci. Technol. 2002, 36, 3096–3103. [Google Scholar] [CrossRef]


Publisher’s Note: MDPI stays neutral with regard to jurisdictional claims in published maps and institutional affiliations. |
© 2020 by the authors. Licensee MDPI, Basel, Switzerland. This article is an open access article distributed under the terms and conditions of the Creative Commons Attribution (CC BY) license (http://creativecommons.org/licenses/by/4.0/).