Article

Hyperspectral Characteristics of Oil Sand, Part 2: Prediction of Froth Characteristics from Measurements of Froth

1
Department of Earth and Atmospheric Sciences, University of Alberta, Edmonton, AB T6G 2E3, Canada
2
Department of Chemical Engineering, Queen’s University, Kingston, ON K7L 3N6, Canada
3
Enbridge Inc., Calgary, AB T2P 3L8, Canada
4
Department of Mechanical Engineering, University of Alberta, Edmonton, AB T6G 2E3, Canada
*
Author to whom correspondence should be addressed.
Minerals 2020, 10(12), 1137; https://doi.org/10.3390/min10121137
Submission received: 26 November 2020 / Revised: 15 December 2020 / Accepted: 16 December 2020 / Published: 18 December 2020
(This article belongs to the Special Issue Mineral-Organic Interactions Related to Oil Sands Processing)

Abstract

:
This is the second part of a study of predictive models of oil sand ore and froth characteristics using infrared hyperspectral data as a potential new means for process control. In Alberta, Canada, bitumen in shallow oil sands deposits is accessed by surface mining and then extracted from ore using flotation processes. The ore displays variability in the clay, bitumen, and fines content and this variability affects the separability and product quality in flotation units. Flotation experiments were performed on a set of ore samples of different types to generate froth and determine the ore processability (e.g., separation performance) and froth characteristics (bitumen and solids content, fines distribution). We show that point spectra and spectral imagery of good quality can be acquired rapidly (<1 s and <15 s, respectively) and these capture spectral features diagnostic of bitumen and solids. Ensuing models can predict the solids/bitumen (r2 = 0.88) and the %fines and ultrafines (particle passing at 3.9 and 0.5 µm) content of froth (r2 = 0.8 and 0.9, respectively). The latter model could be used to reject froth with a high solids content. Alternately, the strength of the illite-smectite absorption observed in froth could be used to retain all the samples above a pre-defined processability. Given that point spectrometers can currently be acquired for less than half the cost of an imaging system, we recommend the use of the former for future trials in operating environments.

1. Introduction

Flotation is one of the most common methods used to separate valuable minable material (e.g., oil, minerals, metals) from waste rock [1]. Machine vision analysis of froths in flotation cells has been explored to assess the general state of the flotation cells. Froth color information is exploited across mining sectors and related to grades [2,3]. In a mineral setting [4], visible near-infrared reflectance spectroscopy (0.4–1.0 µm) was combined with X-ray fluorescence analysis to assess the mineral slurry contents in copper and zinc. In a subsequent study [5], data in the same spectral range were used to establish quantitative mineral information in a slurry at an iron ore mine which was then combined with laser-induced breakdown spectroscopy (LIBS) and X-ray fluorescence (XRF) information to improve the estimation of the onstream mineral content.
As stated in our companion paper, oil sands are comprised of bitumen, solid particles, and water [6,7,8], and the Clark hot water extraction process is the common flotation method for extracting bitumen from oil sands and water slurry [8,9]. The ore deposits of the Athabasca oil sands in Alberta are not homogeneous, and thus considerable variability in the clay, bitumen, and fines content [10] is seen in ores, which can affect their behavior in flotation units. Ore grade instruments are in commercial use and employ a small number of spectral bands to estimate the bitumen content of ore on conveyors during transport from the mine to an on-site bitumen separation plant. Using a series of flotation experiments, our companion paper examined the use of the reflectance spectra of Athabasca oil sands ore to generate predictive models of ore processability (the expected fraction of bitumen that can be separated in the process), froth color (as a qualitative metric of froth quality, primarily related to mineral contamination), and froth solids to bitumen content (as a quantitative metric). These models are meant to enable the real-time assessment of the incoming feedstock and the expected flotation performance, based on observations of ore in a mine. In the current paper, we expand the flotation experiments and use hyperspectral observations from froth to predict the froth properties for the real-time assessment of froth quality in the flotation cell. We know of no investigation regarding the feasibility of using infrared spectroscopy for the characterization of oil sand froth, thus this study is a primary contribution to the spectroscopy of oil sand froth.
Several studies have reported the associations between clay and bitumen with regard to ore processing [11,12,13] and the effects of clay swelling potential [14,15,16] on bitumen extraction. Several authors have discussed the effect of particle size on extraction, observing that various types of mixed-layer kaolinite-smectite and illite-smectite clays increase in the finer size fractions. Such clays in Athabasca oil sands were documented by Omotoso et al. [12], showing that their abundance far exceeds that of pure kaolinite and pure illite. Wallace et al. [14], examining the chemical composition of the aqueous phase in oil sands slurries, reported an association between elevated soluble potassium and poor recoveries, suggesting an association with degraded (e.g., de-potassified) illite exhibiting swelling properties akin to that of montmorillonite and leading to an accumulation of solids in froth and the poor processing of oil sands. In an earlier work [17], it was noted that the accumulation of fine solids would have a measurable impact on the extractability if the oil sand ore contained sufficient fines to interfere with recovery.
Given our focus on oil sand froth, the current study targets the prediction of the solids to bitumen ratio and the fines and ultrafines characteristics (percent passing at 3.9 µm and 0.5 µm particle size or pp3.9, pp0.5) of froth examined in parallel with the ore processability. Given past literature linking clay type to recovery, we examine the spectral characteristics of froth in the context of clay types as they relate to froth characteristics and ore processability. With a mindset of assessing the use of hyperspectral technologies to guide the process control of froth quality in a flotation cell, we also examine the relative merit of using spectral imagery across the surface of the cell as opposed to point measurements.

2. Materials

Two sample suites with various bitumen contents and particle size distributions were selected for flotation experiments in a laboratory setting. All the samples were stored at a temperature of −20 °C to prevent the loss of water and aromatic components.
The first sample suite, used in our companion paper to establish sample processability, consisted of ten samples selected by mine geologists during routine mining operations at a number of mines of the Athabasca oil sands in Alberta, Canada, with the expectation that the samples would span a range of processability values. These samples represent a range of depositional environments (fluvial, estuarine, and marine) (Sp#1–Sp#10, Table 1). The total bitumen content (TBC) for these ten samples spans from 7.06% to 14.85% (≤0.5% analytical error), and the fines content spans from 2.44% to 46.24% (pp44 measured as percent passing at 44 µm particle size), 2.11% to 16.00% (pp3.9), and 0% to 0.94% (pp0.5). The samples cover a range of bitumen and fines contents (Table 1) and have a variability in processability (0.28–0.90, Table 2). The flotation experimental data (ore in Table 1 and froth in Table 2) for these 10 samples were reported in our companion study, based on batch separation trials in a Denver cell (for which the method is described in detail below), in an investigation of the use of the infrared spectra of ore to predict froth characteristics. They are included here as background data to facilitate comparison with data of the second sample suite and supplemented with the fines and ultrafines data (pp3.9 for ore, pp0.5 for ore and froth) of particular relevance to the assessment of froth quality.
The second sample suite consists of twenty oil sands samples obtained from a single mine in Alberta (Sp#11–Sp#30, Table 1). The TBC for these samples spans from 1.84% to 16.01% and the fines content spans from 5.16% to 59.45% (pp44), 1.88% to 18.38% (pp3.9), and 0.23% to 1.83% (pp0.5).
Both ore sample suites, despite their different mine provenance, display similar patterns of decreasing fines content with increasing bitumen (TBC, Figure 1), but the ultrafines data (pp0.5) reveal distinct relationships with TBC (Figure 1) and pp3.9 (Figure 2) for both suites, with the first suite displaying lower contents in pp0.5. As expected, the content of ultrafines (pp0.5) is generally related to that of fines (pp3.9). Fines data were provided by industrial collaborators, and both sample suites were sourced from different collaborators. Therefore, we cannot discount that differences in the ultrafines content between both suites are attributable to differences in the measurement methods.
Prior to the flotation experiment, all the samples were allowed to equilibrate to room temperature and each sample was crushed with a comil and homogenized. Four subsamples were generated (300 g each) for the flotation test. A Dean–Stark analysis [18] was conducted on an additional 300 g subset of each sample to measure the weight percent of bitumen, water, and solids, and the fines content below 44 (pp44), 3.9 (pp3.9), and 0.5 (pp0.5) microns was also determined (Table 1). The Dean–Stark analysis is conducted commercially and involves the extraction of bitumen by distillation using a solvent. The outcome is a measurement of percent by volume of water, bitumen, and solids. Particle size was determined with a laser diffraction particle size analyzer (Beckman Coulter LS series, Brea, CA, USA).

3. Methods

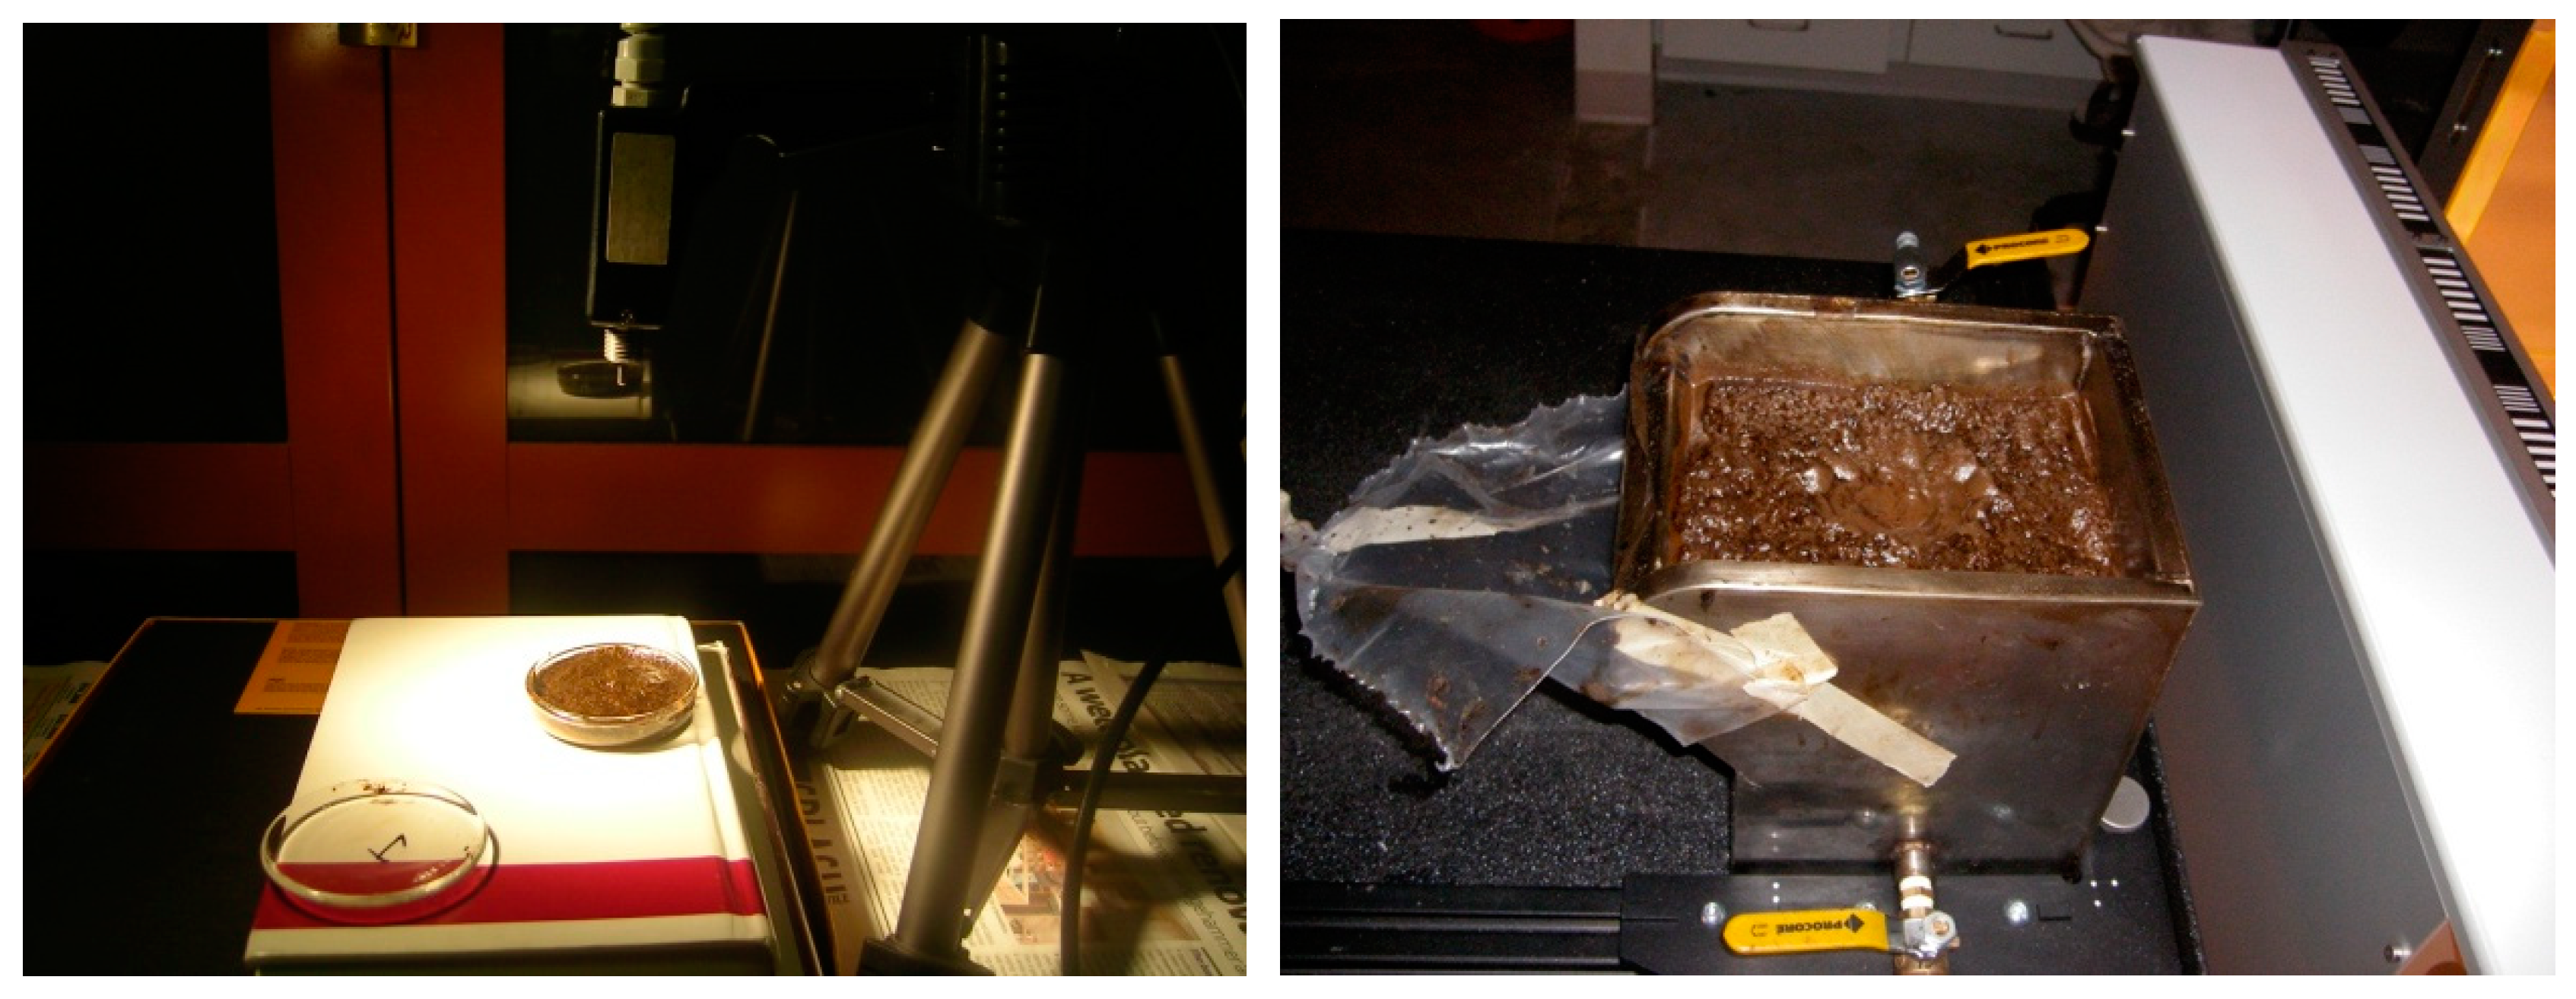
3.1. Flotation Experiments

Our companion paper provides a detailed description of the apparatus used for the flotation experiments of this study, as well as the operating conditions implemented to generate the froth for the first sample suite. Since the samples for this suite were the first to be subjected to a flotation experiment, four experimental conditions were utilized, and the froth compositional data (Table 2) as well as the spectral data are the average measurement for the four conditions. The froth samples generated for the four operating conditions (a total of 40 froths for 10 ore samples for sample suite 1) underwent a Dean–Stark analysis to determine their mass content of bitumen, water, and solids. The ore processability, further discussed in our companion paper, was then determined as the ratio of the total bitumen extractable from the froth to that of ore, also averaged for each sample for the four flotation conditions. The froth solids were then used for the determination of the fines and ultrafines content (Table 2). Flotation experiments were conducted using a 2 L Metso Denver flotation cell, in which 300 g of homogenized oil sand was mixed with 950 mL of untreated tap water and agitated by an impeller. The froth compositional data and froth infrared point spectra, described below, obtained for the first sample suite were used to establish predictive models of froth characteristics. These models were then applied to the froth imagery of both sample suites.
The froth imagery of both sample suites was obtained at a later stage. Following the initial use of four experimental conditions for the first sample suite, a single condition was selected for the flotation experiments involving both sample suites. For this condition, the speed of the impeller and the aeration rate were set at 1800 rpm and 100 mL/min, respectively, because these were deemed to represent the optimal operating conditions for achieving a high recovery of bitumen during the flotation process for the unit employed. The flotation process of each experimental run took about 15 min to complete. No Dean–Stark analysis or fines content determination was obtained for these froths.

3.2. Acquisition of Reflectance Spectra

Spectral measurements of froth were acquired for both sample suites. In the initial flotation experiments for the first sample suite (Sp#1–Sp#10), froth was transferred to a glass jar 6 cm in diameter and 2 cm in depth (Figure 3, left photo). A Panalytical FieldSpec FR portable spectrometer (Malvern Panalytical, Malvern, UK) positioned with a nadir view of the froth collected visible and near infra-red (VNIR) spectral reflectance from 0.35 to 2.50 µm (2151 bands). Illumination was provided by a tripod-mounted 50W quartz-halogen light positioned at a 30° incident angle. The footprint of the froth viewed by the instrument was 2 cm in diameter and a spectrum was collected from three to six different footprints. The spectrum of each footprint was collected within one second and consisted of the average of 25 co-adds to minimize signal noise. Each sample spectrum was normalized to that of a SpectralonTM panel (99% reflectance, Labsphere Inc, Sutton, NH, USA) to obtain a reflectance spectrum. The resulting reflectance spectra (4–6 footprints per run, 4 runs) were averaged to provide a single representative spectrum for each froth of the 10 samples. An average reflectance spectrum was also obtained for the froth solids (3 footprints per sample) of each sample following Dean–Stark analysis.
For the later stage flotation experiments on all samples, immediately after the removal of theimpeller the flotation cell was transferred to a shortwave infrared (0.96–2.50 µm) hyperspectral imaging instrument (SisuROCK™ by Specim, Oulu, Finland). The flotation cell resided on a sliding platform (Figure 3, right photo) that moved past a hyperspectral line camera. The instrument contains a 256 spectral by 320 spatial pixels mercury-cadmium-telluride detector array and yields data at a 6.3 nm sampling rate and 10 nm spectral bandwidth. The spatial resolution of the imagery was 550 µm per pixel. For each image acquisition, dark current and a 99% reflectance Spectralon™ white panel (made of polytetrafluoroethylene) were measured. Dark current data were subtracted from all data, and these were then divided by the spectrum of the white panel to obtain a reflectance spectrum for each image pixel.

3.3. Spectral Processing with Wavelet Analysis

As described in our companion paper, we make use of a continuous wavelet transform (CWT) to preprocess the point spectra and hyperspectral imagery prior to the selection of spectral features that best correlate with a given froth metric (e.g., solids/bitumen). Greater detail on the rationale for use of the CWT and further detail on the methodology can be found in our companion paper. Each spectrum (point or image) was transformed into 10 wavelet scales with low-scale power spectra best capturing mineral/bitumen features and high-scale power spectra capturing the overall continuum of the reflectance spectrum [19].
For predictive model development we examined the correlation coefficient between the wavelet power at each of the 2151 wavelengths (point spectra) and ten scales with a known metric (e.g., solids/bitumen) for the data of the first sample suite (10 samples). This process resulted in a correlation coefficient (Rfeature) at each wavelength and scale and a threshold (typically Rfeature = 0.55–0.80) was applied to retain the features of highest correlation. From these, three and four features of highest correlation were used for predictive modeling using a multiple regression technique. The features retained encompassed the spectral range of the imaging system (e.g., >1 µm) and thus the models could be readily applied to imagery.
The predictive models were then applied to the imagery of both sample suite to produce an image map of a given predicted parameter. In this study models were pursued for the prediction of froth solids to bitumen ratio, pp3.9, pp0.5, and ore processability.

4. Results

4.1. Sample Suite #1 (10 Samples for Model Development)

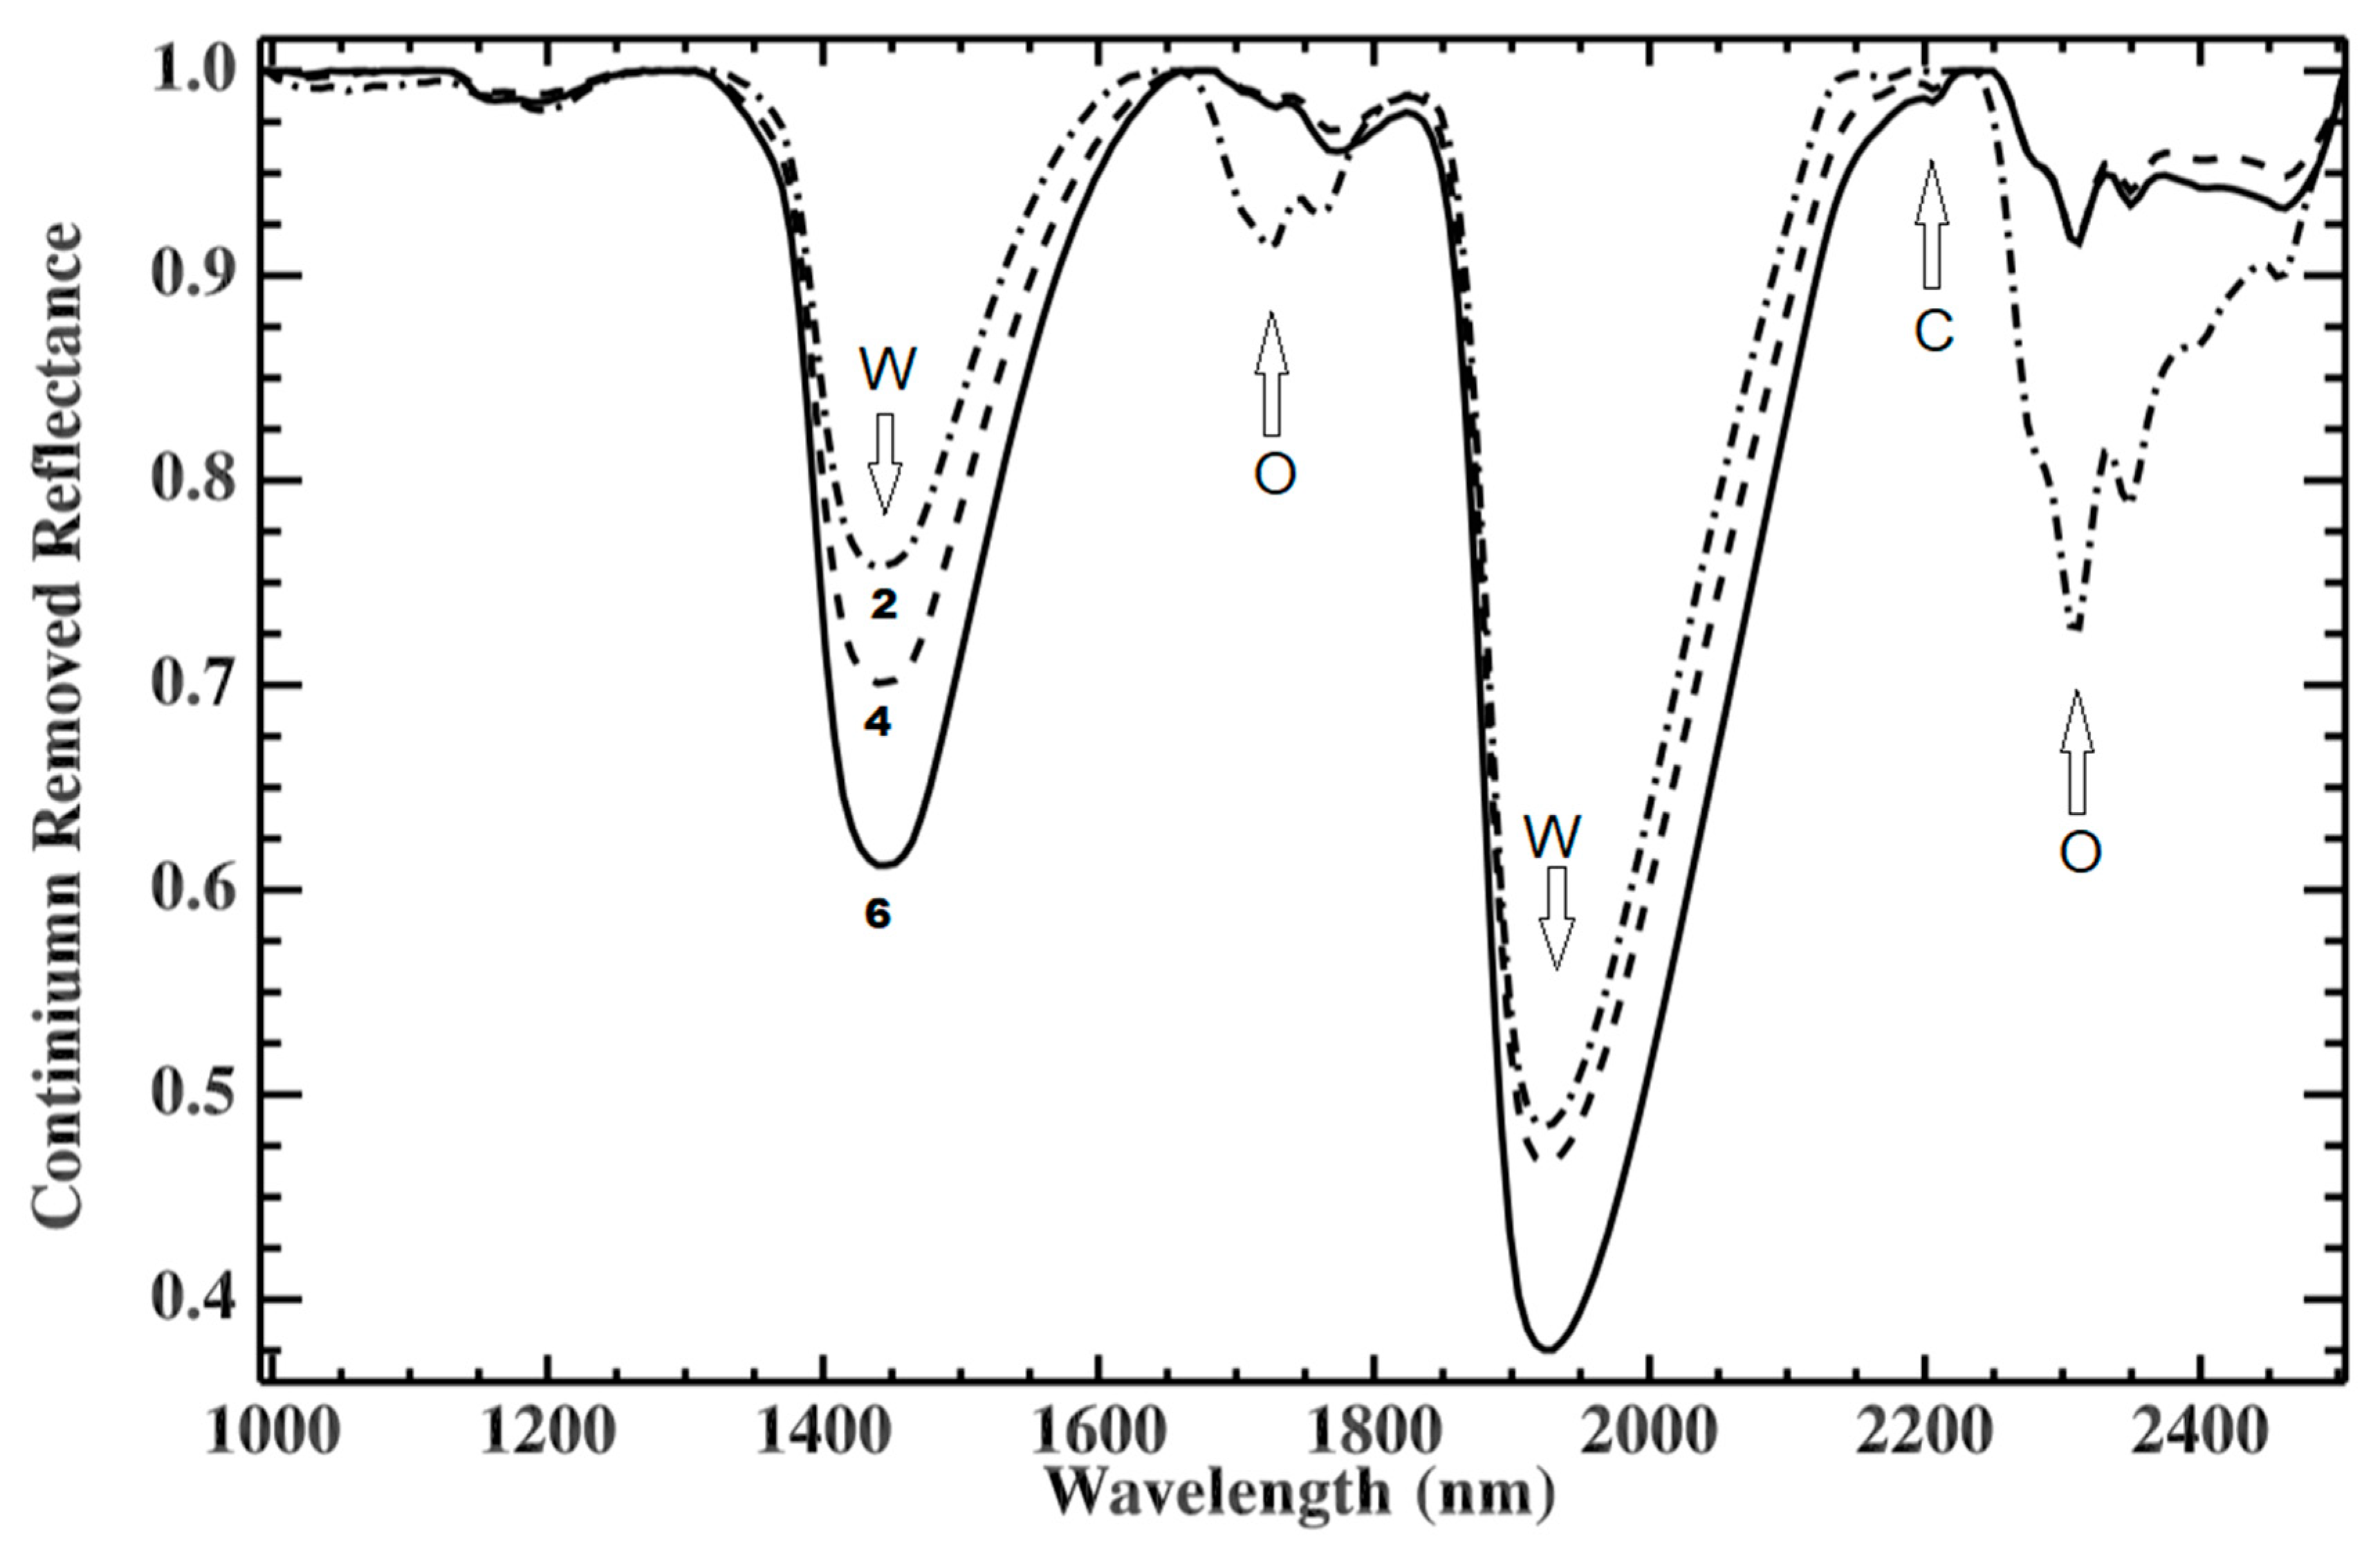
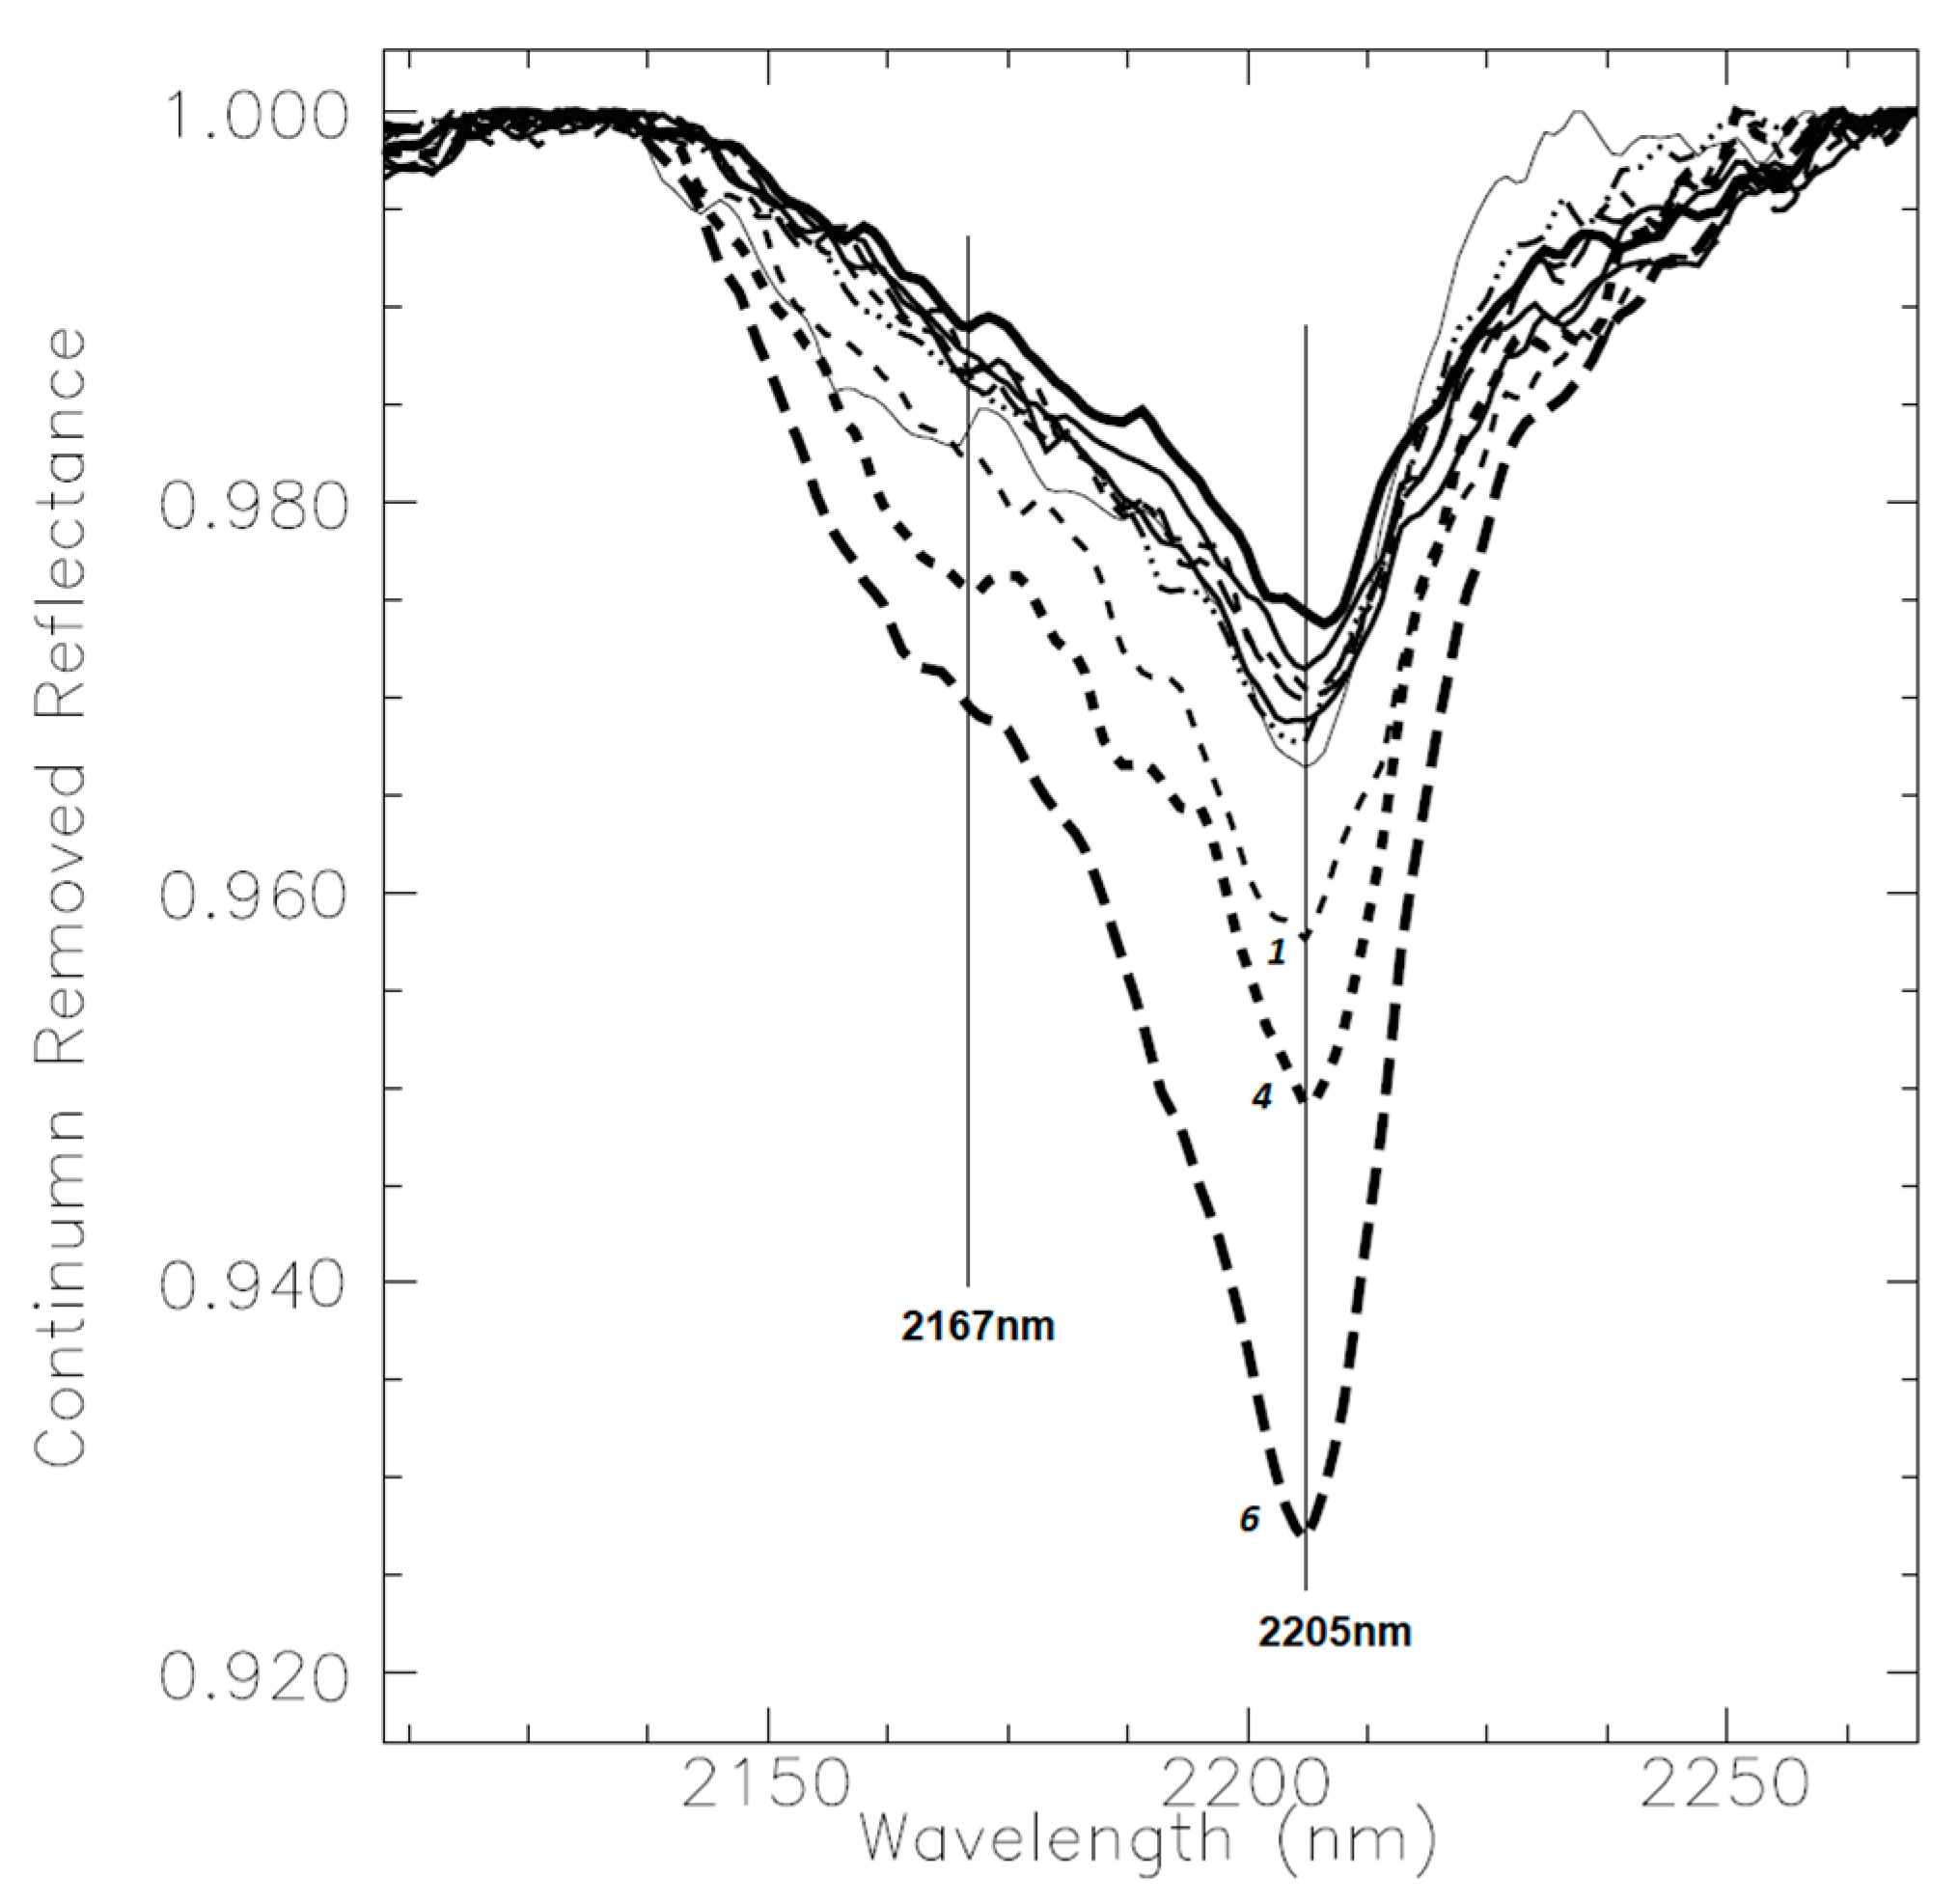
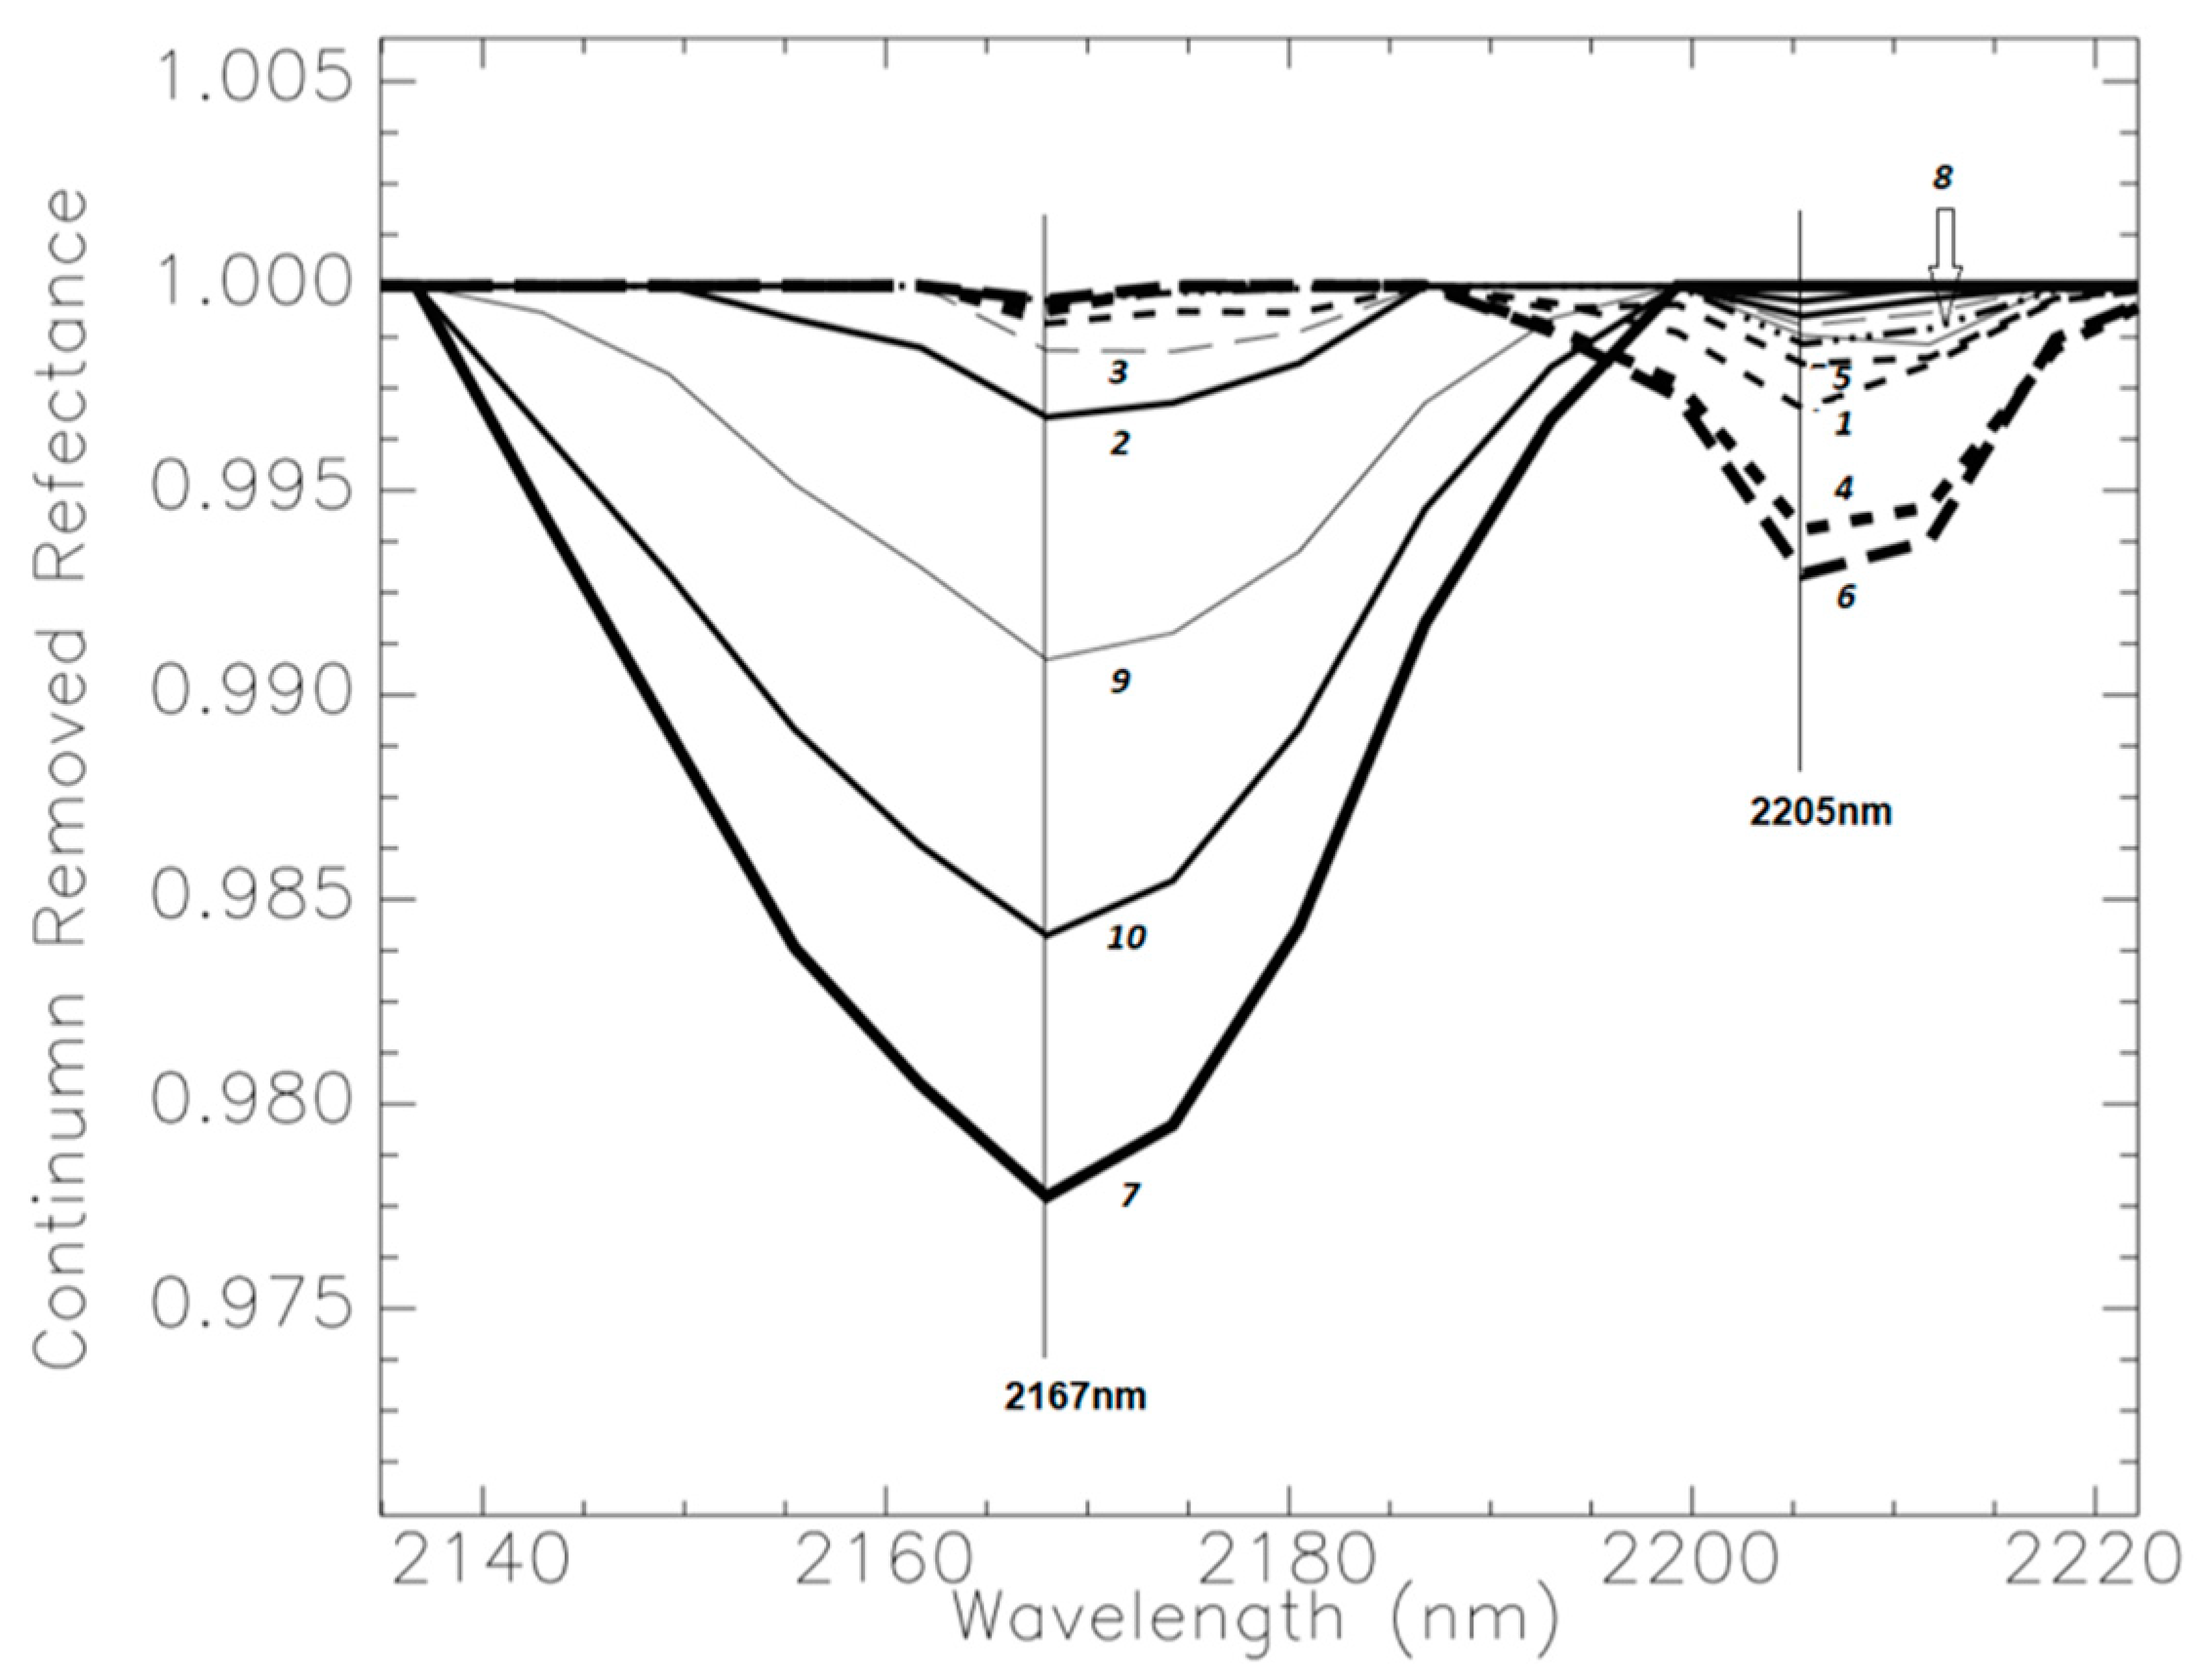
4.1.1. Type Spectra and Image Time-Series of Froth

The shortwave infrared spectra of froth as seen in Figure 4 is dominated by absorption features of water, oil, and clay minerals. Features of the later two components are considerably weaker but their presence, as seen below, is key to a number of predictive models of froth characteristics. Shown are spectra of froth for Sp#2, 4, and 6 selected because the froth of sample Sp#2 is relatively rich in bitumen in contrast to that of Sp#4 and 6, which are relatively rich in solids (Table 2, solids/bitumen content of 1.17, 2.64, and 6.63 for Sp#2, 4, and 6 respectively). This distinction implies a deeper oil absorption feature for Sp#2. The time series of froth imagery for these samples readily captures the differences in solids/bitumen (Figure 5). The image time series shown illustrates that the froth retains an integrity for at least 10 min following removal of the impeller, the time window within which all froth imagery was acquired.

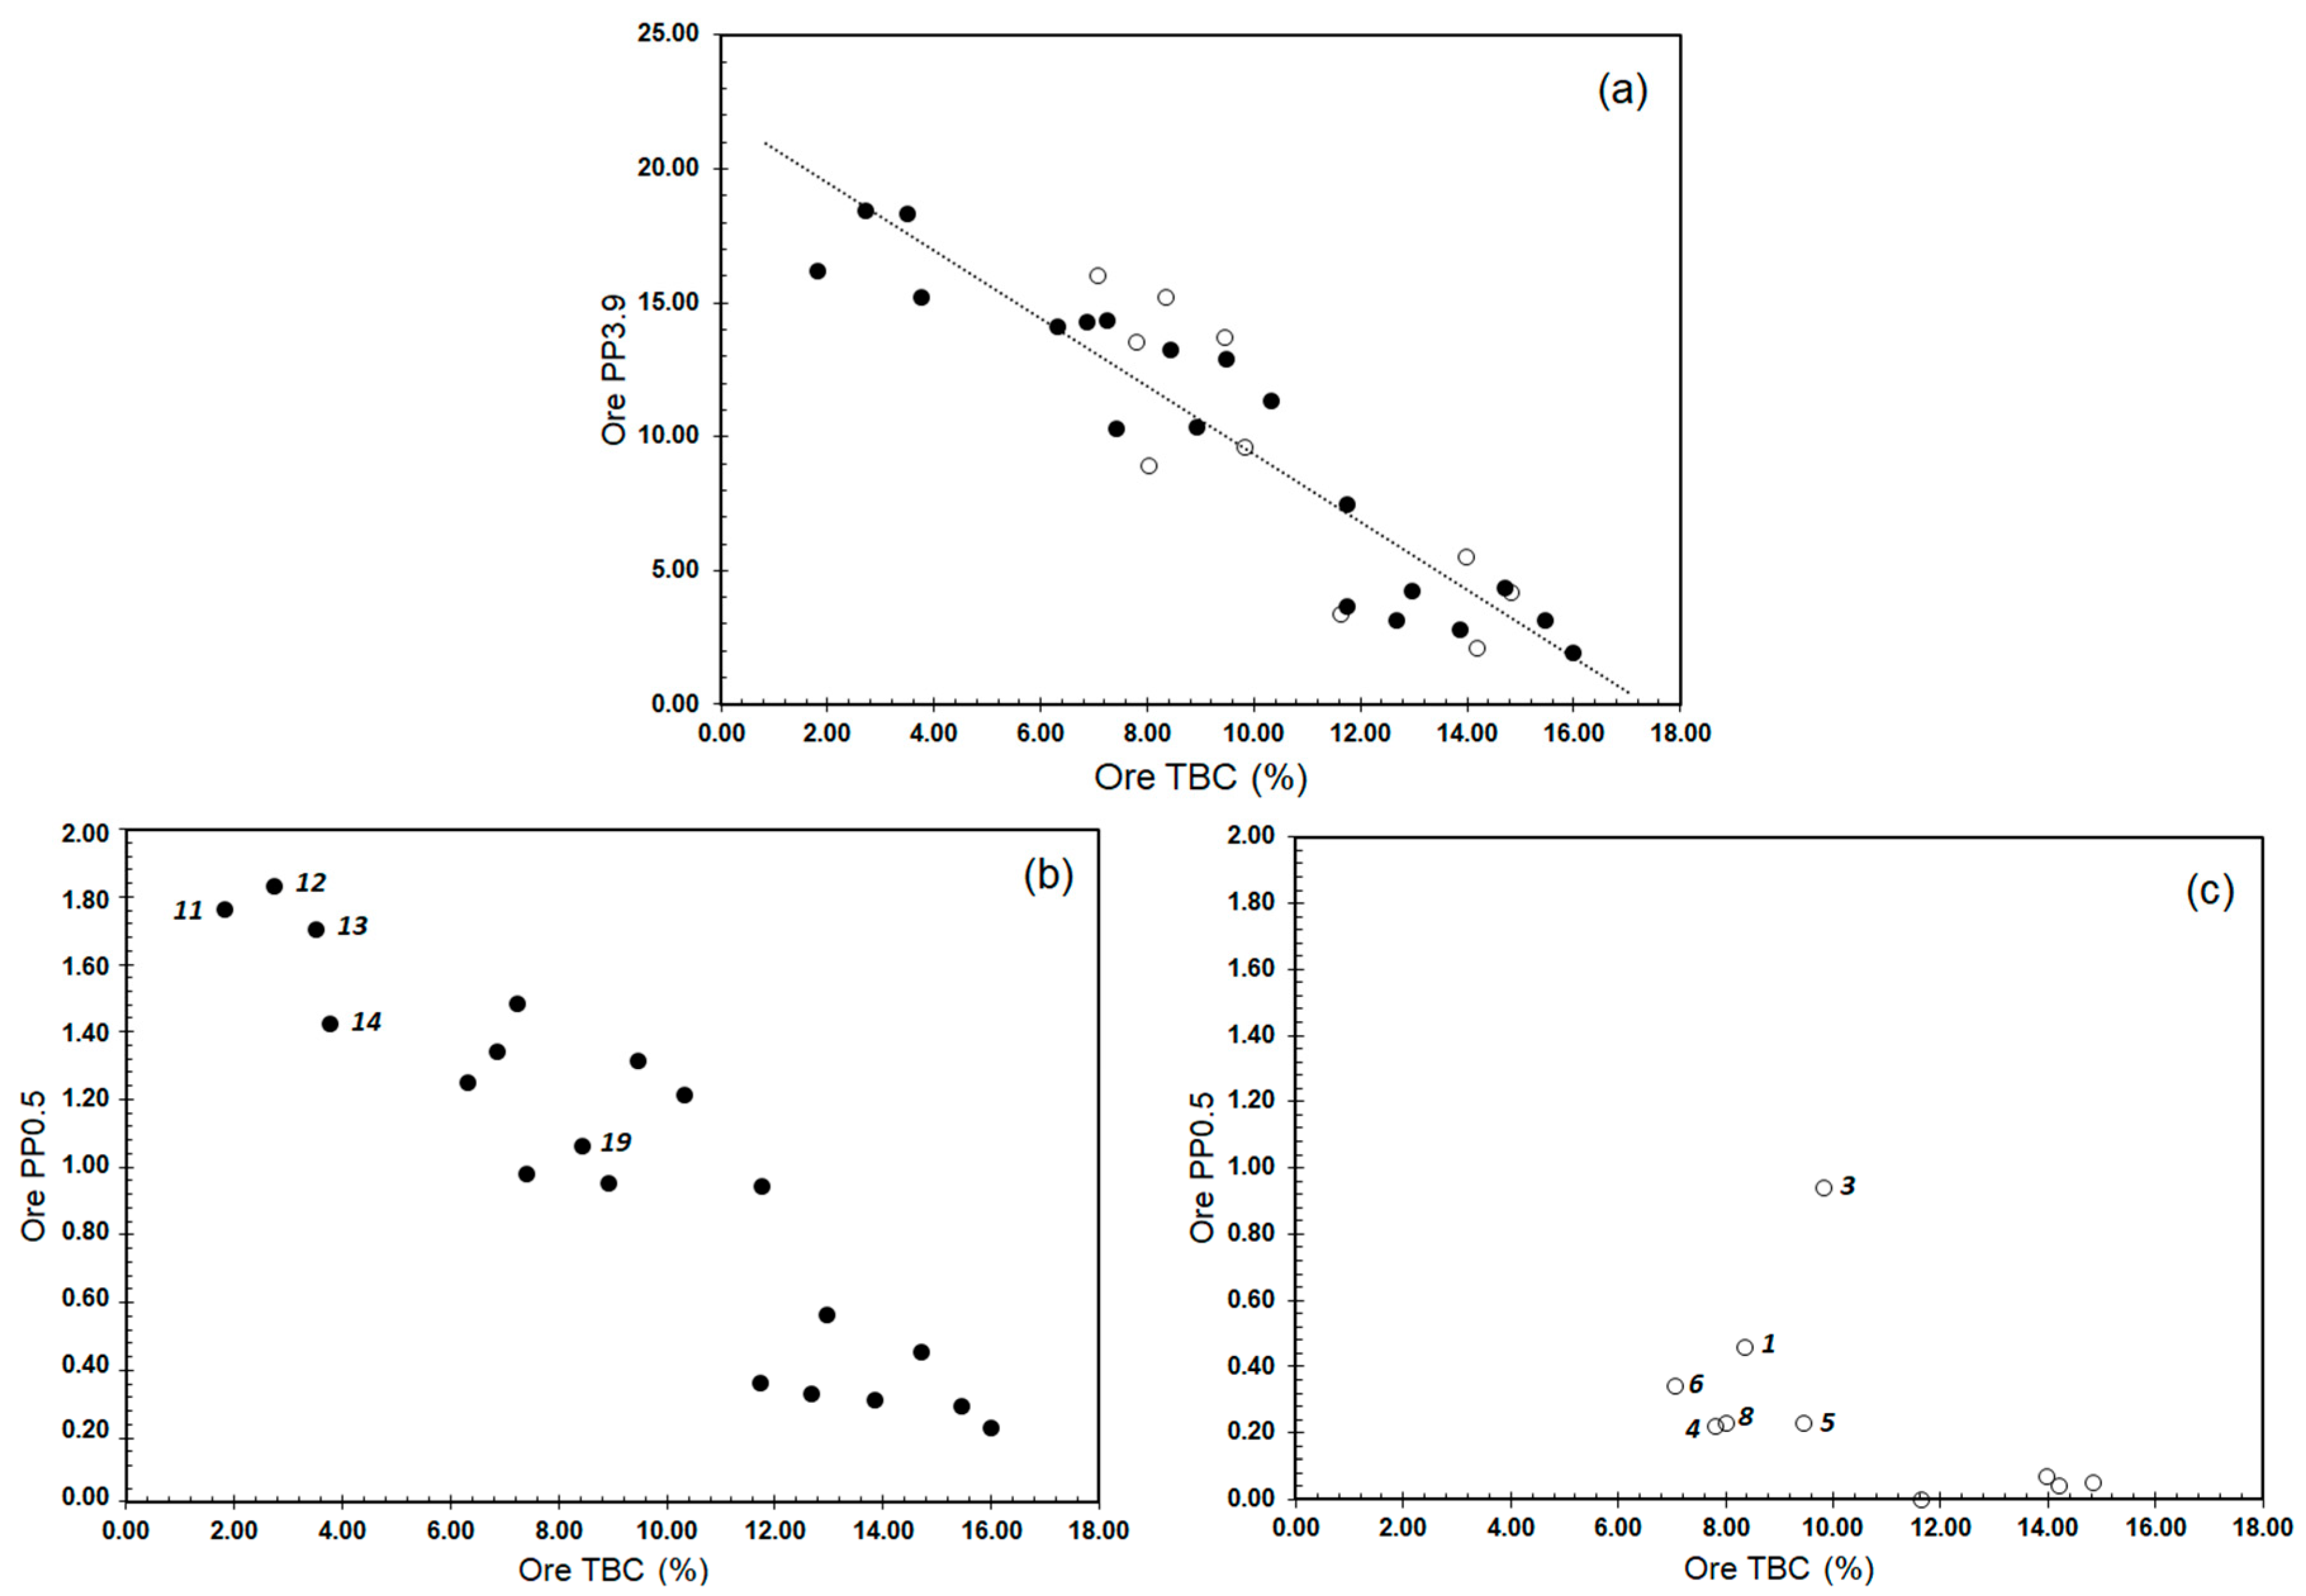
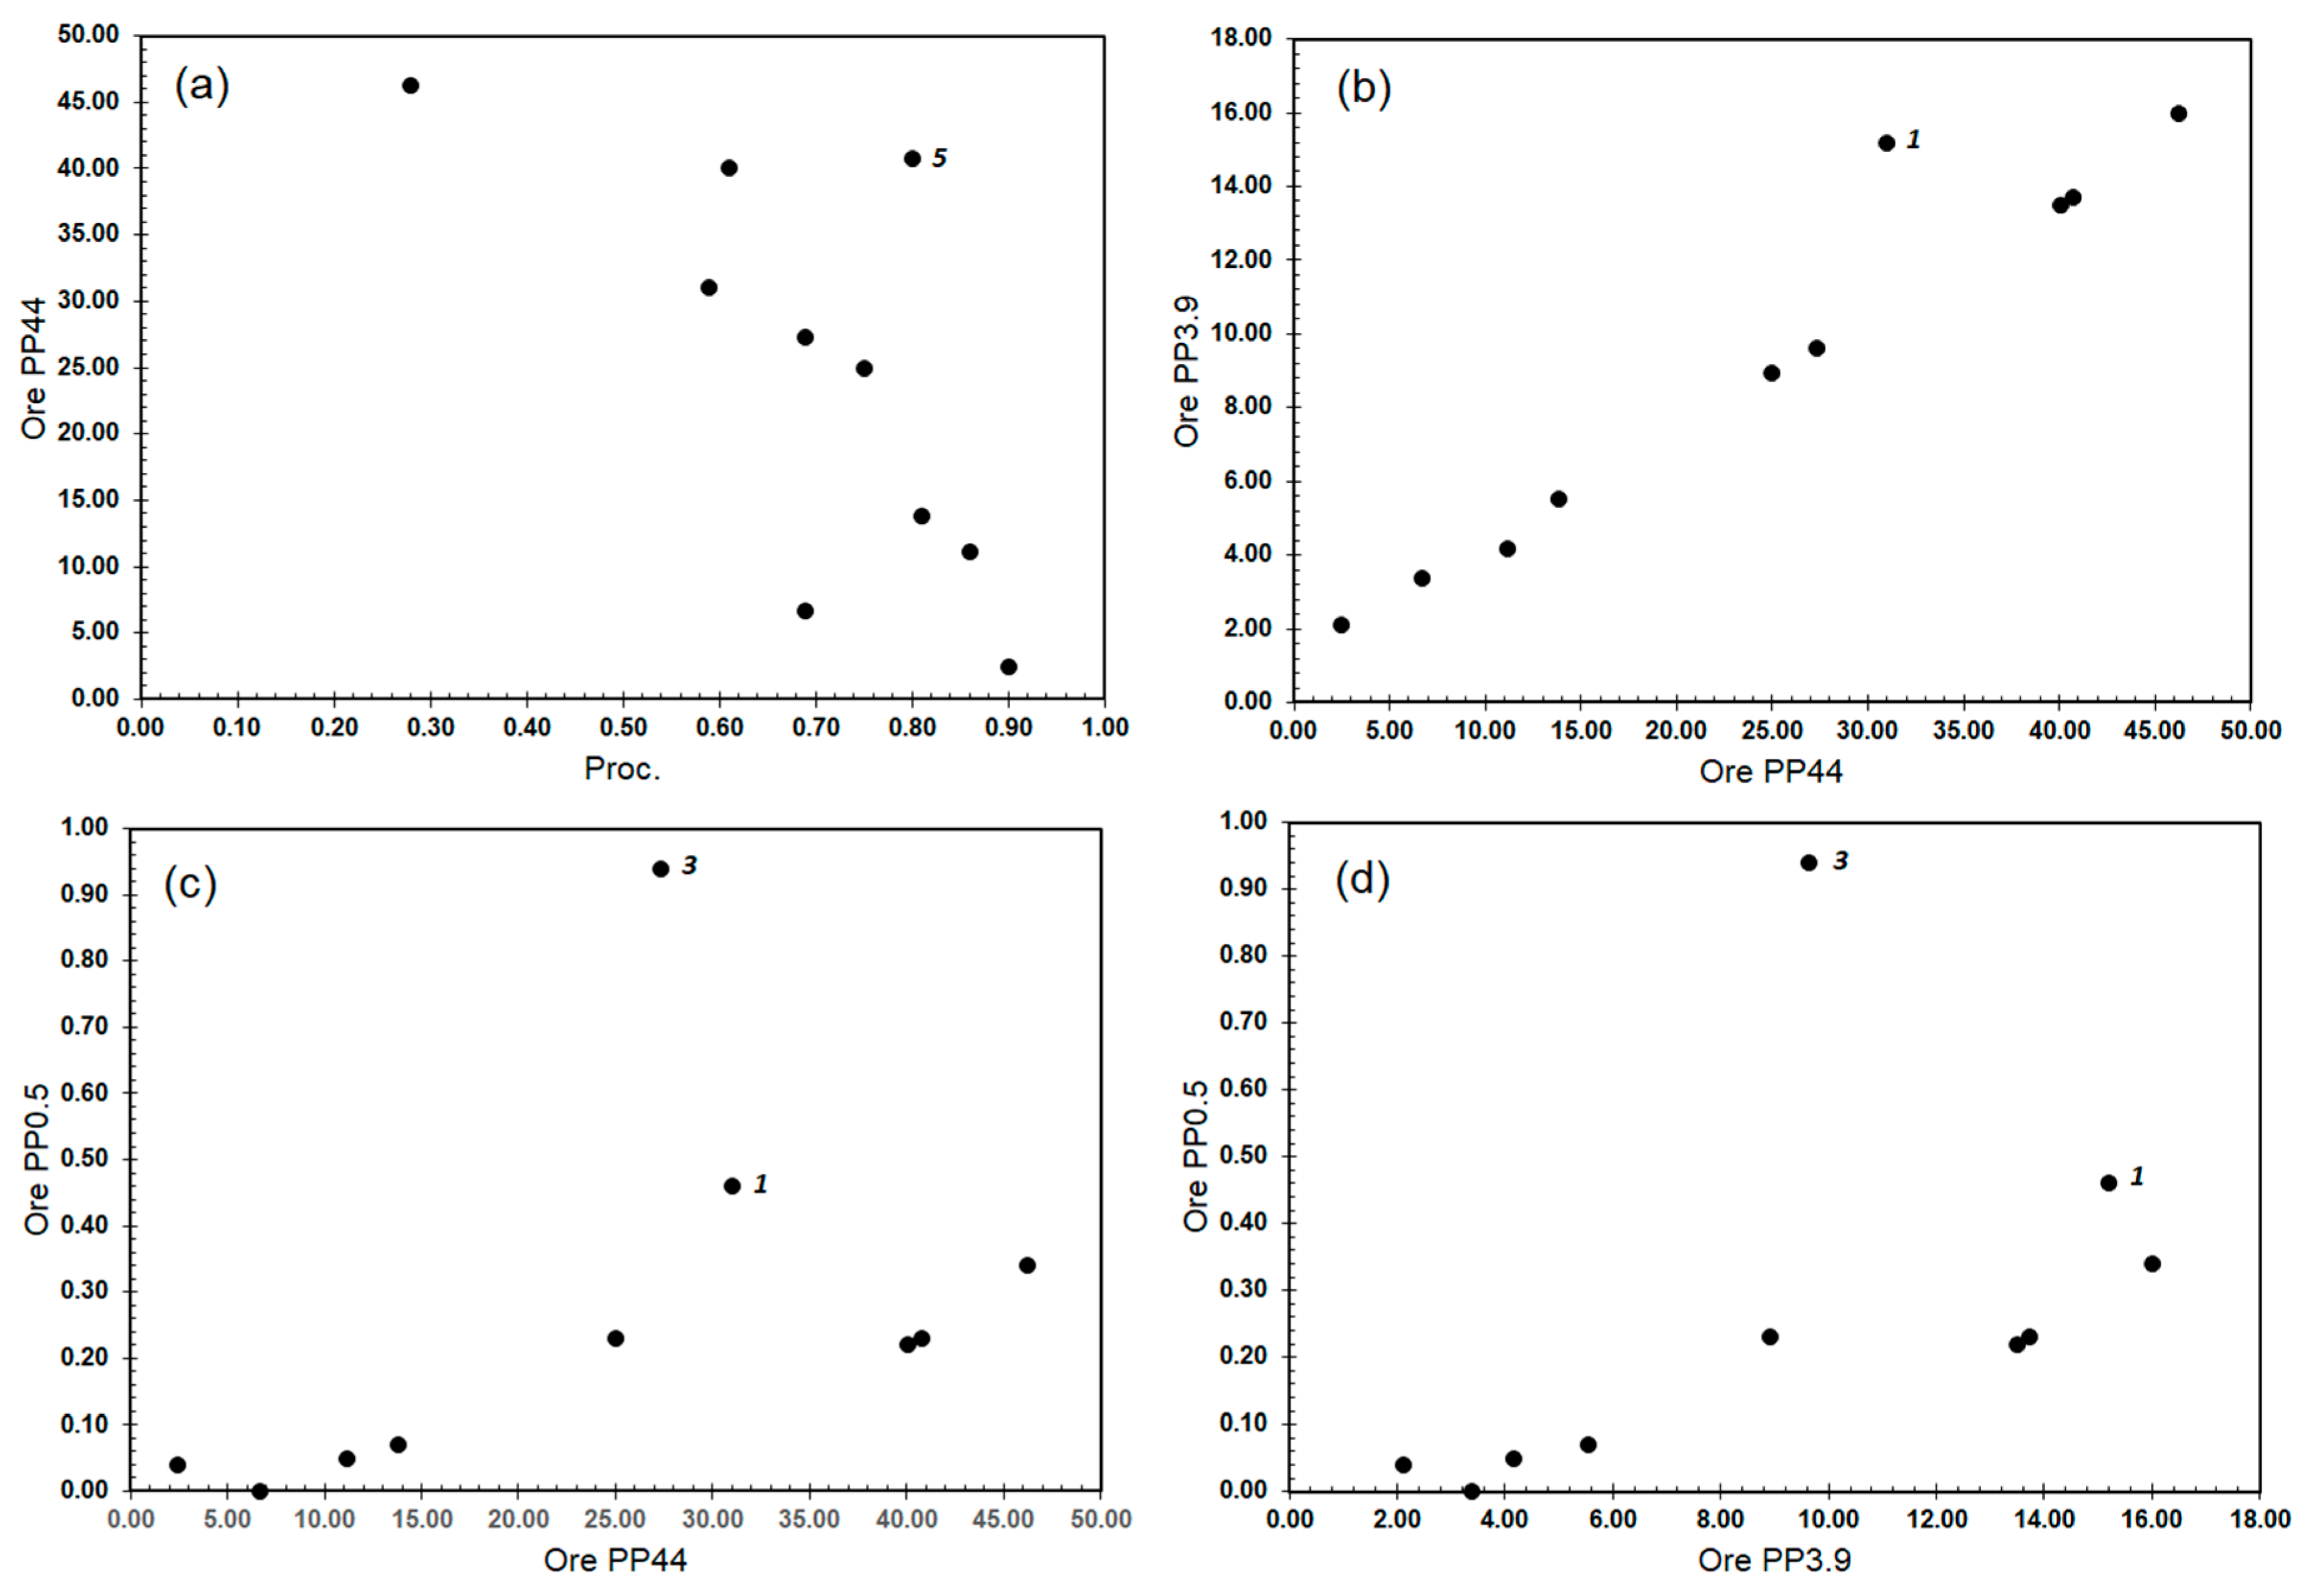
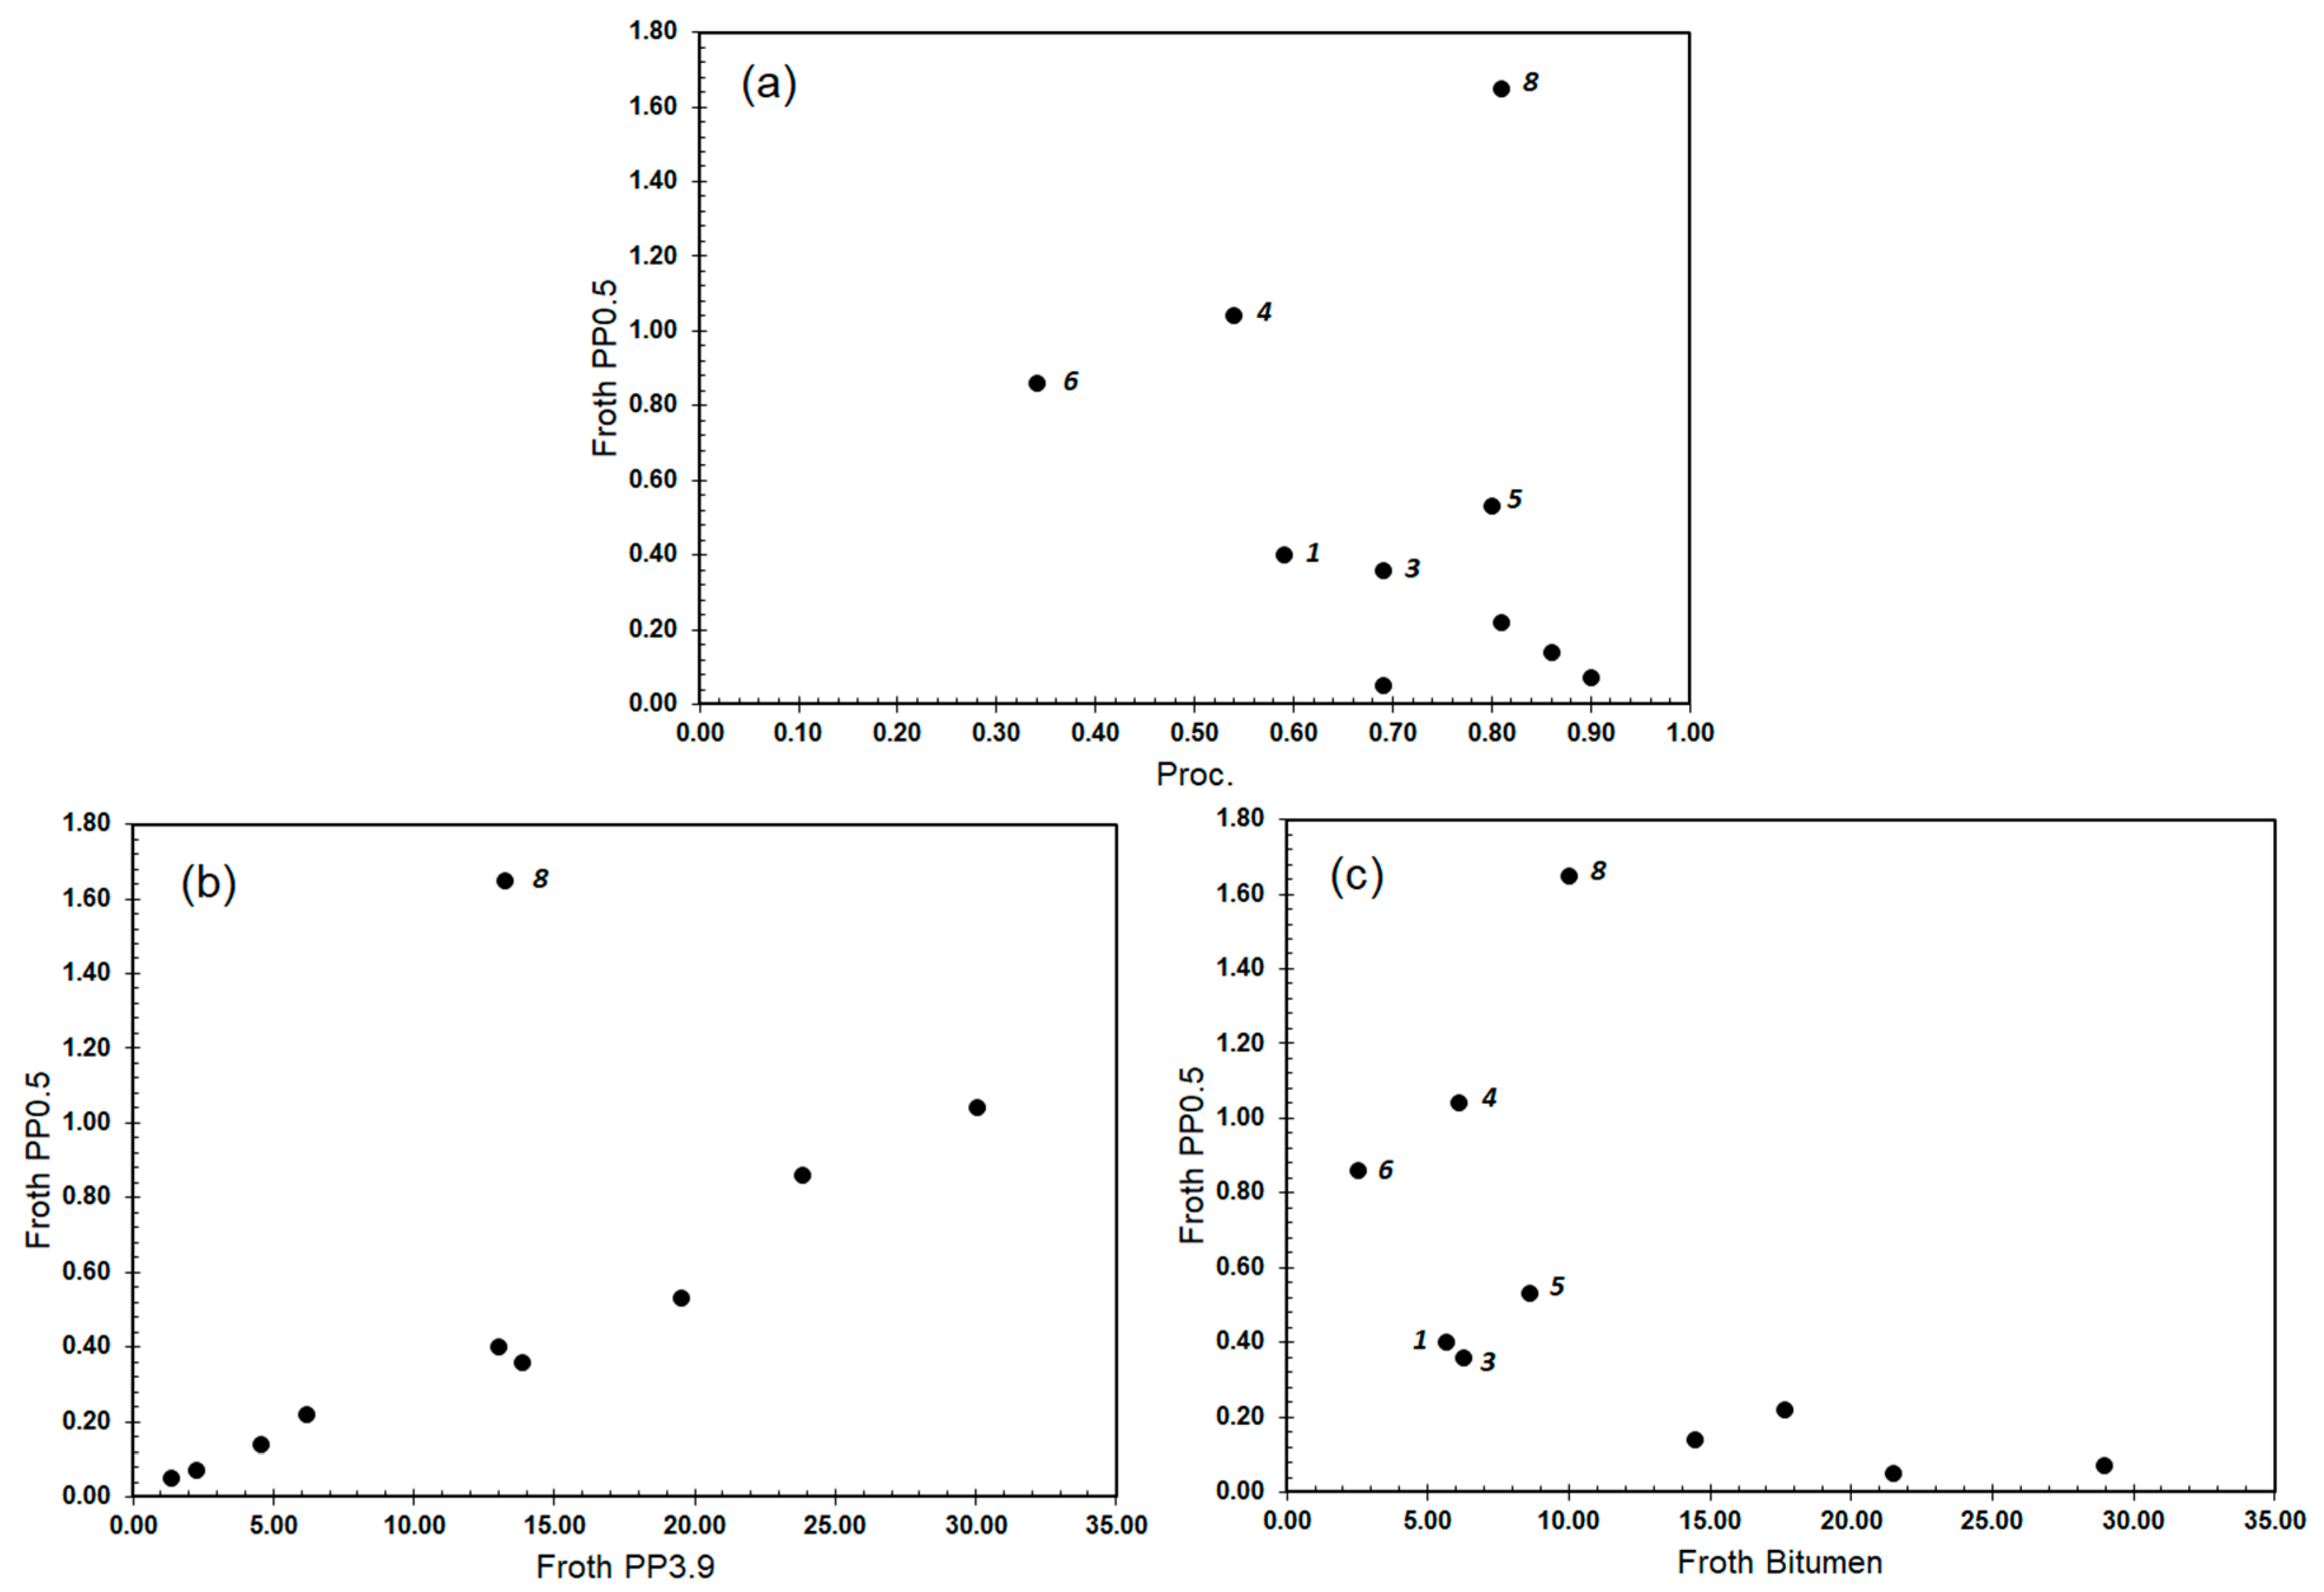
4.1.2. Links between Froth Imagery and Ore and Froth Characteristics

Table 3 raises the following two observations in regard to the fines content in ore and froth: (i) pp3.9 goes up in the froth of all 10 samples but two, Sp#1 (a poorer ore) and Sp#7 (a good ore), and (ii) pp0.5 goes up in the froth of all 10 samples but two, Sp#1 and Sp#3 (a relatively good ore). In general, this points to the segregation of fines in the froth during flotation. Sp#1 is a poorer ore rich in fines and the froth is also rich in fines even if it does not follow the specific trends listed above. The same can be said of Sp#7 as a rich ore that is poor in fines. Sp#3 does not show the expected high amount of ultrafines in froth given the amount of ultrafines in ore (the highest of the suite), a behavior which we cannot explain.
Froth imagery presents sample-to-sample variability, as seen at the end of Table 3. To understand these changes, key ore and froth characteristics and imagery are arranged in order of increasing sample processability. The imagery is a composite enhancing the strength of bitumen features at 1750 and 2350 nm and solids (e.g., clays at 2205 nm, Figure 4) where green conveys highest abundances in bitumen and red highest abundances in solids. There is a general trend from red to green imagery with increasing sample processability—e.g., samples Sp#6, 4, and 1 with lowest processability (<0.6) showing red imagery and samples Sp#9, 2, and 10 of the highest processability being green. However, the imagery of Sp#5 and 8 stands out.
An examination of the ore processability, fines, and ultrafines characteristics (Figure 6) confirms a known general relationship of the decreasing fines content with the increasing ore processability as well as correlations amongst different fine fractions. Sample Sp#5, which has a high processability of 0.80 but displays a red froth image (Table 2, Figure 6), stands out as having a high fines content (pp44) for the given processability. When the fines distribution is examined, it is sample Sp#3 (green froth imagery) that stands out, with a relatively higher proportion of ultrafines (pp0.5) to fines (pp44 or pp3.9) (Figure 6). Wallace et al. [15] reported that oil sands with a pp44 exceeding about 10% showed the first signs of a significant deterioration in extractability, and those above 20% had a dramatic increase in the incidence of a very low recovery. With the exception of Sp#3, all the samples with a pp44 > 20% result in froth showing as red in our composite imagery, which is designed to convey a high fines content in that color. Thus, the load in froth fines as conveyed in imagery is consistent with this reported cutoff in ore fines, however samples Sp#5 and 8 do have a good recovery despite their high froth fines content.
The characteristics of froth solids also follow a general trend with processability (Figure 7) but do not necessarily follow the detail seen in ore. For example, Sp#8, as opposed to Sp#3 in ore, is distinct in its elevated froth ultrafines content. This sample shows anomalous froth color despite its high processability of 0.81. Anomalous ore characteristics therefore do not necessarily inform us of froth characteristics. Note that the froth of Sp#5 shows slightly elevated pp3.9, suggesting that its red froth color image is best explained by elevated fines rather than ultrafines and this would be consistent with its anomalous high ore fines content.
Spectral features diagnostic of two groups of clays can be seen in the spectra of froth and of froth solids (Figure 8) after the removal of the continuum to highlight the absorption features of kaolinite and illite-smectite clays centered, respectively, at 2167 and 2205 nm. The spectra of the froth solids display a broad feature centered at 2205 nm but with considerable asymmetry, reflecting the contribution of lesser amounts of kaolinite, whose absorption is at a shorter wavelength. These spectra represent mixtures of both clay types across all samples. Samples Sp#6 displays the strongest absorption, followed by Sp#4 and 1, consistent with a high froth fines content in these samples, with the first two having the highest fines content. The spectra of the remaining samples form a tight cluster.
The spectra of froth (Figure 8 bottom frame) are quite distinct from those of froth solids, in that two clear spectral signatures are visible—namely, samples whose spectrum is dominated by the spectral feature of kaolinite near 2167 nm and those dominated by the feature of illite-smectite near 2205 nm. This suggests the segregation of clays during the flotation process. Samples displaying the most pronounced kaolinite feature are Sp#7, 10, 9, 2, and 3 (in order of decreasing absorption strength), all displaying green froth imagery (Table 3). Samples displaying the most pronounced illite-smectite feature are Sp#6, 4, 1, 5 and 8 (in order of decreasing absorption strength), all displaying red froth imagery (Table 3). Figure 9 is a color composite designed to highlight the relative abundance of these two groups of clays with samples having a predominance of illite-smectite clays in the froth displaying red color imagery (decreasing intensity for Sp#6, 4, 1, 5, and 8). These results are consistent with those of Wallace et al. [14], who linked the increased abundance of degraded (de-potassified) illite, leading to a build-up of froth solids, to ores that processed more poorly.
The signature of kaolinite seen in samples with a bitumen-rich froth, green in imagery due to the pronounced bitumen absorption, may reflect the preferential adherence of this clay to the surface of froth bubbles. Bitumen-rich froths display the best development of bubbles (quantity and size), while bitumen-poor froths have smaller bubbles.

4.2. Predictive Models Using Spectra of Froth

To generate predictive models of processability and froth parameters from the spectra of froth, a multiple regression analysis was conducted to model the relationship between these characteristics and the wavelet power of features with the highest correlation. Table 4 lists the features used in the models described to predict the froth solids to bitumen ratio (SBR), the froth content in fines and ultrafines (pp3.9 and pp0.5), and the processability.

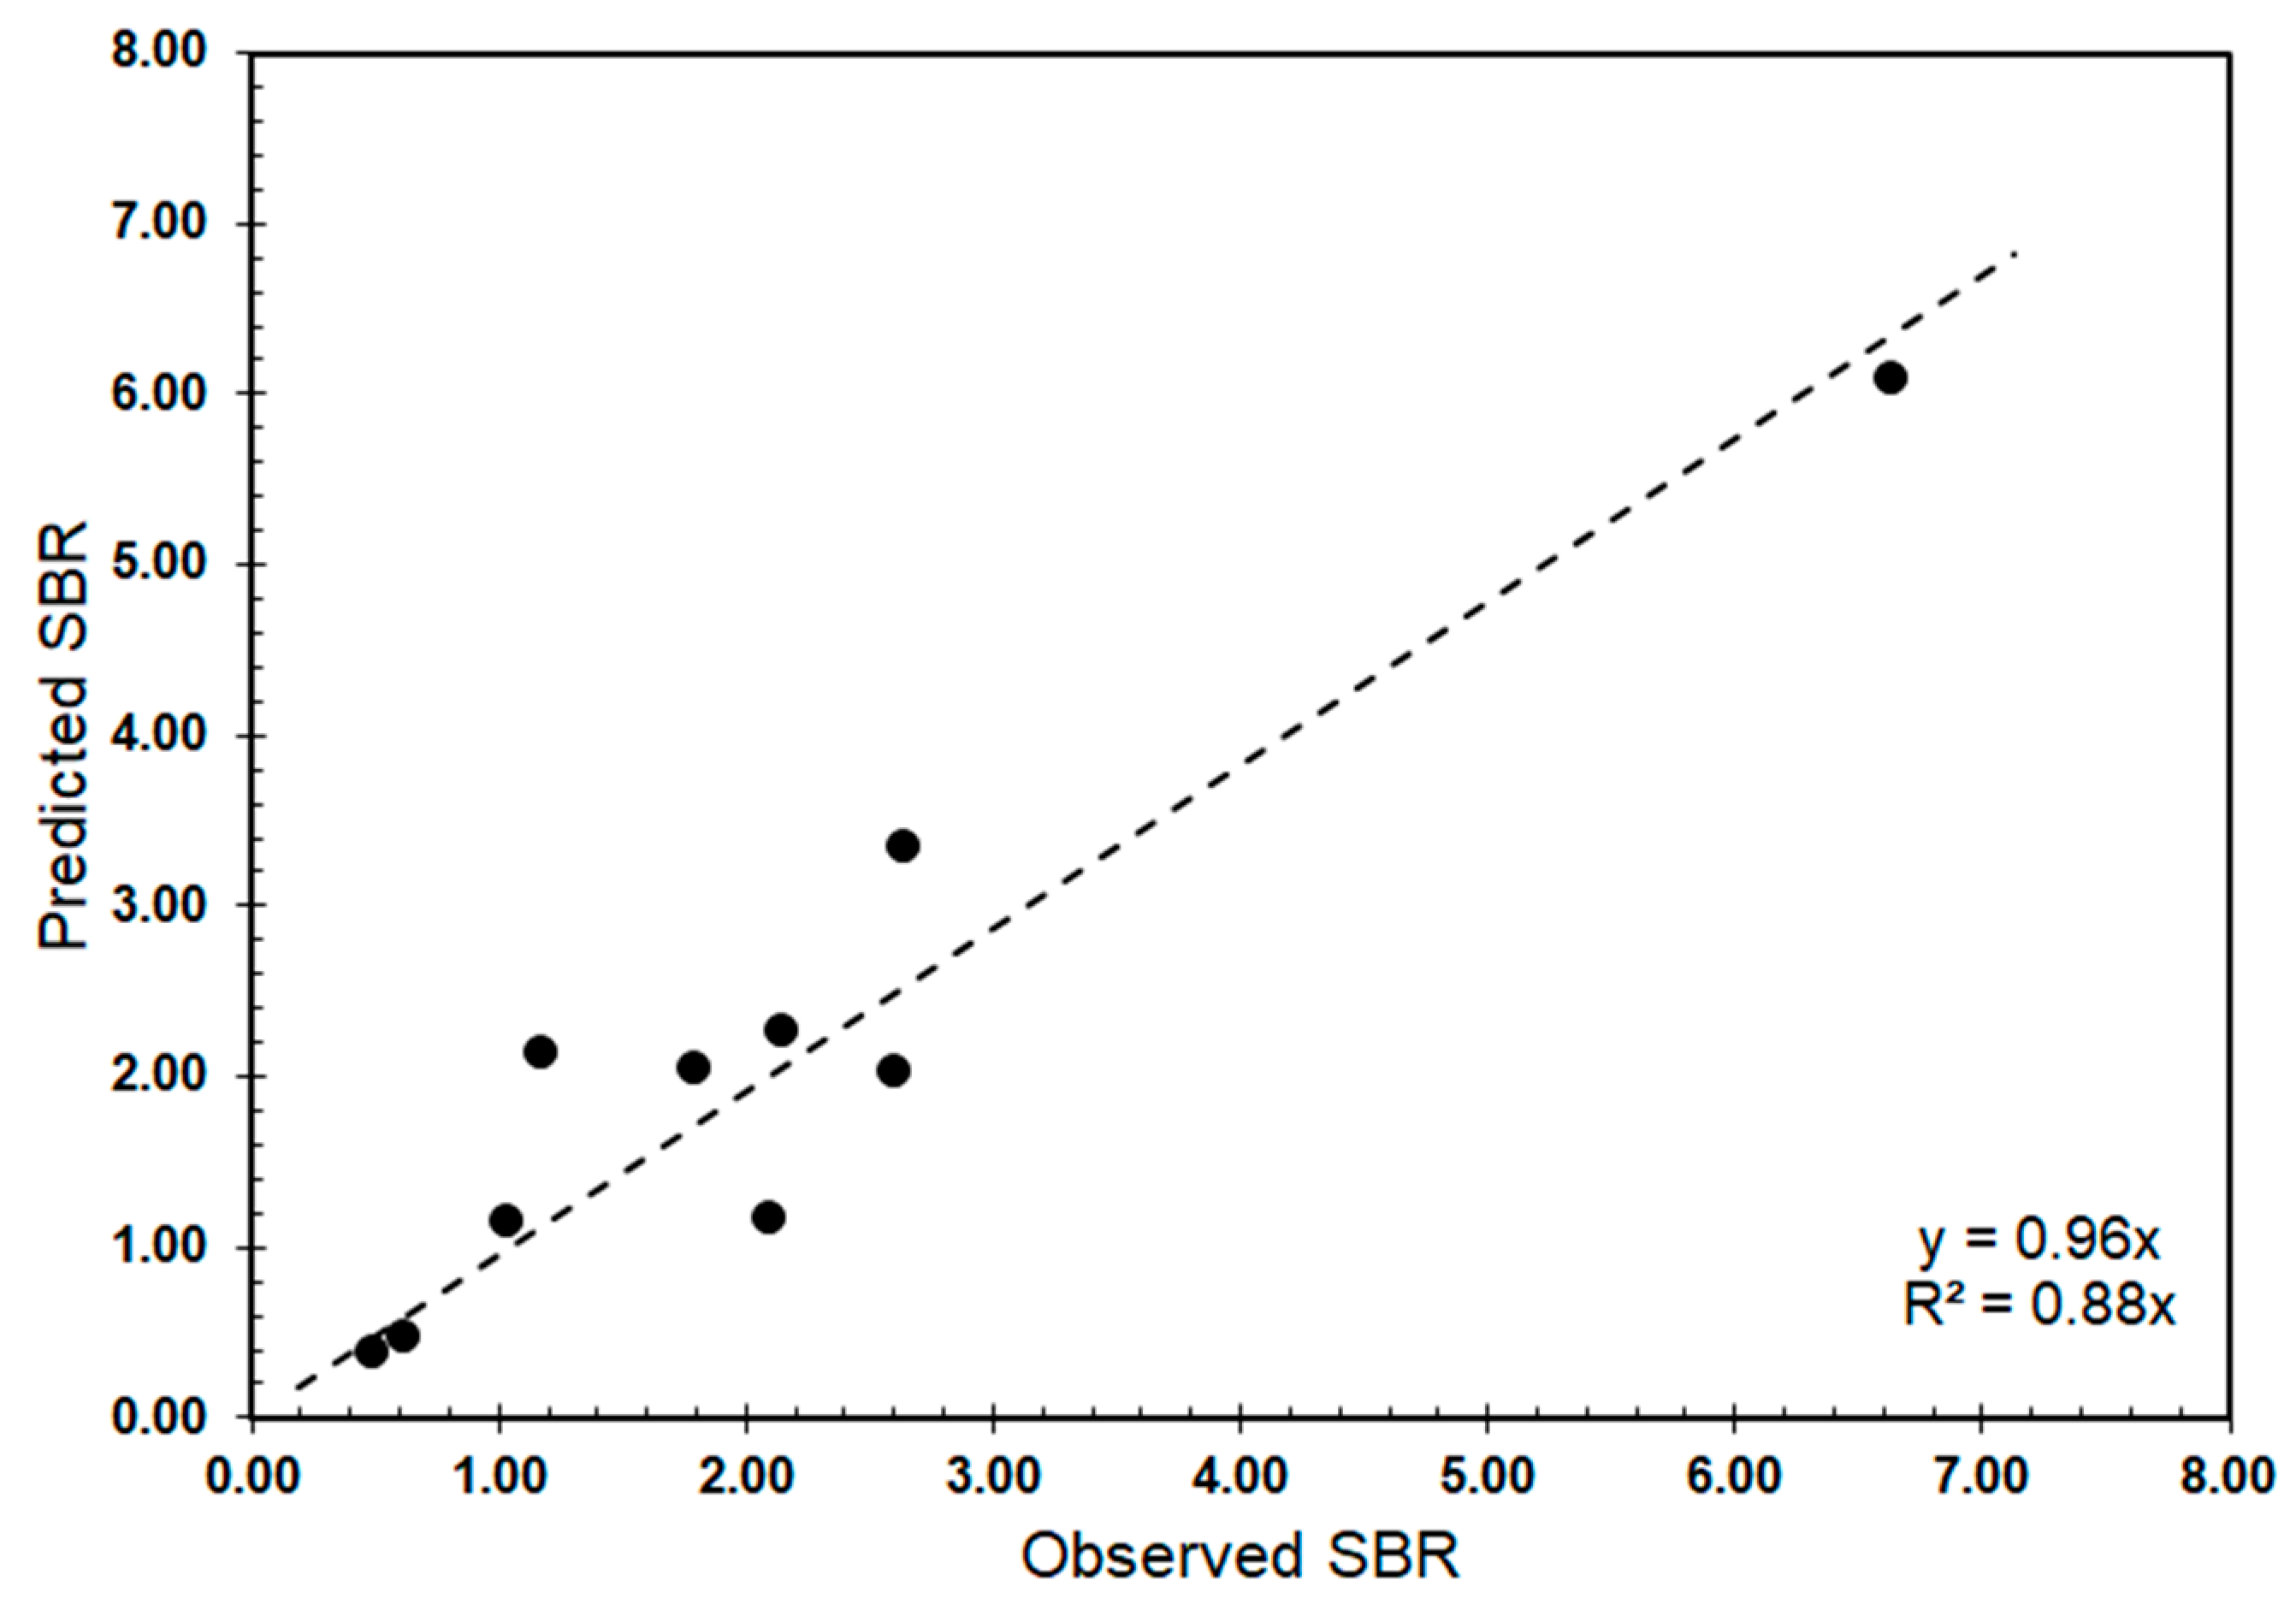
4.2.1. Prediction of Solids to Bitumen (SBR)

The solids and water content in froth has implications for downstream processes. Froth is deaerated and then treated to remove water and solids to prevent catalyst deactivation and corrosion. High water and solids contents lead to throughput and quality issues in froth treatment. The solids affect the color and quality of froth, and their presence offers a qualitative assessment of froth quality. Thus, the prediction of the solids to bitumen ratio (SBR) in froth in separation vessels is an important indicator for downstream processing.
The model predicting solids to bitumen (Equation (1)) involves four features. The RMS (root mean square) error for the model is 0.55 for the modeling suite of 10 samples. When the observed SBR value is compared to the predicted value for the ten samples (Figure 10), a best fit line through the data displays a slope of 0.96, which indicates that the prediction model is unbiased.
P r e d i c t e d   S B R V N I R = 10.01 7423.59 × W 2.180 u m 1 P 206.94 × W 2.255 u m 4 P 3198.24 × W 2.205 u m 2 P 328.63 × W 2.492 u m 5 P

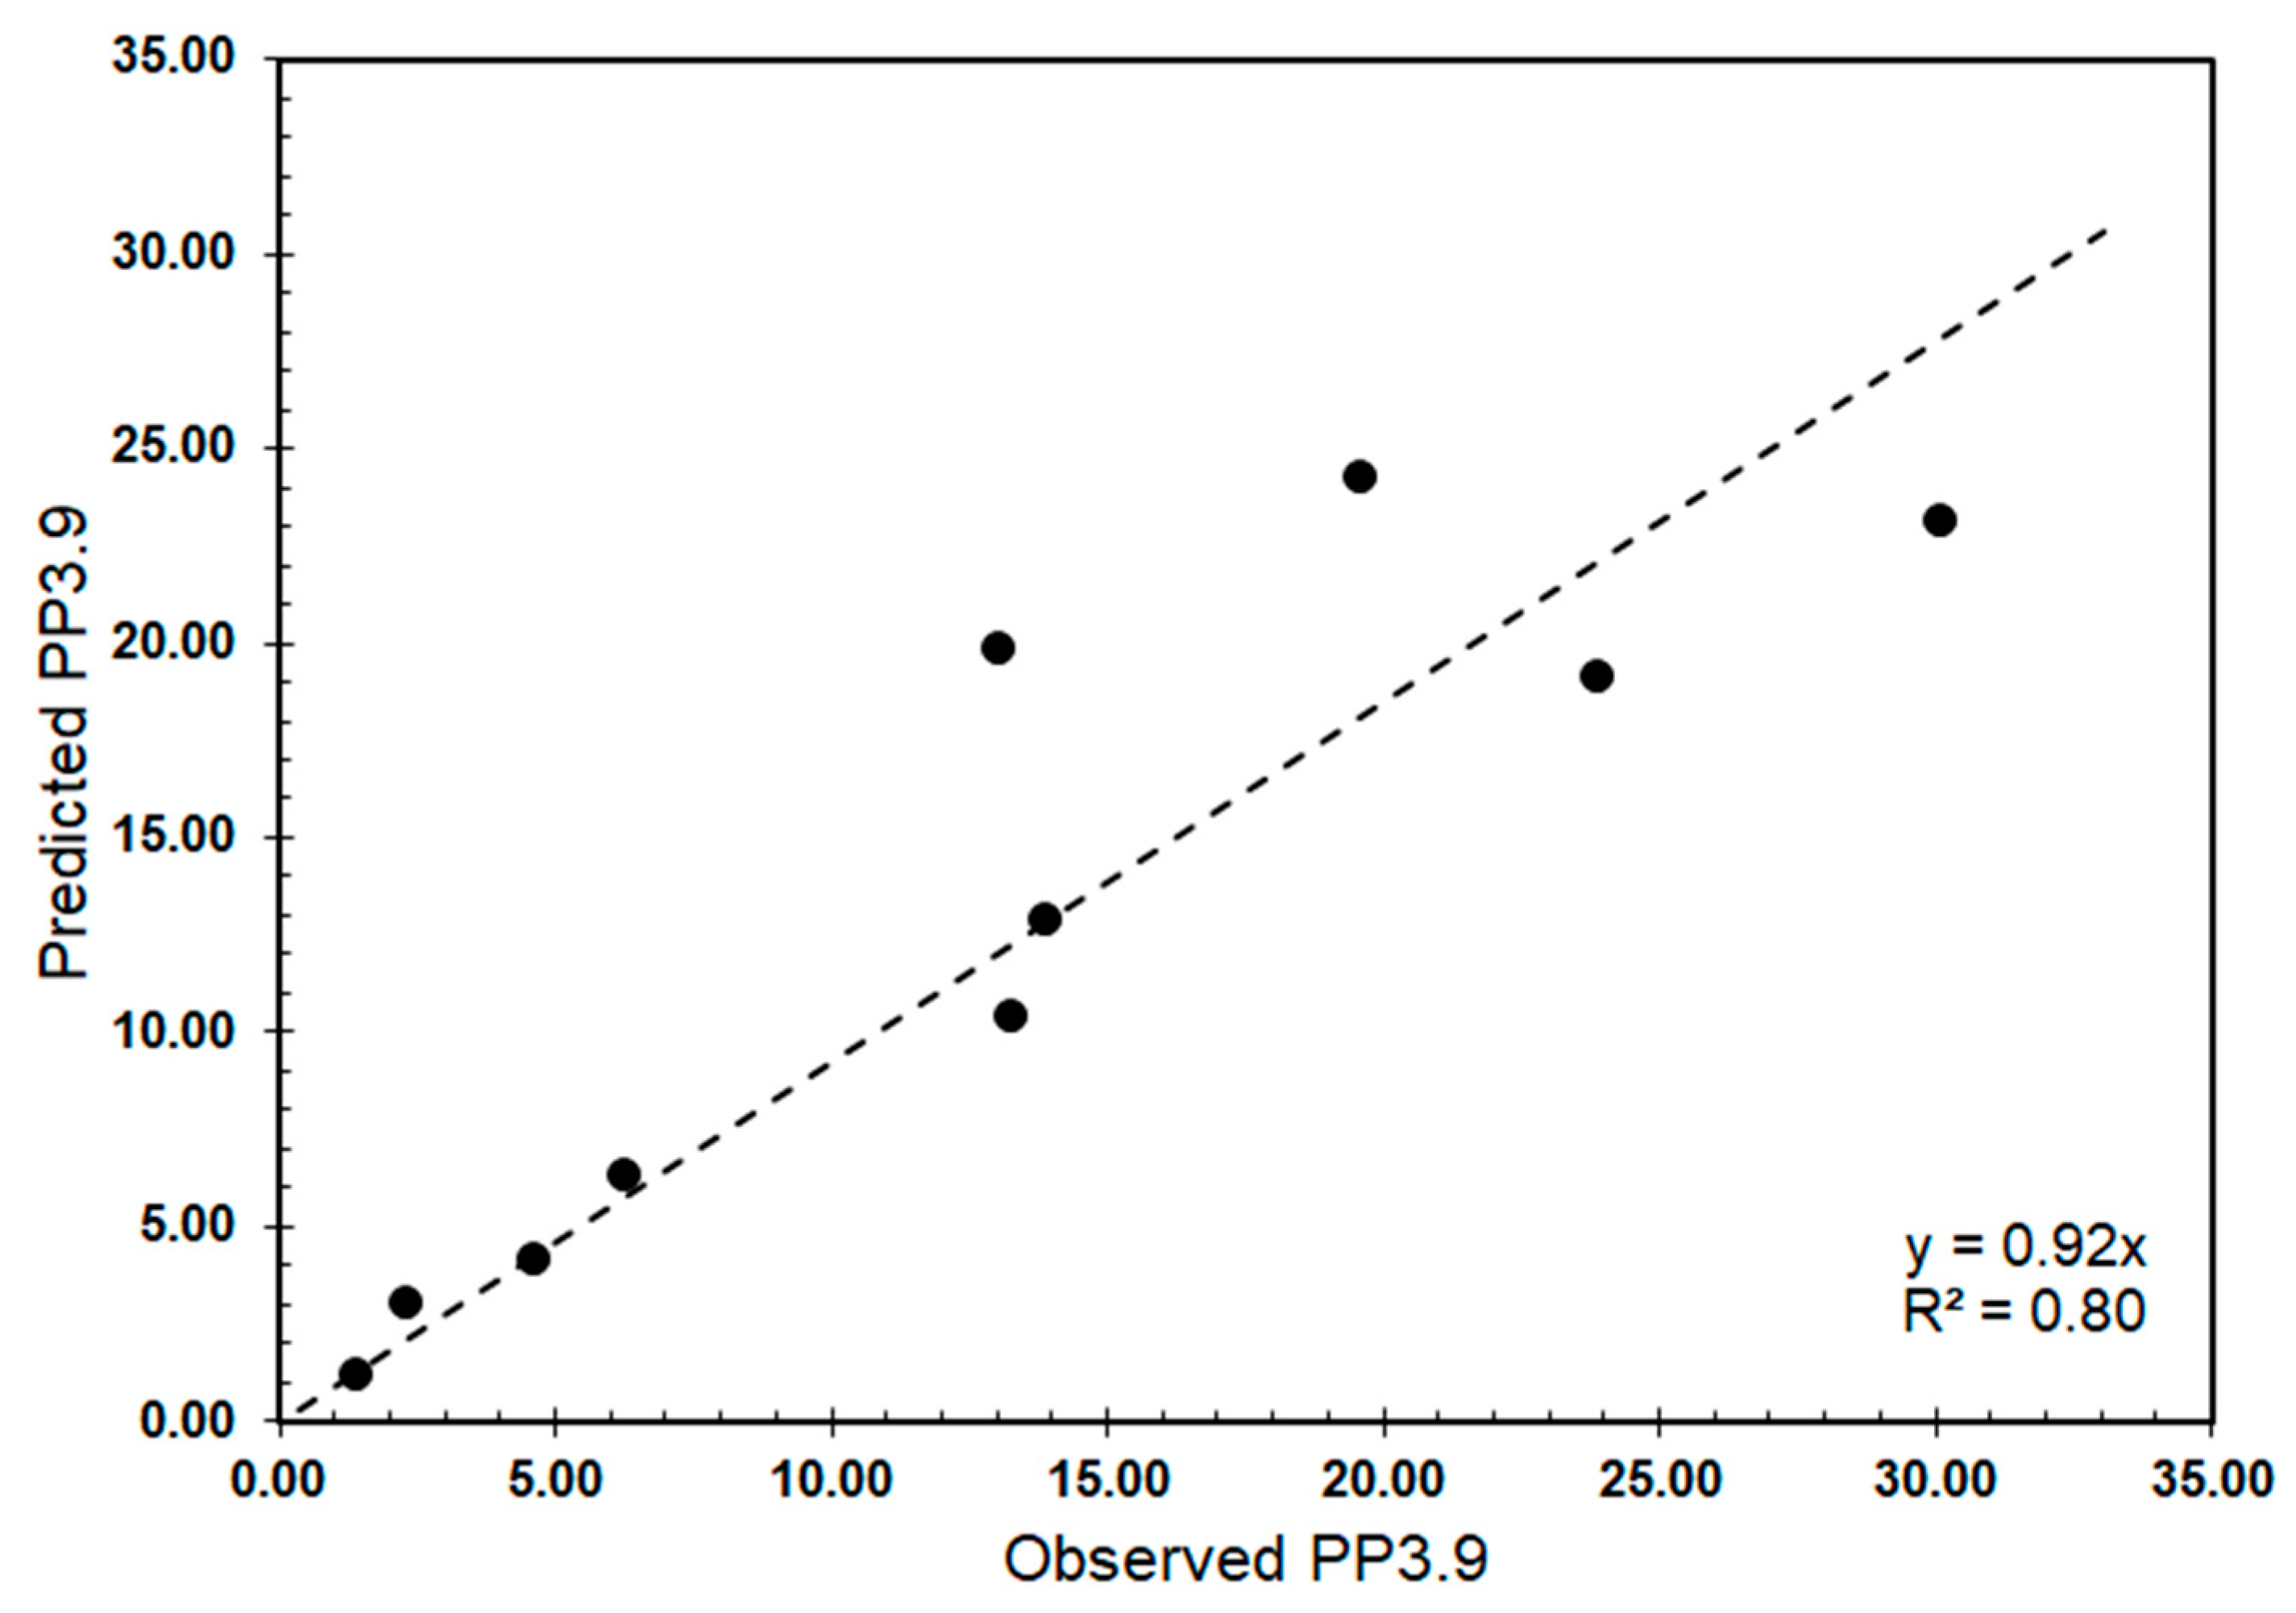
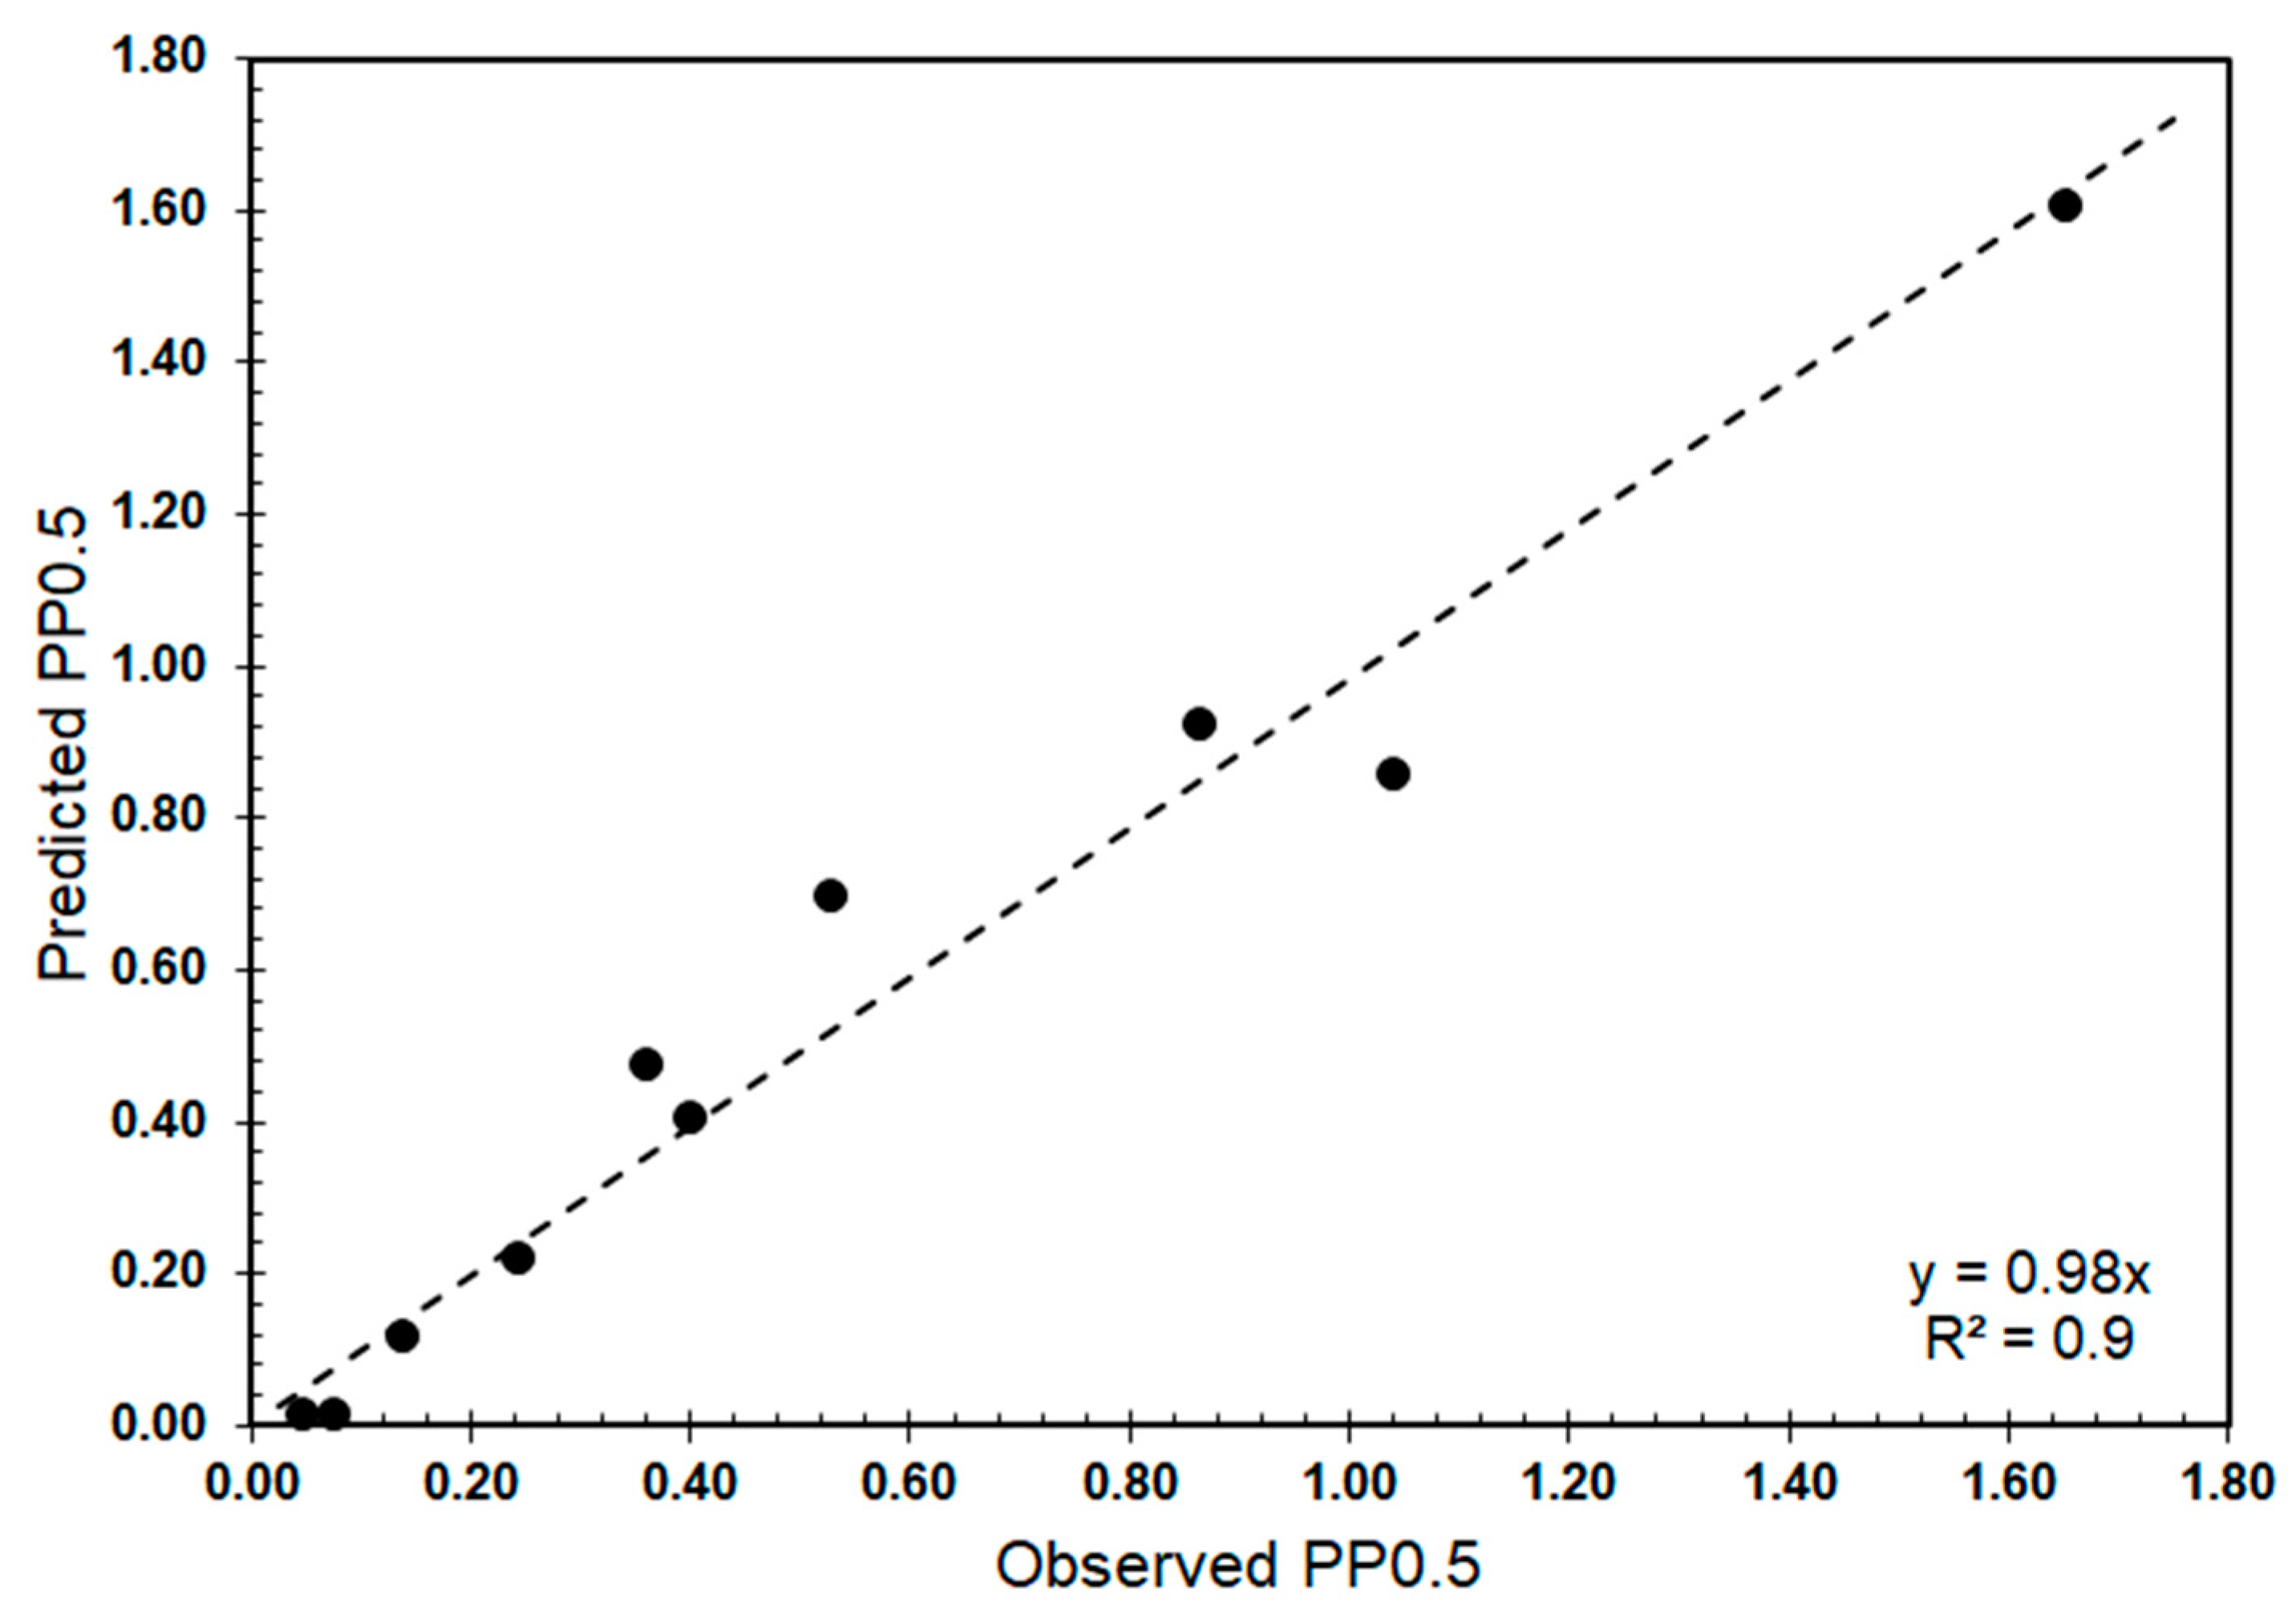
4.2.2. Prediction of Fines Content

The models predicting the fines and ultrafines content (Equations (2) and (3)) involve three features. The RMS (root mean square) errors for these models are 3.86 and 0.06 for the modeling suite of 10 samples. Figure 11 and Figure 12 compare the predicted and observed values of pp3.9 and pp0.5. The comparison reveals less data scatter for the pp0.5 predictive model and a higher r2 (0.9 vs. 0.8).
P r e d i c t e d   P P 3.9 V N I R   = 1.89 × exp ( 0.12 × i n d e x ) i n d e x = 30.78 + 15.37 × W 2.342 u m 5 P 904.14 × W 1.587 u m 5 P + 93.18 × W 2.130 u m 5 P
P r e d i c t e d   P P 0.5 V N I R = 0.05 + 24.40 × W 1.760 u m 6 P 211.73 × W 1.540 u m 4 P + 19.52 W 2.192 u m 6 P

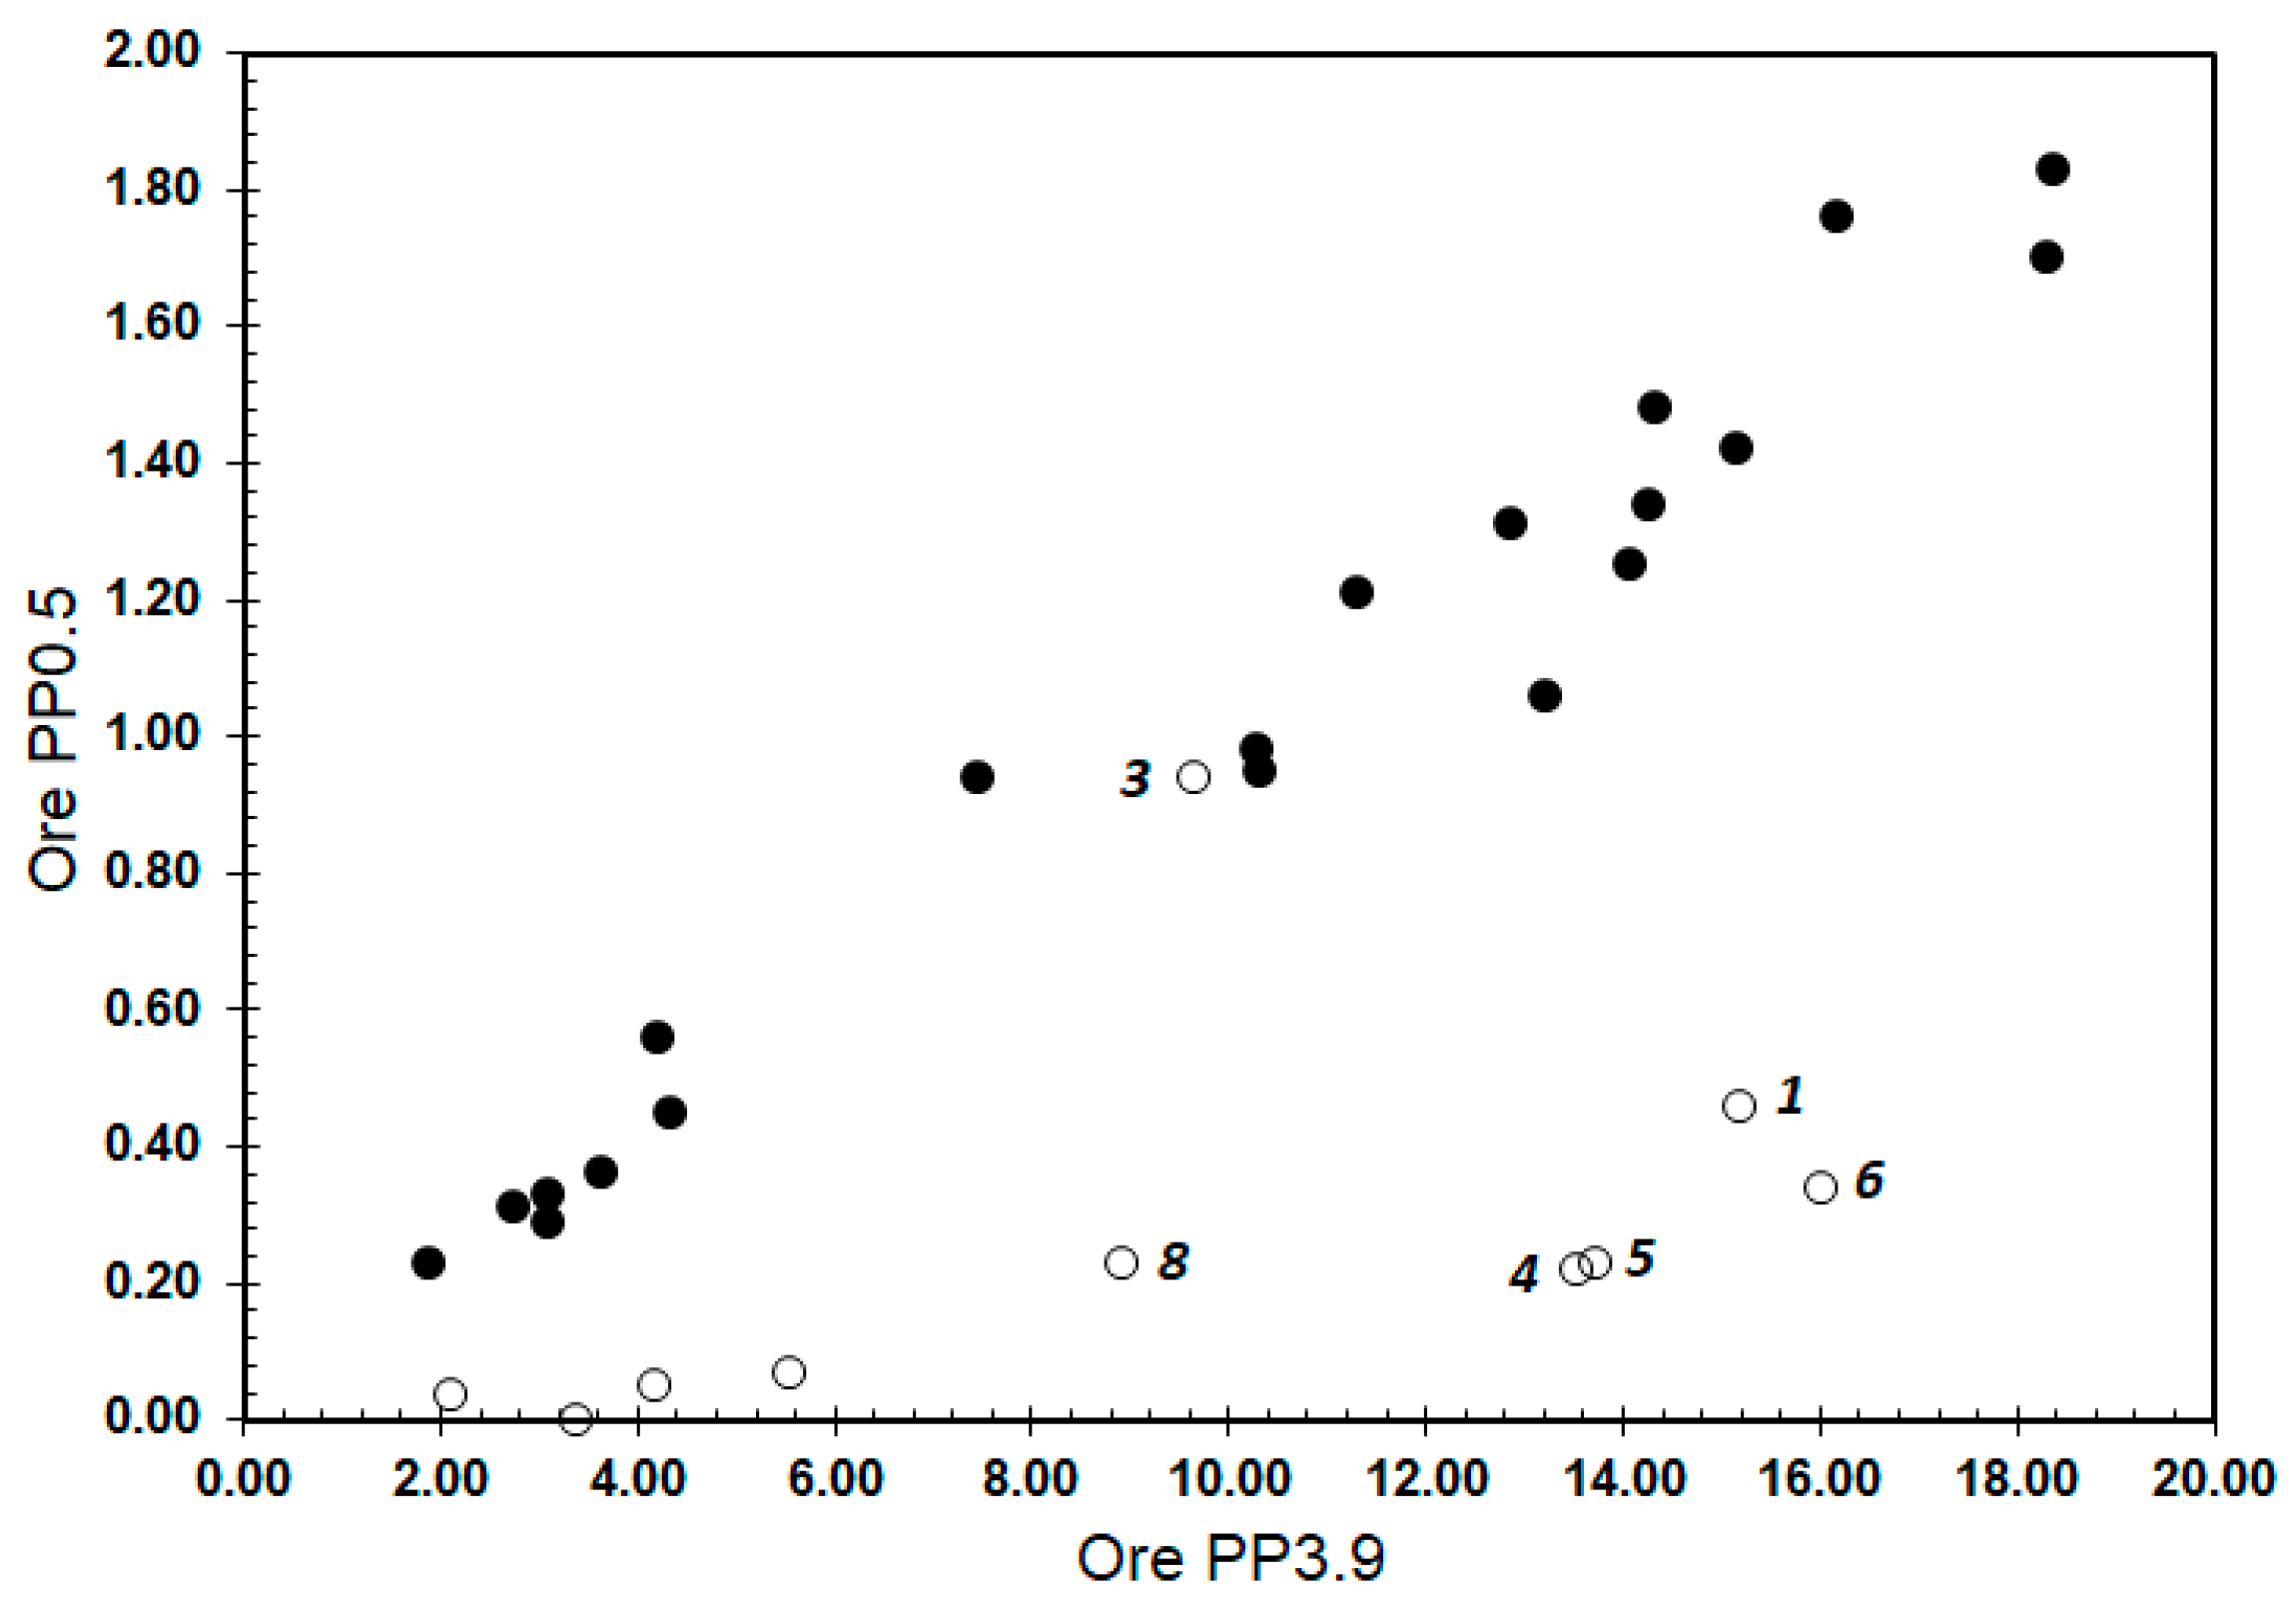
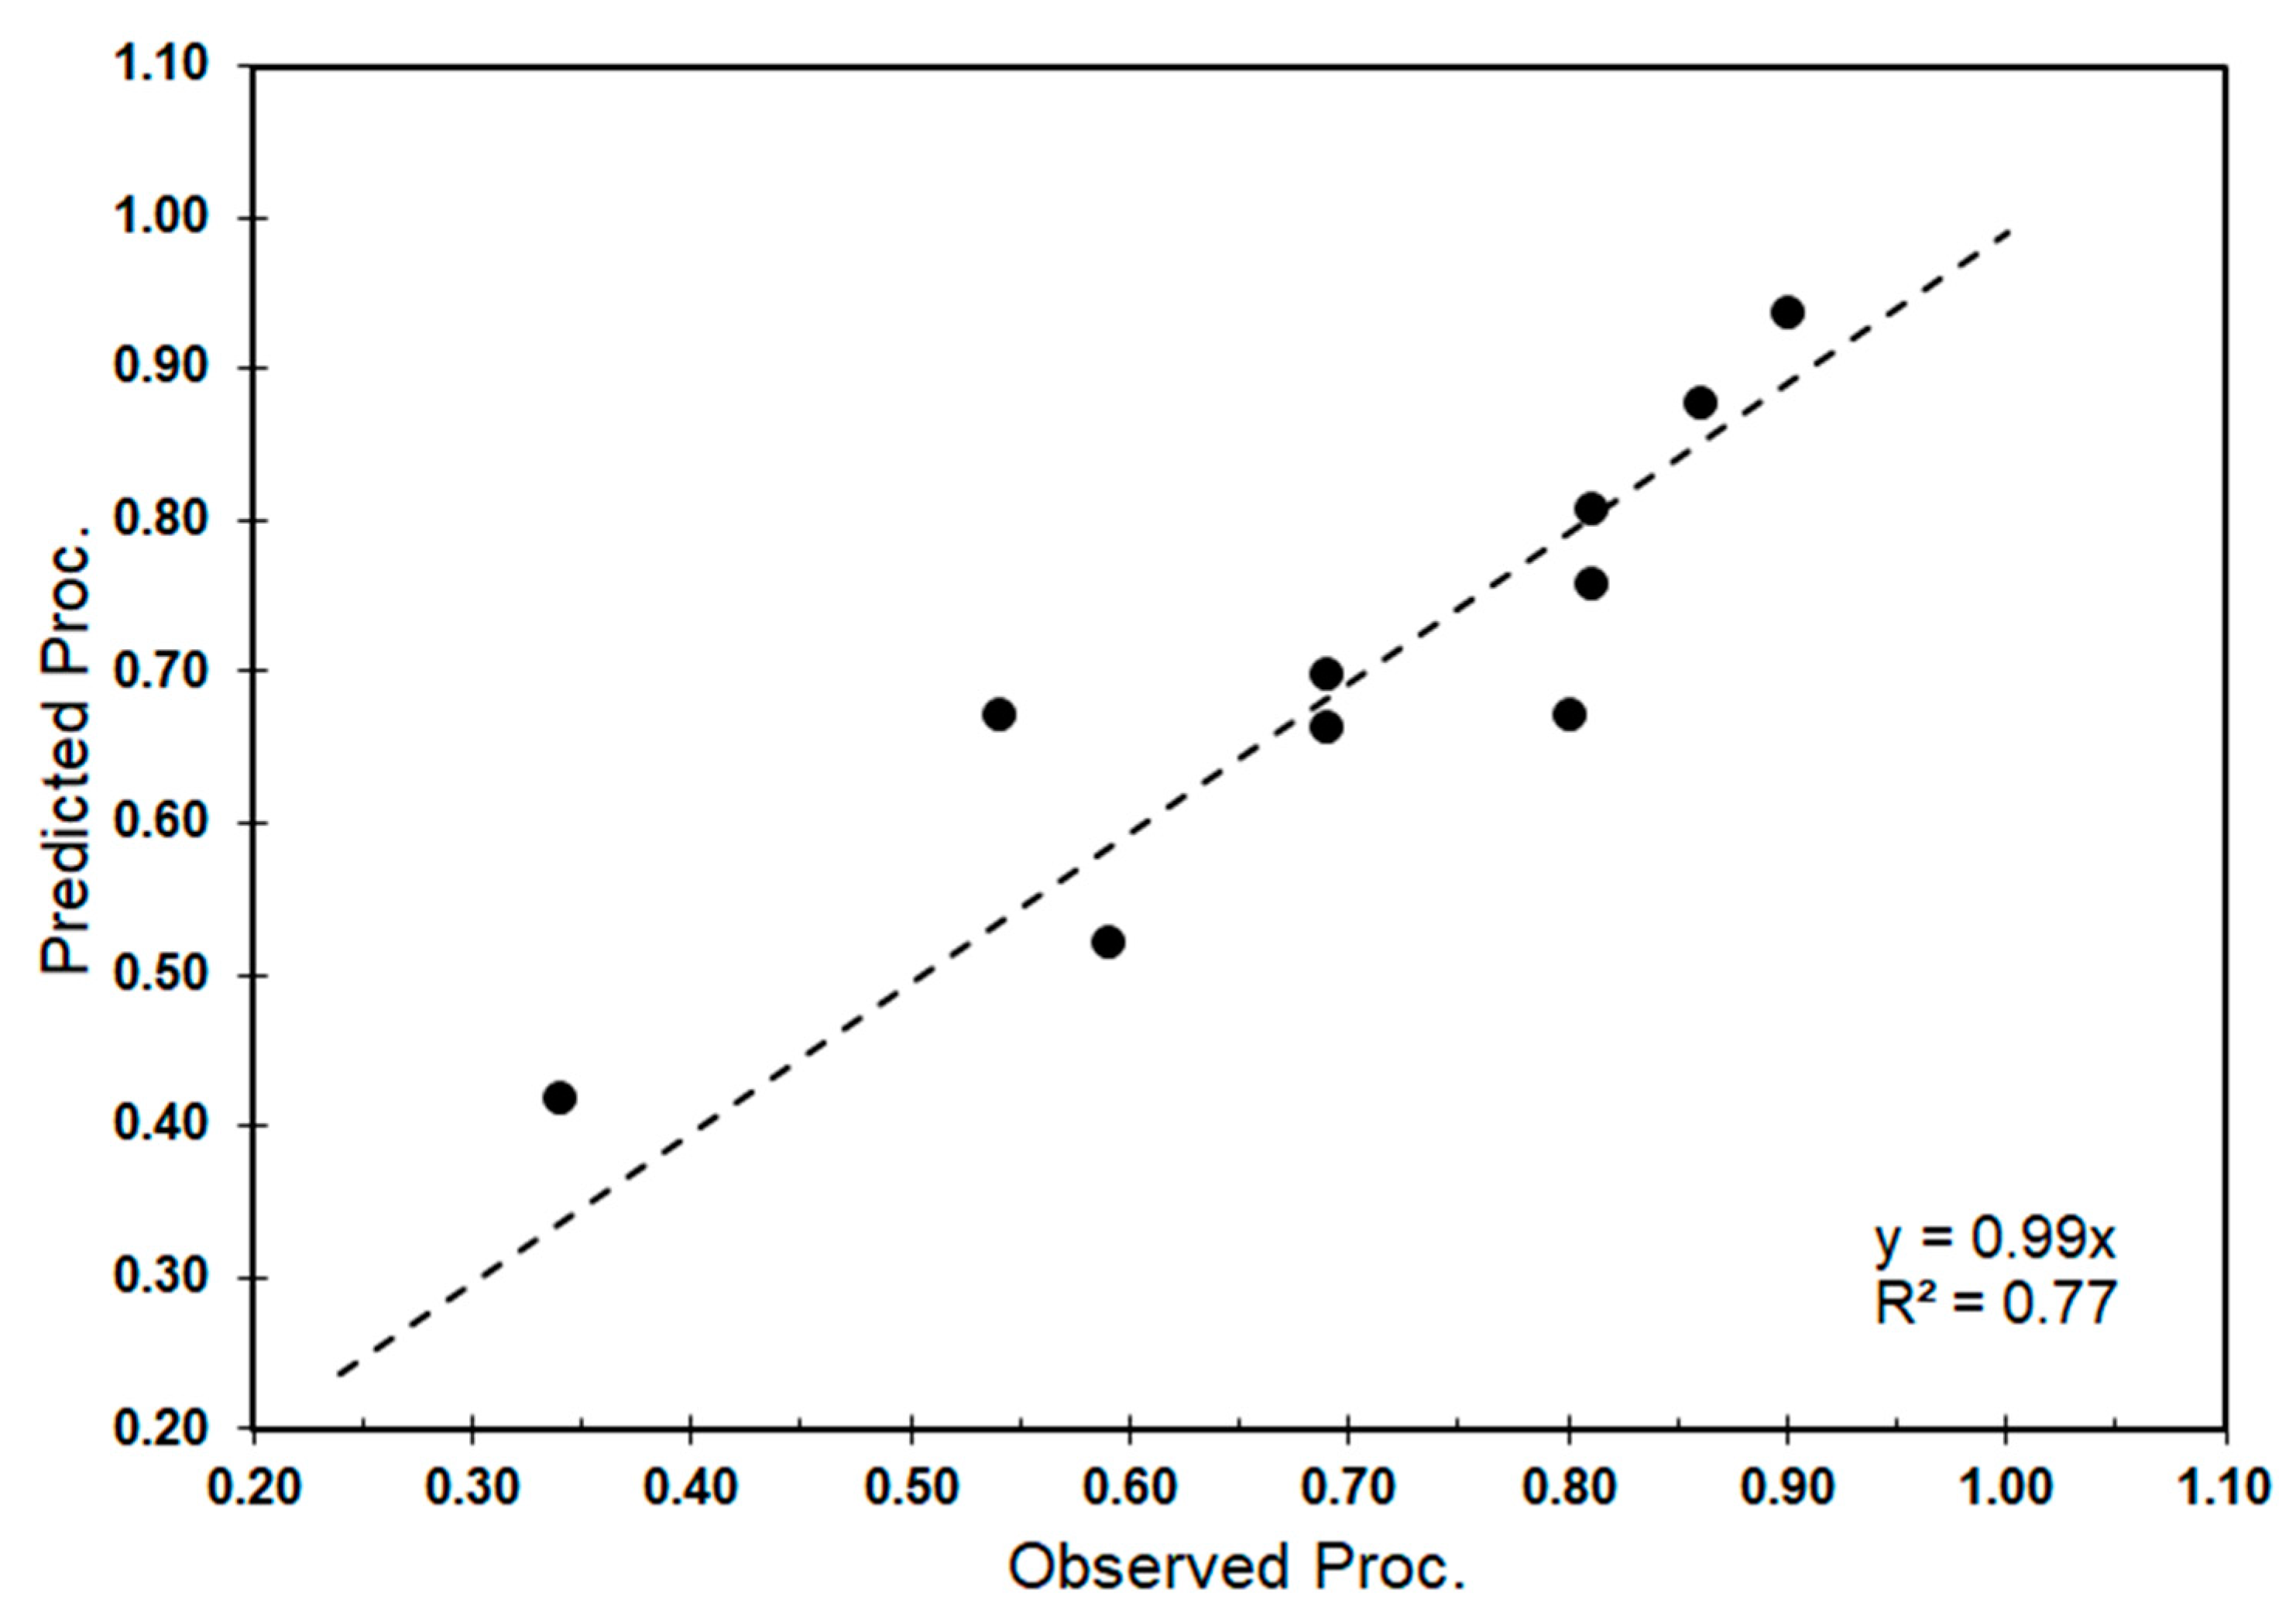
4.2.3. Prediction of Processability

In our companion paper, we developed a model to predict sample processability from the spectra of ore, the intent being to predict this parameter prior to arrival of the ore in the flotation cell, which is of value to guide the flotation process control. In this paper, we chose to derive a predictive model of processability using spectra of froth. In doing so, we aim to use this model to convert the imagery of froth for comparison such imagery processed with predictive models of SBR, fines, and ultrafines, as shown in the next section.
The model predicting sample processability (Equation (4)) involves four features. The RMS (root mean square) error for the model is 0.07 for the modeling suite of 10 samples. Figure 13 shows the comparison of the predicted and observed values with a best fit line (r2 = 0.77), and the model is unbiased.
P r e d i c t e d   P r o c e s s a b i l i t y V N I R = 0.24 + 181.77 × W 2.474 u m 2 P + 203.53 × W 2.330 u m 2 P + 179.38 × W 1.735 u m 2 P 121.80 × W 1.779 u m 3 P

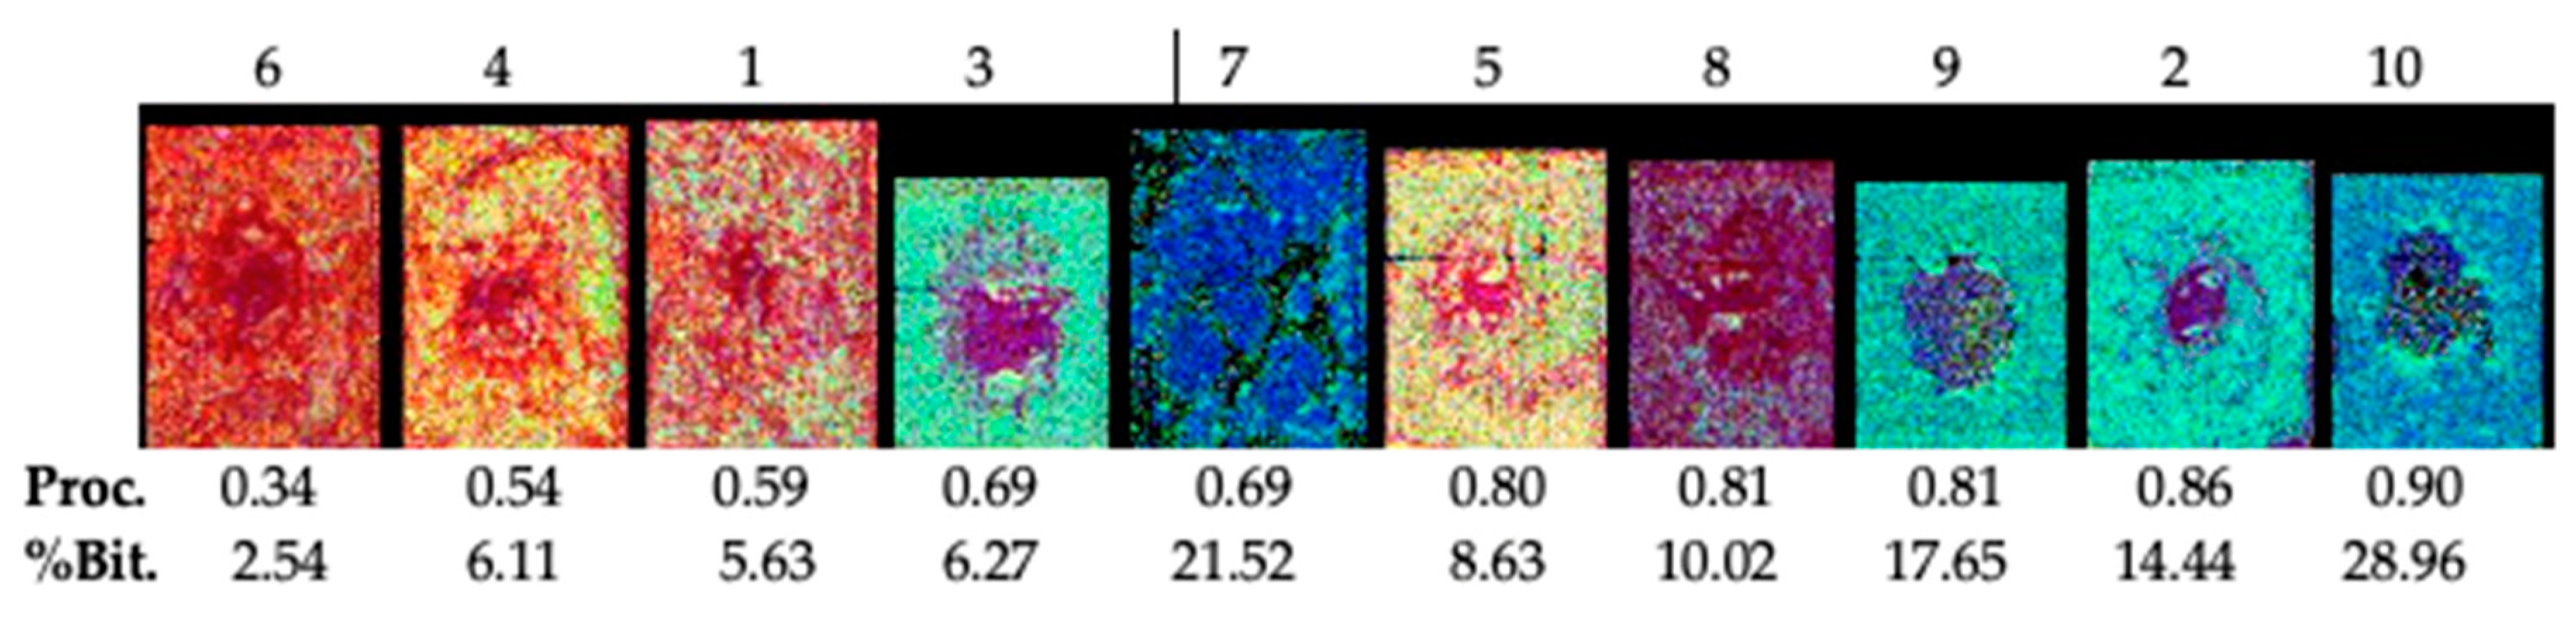
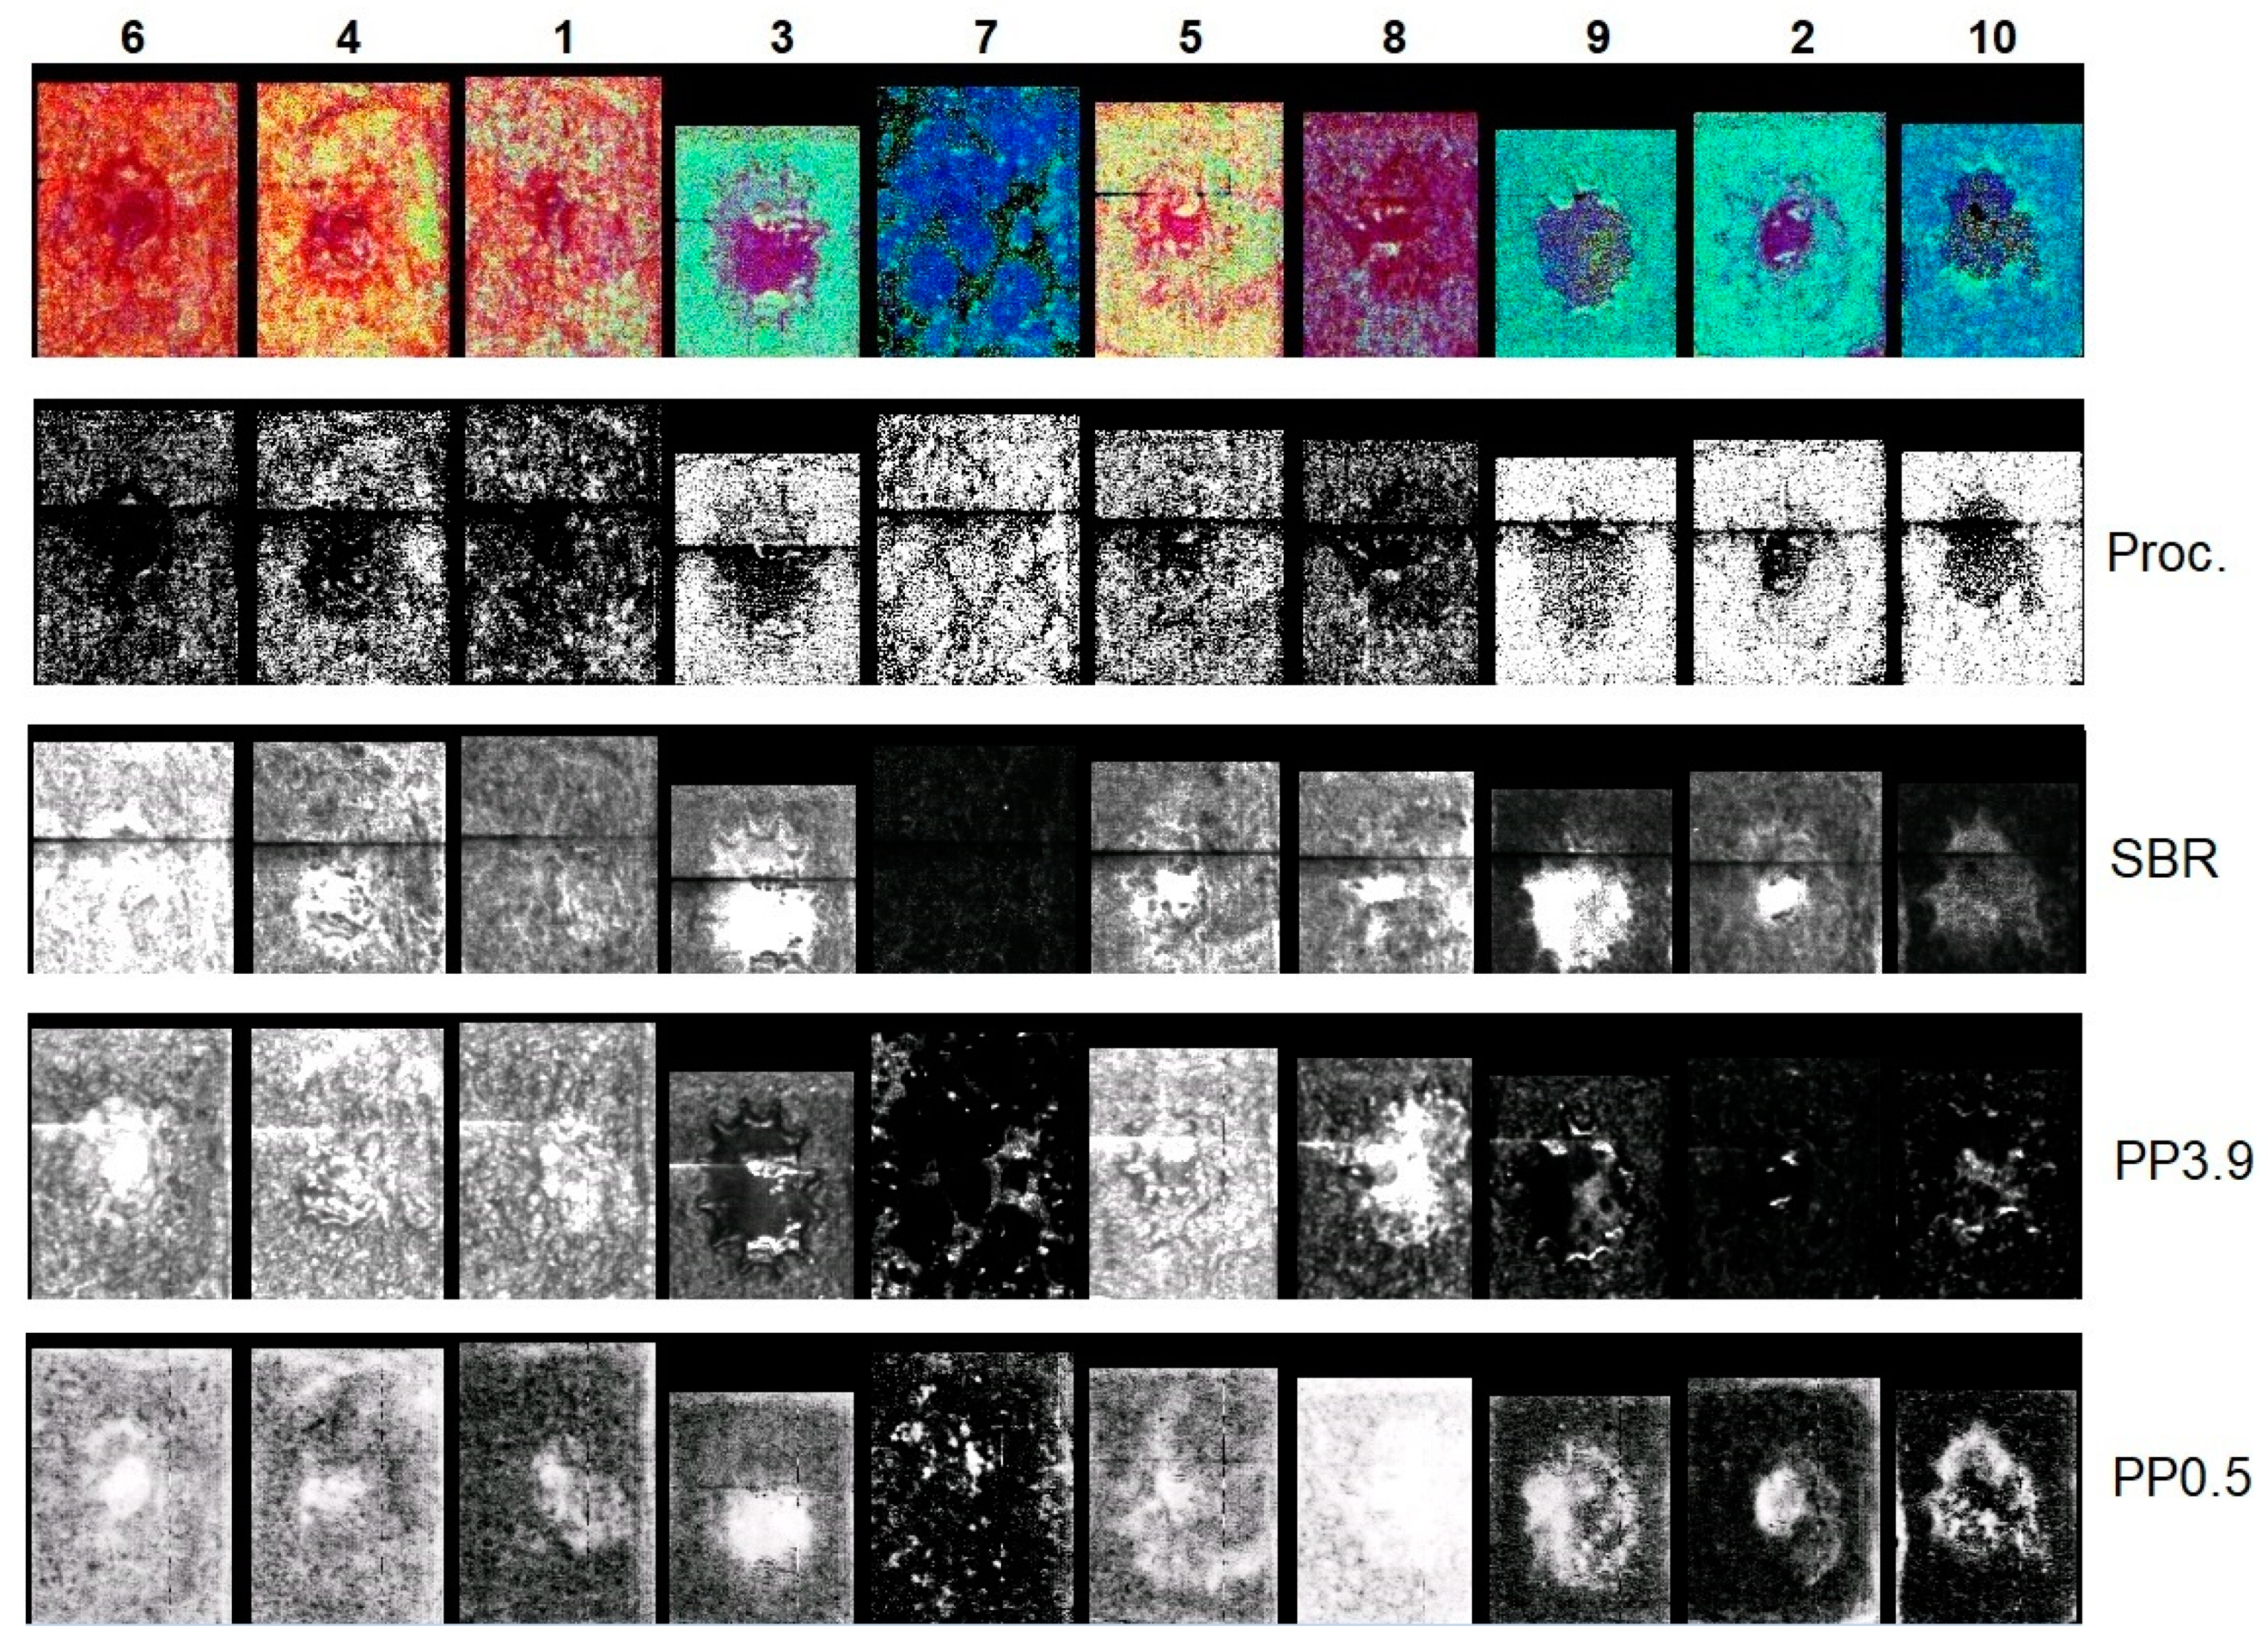
4.3. Application of Models to Froth Imagery of Sample Suite #1 (10 Samples)

The predictive models enable the conversion of froth imagery into image maps of a given froth parameter and the comparison of such imagery across a series of parameters as well as across a sample suite (Figure 14). The processability predicted from froth spectra generally follows the trend in measured processability (Table 3), though samples Sp#5 and 8 are underpredicted and the pattern seen resembles that in the color composite. This is consistent with a high froth solids and spectrally inferred fines and ultrafines content in these samples. The imagery of SBR follows the measured pattern in froth solids with sample Sp#6 being very high, Sp#7 very low, Sp#2, 9 and 10 being low and then the remaining samples. Sample-to-sample patterns in pp3.9 froth imagery appear similar to those seen for SBR.
We did not try to quantify image spatial heterogeneity seen in froth imagery for a given sample. For this sample suite the greatest heterogeneity observed is for imagery of SBR and pp3.9 for samples of lowest processability (e.g., 6,4,1, processability < 0.6) as well as sample Sp#5 (also high SBR and pp3.9 but higher processability of 0.80). The higher fines content of these samples may thus introduce more froth textural (smaller bubbles) and spectral variability. Imagery for the ultrafines (pp0.5) appear more homogeneous and highlight the documented anomalous ultrafines content of sample Sp#8, followed by samples Sp#1, 2, and then 5 in order of decreasing pp0.5 content (Table 3). The flow in the flotation cell likely affects the texture of the froth, especially near the center, where the impeller is withdrawn from the cell for imaging. In gravity separation cells, aerated slurry is introduced through a distributor, and so the froth mat is more homogeneous than in a flotation cell, which is used for secondary separation in some operations.

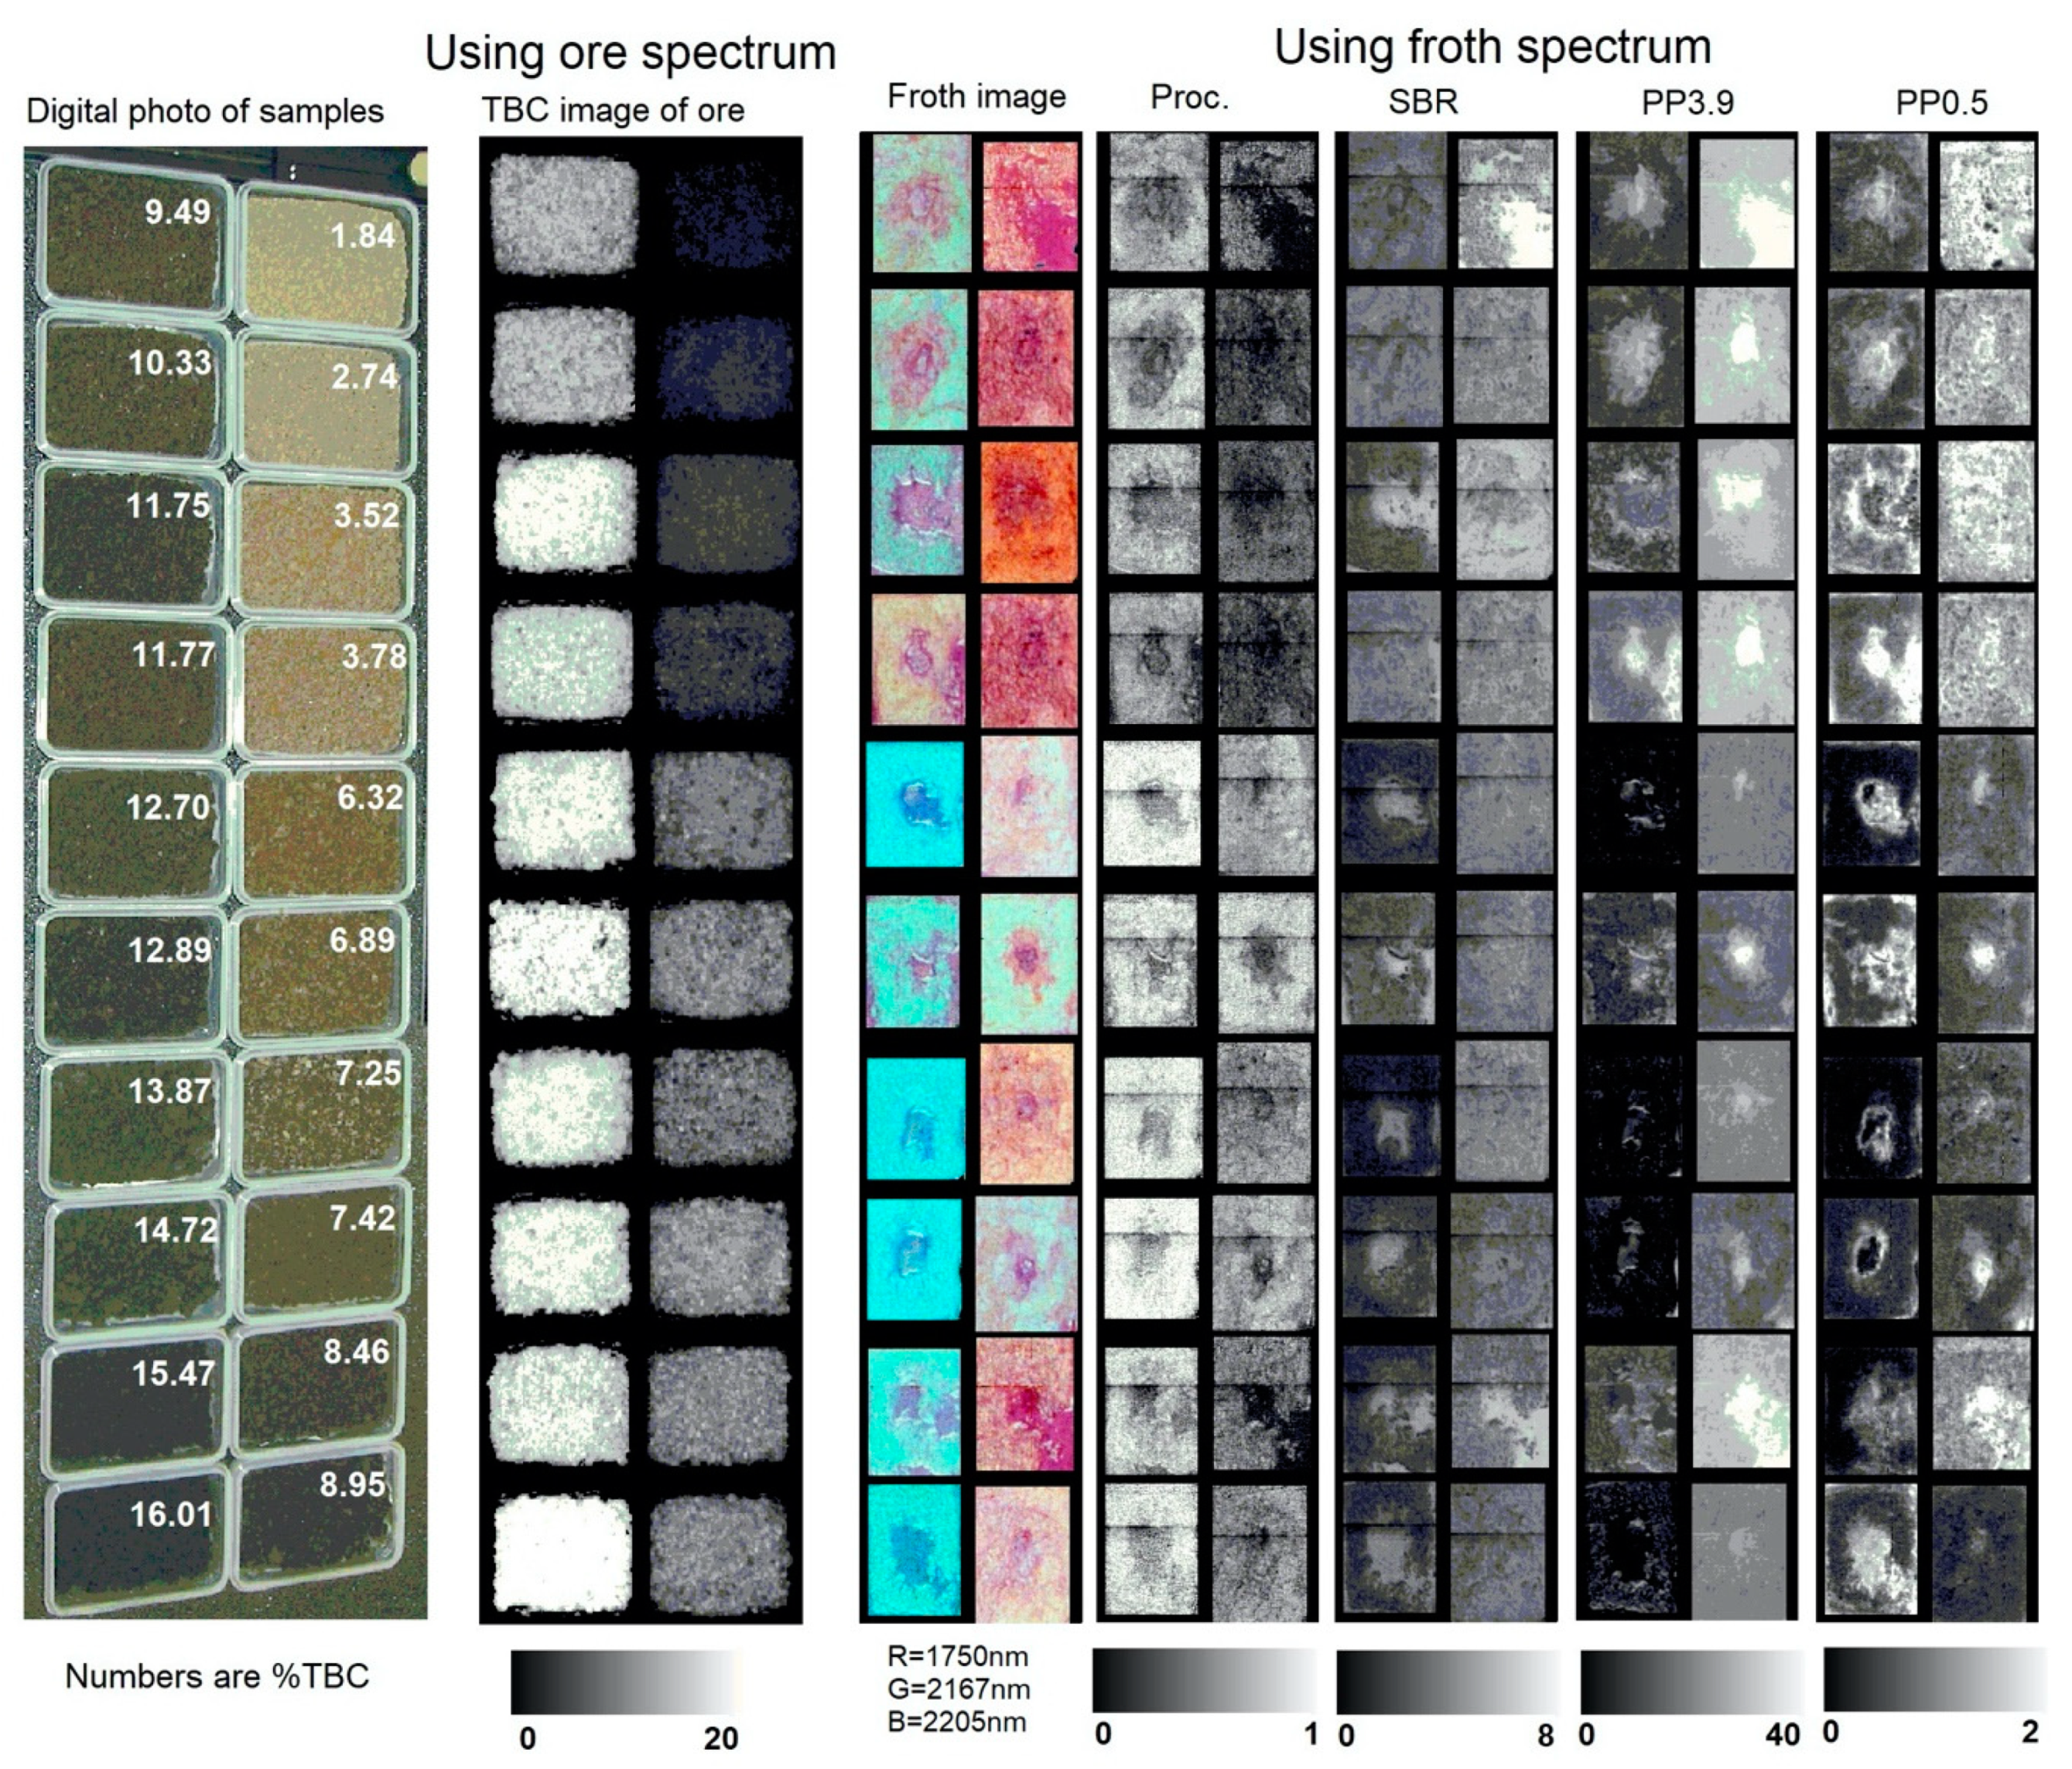
4.4. Application of Predictive Models to Froth Imagery of Sample Suite #2 (20 Samples)

The second sample suite consists of 20 samples spanning a greater variability in TBC, fines, and ultrafines content. Figure 15 displays the relationship between the total bitumen content (TBC) of the ore samples, the TBC predicted from spectral imagery of ore (see TBC model in companion paper), and the froth processability (Proc.), solid to bitumen ratio (SBR), pp39 and pp0.5 predicted from the imagery of froth.
These examples show that though the froth processability and quality generally relate to ore TBC, there can be exceptions where ore samples of similar TBC can generate substantially different contents in froth fines and ultrafines (pp0.5) as seen here for an ore of 8.46% TBC with anomalously high fines and ultrafines content. The detection of such anomalies is valuable for process control as events generating anomalous ultrafines content in the flotation cell can lead to a loss of process control and shutdown.

5. Discussion

5.1. Spectral Measurements of Froth

We know of no investigation regarding the feasibility of using infrared spectroscopy on oil sand froth. The presence of water in froth, and water being a strong absorber of infrared radiation, implied the potential lack of the detection of informative spectral features and data of poor signal to noise ratio. A primary contribution of our study has been to show that point spectra and spectral imagery of good quality can be acquired rapidly (<1 s and <15 s, respectively) and these capture spectral features diagnostic of bitumen and solids. These findings open the possibility of using this technology for measurements in an operating environment, although new challenges, including the presence of water vapor in the air between the froth and the sensor, would have to be addressed.

5.2. Infrared Spectra as a Tool to Reveal Froths of Poorer Quality

The characteristics of froth solids follow a general trend with ore processability but do not necessarily follow the detailed relations with the fines content observed in ore. Spectral imagery and data for froth solids reveal that Sp#8, as opposed to Sp#3 in ore, is distinct in its elevated froth ultrafines content (e.g., pp0.5), and yet this sample has a high processability. Anomalous ore characteristics therefore do not necessarily inform us of froth characteristics. Sp#5 is another sample displaying froth with an anomalously high solids content, given its processability, but the distinction lies in its elevated pp3.9 content, as revealed in the imagery and data of the froth fines content. Although the froth processability and quality generally relate to the ore TBC and thus can be predicted from the spectra of ore, as shown in our companion paper, there can be exceptions seen in imagery where ore samples of similar TBC generate froths of substantially different fines and ultrafines contents. The spectra of froth are thus required for their detection, and such data (imagery or point spectra) can be used to capture the variability in fines and ultrafines content in froth and to identify froth with a high solids content.
Our study also suggests the segregation of clays during the flotation process, because spectra with the most pronounced kaolinite feature are from samples with a bitumen rich froth, appearing green in our composite imagery. We suggest that this feature reflects the preferential adherence of this clay to the surface of bubbles. Spectra with the most pronounced illite-smectite feature are from samples with the lowest processability and generally the highest fines content (e.g., Sp#6, 4, 1) but also include samples with a fairly good processability but an anomalously high fines content (e.g., Sp#5 and 8).

5.3. Use of Spectral Information for Process Monitoring and Control

The spectral observations of froth could be used in a number of ways to potentially guide flotation process control decisions. If the intent was to identify froth with a problematic fines content, then the use of predictive models for fines and ultrafines combined with a defined threshold may suffice to reject bad froth. Doing so may also reject samples with a high processability, as seen in this study (e.g., Sp#5 and 8). The same outcome would be achieved by setting a threshold of 0.999 (Figure 8) to the depth of the kaolinite absorption at 2167 nm, retaining samples Sp#7, 10, 9, 2, 3, all displaying green froth imagery and a lower solids content.
Alternately, one could make use of a threshold applied to the strength of the illite-smectite absorption observed in froth, with the aim to retain all samples above a pre-defined processability. In this study, an illite-smectite absorption depth smaller than 0.998 (Figure 8) would reject froths from samples Sp#6, 4, and 1—thus, all samples with a processability < 0.60. With larger datasets, it should be possible to implement machine learning applied to the joint use of kaolinite and illite-smectite features. Though clay features in the spectra of froth are detectable (Figure 8), they are not pronounced (Figure 4), and thus to be of potential value for process control the data acquired must have a good signal to noise ratio. Whether this can be accomplished in an operational measurement setting remains to be determined. If larger scale trials are pursued, one could also consider acquiring the quantitative clay mineralogy of froth to explore a calibration with spectral observations.

5.4. Relative Merit of Point and Imaging Measurements

This study explored the use of a point spectrometer providing data from 0.35 to 2.50 µm and a spectral imaging camera with observations in the shortwave infrared (0.96–2.50 µm). Imagery provides an opportunity to examine spatial patterns (e.g., texture) in froth, however we did not readily identify critical information to characterize froth. In addition, given that point spectrometers can currently be acquired for less than half the cost of an imaging system, future tests aiming for data collection in situ would likely proceed with a point instrument. Broad band instruments could also be explored to further reduce the cost of instrumentation.

5.5. Contrasting Results between Both Companion Papers

In our companion paper, we reported on relationships between ore characteristics (including the spectra of ore) and froth color based on visual observations, because such observations are known to the oil sands industry. These observations resulted in portioning of the first sample suite into two classes of froth, brown encompassing samples Sp# 6, 4, 1, 3, and 5 and black encompassing Sp#2, 7, 8, 9, 10. In our second paper, froth “color” was a result of a composite of infrared features, with “red” froths encompassing Sp#6, 4, 1, 5, and 8, while “green” froths encompassed Sp#2, 7, 9, 10, and 3. Thus, sample Sp#3 observed to have a very brown froth and Sp#8 with a dark froth were swapped in their respective category. Froth color based on visual observations remains a subjective and qualitative metric in comparison to metrics derived from quantitative spectral observations capable of sensing the solids and bitumen content in froth.

6. Conclusions

A primary contribution of this study has been to show that, for froth in a flotation cell, point spectra and spectral imagery of good quality can be acquired rapidly (<1 s and <15 s, respectively) and these spectra capture spectral features diagnostic of bitumen and solids. These findings open the possibility of using this technology for measurements in an operating environment.
Anomalous ore characteristics do not necessarily inform us of froth characteristics. The spectra of froth are thus required for their detection, and such data capture variability in the fines and ultrafines content in froth. Ensuing models can predict the solids/bitumen (r2 = 0.88) and the %fines and ultrafines (particle passing at 3.9 and 0.5 µm) content of froth (r2 of 0.8 and 0.9). The spectral observations of froth could be used in a number of ways to potentially guide flotation process control decisions. If the intent was to identify froth with problematic fines content, then the use of predictive models for fines and ultrafines may suffice to reject froth with a high solids content or to process the froth under different conditions. Alternately, one could make use of a threshold applied to the strength of the illite-smectite absorption observed in froth with the aim to retain all samples above a pre-defined processability.
Given that point spectrometers can currently be acquired for less than half the cost of an imaging system, we recommend the use of the former for future trials in operating environments.

7. Patents

US Patent 9376627. Rivard, B.; Feng, J.; Lipsett, M. Hyperspectral imaging for ore froth characterization.
Canadian Patent 2,780,169. Rivard, B.; Feng, J.; Lipsett, M. Hyperspectral imaging for ore froth characterization.

Author Contributions

Conceptualization, B.R. and M.L; Data capture, J.F., M.L., D.R., V.B.; Data analysis and modelling, J.F.; Writing—Review and Editing, B.R., J.F., M.L; Funding acquisition, B.R. and M.L. All authors have read and agreed to the published version of the manuscript.

Funding

This research was funded by the Center for Oil Sands Innovation at the University of Alberta, grant number 2011-06.

Acknowledgments

This research was made possible by an infrastructure grant from the Canadian Foundation for Innovation under the John R. Evans Leaders Fund—Funding for research infrastructure, project 22222.

Conflicts of Interest

The authors declare no conflict of interest.

References

  1. Wills, B.A.; Napier-Munn, T. Wills’ Mineral Processing Technology, 7th ed.; Butterworth-Heinemann; Elsevier: Amsterdam, The Netherlands, 2006. [Google Scholar]
  2. Oestreich, J.; Tolley, W.; Rice, D. The development of a color sensor system to measure mineral compositions. Miner. Eng. 1995, 8, 31–39. [Google Scholar] [CrossRef]
  3. Hargrave, J.M.; Hall, S.T. Diagnosis of concentrate grade and mass flowrate in tin flotation from colour and surface texture analysis. Miner. Eng. 1997, 10, 613–621. [Google Scholar] [CrossRef]
  4. Haavisto, O.; Hyötyniemi, H. Reflectance spectroscopy in the analysis of mineral flotation slurries. J. Process. Control. 2009, 6, 14–16. [Google Scholar] [CrossRef]
  5. Khajehzadeh, N.; Haavisto, O.; Koresaar, L. On-stream mineral identification of tailing slurries of an iron ore concentrator using data fusion of LIBS, reflectance spectroscopy and XRF measurement techniques. Miner. Eng. 2017, 113, 83–94. [Google Scholar] [CrossRef]
  6. Bichard, J.A. Oil Sand Composition and behavior Research. In AOSTRA Technical Publication Series 4; Alberta Oil Sands Technology and Research Authority: Edmonton, AB, Canada, 1987; Chapter 1; pp. 6–62. [Google Scholar]
  7. Masliyah, J.; Zhou, Z.J.; Xu, Z.; Czarnecki, J.; Hamza, H. Understanding water-based bitumen extraction from Athabasca oil sands. Can. J. Chem. Eng. 2004, 82, 628–654. [Google Scholar] [CrossRef]
  8. Harjai, S.K.; Flury, C.; Masliyah, J.; Drelich, J.; Xu, Z. Robust aqueous–nonaqueous hybrid process for bitumen extraction from mineable Athabasca oil sands. Energy Fuels 2012, 26, 2920–2927. [Google Scholar] [CrossRef]
  9. Wiley & Sons. Wiley Critical Content—Petroleum Technology; Wiley–Interscience: Hoboken, NJ, USA, 2007; Volume 1, pp. 222–240. [Google Scholar]
  10. Hepler, L.G.; His, C. AOSTRA Technical Handbook on Oil Sands, Bitumen’s, and Heavy Oils. In AOSTRA Technical Publication Series 6; Alberta Oil Sands Technology and Research Authority: Edmonton, AB, Canada, 1989; Chapter 2; pp. 14–20. [Google Scholar]
  11. Ignasiak, T.M.; Kotlyar, L.; Longstaffe, F.J.; Strausz, O.P.; Montgomery, D.S. Separation and characterization of clay from Athabasca asphaltene. Fuel 1983, 62, 353–362. [Google Scholar] [CrossRef]
  12. Omotoso, O.; Mikula, R.J.; Stephens, P.W. Surface area of interstratified phyllysilicates in Athabasca oil sands from Synchrotron XRD, JCPDS–International Centre for Diffraction Data. Adv. X-ray Anal. 2002, 45, 391–396. [Google Scholar]
  13. Omotoso, O.E.; Mikula, R.J. High surface areas caused by smectitic interstratification of kaolinite and illite in Athabasca oil sands. Appl. Clay Sci. 2004, 25, 37–47. [Google Scholar] [CrossRef]
  14. Wallace, D.; Tipman, R.; Komishke, B.; Wallwork, V.; Perkins, E. Fines/water interactions and consequences of the presence of degraded illite on oil sands extractability. Can. J. Chem. Eng. 2004, 82, 667–677. [Google Scholar] [CrossRef]
  15. Osacky, M.; Geramian, M.; Ivey, D.G.; Lui, Q.; Etsell, T.H. Influence of nonswelling clay minerals (illite, kaolinite, and chlorite) on nonaqueous solvent extraction of bitumen. Energy Fuels 2015, 29, 4150–4159. [Google Scholar] [CrossRef]
  16. Geramian, M.; Osacky, M.; Ivey, D.G.; Lui, Q.; Etsell, T.H. Effect of swelling clay minerals (montorillonite and illite-smectite) on nonaqueous bitumen extraction from Alberta Oil Sands. Energy Fuels 2016, 30, 8083–8090. [Google Scholar] [CrossRef]
  17. Takamura, K.; Wallace, D. The Physical Chemistry of the Hot Water Process. J. Can. Pet. Tech. 1988, 27, 98–106. [Google Scholar] [CrossRef]
  18. Bulmer, J.T.; Starr, J. Syncrude Analytical Methods for Oil Sand and Bitumen Processing in Methods 2.9 and 2.10: Classical and Syncrude Methods for the Determination of Bitumen. In Water and Solids Content of Froth; AOSTRA: Edmonton, AB, Canada, 1979. [Google Scholar]
  19. Rivard, B.; Feng, J.; Gallie, A.; Sanchez-Azofeifa, A. Continuous wavelets for the improved use of spectral libraries and hyperspectral data. Remote Sens. Environ. 2008, 112, 2850–2862. [Google Scholar] [CrossRef]
Figure 1. Variability in ore fines (pp3.9%) and ultrafines (pp0.5%) content as a function of bitumen (TBC). (a) pp3.9% versus TBC%. (b) pp0.5% versus TBC% for sample suite 1. (c) pp0.5% versus TBC% for sample suite 2. Open and filled circles represent sample suites 1 and 2, respectively. Numbers refer to the sample numbers listed in Table 1.
Minerals 10 01137 g001
Figure 2. Variability in ore fines (pp3.9%) and ultrafines (pp0.5%) content for both sample suites. Open and filled circles represent sample suites 1 and 2, respectively. Numbers refer to the sample numbers listed in Table 1.
Minerals 10 01137 g002
Figure 3. Acquisition of reflectance data. Left: acquisition of point spectra of froth residing in a glass jar as implemented in the initial flotation experiments for the first sample suite (Sp#1–Sp#10). Right: acquisition of hyperspectral imagery for froth residing in the flotation cell as implemented during the later stage flotation experiments for all samples.
Minerals 10 01137 g003
Figure 4. Average point spectra for samples Sp#2, 4, and 6. The spectra are shown with the continuum remove to facilitate the identification of prominent absorption features due to water (W), oil (O), and clay minerals (C). Line patterns: Sp#2 dot-dashed, Sp#4 dashed, Sp#6 solid. Numbers 2, 4 and 6 in the figure are for Sp#2, 4, and 6 respectively.
Minerals 10 01137 g004
Figure 5. Time series of hyperspectral imagery of froth for Sp#2, 4, and 6, shown as a color composite of 1.2 µm (red), 1.9 µm (green), and 2.3 µm (blue). Froth rich in bitumen is darker green. Imagery is shown at 30 s, 5 min, and 10 min after the removal of the impeller (leaving circular opening in center of froth surface). Total bitumen content (TBC) and processability (Proc.) are listed for each sample.
Minerals 10 01137 g005
Figure 6. Scatterplots of ore processability (Proc.) and %fines (pp44 and pp3.9) and ultrafines (pp0.5) characteristics of ore. (a) pp44% versus processability. (b) pp3.9% versus pp44%. (c) pp0.5% versus pp44%. (d) pp0.5% versus pp3.9%. Numbers refer to the sample ID listed in Table 1.
Minerals 10 01137 g006
Figure 7. Scatterplots of %fines (pp3.9) and ultrafines (pp0.5) characteristics of froth, ore processability (Proc.), and froth bitumen. (a) pp0.5% versus processability. (b) pp0.5% versus pp3.9%. (c) pp0.5% versus bitumen%. Numbers refer to sample ID listed in Table 1.
Minerals 10 01137 g007
Figure 8. Average spectra of froth and froth solids displayed with the continuum removed to highlight the presence of absorption features centered at 2167 nm for kaolinite and 2205 nm for illite-smectite clays. Top: average point spectrum of 3 footprints of froth solids. Bottom: mean spectrum from froth imagery encompassing more than 10,000 pixels.
Minerals 10 01137 g008aMinerals 10 01137 g008b
Figure 9. Color composite of froth hyperspectral imagery in continuum removed reflectance (red = 1750 nm, green = 2167 nm, blue = 2205 nm). The sample ID is shown above each image. Processability values (Proc.) and % bitumen in froth (%Bit.) for each sample are shown below imagery. Samples with a predominance of illite-smectite clays in the froth display red color imagery (relatively depressed 2005 nm blue channel continuum-removed reflectance, thus appearing red in this composite).
Minerals 10 01137 g009
Figure 10. Scatter plot of the SBR determined in the laboratory from Dean–Stark analysis (True SBR) against the SBR predicted from the spectral model using froth spectra as an input. The dashed line represents the trend line.
Minerals 10 01137 g010
Figure 11. Comparison of %pp3.9 estimated from the spectra of froth with %pp3.9 measured from froth solids. The dashed line represents the trend line.
Minerals 10 01137 g011
Figure 12. Comparison of %pp0.5 estimated from the spectra of froth with %pp0.5 measured from froth solids. The dashed line represents the trend line.
Minerals 10 01137 g012
Figure 13. Scatter plot of the observed and predicted processability. The dashed line represents the trend line.
Minerals 10 01137 g013
Figure 14. Froth imagery of sample suite #1 (10 samples) converted to predicted values using the models described in Section 4.2: processability (Proc.), solids to bitumen (SBR), %pp3.9, and %pp0.5. These are displayed as a grey tone scale with brightest values corresponding to the highest predicted values. The reader should discard the near circular central region of each image where removal of the impeller has largely removed the froth. Additionally included for reference are the sample # and the color composite of froth imagery in continuum removed reflectance (red = 1750 nm, green = 2167 nm, blue = 2205 nm) presented in Figure 9.
Minerals 10 01137 g014
Figure 15. Froth imagery of sample suite #2 (20 samples) converted to predicted values using the models described in Section 4.2: processability (Proc.), solids/bitumen (SBR), %pp3.9, and %pp0.5. These are displayed as a grey tone scale, with the brightest values corresponding to the highest predicted values. The reader should discard the near circular central region of each image, where the removal of the impeller has disturbed and sometimes largely removed the froth. Additionally included for reference are the sample # and the previously presented color composite of froth imagery in the continuum removed reflectance (red = 1750 nm, green = 2167 nm, blue = 2205 nm).
Minerals 10 01137 g015
Table 1. Characteristics of the thirty oil sands ore samples used for the flotation experiment.
Sample ID%Bitumen%Water%Solids* pp44* pp3.9* pp0.5ModellingTesting
Sp#18.355.3986.0531.0015.190.46-
Sp#214.832.5883.2711.134.170.05-
Sp#39.824.4683.5227.309.630.94-
Sp#47.816.7285.8840.0613.510.22-
Sp#59.456.8483.4240.7513.720.23-
Sp#67.063.5389.2146.2416.000.34-
Sp#711.633.3684.706.713.370-
Sp#88.027.7884.4224.988.920.23-
Sp#913.973.5982.2613.835.530.07-
Sp#1014.203.1283.162.442.110.04-
Sp#111.8412.8585.3259.4516.181.76 -
Sp#122.7411.2885.8754.7518.381.83 -
Sp#133.529.1387.2853.6018.301.70 -
Sp#143.7812.5683.4444.8315.151.42 -
Sp#156.328.3785.3249.2514.081.25 -
Sp#166.898.6284.651.4514.281.34 -
Sp#177.257.9184.6247.4314.331.48 -
Sp#187.429.6882.4932.3810.280.98 -
Sp#198.467.0684.625.2013.231.06 -
Sp#208.958.5282.6621.7510.310.95 -
Sp#219.497.2882.839.2312.881.31 -
Sp#2210.337.382.1534.5811.301.21 -
Sp#2311.755.5582.2910.253.650.36 -
Sp#2411.776.5381.2722.587.470.94 -
Sp#2512.75.7781.598.613.090.33 -
Sp#2612.984.6582.5911.684.210.56 -
Sp#2713.874.2481.857.452.750.31 -
Sp#2814.72481.213.454.330.45 -
Sp#2915.472.2382.037.283.090.29 -
Sp#3016.011.5482.565.161.880.23 -
* pp44, pp3.9, and pp0.5 measured as % passing. Symbol—under Modelling and Testing indicates whether a given sample was used for modelling or testing.
Table 2. Ore processability and froth characteristics of the first sample suite.
Sample IDAverage Froth Quality a
Processability%Bitumen%SolidsSolids/Bitumen* pp3.9* pp0.5
Sp#10.595.6311.512.1413.000.40
Sp#20.8614.4415.931.174.580.14
Sp#30.696.2715.912.5913.860.36
Sp#40.616.1114.422.6430.071.04
Sp#50.808.6317.672.1019.560.53
Sp#60.282.5415.726.6323.840.86
Sp#70.6921.528.260.491.390.05
Sp#80.7510.0217.421.7913.271.65
Sp#90.8117.6516.441.036.230.24
Sp#100.9028.9617.320.612.270.07
* pp3.9 and pp0.5 measured as % passing. a Froth data averaged over the 4 operating conditions.
Table 3. Processability, ore, and froth characteristics of the first sample suite along with the imagery of froth *. Samples are listed in order of increasing processability.
Minerals 10 01137 i001
* Color composite of froth hyperspectral imagery in continuum removed reflectance (red = 1750 nm, green = 2205 nm, blue = 2350 nm). ** SBR = solids to bitumen ratio. All the pp values are percent passing at the given size measured in microns.
Table 4. List of wavelet spectral features best correlated to froth properties and ore processability.
Wavelength (µm)Correlation CoefficientScaleFeatures Used (-)
SBRpp3.9pp0.5Proc.
1.540.9564 -
1.5870.8655 -
1.7350.5612 -
1.760.86 -
1.7790.5723 -
2.130.845 -
2.180.7061-
2.1920.8396 -
2.2050.7931-
2.2550.7144-
2.330.6022 -
2.340.8555 -
2.4740.652 -
2.4920.7275-
Used (-) refers to used in the model. SBR = solids/bitumen, Proc. = processability. pp3.9 and pp0.5 measured as % passing.
Publisher’s Note: MDPI stays neutral with regard to jurisdictional claims in published maps and institutional affiliations.

