Article

Timing of Paleozoic Exhumation and Deformation of the High-Pressure Vestgӧtabreen Complex at the Motalafjella Nunatak, Svalbard

1
Faculty of Geology, Geophysics and Environmental Protection, AGH University of Science and Technology, 30-059 Krakow, Poland
2
Insitut des Sciences de la Terre, Université Grenoble Alpes, 38058 Grenoble, France
3
Department of Earth and Environmental Sciences, University of Ottawa, Ottawa, ON K1N 6N5, Canada
4
Department of Earth Sciences, Uppsala University, 752 36 Uppsala, Sweden
*
Author to whom correspondence should be addressed.
Minerals 2020, 10(2), 125; https://doi.org/10.3390/min10020125
Submission received: 15 December 2019 / Revised: 25 January 2020 / Accepted: 29 January 2020 / Published: 31 January 2020
(This article belongs to the Special Issue High‐and Ultrahigh‐Pressure Rocks)

Abstract

:
The Vestgӧtabreen Complex exposed in the Southwestern Caledonian Basement Province of Svalbard comprises two Caledonian high-pressure units. In situ white mica 40Ar/39Ar and monazite Th-U-total Pb geochronology has resolved the timing of the tectonic evolution of the complex. Cooling of the Upper Unit during exhumation occurred at 476 ± 2 Ma, shortly after eclogite-facies metamorphism. The two units were juxtaposed at 454 ± 6 Ma. This was followed by subaerial exposure and deposition of Bullbreen Group sediments. A 430–400 Ma late Caledonian phase of thrusting associated with major sinistral shearing throughout Svalbard deformed both the complex and the overlying sediments. This phase of thrusting is prominently recorded in the Lower Unit, and is associated with a pervasive greenschist-facies metamorphic overprint of high-pressure lithologies. A c. 365–344 Ma geochronological record may represent an Ellesmerian tectonothermal overprint. Altogether, the geochronological evolution of the Vestgӧtabreen Complex, with previous petrological and structural studies, suggests that it may be a correlative to the high-pressure Tsäkkok Lens in the Scandinavian Caledonides. It is suggested that the Vestgӧtabreen Complex escaped to the periphery of the orogen along the sinistral strike-slip shear zones prior to, or during the initial stages of continental collision between Baltica and Laurentia.

1. Introduction

The northwestern sub-aerial exposure of the Barents Shelf, the Svalbard archipelago, provides an intricate record of tectonism from the Proterozoic to the Neogene [1,2,3,4] and is a vital locality for high-Arctic plate tectonic reconstructions. Two prominent Paleozoic tectonic events were recorded on Svalbard, the Caledonian Orogeny and the Ellesmerian Orogeny [4]. The most prominent of the two Paleozoic events is the Caledonian Orogeny, which encompasses subduction of oceanic lithosphere as early as the late Cambrian to the final collision stages of the orogeny from the early Silurian through Early-to-Middle Devonian [5,6]. This orogen is regarded to be responsible for the assembly of three crystalline Caledonian Basement Provinces that now collectively comprise Svalbard (Figure 1) [2,7,8]. Some of the most well-studied rocks pertaining to the subduction history of the Caledonian Orogeny belong to the Upper and Lower units of the Vestgӧtabreen Complex. This complex is exposed along the length of Oscar II Land in the Southwestern Caledonian Basement Province (SCBP) and is considered exotic in relation to the surrounding rocks [7]. Detailed petrological and structural studies have been conducted to decipher the evolution of the high-pressure (HP) lithologies, yet the geochronological record is severely lacking. In particular, no geochronological studies have targeted HP rocks of the Lower Unit. Such geochronological data is required to place the pressure–temperature and structural history of the HP rocks into a greater geodynamic context for the Caledonian Orogeny and to establish tectonic correlations. The subordinate event, the Late Devonian to early Carboniferous Ellesmerian Orogeny, is only well-documented in a few localities in Svalbard [9,10,11,12]. However, recent work is beginning to expand the coverage of Ellesmerian tectonism across more of Svalbard [13,14]. The identification of the Ellesmerian record of tectonism in new regions of Svalbard is crucial for Paleozoic plate tectonic reconstructions.
This study presents geochronological datasets from the Vestgӧtabreen Complex exposure at the Motalafjella nunatak (Figure 1). In situ white mica 40Ar/39Ar geochronology was applied to HP lithologies from both Upper and Lower units. In addition, the results of monazite Th-U-total Pb geochronology from greenschist-overprinted blueschist-facies rocks of the Lower Unit is presented. Collectively, these geochronological data, interpreted in the context of previous petrological and structural studies, presents a detailed history of tectonism for the HP Vestgӧtabreen Complex from exhumation in the Early Ordovician to continental collision in the Silurian, as well as possible Late Devonian to early Carboniferous overprint of the Ellesmerian Orogeny.

2. Geological Background

The crystalline rocks on Svalbard record a multi-phase deformational history that was recorded in three Caledonian Basement Provinces that were amalgamated along major strike-slip boundaries during the Caledonian Orogeny (Figure 1) [1,2,7,8,17,18,19]. Within these provinces, two prominent Paleozoic tectonic events were recorded: (1) the late Cambrian to Early Devonian Caledonian Orogeny, and (2) the Late Devonian to early Carboniferous Ellesmerian Orogeny. The structures related to these events are commonly overprinted by Eocene Eurekan tectonism [4,20,21]. In the SCBP, a suite of HP Caledonian rocks, collectively known as the Vestgӧtabreen Complex [22], are exposed in Oscar II Land and possibly continue southwards through Nordenskiöld Land [23]. This complex is best exposed within the Motalafjella nunatak [15,22,24,25,26] where it is divided into two structural units separated by a SW-dipping thrust [15]. The two units are termed the “Upper Unit” and the “Lower Unit”. Both units bear HP assemblages [24]. The Upper Unit consists of garnet-bearing blueschist and eclogite lenses within schists of various composition, whereas the Lower Unit comprises of lenses of blueschists, metapelites, calc-schists, and green and black phyllites [24,25,27,28]. Eclogite is notably absent within the Lower Unit.
A detailed structural investigation of the Vestgӧtabreen Complex at Motalafjella was conducted by Labrousse et al. [16]. In both of the Upper and Lower units, the schistosity is parallel to the bounding thrust. In the Upper Unit, very localized top-to-S shear sense is observed and most of the stretching markers are symmetrical. In contrast, more pervasive, top-to-S sense of shear are recorded in the Lower Unit. Proximal to the bounding thrust in both units, the shear sense becomes top-to-N. Lineations in both units are oriented approximately in the NNE-SSW direction. An unconformable contact between the underlying Lower Unit and the overlying Bullbreen Group has been identified in the field [29], which is of late Ordovician to early Silurian age [30,31,32]. However, the contacts between the Upper Unit and the Bullbreen Group are all observed to be thrusts. Both Upper and Lower units are folded together with the Bullbreen Group around an approximate NE–SW axis into a recumbent syncline [16]. The bounding thrust of the units and the syncline exhibit the same vergence.
Pressure-temperature (P-T) estimates for the Upper Unit, derived from eclogites, have been estimated at 18–24 kbar and 575–645 °C [33] by the Fe/Mg distribution between garnet and clinopyroxene that is in equilibrium with jadeite and quartz. In contrast to the Upper Unit, the carpholite-bearing rocks of the Lower Unit have yielded lower temperature and pressure conditions of 15–16 kbar and 380–400 °C [34] using a combination of thermobarometers. The Nordenskiöld Land locality provided similar estimates of 14–18 kbar and 470–490 °C obtained from conventional thermobarometry based on garnet, phengite and ferroglaucophane compositions [23].
Geochronological studies that were previously conducted on the Vestgӧtabreen Complex have all targeted the Upper Unit at Motalafjella. The timing of HP metamorphism for the Upper Unit has been resolved to 476 ± 30 Ma determined by a Pb-loss event of zircon in eclogite [35]. Horsfield [24] pioneered the first geochronological investigations. Their study provided whole-rock K-Ar dates of 402 ± 14 Ma and 428 ± 24 Ma from a garnet-glaucophane-muscovite schist and a quartz-muscovite-garnet schist, respectively [24]. The c. 402 and 428 Ma dates were interpreted as a late Caledonian tectonothermal overprint. Dallmeyer et al. [36] conducted white mica 40Ar/39Ar step-heating analyses, producing variably discordant 40Ar/39Ar date spectra. They interpreted plateau dates that varied from 452.9 ± 2.3 Ma to 475.1 ± 1.7 Ma as cooling ages, and also inferred a c. 425–400 Ma low-grade thermal (≤425 °C) overprint recorded in the white mica [36]. In the broader region of northern and central Oscar II Land, Michalski et al. [14] reported in situ white mica and biotite 40Ar/39Ar dates of c. 426–380 Ma, interpreted to record Caledonian metamorphism [14].
The evidence for deformation pertaining to the Ellesmerian Orogeny has historically been recognized within and along the margins of the Devonian Old Red Sandstone basin of central-northern Svalbard (Figure 1) [4,9,10,11,12]. However, recent investigations of the Pinkie Unit on Prins Karls Forland have established it as a relic of the Ellesmerian Orogeny (Figure 1) [13]. The Pinkie Unit comprises an amphibolite-facies metasedimentary succession. Conventional thermobarometry, coupled with Quartz-in-garnet barometry and trace element thermometry, yielded P-T conditions of c. 7–10 kbar and ~550–650 °C [13] for the unit. The timing of metamorphism has been resolved with monazite Th-U-total Pb geochronology, yielding a prograde-to-peak evolution from c. 373 Ma to c. 355 Ma [13] with an upper boundary shear zone of Ellesmerian age [37]. Discovery of this locality has extended the evidence for Ellesmerian tectonism across Svalbard. More recently, Michalski et al. [14] also reported 40Ar/39Ar dates of c. 377–326 Ma from Oscar II Land and interpreted these to represent an Ellesmerian thermal overprint [14].

3. Vestgӧtabreen Complex Samples

A total of eleven samples targeted geochronological investigations using either in situ white mica 40Ar/39Ar geochronology, monazite Th-U-total Pb geochronological analysis, or both (Figure 1, Table 1). Five of the samples were obtained from the Upper Unit and the remaining six were from the Lower Unit of the Vestgӧtabreen Complex exposed at Motalafjella. The five samples from the Upper Unit constituted high-pressure lithologies with rock fabrics that clearly developed during HP (i.e., blueschist facies) metamorphism (Figure 2). Of these five rocks, one could be classified as a garnet-white mica schist (MIK18-01). This rock preserves a strong foliation that is defined by alternating layers of white mica and chlorite (Figure 2A). Garnet within this rock were up to 500 μm in diameter and were partially retrogressed to chlorite. The garnet-white mica schists constituted the host rocks for the blueschists in the Upper Unit [25]. Three blueschists hosted in the mica schists were sampled. The blueschists could be described as quartz-bearing, well-foliated with sparse white mica grains that were parallel to the main foliation defined by glaucophane (MIK18-02; Figure 2B), quartz-absent well-foliated with abundant, large white mica grains that were also parallel to the foliation (MIK18-06A; Figure 2C), or massive blueschists with large clusters of seemingly randomly oriented white mica grains (MIK18-07A). In all three samples, chloritoid porphyroblasts were abundant but were often partially replaced by chlorite. A minor amount of calcite was also recognized. In the well-foliated blueschists, the garnet was up to 1 mm in diameter and was only partially replaced by chlorite along their margins. Garnet was absent in the massive blueschist. Chlorite could also be observed in association with white mica in all of the samples. Relic lawsonite was preserved in MIK18-06A (Figure 2B), whereas very fine-grained polymineralic pseudomorphs after lawsonite could be observed in MIK18-07A. The lawsonite pseudomorphs in the latter were randomly oriented (Figure 2C). The final sample of the Upper Unit was a well-foliated schistose marble (SN18-14) obtained close to the thrust bounding the two units (Figure 1). The foliation in the marble was easily recognized by the elongation of white mica grains that were sometimes slightly bent and kinked (Figure 2D). Bands of very fine-grained calcite were parallel to the elongation of the white mica, and separate lenses of coarse-grained calcite (Figure 2D).
In the Lower Unit, the majority of the samples were obtained from the phyllite lithologies that dominated the exposure (SN18-05A, -06, -11B, -12). These rocks have strong foliations that were defined by fine-grained white mica and chlorite, as well as recrystallized quartz ribbons (Figure 2E,F). These rocks were altogether devoid of garnet, chloritoid, glaucophane and lawsonite. A sample of a retrogressed blueschist was obtained from the Lower Unit (SN18-09B). This rock had a moderate foliation predominantly defined by white mica, quartz ribbons and sparse chlorite. Remnants of glaucophane were somewhat aligned with the foliation, but some orientations were observed to be at low-to-moderate angles with respect to the foliation (Figure 2G). Small, rare chloritoid grains were also present but were pervasively retrogressed to chlorite. Very fine-grained polymineralic pseudomorphs after lawsonite were present throughout the sample. The final sample was obtained proximal to the contact of the Lower and Upper Units (MIK18-03A; Figure 1), near to the unconformably overlying Bullbreen Group. This sample had a strongly brecciated fabric with a heterogenous size distribution of angular clasts within a fine-grained matrix. The clasts had predominantly massive fabrics and were composed of coarse-grained quartz and calcite. However, some of the clasts were composed of white mica and chlorite that defined a strong foliation and were sometimes crenulated (Figure 2H). These clasts strongly resembled the lithologies of the Lower Unit phyllites.

4. In situ White Mica 40Ar/39Ar Geochronology

4.1. Methods

A total of ten samples were dated from the Vestgӧtabreen Complex at Motalafjella: five from the Upper Unit, and five from the Lower Unit. These samples were mainly chosen according to the presence and quality of white mica, lithology, and their structural positions with regard to the main bounding thrust. Thick sections (~500 μm thick) were made from the samples and glued to glass plates using Superglue™. The areas of interest for in situ white mica 40Ar/39Ar geochronology were selected and photographed using back-scattered electron (BSE) imaging and mapped for major elements (Si, Al, Mg, Fe, K) using wavelength-dispersive spectrometry (WDS) with an electron microprobe (Figure 3). The WDS geochemical mapping was conducted using the JEOL JXA8530F field-emission electron microprobe (EMP) at Uppsala University (Uppsala, Sweden). The analytical conditions for the maps were 15 KeV and 200 nA.
The thick sections were re-polished after geochemical mapping to remove the carbon coating. The target areas of interest were cut from the thick sections into squares of 1 cm2 and subsequently removed from the glass plate using acetone to dissolve the adhesive. The samples were placed in 2 mm deep wells in 18 mm diameter aluminium disks, with reference material placed surrounding the unknowns to evaluate the lateral neutron flux gradients across the disk and unknowns. The reference materials were Fish Canyon sanidine (28.2 Ma) [38] and GA1550 biotite (98.5 Ma) [39]. All specimens were irradiated for 24 h in the cadmium-lined, in-core CLICIT facility of the Oregon State University TRIGA reactor. Planar regressions were fit to the reference data, and the 40Ar/39Ar neutron fluence parameter, J, was interpolated for the unknowns.
In situ intragrain fusion 40Ar/39Ar analytical work was performed at the University of Manitoba (Winnipeg, MB, Canada) using a multi-collector Thermo Fisher Scientific ARGUS VI mass spectrometer, linked to a stainless steel Thermo Fisher Scientific extraction/purification line, and Photon Machines (Analyte Excite) 193 nm laser. Argon isotopes (from mass 40 to 37) were measured using Faraday detectors with low noise 1 × 10¹² Ω resistors and mass 36 was measured using a compact discrete dynode (CDD) detector. The sensitivity for argon measurements was ~6.312 × 10¹⁷ moles/fA as determined from measured aliquots of Fish Canyon Sanidine [38,40]. The standards were placed in a Cu sample tray, with a KBr cover slip, in a stainless steel chamber with a differentially pumped ZnS viewport attached to a Thermo Fisher Scientific extraction/purification line and baked with an infrared lamp for 24 h.
The Vestgӧtabreen Complex samples were mounted using a ceramic adhesive (PELCO®) on a quartz slide placed in a stainless steel chamber with a sapphire viewport attached to a stainless steel high vacuum extraction system and baked with an infrared lamp for 48 h. For this study, a raster size of about 100 × 100 µm or 50 × 200 µm was used, depending on the shape of the white mica grain. Both BSE images and the geochemical maps were used for designation of the analytical placements. Analytical targets were placed according to both EMPA mapped locations, and also locations that were not mapped, but for which BSE images were acquired. In accordance with the WDS analyses, the locations for the in situ 40Ar/39Ar analyses were also in the central domains. This was done to avoid possible zoning of the white mica due to localized biotite or chlorite replacement of the white mica. Reactive gases were removed for both the reference standards and Tsäkkok Lens samples, after 3 min, by three NP-10 SAES getters (two at room temperature and one at 450 °C) prior to being admitted to the mass spectrometer by expansion. Five argon isotopes were measured simultaneously over a period of 6 min. Measured isotope abundances were corrected for extraction-line blanks, which were determined before every sample analysis. Mass discriminations were monitored by online analysis of air pipettes. A value of 295.5 was used for the atmospheric 40Ar/36Ar ratio [41] for the purposes of routine measurement of mass spectrometer discrimination using air aliquots, and correction for atmospheric argon in the 40Ar/39Ar age calculation. Corrections were made for neutron-induced 40Ar from potassium, 39Ar and 36Ar from calcium, and 36Ar from chlorine [42,43,44]. Data collection was performed using Pychron [45] and data reduction, error propagation, age calculation and plotting were performed using MassSpec software (Version 8.091) [46]. The decay constants used were those recommended by Steiger and Jäger [41].

4.2. Results

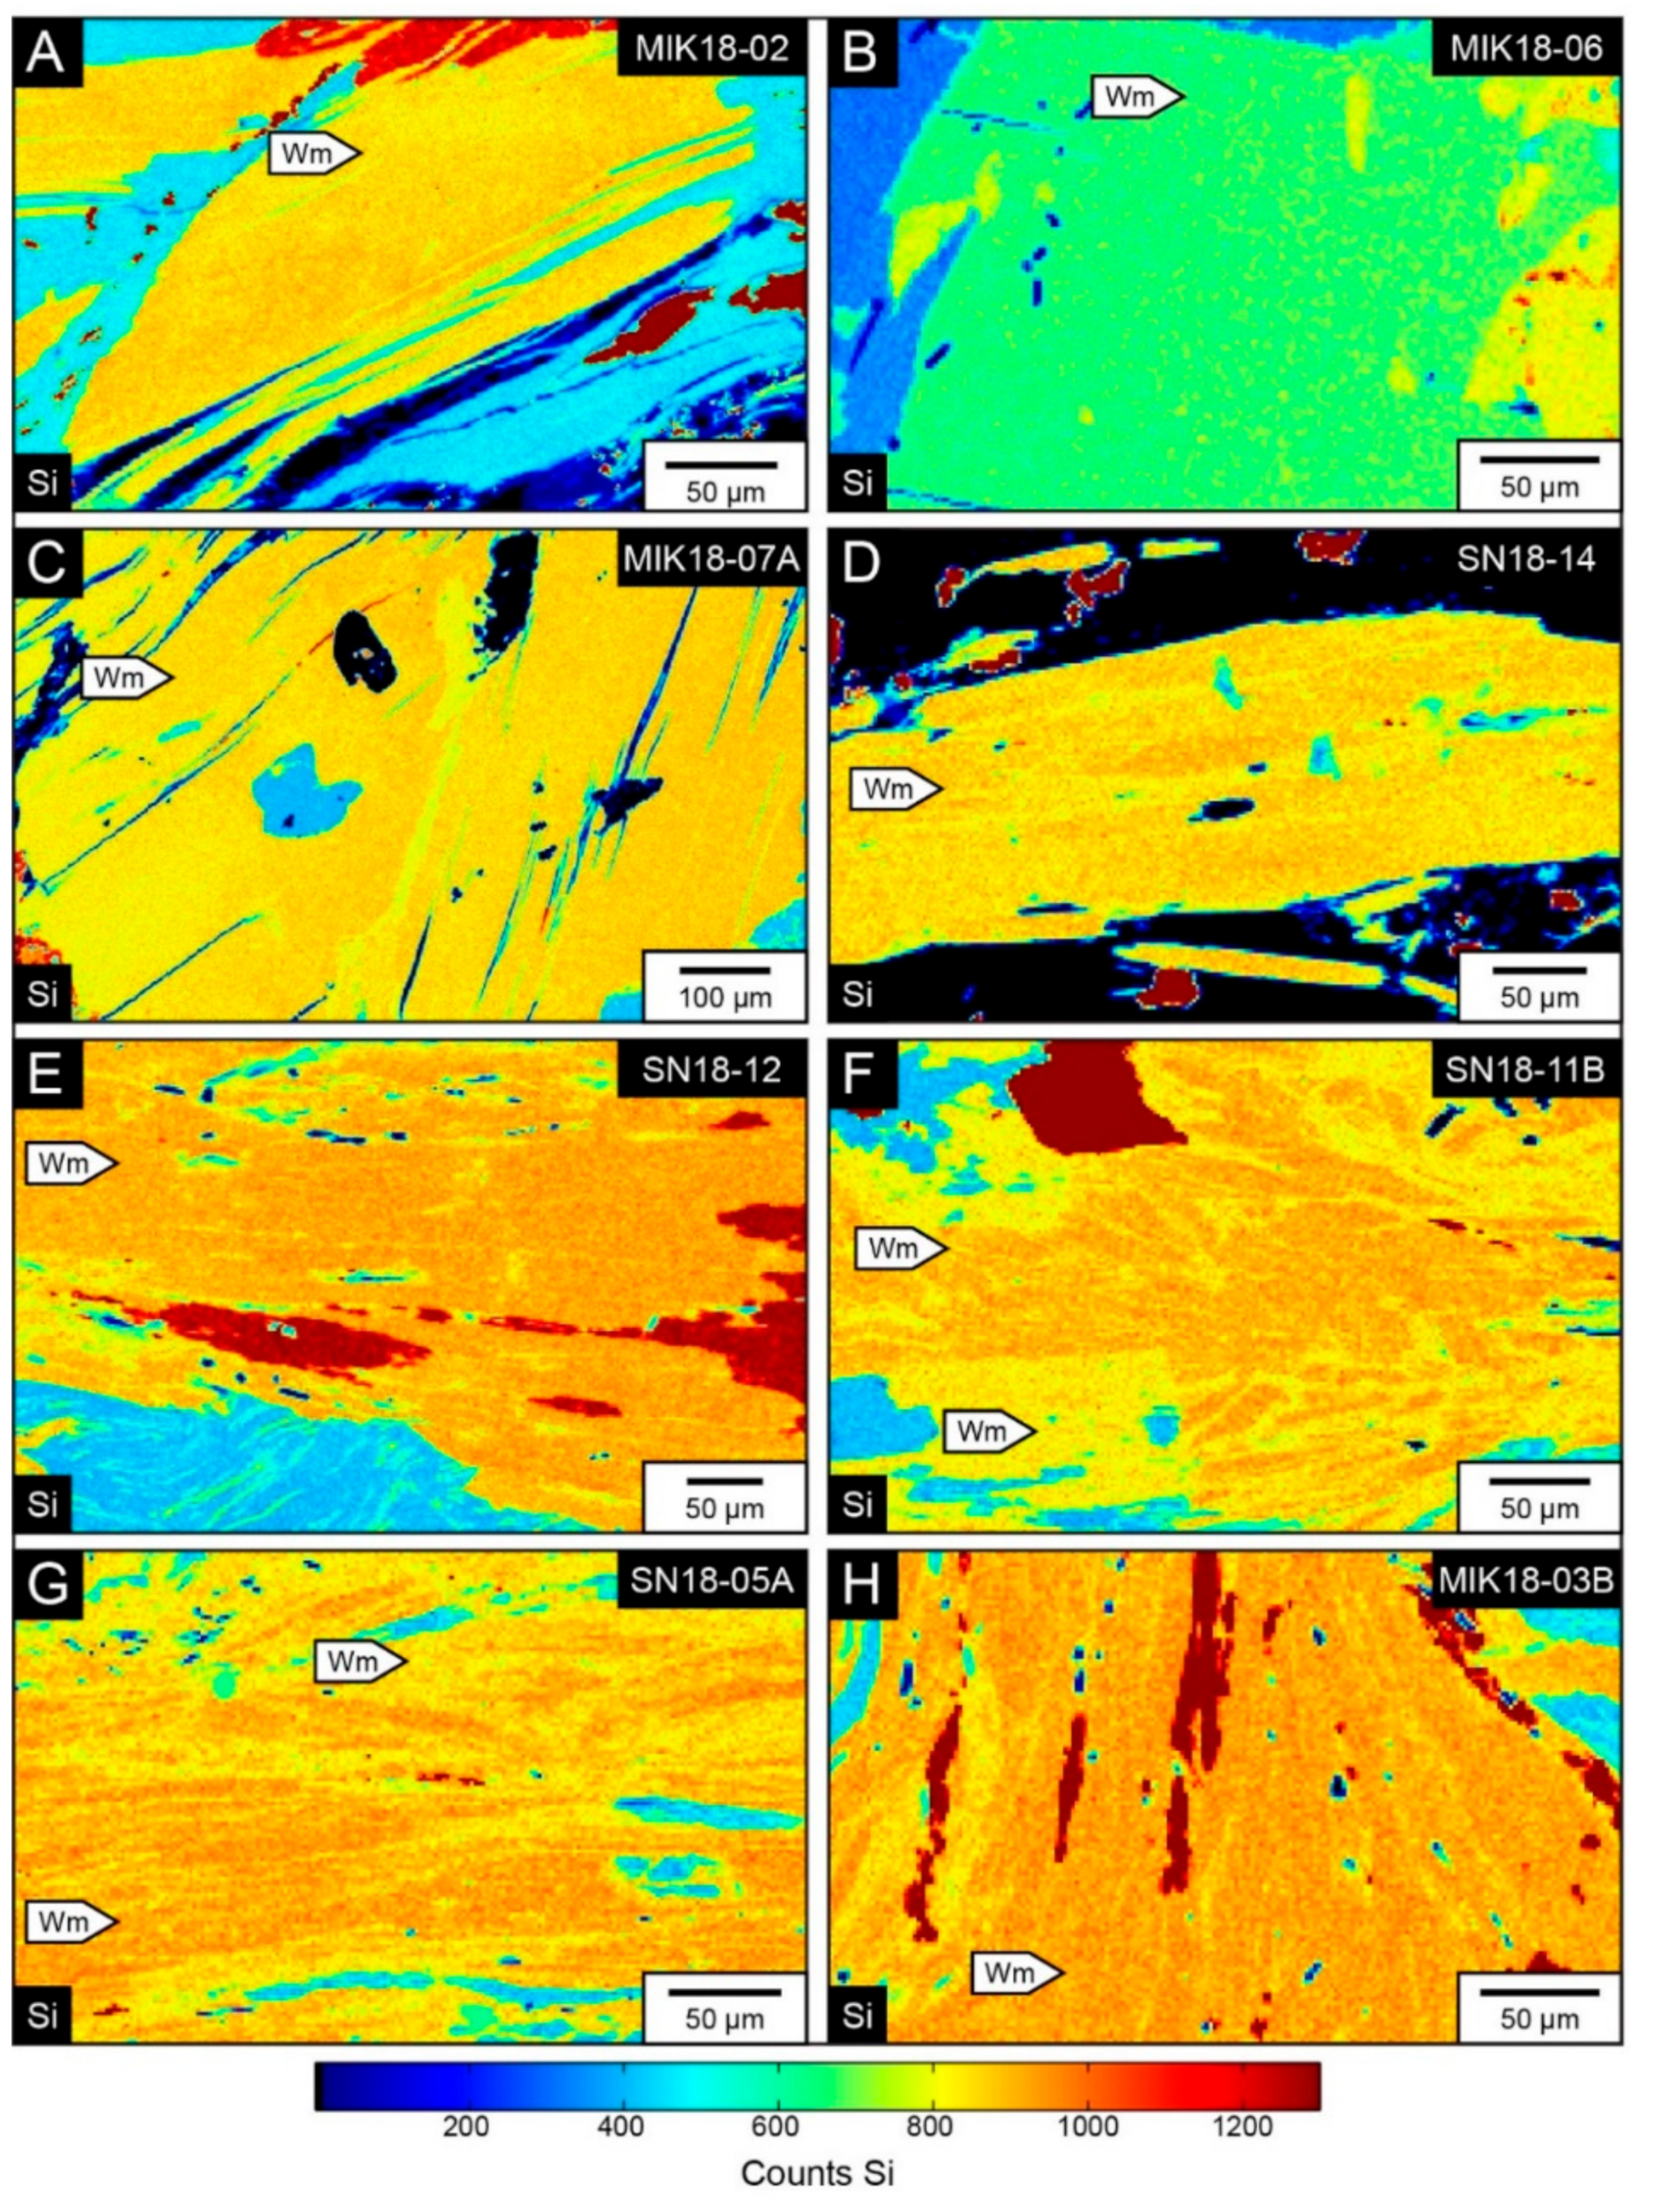
The WDS major element maps revealed that the white mica grains of the Upper Unit had a fairly homogenous mineral chemistry and the major element components were relatively similar amongst all samples with the exception of sample MIK18-06, which showed lower Si content (Figure 3). In contrast, the white mica of the Lower Unit was observed to be chemically heterogeneous (Figure 3).
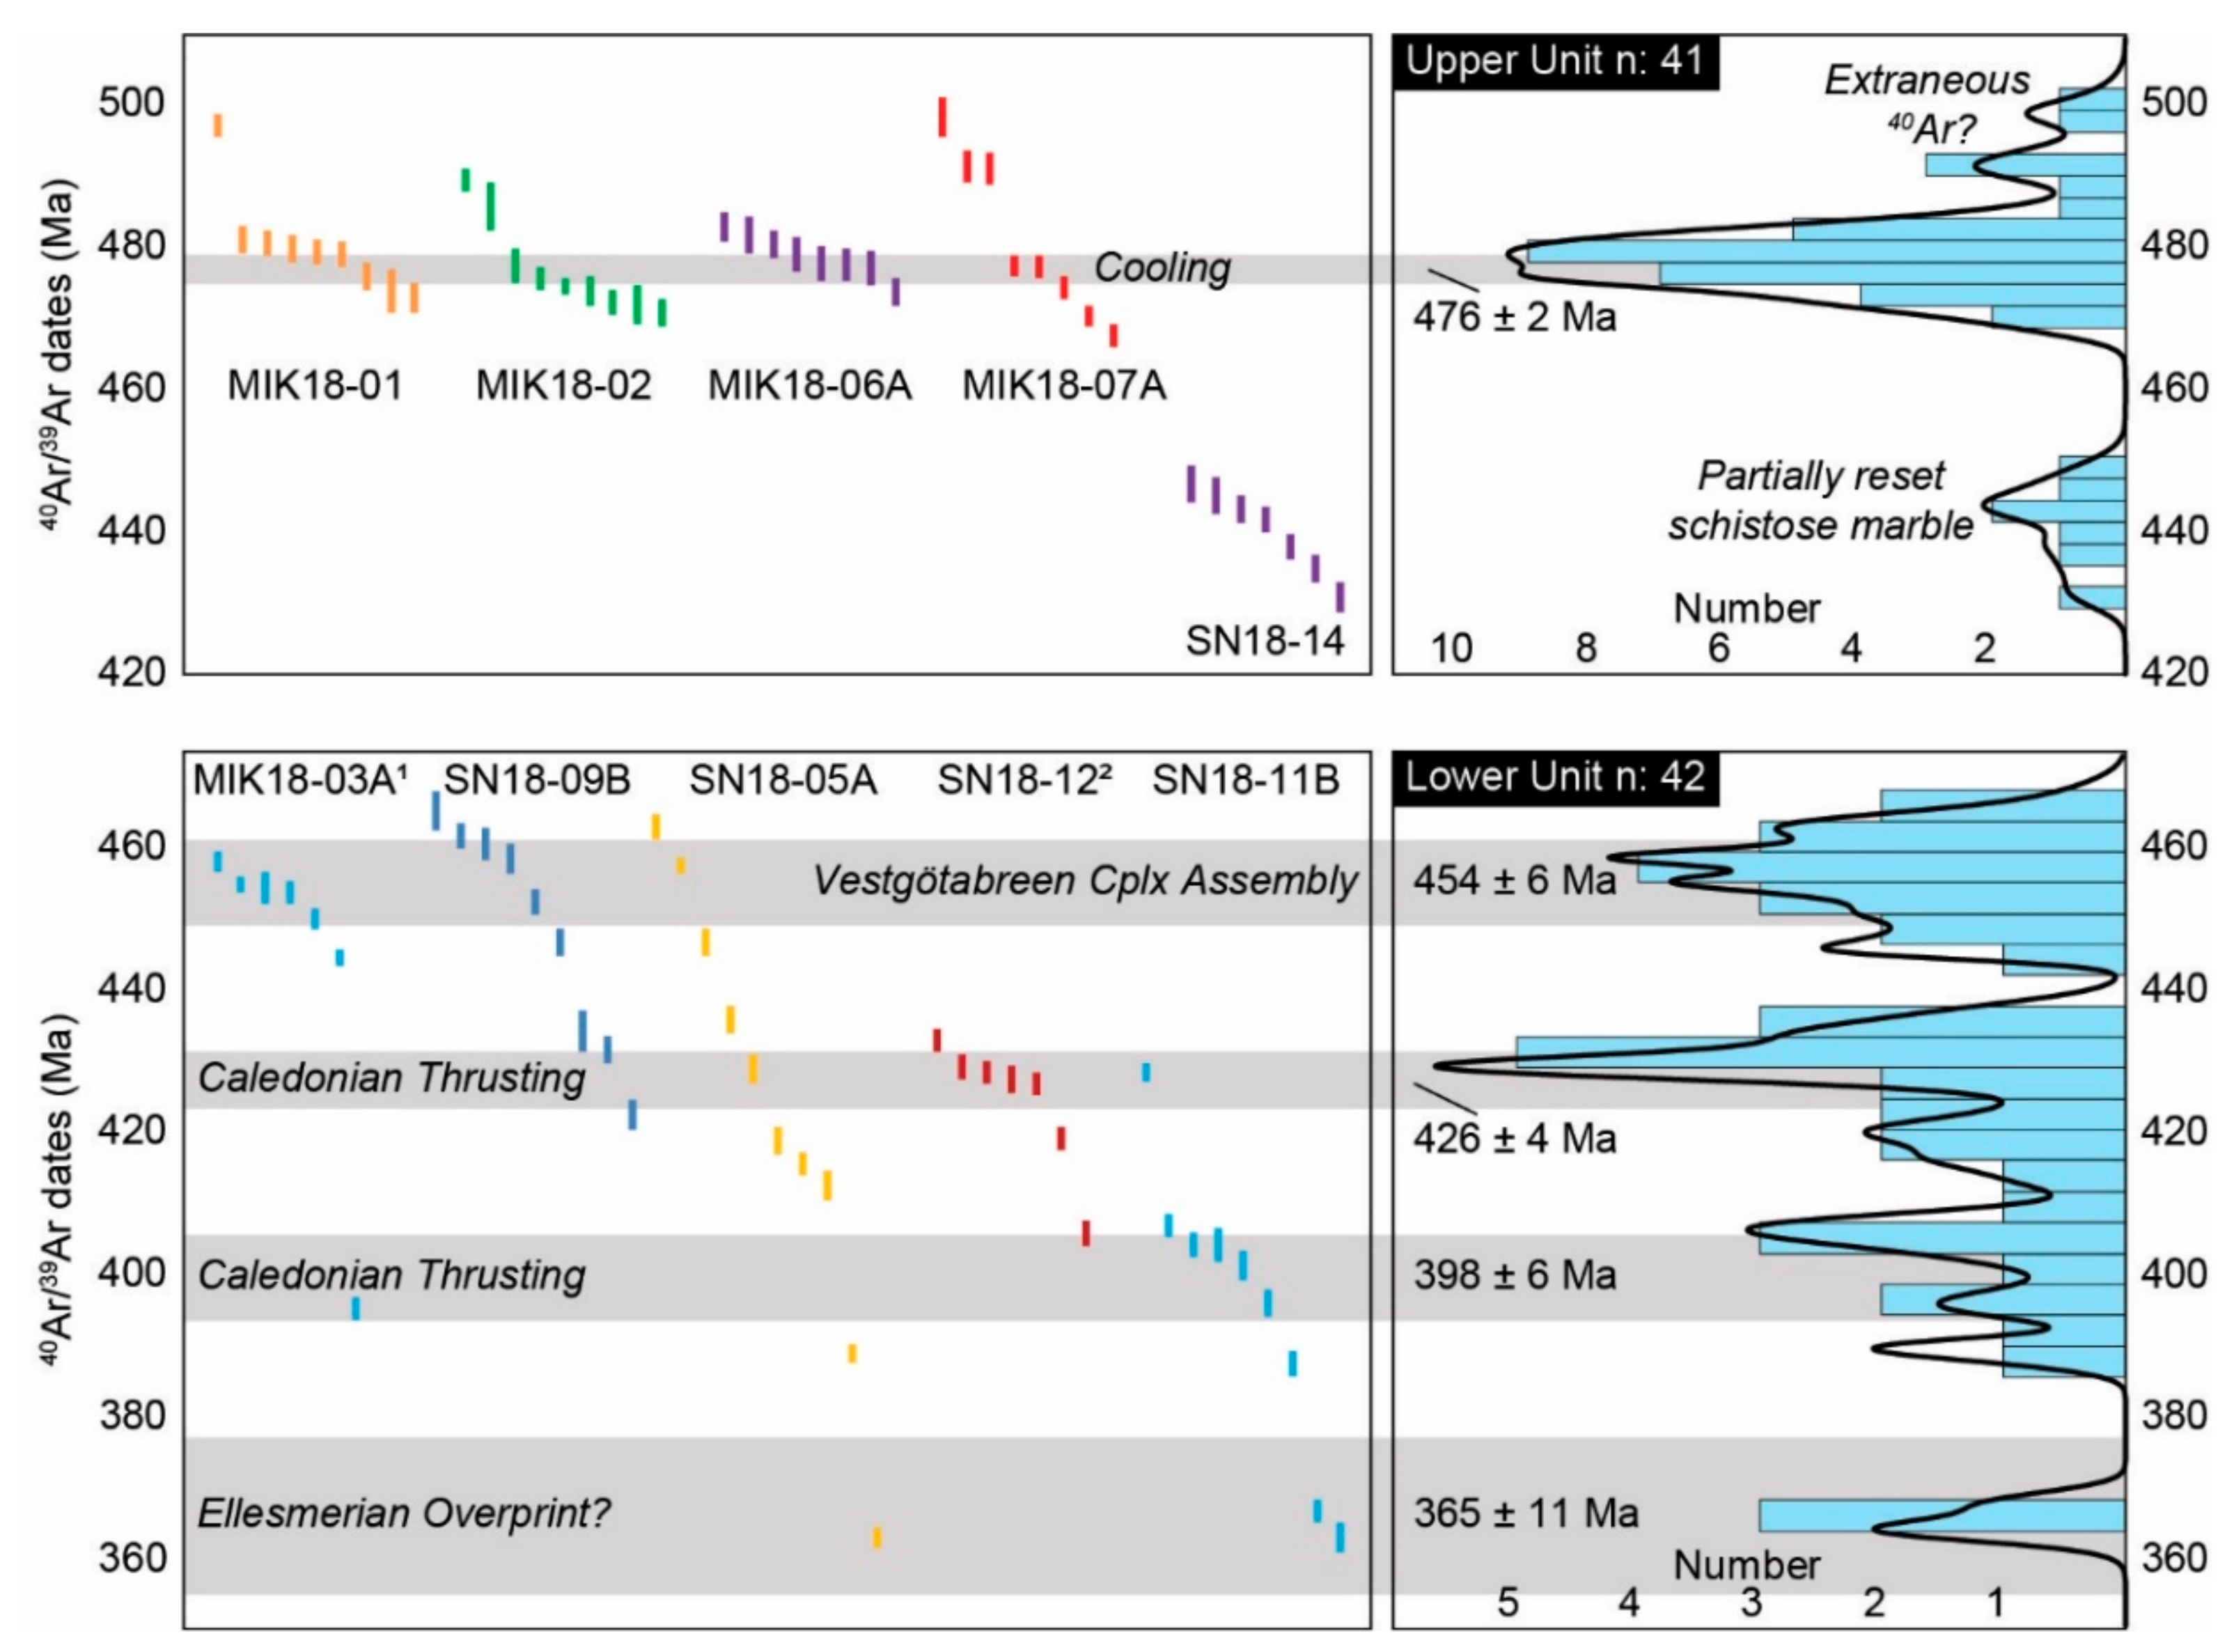
A total of 84 analyses were obtained from the ten samples (Table 1). All analyses had >92% 40Ar* and did not show elevated Ca/K nor Cl/K ratios (Table S1). Forty-one analyses were conducted on the chemically homogeneous white mica of the Upper Unit. The collective results ranged from 499 ± 3 Ma to 431 ± 2 Ma (Figure 4). The majority of the dates clustered between c. 483–468 Ma. There were no observed correlations between the dates yielded and respective mineral chemistry (e.g., Si). The four samples that recorded the cluster comprised blueschists and garnet-white mica schists, whereas the younger dates (i.e., below c. 468 Ma) were obtained from the schistose marble (SN18-14). To resolve the populations from the dispersion in data, we utilized the Gaussian deconvolution statistical method. For this method, numerous iterations were conducted to calculate populations. For every iteration, the number of components was increased by one, relative to the previous iteration. The final populations were obtained either when the relative misfit failed to decrease significantly or until two population components were nearly the same [47]. Uncertainties calculated for the populations by Gaussian deconvolution were derived by the internal uncertainties of the dataset and did not account for the scatter in the data. In order to avoid underestimating the uncertainties, and thus overinterpreting the dataset, we developed an uncertainty equation to increase each uncertainty. The equation was exponential and weighted according to the amount of data points represented by each population (i.e., the population fraction multiplied by total number of points for the Gaussian deconvolution). Therefore, the uncertainties reported here were influenced by the fraction of analyses for a given population and also accounted for the scatter in the data. A full description of the equation and comparison to the datasets can be found in Appendix A (Table A1). Consequently, the populations were as follows, with the fraction of each population reported in brackets: 493 ± 7 Ma (0.14), 476 ± 2 Ma (0.69), 440 ± 6 Ma (0.17). The single outlier analysis from sample MIK18-03A, yielding 395 ± 2 Ma, was not included in the calculations of the populations.
The chemically heterogeneous white mica from the five samples of the Lower Unit showed a much larger dispersion in 40Ar/39Ar dates from 466 ± 3 Ma to 363 ± 2 Ma (Figure 4) with one outlier of 487 ± 2 Ma (Table S1). Due to the very large scatter in the collective dataset, we also applied the Gaussian deconvolution method to the results of the Lower Unit, with uncertainties applied as described in Appendix A (Table A1). The populations (with population fraction) were: 454 ± 6 Ma (0.36), 426 ± 4 Ma (0.36), 398 ± 6 Ma (0.21), and 365 ± 11 Ma (0.07). The single date of 487 ± 2 Ma from sample SN18-12 was not included in the calculation of the populations.

5. Monazite Th-U-Total Pb Geochronology

5.1. Methods

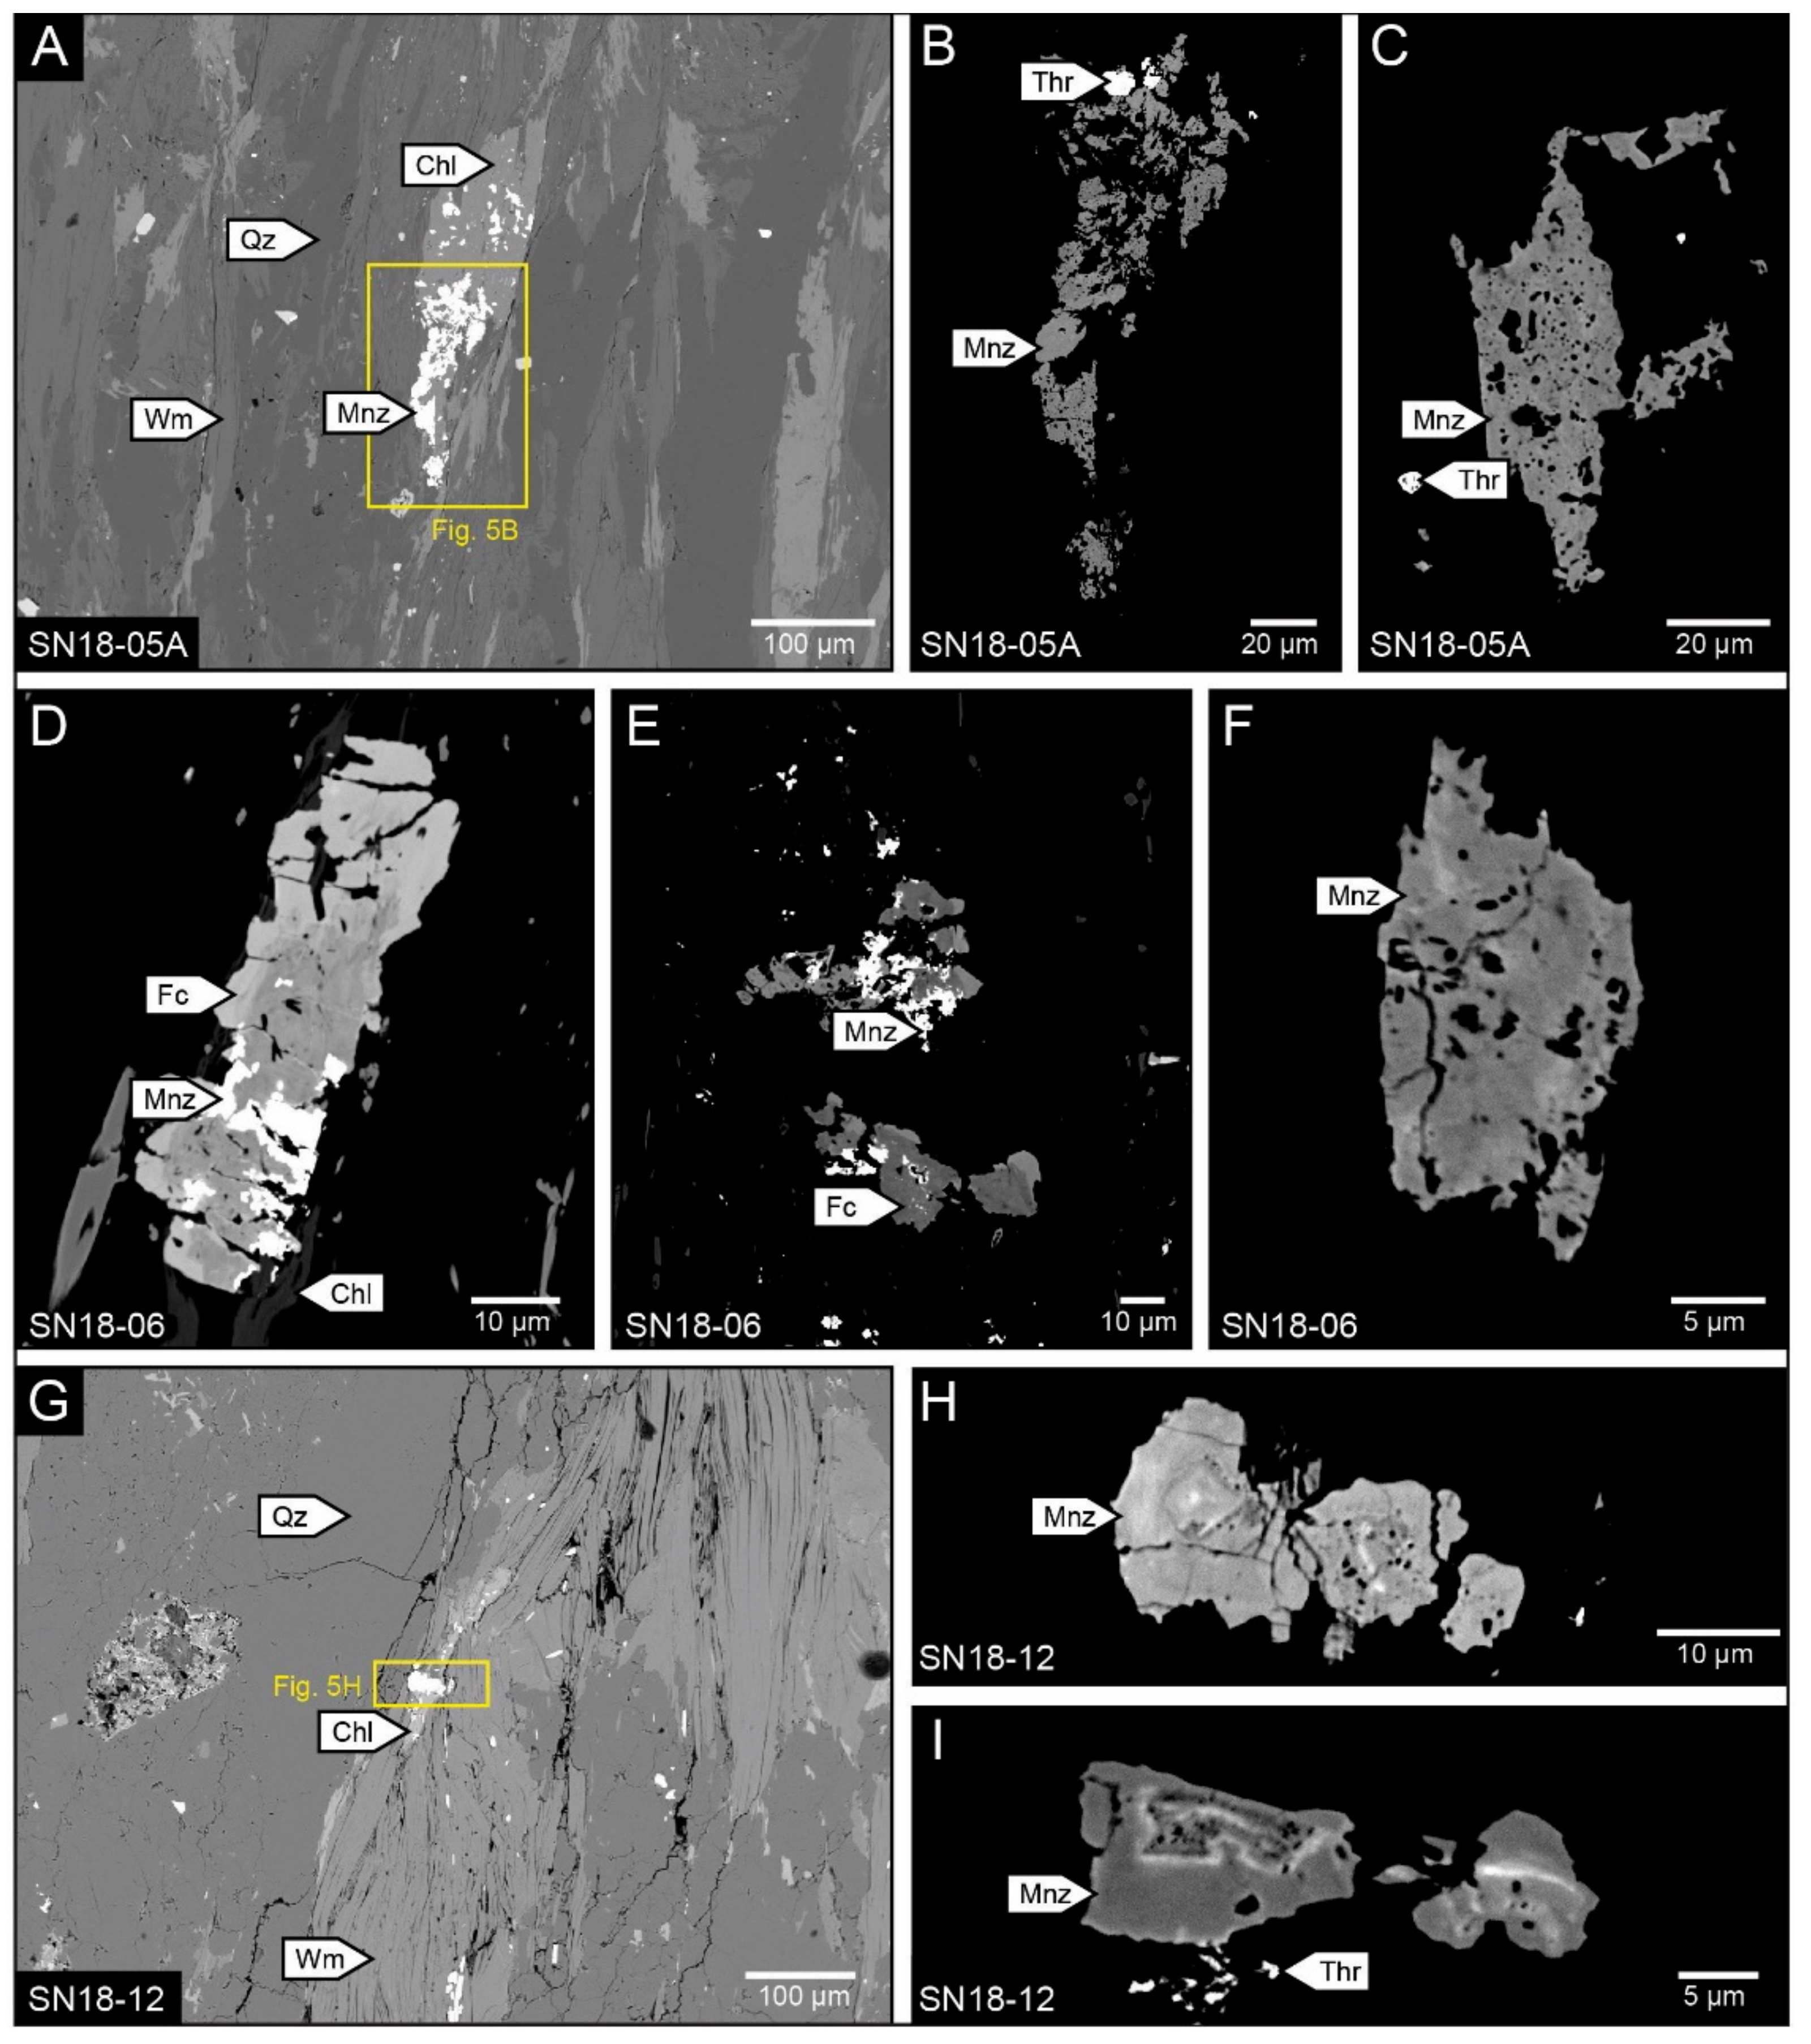
Three samples from the Lower Unit were chosen for monazite Th-U-total Pb geochronology (SN18-05A, -06, -12). These samples were all phyllitic with a dominant mineral assemblage of white mica and chlorite (Figure 2E,F). Monazite grains were identified using BSE imaging with the JEOL JXA8530F electron microprobe at Uppsala University (Uppsala, Sweden). Monazite in all three samples was almost always enclosed in or spatially associated with chlorite grains and bundles (Figure 5). In SN18-05A and SN18-12, an REE-bearing precursor to the monazite was not recognized, however, in SN18-06 the monazite is often nucleated on coarse florencite grains. Monazite in all three samples showed irregular shapes, often with numerous small grains in proximity, resembling archipelagos (Figure 5A). The internal domains of the monazite exhibited a porous-texture in all samples (Figure 5). In SN18-12, textural zoning was observed with non-porous overgrowths around porous cores in some of the monazite grains. Minor volumes of thorite were also identified in close spatial association with monazite (Figure 5).
Standard 30 μm thin sections were prepared and carbon-coated for geochronological analysis using a JEOL JXA-8230 electron microprobe at the Institut des Sciences de la Terre (ISTerre) in Grenoble, France. The analyses followed a protocol similar to that described in Grand’Homme et al. [48]. The probe current was set to 15 KeV and 200 nA and a thick carbon coating of 55–60 nm was used. Counting times for U, Th and Pb of 160, 300 and 480 s were used for monazite. Standard of Madagascar [48] was run as an unknown (three points) regularly during the analyses. The uncertainties (2σ) of the microprobe measurements of monazite were 60–170 ppm, 140–230 ppm, 60–170 ppm for U, Th and Pb, respectively. The uncertainties for every date were propagated from these values by a Monte-Carlo simulation using NiLeDAM software (Version 0.1) [49,50]. If the analytical uncertainty provided for each individual date was <2%, then an uncertainty of 2% was applied [51].

5.2. Results

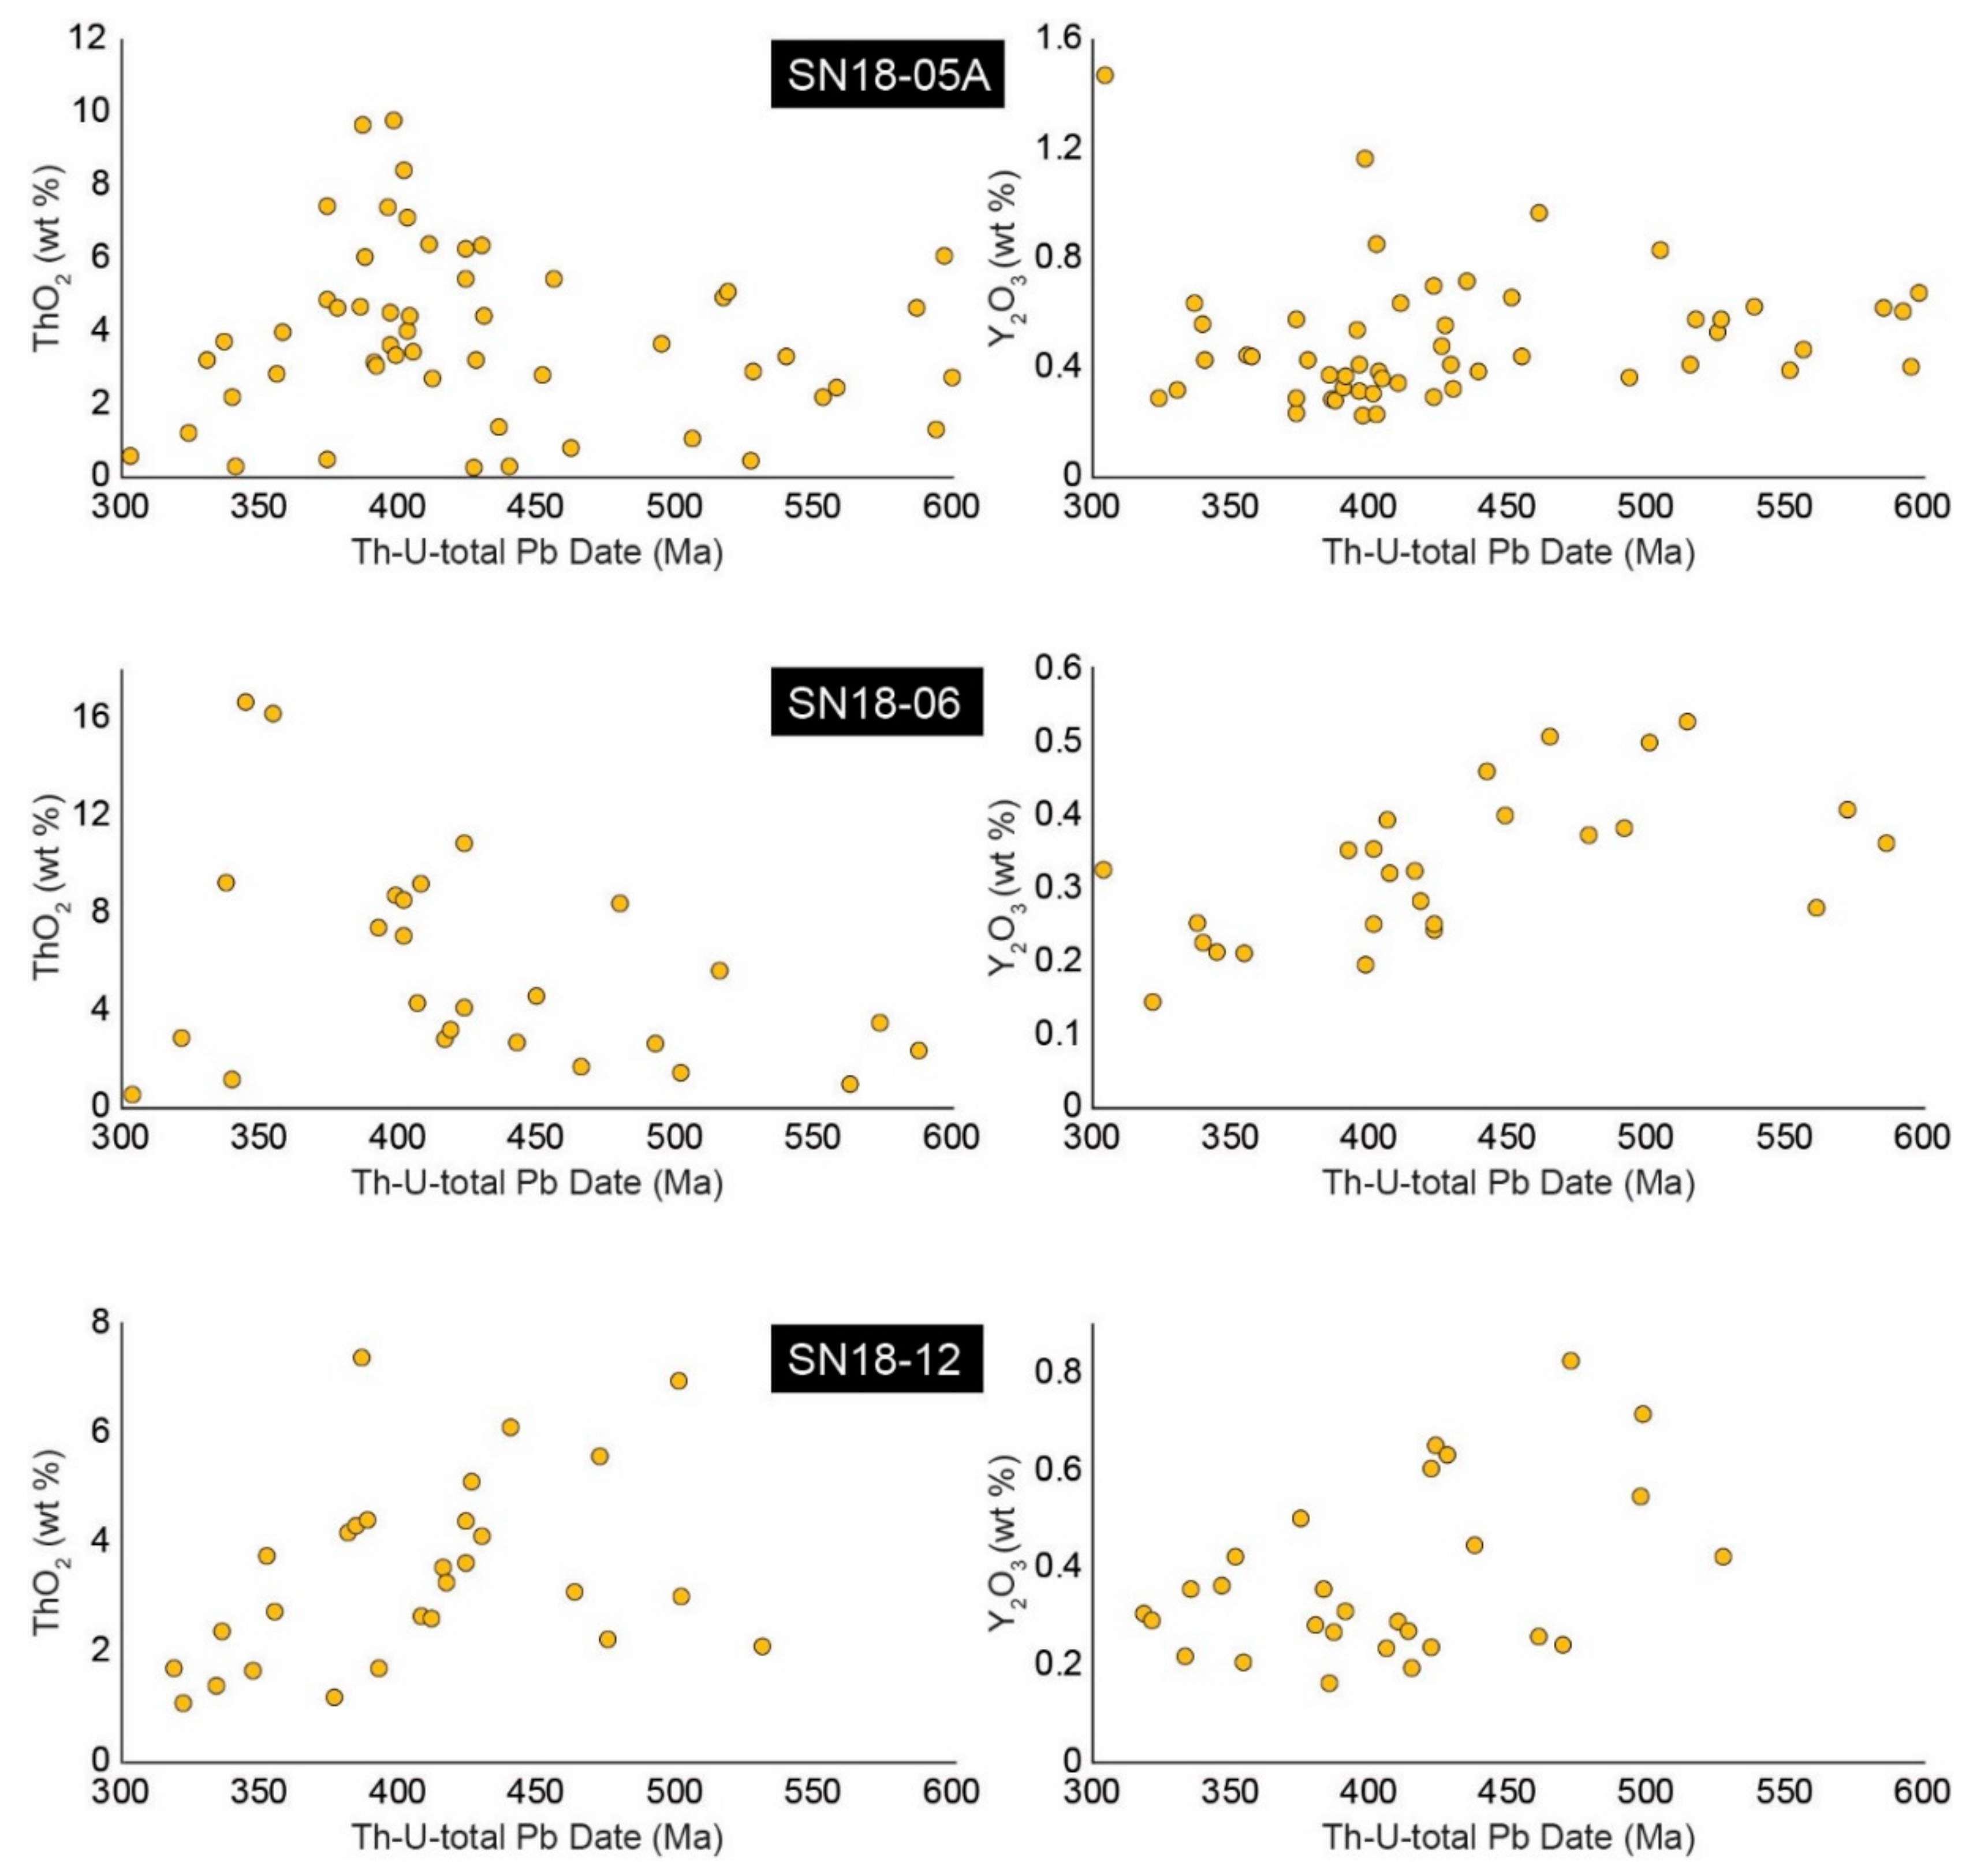
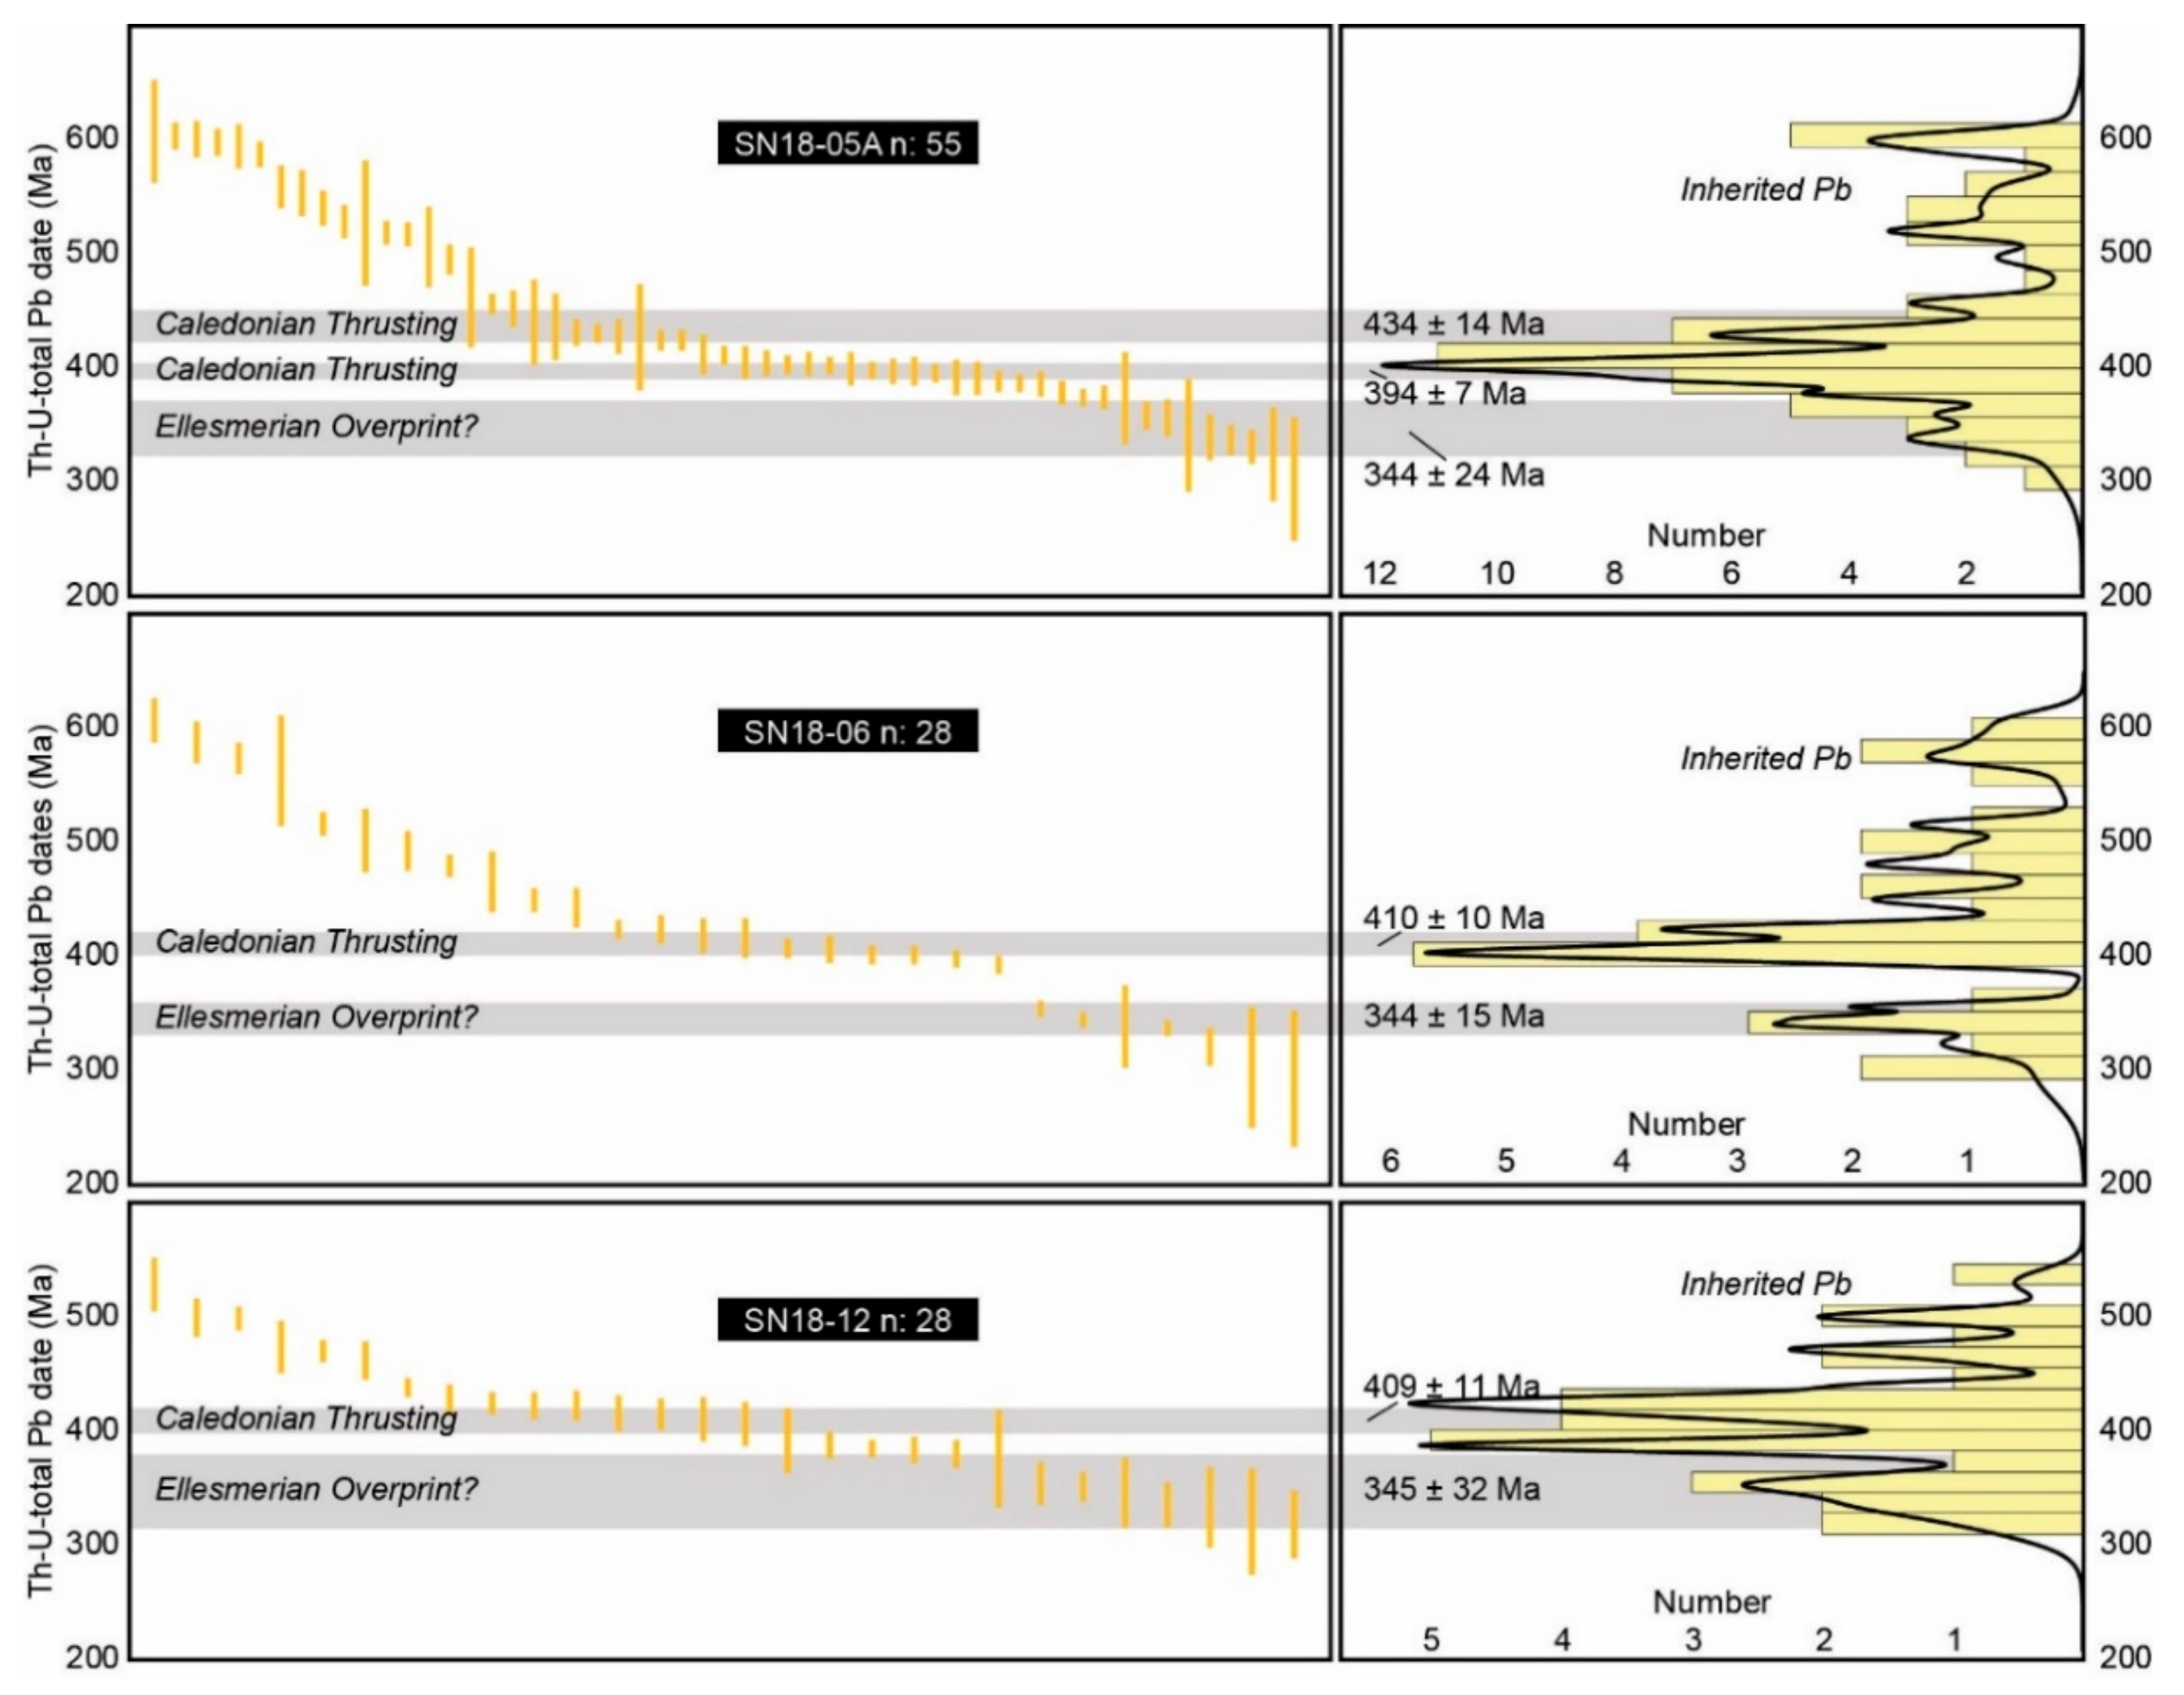
A collective total of 111 analyses conducted on monazite from three Lower Unit samples are presented (Table 1). These analyses have a total oxide wt % of 98–102, P2O5 wt % < 27, and SiO2 wt % < 1.8 (Figure 6, Table S2). The results for all three samples showed a very large dispersion in dates from c. 607 to c. 294 Ma (Figure 7). No chemical trends between dates and mineral chemistry were observed for SN18-05A (Figure 6). For samples SN18-06 and SN18-12, a mild correlation between decreasing Y2O3 and decreasing dates were observed (Figure 6). The latter sample also showed the same trend with ThO2, whereas the former did not show a clear trend with ThO2 vs. dates. The textural zoning of sample SN18-12 did not yield discernable date populations. Overall, the monazite chemistry vs. date plots did not show distinct chemical nor date groups for any of the samples (Figure 6). As a result, monazite chemistry was not regarded as a reliable parameter for defining the date populations within this dataset. Instead, date populations were investigated through statistical means. Weighted averages of each of the three datasets resulted in high mean square weighted deviation (i.e., SN18-05A, MSWD: 148; SN18-06, MSWD: 220; SN18-12, MSWD: 52), which suggested that more than one population was present in each sample. As a result, the Gaussian deconvolution method (as described above) was utilized to derive statistical populations from the samples (Figure 7). For sample SN18-05A, the calculated populations (with population fraction) were: 344 ± 24 Ma (0.14), 394 ± 7 Ma (0.39), 434 ± 14 Ma (0.19), 523 ± 22 Ma (0.16), and 595 ± 30 Ma (0.11). Sample SN18-06 produced populations of: 344 ± 15 Ma (0.25), 410 ± 10 Ma (0.43), 495 ± 27 Ma (0.18), and 585 ± 44 Ma (0.14); Finally, sample SN18-12 yielded: 345 ± 32 Ma (0.26), 409 ± 11 Ma (0.52), and 485 ± 23 Ma (0.21). Calculation of the uncertainties for the calculated populations can be found in Appendix A (Table A1).

6. Discussion

6.1. Extraneous 40Ar and Cooling Recorded in the Upper Unit White Mica

The oldest 40Ar/39Ar populations from the Upper Unit (493 ± 7 Ma, 476 ± 2 Ma) both overlapped with the imprecise age for eclogite-facies metamorphism of 476 ± 30 Ma (Figure 4) [35]. Petrographic and geochemical investigations of the white mica showed that there were no correlations between 40Ar/39Ar dates and white mica chemistry, grain size nor strain intensities (Figure 2 and Figure 3). It was also clear from petrographical analyses that white mica represented part of the HP paragenesis.
The conditions for HP metamorphism (18–24 kbar, 575–645 °C), and the subsequent retrogressive pathway [33], are predicted to have proceeded within P-T conditions conducive for thermally-activated 40Ar diffusion [52]. However, depending on the residence time at peak conditions, grain size, cooling rates etc., partial retention of 40Ar is still possible within these P-T conditions [53]. Redistribution of 40Ar in a closed system may also be a factor for the oldest 40Ar/39Ar dates, either during or after white mica crystallization [54,55,56,57]. In contrast, the well-defined nature of the c. 476 Ma age population does not suggest disturbance due to extraneous 40Ar [56]. This is supported by the similarities of the 40Ar/39Ar of the less-porous mafic rocks (e.g., MIK18-02, -06A, -07) compared to the more felsic lithology (MIK18-01) [55].
The c. 476 Ma population either records HP crystallization of the white mica with localized inheritance of 40Ar, or cooling of the rocks with localized domains of higher 40Ar retentivity within the white micas. This population isn’t likely to record deformation because the mica grains exhibit a low-strain, indicated by their large grain size, tabular shape and homogeneous distribution of the major elements (Figure 3). Based on the P-T conditions of the Upper Unit, the complete retention of the HP crystallization signature was not predicted [53]. Therefore, crystallization of the white mica should not be reflected in such a well-defined 40Ar/39Ar population at c. 476 Ma. This record is likely more favored to reflect cooling of the Upper Unit lithologies after crystallization in HP conditions (Figure 8). This interpretation supports a previous interpretation of similar white mica 40Ar/39Ar dates from the Vestgӧtabreen Complex [36].

6.2. Extraneous Pb in Monazite

The monazite from all three samples targeted for Th-U-total Pb geochronology yielded date populations that also overlapped with the HP metamorphism of the Vestgӧtabreen Complex, or were significantly older (Figure 7). The oldest dates partially overlapped with the timing of c. 640 Ma Torellian metamorphism in the more southern regions of the SCBP [58]. The monazite dates may therefore record a partially reset signature of Torellian tectonism, followed by early Caledonian HP metamorphism. The textural characteristics of monazite and the common spatial association of the monazite cluster with chlorite and minor thorite indicate that monazite formed in response to a low-temperature (greenschist-facies) fluid-driven metamorphism [48,59,60]. In samples SN18-05A and SN18-12, the lack of distinct REE precursor for monazite allows the possibility of dissolution-reprecipitation driven by these greenschist-facies fluids. However, this process has been documented to result in disequilibrium Pb distribution, producing anomalously old ages within reprecipitated monazite domains [61,62], or inheriting relic domains of the starting monazite material within reprecipitated monazite [61]. The lack of distinct chemical populations amongst the analyzed monazite certainly suggests chemical disequilibrium and perhaps mixed monazite chemistry (Figure 6). Furthermore, the precursor for monazite in sample SN18-06 is florencite, which may have been stable through peak metamorphism [63,64]. This would suggest that monazite should not record dates prior to the retrograde pathway. As a result, we do not interpret the oldest monazite dates to be geologically meaningful ages. For these populations to be considered meaningful, they must reproduce by more robust geochronological methods.

6.3. Juxtaposition of the Upper and Lower Units Recorded by White Mica

The oldest 40Ar/39Ar age population obtained from the Lower Units rocks of 454 ± 6 Ma were defined by analyses from the interiors of the brecciated Lower Unit phyllites (MIK18-03A), the retrogressed blueschist (SN18-09B) and a phyllite (SN18-05A). The P–T conditions 15–16 kbar and 380–400 °C that were determined for the Lower Unit [34] suggested that these rocks should not have reached (or barely reached) conditions that permitted thermal diffusion of 40Ar from white mica [52,53]. The white mica of the Lower Unit should thus provide some record of their prograde-to-peak metamorphic history. Instead, this population may rather reflect diffusion of 40Ar due to recrystallization during deformation of the white mica in the Lower Unit [37,65,66,67,68,69,70]. Indeed, the top-to-S shearing that is associated with assembly of the Vestgӧtabreen Complex is more penetrative in the Lower Unit than the Upper Unit [16]. The pervasive deformation of the Lower Unit provides a means to eradicate the older history that would have been preserved in the white mica, and caused the smaller grain size and more heterogeneous mineral chemistry (Figure 2 and Figure 3). We therefore interpret the 454 ± 6 Ma to represent the timing for juxtaposition of the units (Figure 8). This timing for juxtaposition of the units is in agreement with late Ordovician to early Silurian deposition of the Bullbreen Group sediments [30,32], as the units must have been assembled prior to surface exposure and deposition [16].

6.4. Silurian to Devonian Caledonian Thrusting Recorded by White Mica and Monazite

The deposition of the Bullbreen Group in the late Ordovician to early Silurian provides a key datum for interpretation of the younger geochronological data as post-depositional deformation is considered to be late Caledonian [16]. In the silicic rocks of the Lower Unit, a c. 430–426 Ma signature is defined by 40Ar/39Ar dates and supported by the Th-U-total Pb geochronology. In particular, one sample just below the bounding thrust (SN18-12; Figure 8) showed a well-defined 40Ar/39Ar age cluster at c. 430 Ma (Figure 4). This likely reflects the onset of late Caledonian thrusting, responsible for the top-to-N displacement along the bounding fault and emplacement of the Upper Unit over the Lower Unit (Figure 8) [16]. The sample of the schistose marble from the Upper Unit (SN18-14) in proximity to this thrust (Figure 8) yields an 40Ar/39Ar age population of 440 ± 6 Ma. This population overlaps with the depositional age of the Bullbreen Group and therefore conflicts with the interpretation that the Vestgӧtabreen Complex was at near surface conditions at this time. However, previous studies of carbonate- and silicate-rich lithologies have demonstrated that the weaker rheology of a calcite matrix shields the white mica from deformation and fully resetting, compared to the stronger silicate matrix [66]. Therefore, the c. 440 Ma age likely reflects partial resetting of the 40Ar/39Ar record during the c. 430–426 Ma thrust initiation.
Younger age populations of c. 410-395 Ma were quite prominent for both 40Ar/39Ar and Th-U-total Pb results (Figure 4 and Figure 7, Tables S1 and S2). In the former, the age was mainly defined by one sample (SN18-11B), whereas all three samples of monazite provided a strong record of these dates. Provided the scatter in both 40Ar/39Ar and Th-U-total Pb dates, and corresponding uncertainties of the populations (up to ±10 Ma) it is difficult to discern if this second grouping of populations represents a later, distinct event or if late Caledonian thrusting occurred continuously from c. 430 to c. 395 Ma. Nonetheless, the record of late Caledonian thrusting of the Vestgӧtabreen Complex was well recorded in the rocks of the Lower Unit (Figure 8).
These white mica and monazite geochronological results corroborate previous geochronological studies that have interpreted a c. 425–400 Ma Caledonian tectonothermal event that affected the Upper Unit [24,36] and Oscar II Land in general [14]. The strong c. 410–395 Ma record within the monazite suggests that the lower temperature greenschist-facies metamorphic overprint responsible for (partial) resetting of monazite occurred at this stage. Color alteration indexes of conondonts obtained from the Bullbreen Group indicate the overlying Bullbreen Group was subject to temperatures of ~300 °C, presumably during folding and thrusting of the sediments [30].

6.5. Possible Ellesmerian Tectonothermal Overprint

Both in situ white mica 40Ar/39Ar geochronology and monazite Th-U-total Pb geochronology yield dates from the Lower Unit that overlap within uncertainty with the timing of Ellesmerian metamorphism and deformation on Svalbard [9,10,11,12,13,14]. While these dates obtained from Motalafjella are not as statistically robust as the previously discussed populations, they do suggest the possibility of an Ellesmerian tectonothermal overprint of the Lower Unit.
Instances of Ellesmerian metamorphism and deformation have been recognized across Svalbard. These areas include the amphibolite-facies metamorphism and shearing on Prins Karls Forland [13,37], deformation of the Northwestern Caledonian Basement Province [4], and folding with thrusting of the Devonian Old Red Sandstone [10,12]. An Upper Devonian unconformity is also interpreted to be a record of the same event [11]. According to palinspatic reconstructions of the high-Arctic [16], Motalafjella would be placed between the Ellesmerian structures present on Northern Greenland with Prins Karls Forland, and the deformation affecting the Old Red Sandstone. Therefore, although the geochronological data of this study provides only a subtle indication of Ellesmerian tectonism at Motalafjella, the location of Motalafjella bracketed by instances of Ellesmerian metamorphism and deformation support the possibility of Ellesmerian tectonism having affected the Vestgӧtabreen Complex.

7. Tectonic Correlations within the Caledonian Orogeny

The evolution of tectonism that is recorded by our geochronological results provides key information for the correlation and reconstruction of Caledonian HP localities. Exhumation of the Vestgӧtabreen Complex Upper Unit follows a very similar pattern to the exhumation of HP localities in the Seve Nappe Complex (SNC) of the Scandinavian Caledonides, specifically the HP Tsäkkok Lens (Figure 9). The lens experienced eclogite-facies metamorphism at 482 ± 1 Ma [71] and was then quickly exhumed [72]. Another striking similarity with the Vestgӧtabreen Complex is that the Tsäkkok Lens records prograde metamorphism along a cold subduction regime through blueschist facies conditions [73]. Both the Tsäkkok Lens and Vestgӧtabreen Complex reached broadly similar P-T conditions of >15 kbar and 520–700 °C [73], and 18–24 kbar and 575–654 °C [33], respectively. The similarities of the HP lithologies, their cold prograde evolution, timing of peak metamorphism and the subsequent timing of exhumation for both the Vestgӧtabreen Complex in Svalbard and the Tsäkkok Lens in the SNC suggests that these localities represent vestiges of the same Caledonian subduction system.
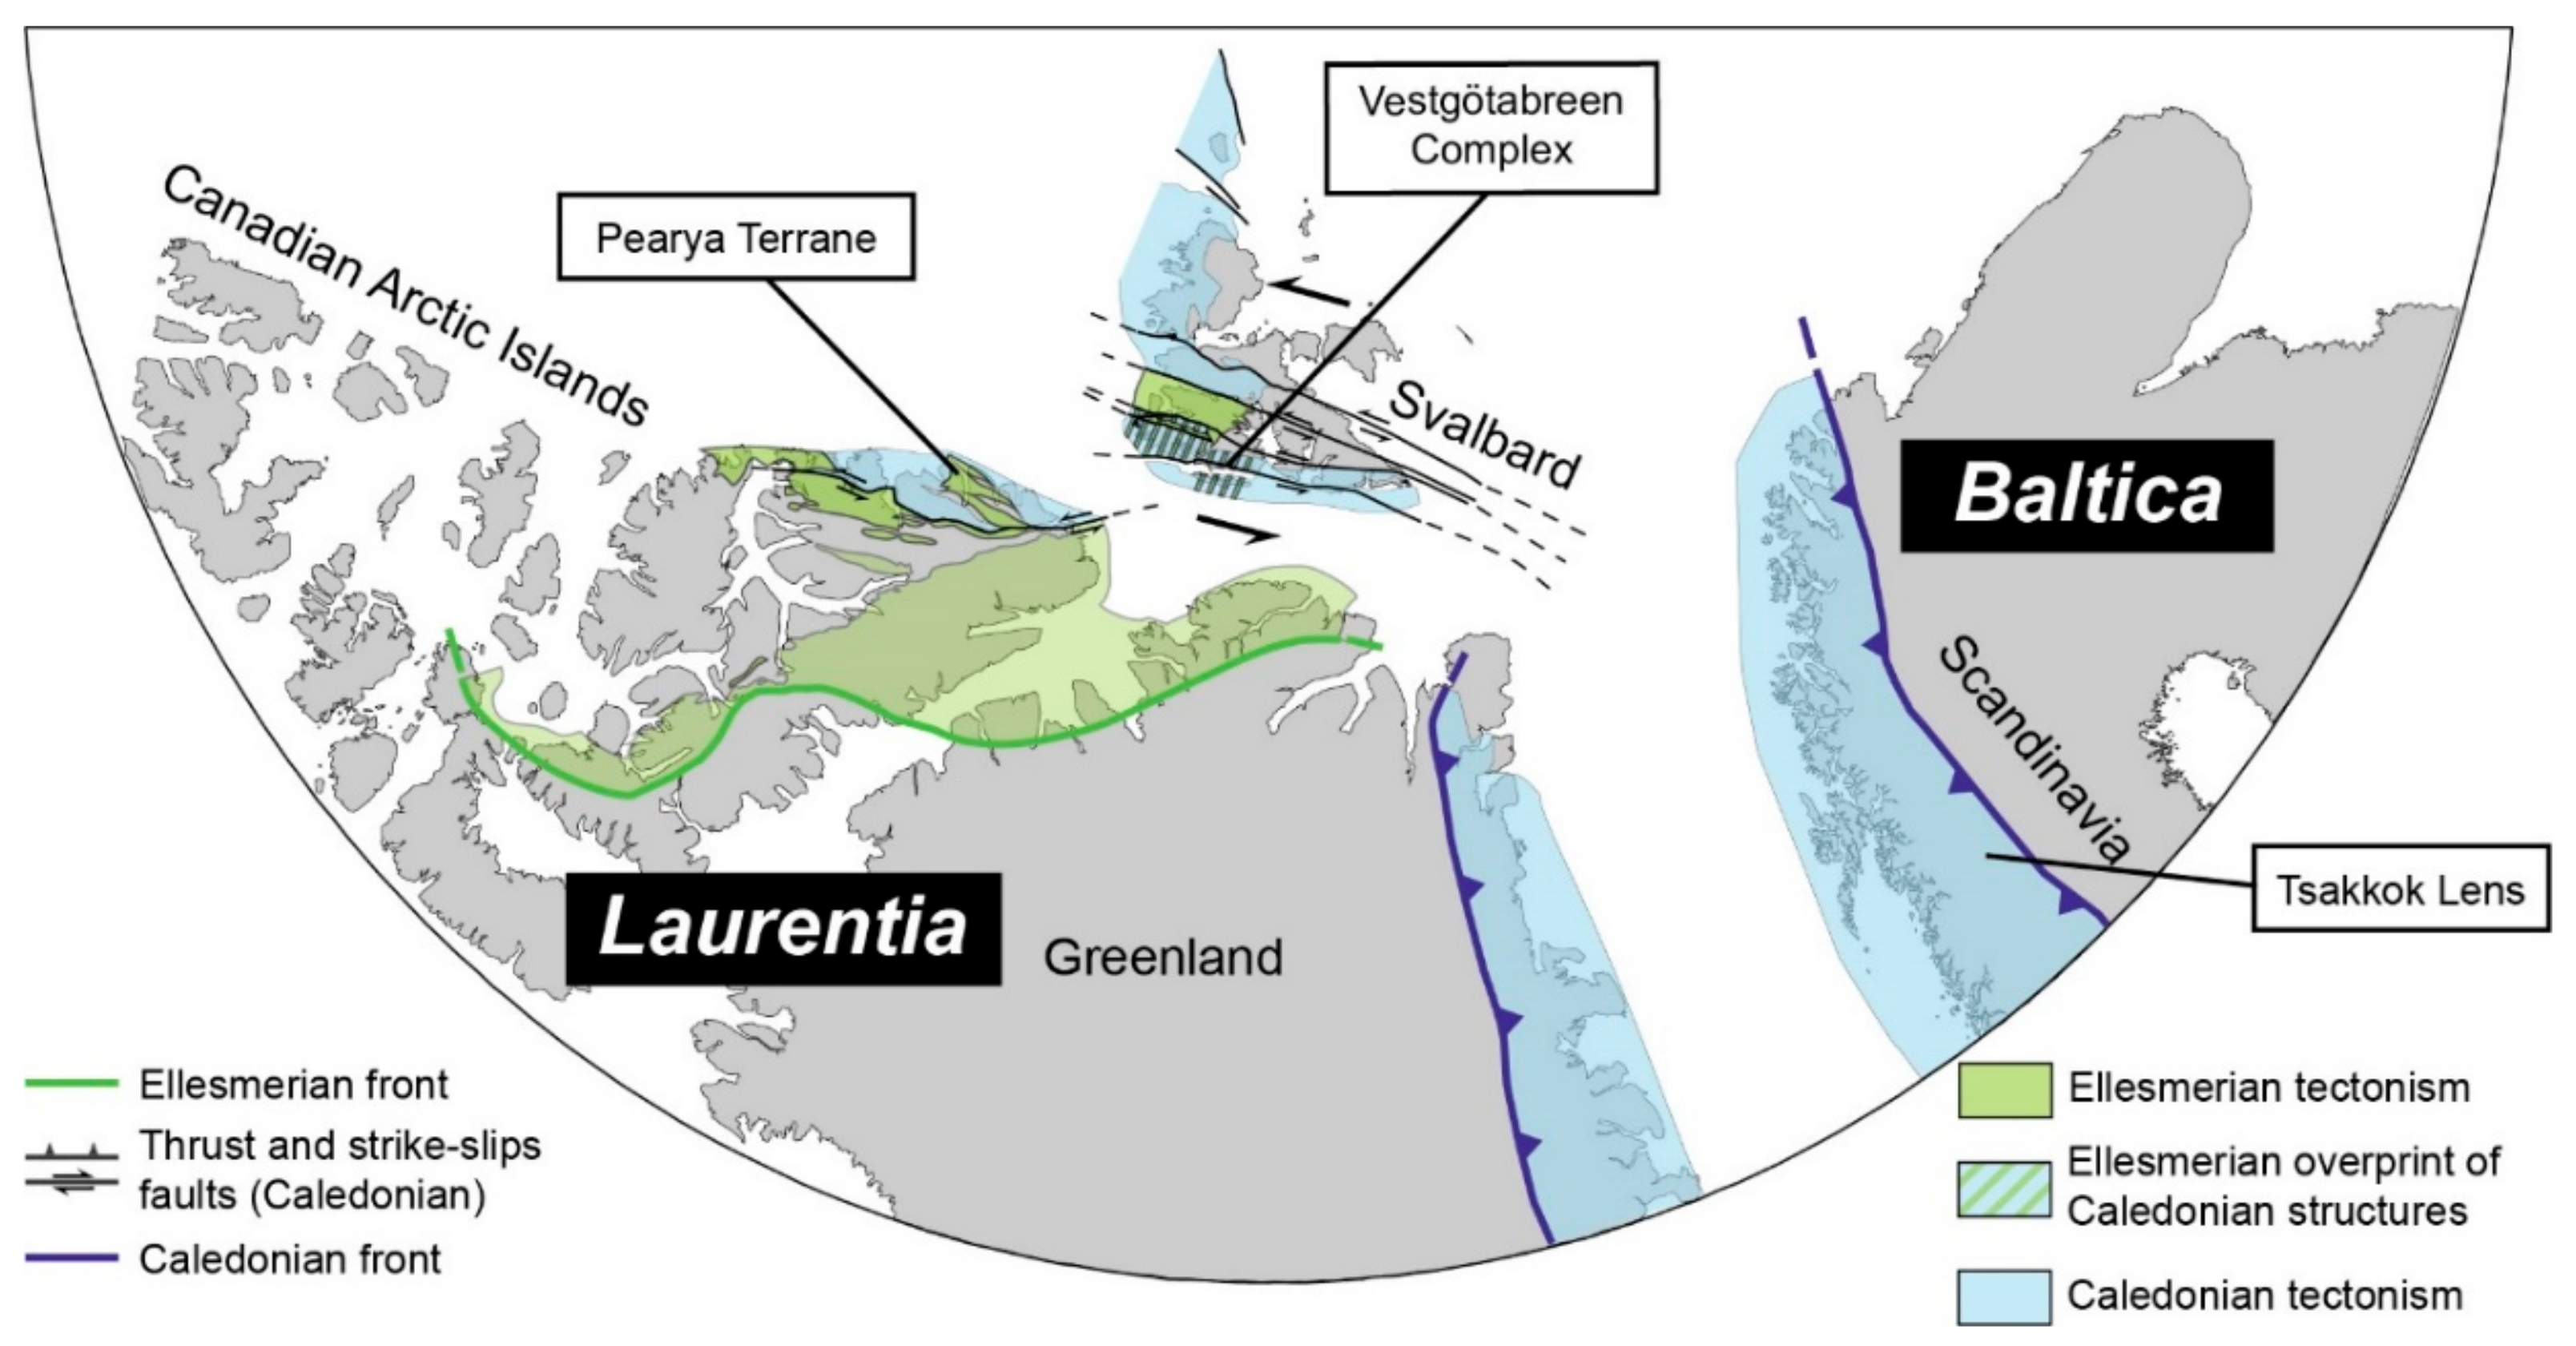
The N-vergent (present-day coordinates) thrusting of the Vestgӧtabreen Complex in the Silurian to Early Devonian was likely a consequence of the more dominant sinistral strike-slip shear zones that assembled the Caledonian basement provinces of Svalbard at this time (Figure 9) [1,2,7,8,17,74]. The strike-slip systems may extend to the Pearya Terrane that has been correlated with the Vestgӧtabreen Complex through tectonostratigraphic, structural, geochronological methods [2,18,75,76,77,78,79]. Specifically, the ophiolitic and arc-related rocks preserved with the terrane are thought to represent the upper plate counterpart to the relic subduction zone preserved as the Vestgӧtabreen Complex [23]. In Silurian to Early Devonian time in the Scandinavian Caledonides, Scandian thrusting during continental collision is well-documented [5,6,80,81,82,83,84]. Therefore, two different styles of tectonic transport were active as strike-slip shear zones in Svalbard/Pearya and predominant thrusting in the Scandinavian Caledonides during the Silurian to Early Devonian. These mechanics strongly resemble the idea of escape tectonics, which has been previously discussed for the Vestgӧtabreen Complex and the Svalbard basement provinces [2,19,31,85]. Although this hypothesis has been previously discussed, the correlative unit(s) within the Scandinavian Caledonides have not. The identification of the Tsäkkok Lens being a correlative HP locality to the Vestgӧtabreen Complex a key link to the validation of this hypothesis. The escape of the Vestgӧtabreen Complex and Pearya would therefore have to have occurred prior to, or coeval with, the incipient phase of Scandian thrusting.
The record of Ellesmerian overprint affects a large portion of Svalbard from Prins Karls Forland [13,37], Oscar II Land [14], and into the Devonian Old Red Sandstone of north central Svalbard [9,10,11,12]. Therefore, identification of an Ellesmerian tectonic overprint in the Vestgӧtabreen Complex would support the interpretation that the basement terranes were already assembled in the Devonian, and that the SCBP of Svalbard was located in close spatial proximity to the Pearya Terrane (Figure 9).

8. Conclusions

The exotic Vestgӧtabreen Complex of the Southwestern Caledonian Basement Province of Svalbard has experienced an intricate tectonic history from the earliest Ordovician to possibly the earliest Carboniferous. The exposure of the complex at Motalafjella comprises two HP units, the Upper and Lower units. Results of in situ white mica 40Ar/39Ar geochronology of HP lithologies in the Upper Unit revealed that cooling during exhumation occurred at 476 ± 2 Ma. This was followed by juxtaposition of the Lower Unit over the Upper Unit at 454 ± 6 Ma. The timing of assembly was recorded by 40Ar/39Ar geochronology of the Lower Unit and was not recognized in the Upper Unit. This corresponds to the higher degree of top-to-S shearing in the Lower Unit during the assembly. After the assembly of the units, they were exposed to surface conditions and erosion, followed by deposition of the Bullbreen Group. A subsequent and prominent phase of tectonism and associated greenschist-facies metamorphism from c. 430–400 Ma was recorded throughout the Lower Unit by both white mica 40Ar/39Ar and monazite Th-U-total Pb geochronology. The period of tectonism resulted in the top-to-N emplacement of the Upper Unit onto the Lower Unit, likely reactivating the shear zone previously responsible for the unit assembly at c. 454 Ma. The Bullbreen Group was also thrusted and folded during this episode. A subsequent c. 365–344 Ma resetting event of both was recognized. This event may relate to a tectonothermal overprint related to the Ellesmerian Orogeny.
Altogether, the geochronological data for the Vestgӧtabreen Complex, with previously reported petrological and structural data, suggests that this complex has a shared late Cambrian to Early Ordovician tectonic evolution as HP localities in the Seve Nappe Complex of the Northern Scandinavian Caledonides (i.e., the Tsäkkok Lens). The late Ordovician to Silurian history of the complex also show striking similarities in timing and structural style with the Pearya Terrane of the Canadian Arctic. It is therefore suggested that the Vestgӧtabreen Complex represents an artefact of a subduction system active during Iapetus Ocean closure within the main region of the Caledonian Orogeny, but escaped to the periphery along major sinistral strike-slip faults prior to or during the incipient stages of continental collision between Baltica and Laurentia. Assembly of the Caledonian Basement Provinces occurred before the Ellesmerian Orogeny when Svalbard was situated in close proximity to Northern Greenland and the Pearya Terrane.

Supplementary Materials

The following are available online at https://www.mdpi.com/2075-163X/10/2/125/s1, Table S1. Raw data for the in situ white mica 40Ar/39Ar geochronology; Table S2: Raw data for monazite Th-U-total Pb microprobe geochronology.

Author Contributions

All authors have read and agreed to the published version of the manuscript. Conceptualization, C.J.B.; methodology, C.J.B., E.J.; investigation, C.J.B., K.W., E.J., D.S., J.M., resources, C.J.B., K.W., E.J., D.S., J.M.; writing—original draft preparation; C.J.B.; writing—review and editing, C.J.B., K.W., E.J., D.S., J.M.; visualization, C.J.B., K.W., E.J., D.S., J.M.; supervision, K.W., D.S., J.M.; funding acquisition, C.J.B., J.M.

Funding

This study was funded by the National Science Centre, Poland (project No. 2017/25/N/ST10/02501)

Acknowledgments

We are very grateful to Karolina Kośmińska whose knowledge of the Caledonian basement in Svalbard was integral for the initiation of this project. We strongly thank Maciek Manecki, Grzegorz Ziemniak, Iwona Klonowska, Nikola Koglin and Sara Rzegocka for logistical, moral and scientific support during the 2018 field season on Svalbard. We would like to thank Alfredo Camacho for his assistance with in situ white mica 40Ar/39Ar geochronology and Valérie Magnin for her assistance with monazite Th-U-total Pb geochronology. Three anonymous reviewers are especially thanked for their comments and criticisms that helped to improve the quality of the article.

Conflicts of Interest

The authors declare no conflicts of interest.

Appendix A

The Gaussian deconvolution method of defining statistical populations from both the 40Ar/39Ar and Th-U-total Pb datasets produces uncertainties that are only propagated from the assigned uncertainties of the individual data points. Additional uncertainty from the spread of the data points is not incorporated into the Gaussian deconvolution uncertainties. As a result, the statistical uncertainties produced by this method may be a significant underestimation of the “true” uncertainty. Therefore, we developed a method to calculate an uncertainty for each population that takes into account (1) the internal uncertainty, (2) the number of data points that define each population, and (3) the spread in the data.
Uncertainties are calculated using Equation (A1):
U n = 0.5 6 X n
An exponential equation was chosen to accentuate the uncertainty produced from the number of data points that define a population. For example, the difference in uncertainty between a population defined by four data points and a population defined by eight data points will be greater than the difference in uncertainty between the latter population and a third population defined by twelve data points, etc. The unknown “Un” is the contribution factor of uncertainty from the number of data points. The variable “Xn” is the weight for the contribution factor that is based on the number of data points “n”, as described by Equation (A2):
X n = 1 + 1 n
The contribution factor of uncertainty from the number of data points is then multiplied by reported uncertainty of the Gaussian deconvolution method that is based on the internal uncertainty of the population, shown by Equation (A3):
U P = U i U n
where “Ui” is the reported uncertainty from the Gaussian deconvolution method for a given population and “UP” is the calculated uncertainty for the same populations that incorporates (1) the internal uncertainty and (2) the number of data points that define each population.
To account for (3) the spread in the data, each population from a dataset was investigated individually. A cluster of dates was manually selected, based on the amount of dates defining the given population, and a weighted average was obtained. The weighted average and the 2σ internal uncertainty compared the population average and the 2σ internal uncertainty that was computed from Gaussian deconvolution to check that the manually selected cluster of dates is an appropriate representation of data points that define the population in question. The uncertainty of the weighted average that accounts for the mean square weighted deviation MSWD (i.e., the scatter in the data) as well as the internal uncertainty was checked against the uncertainty produced by our method described above. If our calculated uncertainty is greater than the uncertainty output by the weighted average, then it was determined our uncertainty satisfies (3) the spread in the data in incorporated into the weighted average. If not, we report the uncertainty calculated from the MSWD and internal uncertainty of the weighted average.
For Equation (A1), a base of six was chosen to keep the contribution of uncertainty from the number of data points on the order of 1–4 Ma. The additional factor of 0.5 was introduced to translate the function downwards along the y-axis values so that the uncertainties calculated by our method for the most robust statistical populations (e.g., in our study the c. 476 Ma age population of the Upper Unit) closely matched with the uncertainty computed by the weighted average that incorporated both internal uncertainty and the spread in the data.
Table A1. Summary of population uncertainties.
In-Situ White Mica 40Ar/39Ar Populations.
Population±2σ 1Fraction of DatasetNumber of Analyses for the PopulationWeighted Average 2±2σ 3MSWD±2σ 4UP 5
Upper Unit (n = 41)
493.31.50.145.74493.11.74.24.57.3
476.30.70.6928.29476.20.714.11.52.3
439.81.50.176.97439.81.5757.4
Lower Unit (n = 42)
454.40.80.3615.12454.40.8153.36.1
426.40.920.3615.12426.30.92153.83.8
398.11.20.218.82398.11.1226.16.1
364.71.90.072.94364.71.91.85.410.5
Monazite Th-U-total Pb Populations
SN18-05A (n = 55)
595.37.50.116.1596.25.90.95.930.3
522.76.00.168.8523.35.06.014.022.1
433.53.90.1910.5433.73.84.28.613.9
393.72.20.3921.5393.72.25.15.27.2
343.96.30.147.7344.06.32.211.023.9
SN18-06 (n = 28)
584.99.20.143.9584.89.22.925.043.6
494.86.20.185.0494.86.27.924.026.5
410.32.80.4312.0410.32.810.910.09.7
344.03.80.257.0344.03.84.19.614.7
SN18-12 (n = 28)
485.48.40.215.9485.45.68.521.022.8
408.63.20.5214.6408.53.212.012.010.9
345.25.60.267.3344.78.31.311.032.2
1 Uncertainties are calculated from the Gaussian deconvolution method and are derived only from assigned uncertainties of each data point; 2 Obtained from the manually selected groups based on the number of data points for each population; 3 Uncertainties propogated only from the assigned uncertainties of each data point; 4 Uncertainties accounting for the assigned uncertanties of the data points as well as the spread in the data (i.e., MSWD); 5 Uncertainty that is provided for each population based on our method.

References

  1. Harland, W.B. The Geology of Svalbard; The Geological Society of London, Memoirs: London, UK, 1997; Volume 17, pp. 1–521. [Google Scholar]
  2. Gee, D.G.; Teben’kov, A.M. Svalbard: A fragment of the Laurentian margin. In The Neoproterozoic Timanide Orogen of Eastern Baltica; Gee, D.G., Pease, V., Eds.; The Geological Society of London, Memoirs: London, UK, 2004; Volume 30, pp. 191–206. [Google Scholar]
  3. Pease, V.; Drachev, S.; Stephenson, R.; Zhang, X. Arctic lithosphere—A review. Tectonophysics 2014, 628, 1–25. [Google Scholar] [CrossRef]
  4. Piepjohn, K.; von Gosen, W.; Tessensohn, F.; Reinhardt, L.; McClelland, W.C.; Dallmann, W.K.; Gaedicke, C.; Harrison, J.C. Tectonic map of the Ellesmerian and Eurekan deformation belts on Svalbard, North Greenland, and the Queen Elizabeth Islands (Canadian Arctic). Arktos 2015, 1, 12. [Google Scholar] [CrossRef] [Green Version]
  5. Gee, D.G.; Fossen, H.; Henriksen, N.; Higgins, A.K. From the Early Paleozoic Platforms of Baltica and Laurentia to the Caledonide Orogen of Scandinavia and Greenland. Episodes 2008, 31, 44–51. [Google Scholar] [CrossRef] [Green Version]
  6. Gee, D.G.; Juhlin, C.; Pascal, C.; Robinson, P. Collisional Orogeny in the Scandinavian Caledonides (COSC). GFF 2010, 132, 29–44. [Google Scholar] [CrossRef]
  7. Gee, D.G. Svalbard‘s Caledonian terranes reviewed. GFF 1986, 108, 284–286. [Google Scholar] [CrossRef]
  8. Gee, D.G.; Page, L.M. Caledonian terrane assembly on Svalbard: new evidence from 40Ar/39Ar dating in Ny Friesland. Am. J. Sci. 1994, 294, 1166–1186. [Google Scholar] [CrossRef]
  9. Friend, P.F.; Williams, B.P.J.; Ford, M.; Williams, E.A. Kinematics and dynamics of Old Red Sandstone basins. In New Perspectives on the Old Red Sandstone; Friend, P.F., Williams, B.P.J., Eds.; The Geological Society of London, Memoirs: London, UK, 2000; Volume 180, pp. 29–60. [Google Scholar]
  10. Manby, G.; Lyberis, N. Tectonic evolution of the Devonian Basin of northern Svalbard. Nor. Geol. Tidsskr. 1992, 72, 7–19. [Google Scholar]
  11. McCann, A.J. Deformation of the Old Red Sandstone of NW Spitsbergen links to the Ellesmerian and Caledoin orogenies. In New Perspectives on the Old Red Sandstone; Friend, P.F., Williams, B.P.J., Eds.; The Geological Society of London, Memoirs: London, UK, 2000; Volume 180, pp. 567–584. [Google Scholar]
  12. Piepjohn, K. The Svalbardian-Ellesmerian deformation of the Old Red Sandstone and the pre-Devonian basement in NW Spitsberg (Svalbard). In New Perspectives on the Old Red Sandstone; Friend, P.F., Williams, B.P.J., Eds.; The Geological Society of London, Memoirs: London, UK, 2000; Volume 180, pp. 585–601. [Google Scholar]
  13. Kośmińska, K.; Spear, F.; Majka, J.; Kośmińska, K. P–T–t metamorphic evolution of highly deformed metapelites from the Pinkie unit of western Svalbard using quartz-in-garnet barometry, trace element thermometry, P–T–X–M diagrams and monazite in-situ dating. In Proceedings of the European Geoscience Union, Vienna, Austria, 23–28 April 2017. Geophysical Research Abstracts 19, EGU2017-10469. [Google Scholar]
  14. Michalski, K.; Manby, G.; Nejbert, K.; Domańska-Siuda, J.; Burzyński, M. Using palaeomagnetic and isotopic data to investigate late to post-Caledonian tectonothermal processes within the Western Terrane of Svalbard. J. Geol. Soc. Lond. 2017, 174, 572–590. [Google Scholar] [CrossRef]
  15. Ohta, Y.; Hirajima, T.; Hiroi, Y. Caledonian high-pressure metamorphism in central western Spitsbergen. Geol. Soc. Am. Mem. 1986, 164, 205–216. [Google Scholar]
  16. Labrousse, L.; Elvevold, S.; Lepvrier, C.; Agard, P. Structural analysis of high-pressure metamorphic rocks of Svalbard: Reconstructing the early stages of the Caledonian orogeny. Tectonics 2008, 27, 1–22. [Google Scholar] [CrossRef]
  17. Harland, W.B. Caledonide Svalbard. In The Caledonian Orogen—Scandinavia and Related Areas; Gee, D.G., Sturt, B.A., Eds.; John Wiley & Sons, Inc.: Hoboken, NJ, USA, 1985; pp. 999–1016. [Google Scholar]
  18. Mazur, S.; Czerny, J.; Majka, J.; Manecki, M.; Holm, D.; Smyrak, A.; Wypych, A. A strike-slip terrane boundary in Wedel Jarlsberg Land, Svalbard, and its bearing on correlations of SW Spitsbergen with the Pearya terrane and Timanide belt. J. Geol. Soc. Lond. 2009, 166, 529–544. [Google Scholar] [CrossRef]
  19. Bazarnik, J.; Majka, J.; McClelland, W.C.; Strauss, J.V.; Kośmińska, K.; Piepjohn, K.; Elvevold, S.; Czupyt, Z.; Mikuš, T. U–Pb zircon dating of metaigneous rocks from the Nordbreen Nappe of Svalbard’s Ny-Friesland suggests their affinity to Northeast Greenland. Terra Nov. 2019, 31, 518–526. [Google Scholar] [CrossRef]
  20. Craddock, C.; Hauser, E.C.; Maher, H.D.; Sun, A.Y.; Guo-Qiang, Z. Tectonic evolution of the west Spitsbergen Fold Belt. Tectonophysics 1985, 114, 193–211. [Google Scholar] [CrossRef]
  21. Dallmann, W.K. Multiphase tectonic evolution of the Sorkapp-Hornsund mobile zone (Devonian, Carboniferous, Tertiary), Svalbard. Nor. Geol. Tidsskr. 1992, 72, 49–66. [Google Scholar]
  22. Ohta, Y. Blue schists from Motalafjella, western Spitsbergen. Nor. Polarinst. Skr. 1979, 167, 171–210. [Google Scholar]
  23. Kośmińska, K.; Majka, J.; Mazur, S.; Krumbholz, M.; Klonowska, I.; Manecki, M.; Czerny, J.; Dwornik, M. Blueschist facies metamorphism in Nordenskiöld Land of west-central Svalbard. Terra Nov. 2014, 26, 377–386. [Google Scholar] [CrossRef]
  24. Horsfield, W.T. Glaucophane Schists of Caledonian age from Spitsbergen. Geol. Mag. 1972, 109, 29–36. [Google Scholar] [CrossRef]
  25. Kanat, L.; Morris, A. A Working Stratigraphy for Central Western Oscar Il Land, Spitsbergen; Norsk Polarinstitut: Tromsø, Norway, 1988; Volume 190, 24p. [Google Scholar]
  26. Ohta, Y.; Krasil’čšikov, A.A.; Lepvrier, C.; Teben’kov, A.M. Northern continuation of Caledonian high-pressure metamorphic rocks in central-western Spitsbergen. Polar Res. 1995, 14, 303–315. [Google Scholar] [CrossRef]
  27. Hirajima, T.; Hiroi, Y.; Ohta, Y. Lawsonite and pumpellyite from the Vestgotabreen formation in Spitsbergen. Nor. Geol. Tidsskr. 1984, 64, 267–273. [Google Scholar]
  28. Kanat, L.H. Jadeite from southern Oscar II Land, Svalbard. Mineral Mag. 1984, 48, 301–303. [Google Scholar] [CrossRef]
  29. Ohta, Y.; Hiroi, Y.; Hirajima, T. Additional evidence of pre-Silurian high-pressure metamorphic rocks in Spitsbergen. Polar Res. 1983, 1, 215–218. [Google Scholar] [CrossRef]
  30. Armstrong, H.A.; Nakrem, H.A.; Ohta, Y. Ordovician conodonts from the Bulltinden Formation, Motalafjella, central-western Spitsbergen. Polar Res. 1986, 4, 17–23. [Google Scholar] [CrossRef]
  31. Gasser, D.; Andresen, A. Caledonian terrane amalgamation of Svalbard: detrital zircon provenance of Mesoproterozoic to Carboniferous strata from Oscar II Land, western Spitsbergen. Geol. Mag. 2013, 150, 1103–1126. [Google Scholar] [CrossRef]
  32. Scrutton, C.T.; Horsfield, W.T.; Harland, W.B. Silurian fossils from western Spitsbergen. Geol. Mag. 1976, 113, 519–523. [Google Scholar] [CrossRef]
  33. Hirajima, T.; Banno, S.; Hiroi, Y.; Ohta, Y. Phase petrology of eclogites and related rocks from the Motalafjella high-pressure metamorphic complex in Spitsbergen (Arctic Ocean) and its significance. Lithos 1988, 22, 75–97. [Google Scholar] [CrossRef]
  34. Agard, P.; Labrousse, L.; Elvevold, S.; Lepvrier, C. Discovery of Paleozoic Fe-Mg carpholite in Motalafjella, Svalbard Caledonides: A milestone for subduction-zone gradients. Geology 2005, 33, 761–764. [Google Scholar] [CrossRef] [Green Version]
  35. Bernard-Griffiths, J.; Peucat, J.J.; Ohta, Y. Age and nature of protoliths in the Caledonian blueschist-eclogite complex of western Spitsbergen: A combined approach using U–Pb, Sm–Nd and REE whole-rock systems. Lithos 1993, 30, 81–90. [Google Scholar] [CrossRef]
  36. Dallmeyer, R.D.; Peucat, J.J.; Hirajima, T.; Ohta, Y. Tectonothermal chronology within a blueschist-eclogite complex, west-central Spitsbergen, Svalbard: Evidence from 40Ar/39Ar and Rb–Sr mineral ages. Lithos 1990, 24, 291–304. [Google Scholar] [CrossRef]
  37. Schneider, D.A.; Faehnrich, K.; Majka, J.; Manecki, M. 40Ar/39Ar geochronologic evidence of Eurekan deformation within the West Spitsbergen Fold and Thrust Belt. In Circum-Arctic Structural Events: Tectonic Evolution of the Arctic Margins and Trans-Arctic Links with Adjacent Orogens; Piepjohn, K., Strauss, J.V., Reinhardt, L., McClelland, W.C., Eds.; Geological Society of America: Boulder, CO, USA, 2019; Volume 541, pp. 1–16. [Google Scholar]
  38. Kuiper, K.F.; Deino, A.; Hilgen, F.J.; Krijgsman, W.; Renne, P.R.; Wijbrans, J.R. Synchronizing Rock Clocks of Earth History. Geophys. Res. Lett. 2008, 320, 500–504. [Google Scholar] [CrossRef] [Green Version]
  39. Spell, T.L.; McDougall, I. Characterization and calibration of 40Ar/39Ar dating standards. Chem. Geol. 2003, 198, 189–211. [Google Scholar] [CrossRef]
  40. Dazé, A.; Lee, J.K.W.; Villeneuve, M. An intercalibration study of the Fish Canyon sanidine and biotite 40Ar/39Ar standards and some comments on the age of the Fish Canyon Tuff. Chem. Geol. 2003, 199, 111–127. [Google Scholar] [CrossRef]
  41. Steiger, R.H.; Jäger, E. Subcommission on geochronology: Convention on the use of decay constants in geo- and cosmochronology. Earth Planet. Sci. Lett. 1977, 36, 359–362. [Google Scholar] [CrossRef]
  42. Renne, P.R.; Norman, E.B. Determination of the half-life of 37Ar by mass spectrometry. Phys. Rev. C Nucl. Phys. 2001, 63, 473021–473023. [Google Scholar] [CrossRef]
  43. Renne, P.R.; Swisher, C.C.; Deino, A.L.; Karner, D.B.; Owens, T.L.; DePaolo, D.J. Intercalibration of standards, absolute ages and uncertainties in 40Ar/39Ar dating. Chem. Geol. 1998, 145, 117–152. [Google Scholar] [CrossRef]
  44. Roddick, J.C. High precision intercalibration of 40Ar-39Ar standards. Geochim. Cosmochim. Acta 1983, 47, 887–898. [Google Scholar] [CrossRef]
  45. Ross, J. Pychron v2.0.4-beta. 2017. Available online: https://github.com/NMGRL/pychron (accessed on 15 May 2014).
  46. Deino, A.L. Users Manual for Mass Spec. Version 7.961; Berkeley Geochronology Cente: Berkeley, CA, USA, 2013; Volume 1a, pp. 1–132. [Google Scholar]
  47. Sambridge, M.S.; Compston, W. Mixture modeling of multi-component data sets with application to ion-probe zircon ages. Earth Planet. Sci. Lett. 1994, 128, 373–390. [Google Scholar] [CrossRef]
  48. Grand’Homme, A.; Janots, E.; Seydoux-Guillaume, A.M.; Guillaume, D.; Magnin, V.; Hövelmann, J.; Höschen, C.; Boiron, M.C. Mass transport and fractionation during monazite alteration by anisotropic replacement. Chem. Geol. 2018, 484, 51–68. [Google Scholar] [CrossRef]
  49. Seydoux-Guillaume, A.-M.; Fougerouse, D.; Laurent, A.T.; Gardeś, E.; Reddy, S.M.; Saxey, D.W. Nanoscale resetting of the Th/Pb system in an isotopically-closed monazite grain: A combined atom probe and transmission electron microscopy study. Geo. Front. 2019, 10, 65–79. [Google Scholar] [CrossRef]
  50. Villa-Vialaneix, N.; Montel, J.-M.; Seydoux-Guillaume, A.-M. NiLeDAM: Monazite Datation for the NiLeDAM Team. R Package Version 0.1. 2013. Available online: http://niledam.r-forge.r-project.org (accessed on 12 June 2018).
  51. Spear, F.S.; Pyle, J.M.; Cherniak, D. Limitations of chemical dating of monazite. Chem. Geol. 2009, 266, 227–239. [Google Scholar] [CrossRef]
  52. Harrison, M.T.; Célérier, J.; Aikman, A.B.; Hermann, J.; Heizler, M.T. Diffusion of 40Ar in muscovite. Geochim. Cosmochim. Acta 2009, 73, 1039–1051. [Google Scholar] [CrossRef]
  53. Warren, C.J.; Hanke, F.; Kelley, S.P. When can muscovite 40Ar/39Ar dating constrain the timing of metamorphic exhumation? Chem. Geol. 2012, 291, 79–86. [Google Scholar] [CrossRef]
  54. Agard, P.; Yamato, P.; Jolivet, L.; Burov, E. Exhumation of oceanic blueschists and eclogites in subduction zones: Timing and mechanisms. Earth Sci. Rev. 2009, 92, 53–79. [Google Scholar] [CrossRef]
  55. Smye, A.J.; Warren, C.J.; Bickle, M.J. The signature of devolatisation: Extraneous 40Ar systematics in high-pressure metamorphic rocks. Geochim. Cosmochim. Acta 2013, 113, 94–112. [Google Scholar] [CrossRef]
  56. Uunk, B.; Brouwer, F.; ter Voorde, M.; Wijbrans, J. Understanding phengite argon closure using single grain fusion age distributions in the Cycladic Blueschist Unit on Syros, Greece. Earth Planet. Sci. 2018, 484, 192–203. [Google Scholar] [CrossRef]
  57. Warren, C.J.; Kelley, S.P.; Sherlock, S.C.; McDonald, C.S. Metamorphic rocks seek meaningful cooling rate: Interpreting 40Ar/39Ar ages in an exhumed ultra-high pressure terrane. Lithos 2012, 155, 30–48. [Google Scholar] [CrossRef]
  58. Majka, J.; Be’eri-Shlevin, Y.; Gee, D.G.; Czerny, J.; Frei, D.; Ladenberger, A. Torellian (c. 640 Ma) metamorphic overprint of Tonian (c. 950 Ma) basement in the Caledonides of southwestern Svalbard. Geol. Mag. 2014, 151, 732–748. [Google Scholar] [CrossRef]
  59. Rasmussen, B.; Fletcher, I.R.; McNaughton, N.J. Dating low-grade metamorphic events by SHRIMP U-Pb analysis of monazite in shales. Geology 2001, 29, 963–966. [Google Scholar] [CrossRef]
  60. Seydoux-Guillaume, A.-M.; Montel, J.-M.; Bingen, B.; Bosse, V.; de Parseval, P.; Paquette, J.-L.; Janots, E.; Wirth, R. Low-temperature alteration of monazite: Fluid mediated coupled dissolution-precipitation, irradiation damage, and disturbance of the U-Pb and Th-Pb chronometers. Chem. Geol. 2012, 330–331, 140–158. [Google Scholar] [CrossRef]
  61. Seydoux-Guillaume, A.M.; Bingen, B.; Bosse, V.; Janots, E.; Laurent, A.T. Transmission electron microscope imaging sharpens geochronological interpretation of zircon and monazite. In Microstructural Geochronology: Planetary Records Down to Atom Scale; Moser, D., Corfu, F., Reddy, S.M., Darling, J., Tait, K., Eds.; John Wiley & Sons, Inc.: Hoboken, NJ, USA, 2018; pp. 261–275. [Google Scholar]
  62. Williams, M.L.; Jercinovic, M.J.; Harlov, D.E.; Budzyn, B.; Hetherington, C.J. Resetting monazite ages during fluid-related alteration. Chem. Geol. 2011, 283, 218–225. [Google Scholar] [CrossRef]
  63. Janots, E.; Negro, F.; Brunet, F.; Goffé, B.; Engi, M.; Bouybaouène, M.L. Evolution of the REE mineralogy in HP-LT metapelites of the Sebtide complex, Rif, Morocco: Monazite stability and geochronology. Lithos 2006, 87, 214–234. [Google Scholar] [CrossRef]
  64. Gabudianu Radulescu, I.; Rubatto, D.; Gregory, C.; Compagnoni, R. The age of HP metamorphism in the Gran Paradiso Massif, Western Alps: A petrological and geochronological study of “silvery micaschists”. Lithos 2009, 110, 95–108. [Google Scholar] [CrossRef]
  65. Cosca, M.; Stunitz, H.; Bourgeix, A.-L.; Lee, J.P. 40Ar* loss in experimentally deformed muscovite and biotite with implications for 40Ar/39Ar geochronology of naturally deformed rocks. Geochim. Cosmochim. Acta 2011, 75, 7759–7778. [Google Scholar] [CrossRef]
  66. Cossette, É.; Schneider, D.A.; Warren, C.J.; Grasemann, B. Lithological, rheological, and fluid infiltration control on 40Ar/39Ar ages in polydeformed rocks from the West Cycladic detachment system, Greece. Lithosphere 2015, 7, 189–205. [Google Scholar] [CrossRef] [Green Version]
  67. Egli, D.; Mancktelow, N.; Spikings, R. Constraints from 40Ar/39Ar geochronology on the timing of alpine shear zones in the mont blanc-aiguilles rouges region of the european alps. Tectonics 2017, 36, 730–748. [Google Scholar] [CrossRef]
  68. Kellett, D.A.; Warren, C.; Larson, K.P.; Zwingmann, H.; van Staal, C.R.; Rogers, N. Influence of deformation and fluids on Ar retention in white mica: Dating the Dover Fault, Newfoundland Appalachians. Lithos 2016, 254, 1–17. [Google Scholar] [CrossRef]
  69. Kramar, N.; Cosca, M.A.; Hunziker, J.C. Heterogeneous 40Ar* distributions in naturally deformed muscovite: in situ UV-laser ablation evidence for microstructurally controlled intragrain diffusion. Earth Planet Sci. Lett. 2001, 192, 377–388. [Google Scholar] [CrossRef]
  70. Mulch, A.; Cosca, M.A. Recrystallization or cooling ages: In situ UV-laser 40Ar/39Ar geochronology of muscovite in mylonitic rocks. J. Geol. Soc. Lond. 2004, 161, 573–582. [Google Scholar] [CrossRef] [Green Version]
  71. Root, D.; Corfu, F. U-Pb geochronology of two discrete Ordovician high-pressure metamorphic events in the Seve Nappe Complex, Scandinavian Caledonides. Contrib. Mineral. Petrol. 2012, 163, 769–788. [Google Scholar] [CrossRef]
  72. Dallmeyer, R.D.; Stephens, M.B. Chronology of eclogite retrogression within the Seve Nappe Complex, Råvvejaure, Sweden: Evidence from 40Ar/39Ar mineral ages. Geol. Runschau 1991, 80, 729–743. [Google Scholar] [CrossRef]
  73. Stephens, M.B.; Van Roermund, H.L.M. Occurrence of glaucophane and crossite in eclogites of the Seve nappes, southern Norrbotten Caledonides, Sweden. Nor. Geol. Tidsskr. 1984, 64, 155–163. [Google Scholar]
  74. Pettersson, C.H.; Pease, V.; Frei, D. Detrital zircon U–Pb ages of Silurian–Devonian sediments from NW Svalbard: A fragment of Avalonia and Laurentia? J. Geol. Soc. Lond. 2010, 167, 1019–1032. [Google Scholar] [CrossRef]
  75. Harland, W.B.; Wright, N.J. Alternative hypothesis for the pre-Carboniferous evolution of Svalbard. Nor. Polarinst. Skr. 1979, 167, 89–117. [Google Scholar]
  76. Ohta, Y.; Dallmeyer, R.D.; Peucat, J.J. Caledonian terranes in Svalbard. Geol. Soc. Am. Spec. Pap. 1989, 230, 1–16. [Google Scholar]
  77. McClelland, W.C.; Malone, S.J.; von Gosen, W.; Piepjohn, K.; Läufer, A. The timing of sinistral displacement of the Pearya Terrane along the Canadian Arctic Margin. Z. Dtsch. Ges. Geowiss. 2012, 163, 251–259. [Google Scholar] [CrossRef]
  78. Trettin, H.P. Pearya: A composite terrane with Caledonian affinities in northern Ellesmere Island. Can. J. Earth Sci. 1987, 24, 224–245. [Google Scholar] [CrossRef]
  79. Von Gosen, W.; Piepjohn, K.; McClelland, W.C.; Läufer, A. The Pearya Shear Zone in the Canadian High Arctic: Kinematics and significance. Z. Dtsch. Ges. Geowiss. 2012, 163, 233–249. [Google Scholar] [CrossRef]
  80. Andréasson, P.-G.; Allen, A.; Aurell, O.; Boman, D.; Ekestubbe, J.; Goerke, U.; Lundgren, A.; Nilsson, P.; Sandelin, S. Seve terranes of the Kebnekaise Mts., Swedish Caledonides, and their amalgamation, accretion and affinity. GFF 2018, 140, 264–291. [Google Scholar] [CrossRef] [Green Version]
  81. Bender, H.; Glodny, J.; Ring, U. Absolute timing of Caledonian orogenic wedge assembly, Central Sweden, constrained by Rb-Sr multi-mineral isochron data. Lithos 2019, 344, 339–359. [Google Scholar] [CrossRef]
  82. Dallmeyer, R.D.; Gee, D.G. Polyorogenic 40Ar/39Ar Mineral Age Record in the Seve and Köli Nappes of the Gäddede Area, Northwestern Jämtland, Central Scandinavian Caledonides. J. Geol. 1988, 96, 181–198. [Google Scholar] [CrossRef]
  83. Dallmeyer, R.D. 40Ar/39Ar mineral age record of a polyorogenic evolution within the Seve and Köli nappes, Trøndelag, Norway. Tectonophysics 1990, 179, 199–226. [Google Scholar] [CrossRef]
  84. Majka, J.; Be’eri-Shlevin, Y.; Gee, D.G.; Ladenberger, A.; Claesson, S.; Konečny, P.; Klonowska, I. Multiple monazite growth in the Åreskutan migmatite: Evidence for a polymetamorphic Late Ordovician to Late Silurian evolution in the Seve Nappe Complex of west-central Jämtland, Sweden. J. Geosci. 2012, 57, 3–23. [Google Scholar] [CrossRef] [Green Version]
  85. Ohta, Y. Caledonian and precambrian history in Svalbard: A review, and an implication of escape tectonics. Tectonophysics 1994, 231, 183–194. [Google Scholar] [CrossRef]
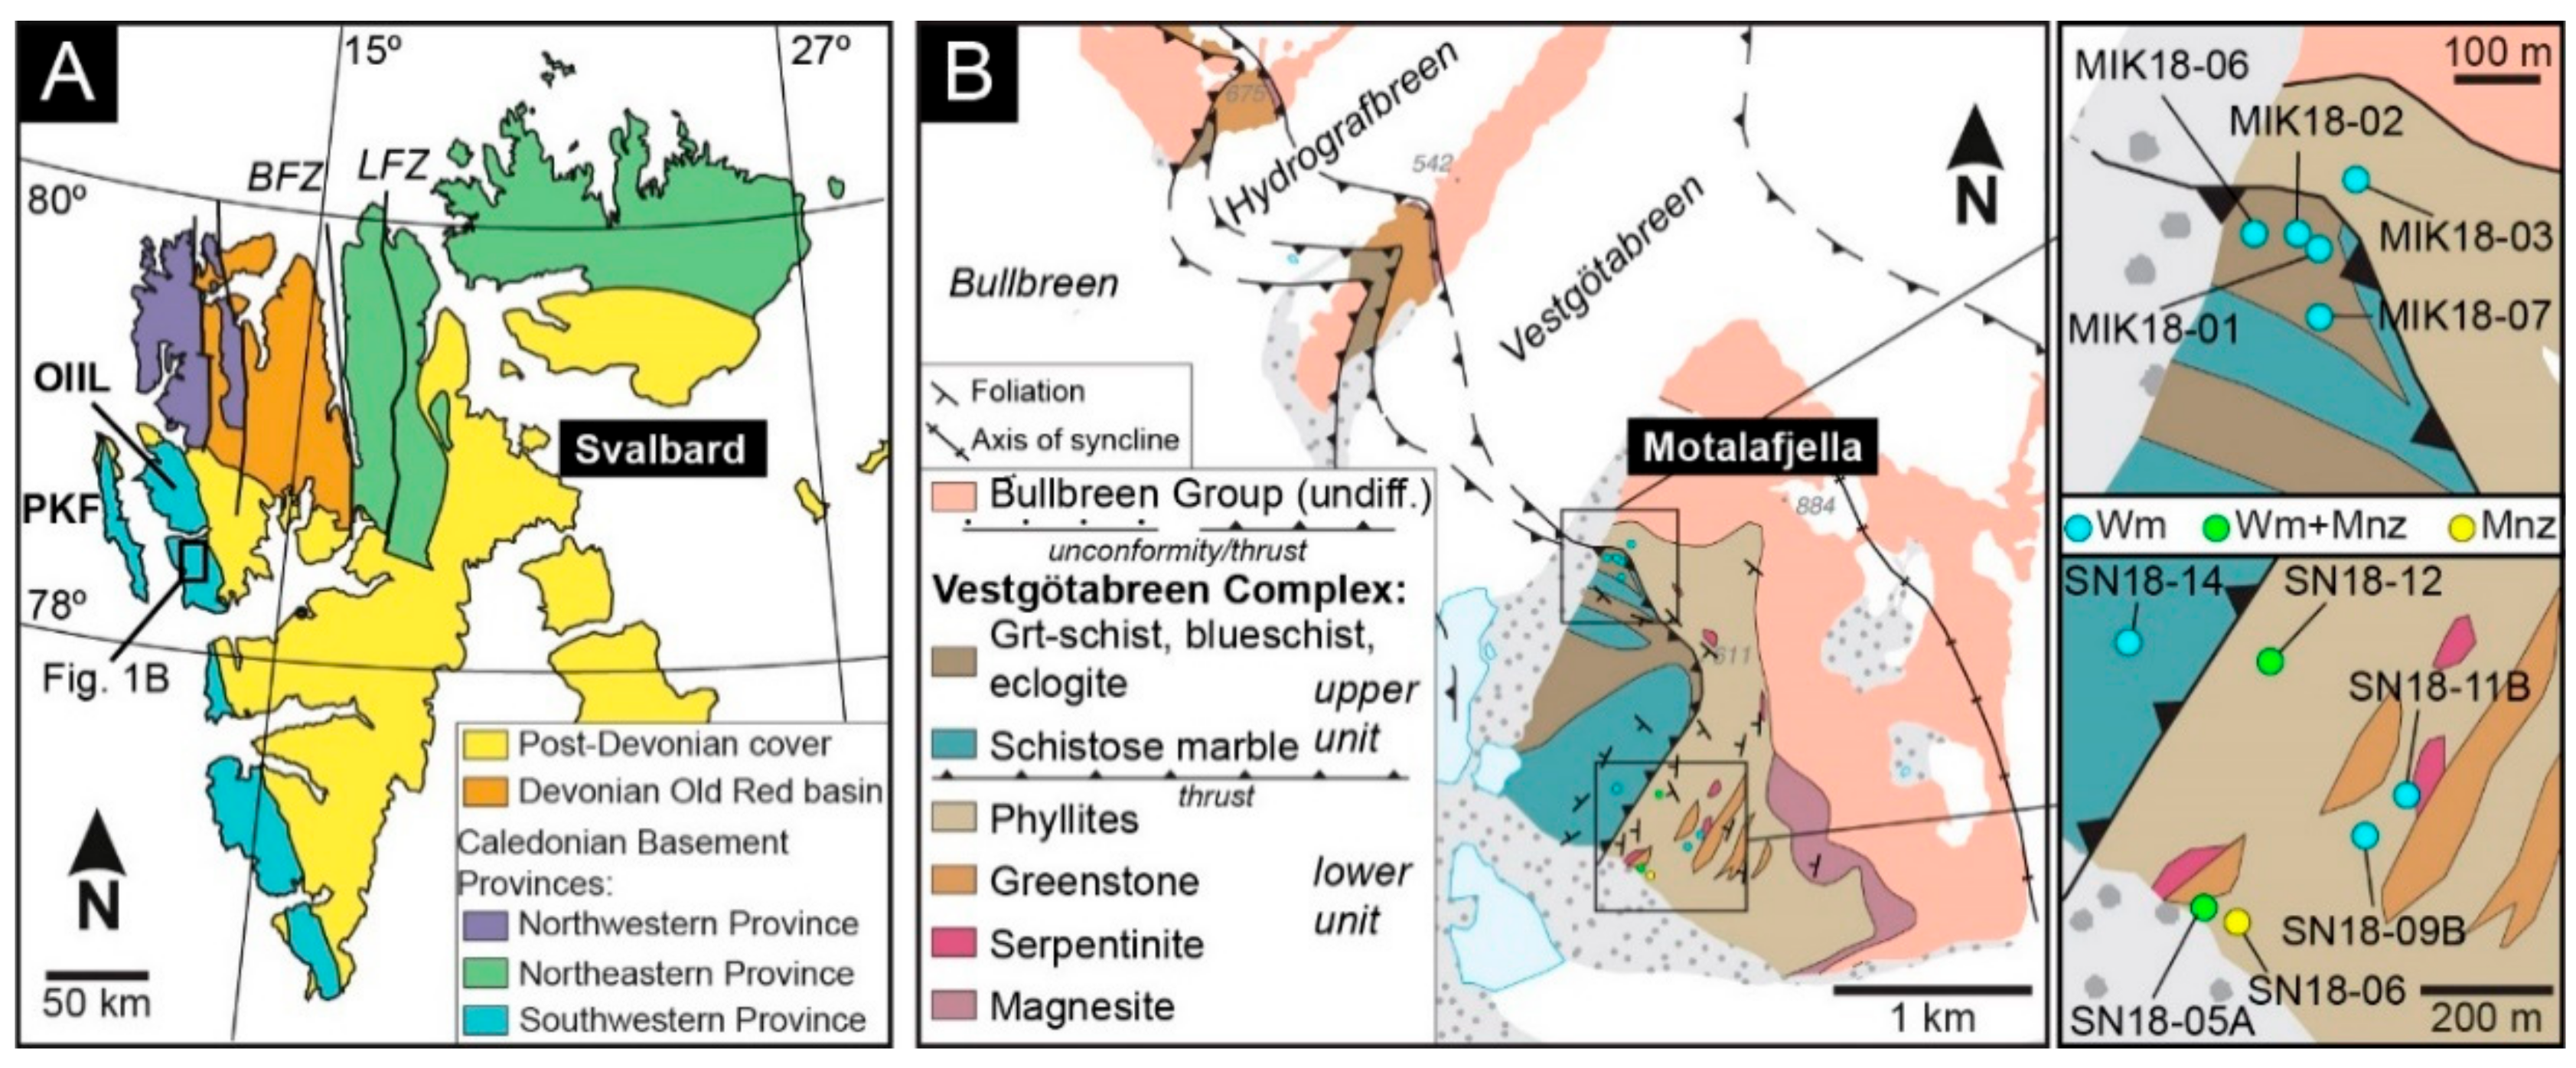
Figure 1. (A) Simplified map of Svalbard showing the exposures of the Caledonian Basement Terranes and the major strike-slip bounding faults, after Gee and Teben’kov [2]. (B) Geological bedrock map of the Vestgӧtabreen Complex and overlying Bullbreen Group sedimentary cover from Motalafjella nunatak towards the northwest in Oscar II Land, after Ohta et al. [15]. Representative orientations of the foliation planes and the location of the syncline axis are displayed after Labrousse et al. [16]. The areas in which samples were obtained are enlarged for clarity. Abbreviations: BFZ, Billefjorden Fault Zone; LFZ, Lomfjorden Fault Zone, OIIL, Oscar II Land; PKF, Prins Karls Forland.
Minerals 10 00125 g001
Figure 2. Microphotographs of both the Upper Unit (AD) and Lower Unit (EH) lithologies. (A) The foliation of the garnet-white mica schist that is defined by white mica and chlorite interlayers. (B) Representation of the high-pressure mineral assemblage. Isolated white mica grains are parallel to the foliation that is defined by the alignment of glaucophane. Chloritoid is partially decomposed to chlorite and lawsonite is partially decomposed to fine-grained polymineralic aggregates. (C) Mineral assemblage of the massive blueschists. Glaucophane, chloritoid and lawsonite pseudomorphs are randomly oriented. White mica is typically found as large clusters of randomly oriented grains, sometimes slightly bent or kinked. (D) Coarse (lower left) and fine-grained calcite textures of the Upper Unit schistose marbles. The foliation is easily identified by the orientations of white mica, which are slightly kinked and bent. White mica can be found in both coarse and fine-grained domains. The fine-grained layers are oriented parallel to the dominant orientation of white mica. (E,F) Phyllitic foliation of the Lower Unit consisting of very finely interlayered white mica and chlorite. Quartz bands are also oriented parallel to the main foliation. Monazite spatially associated with chlorite in the phyllitic foliation. (G) Retrogressed blueschist with a foliation defined by white mica and quartz with sparse chlorite grains. Remnants of glaucophane are present and moderately aligned with the foliation. Pseudomorphs after lawsonite are distinguished based on their shape. (H) Breccia obtained from the Lower Unit. The angular clasts are composed of quartz-dominated compositions (i.e., left side of photo), calcite-dominated (not depicted) and well-foliated white mica-chlorite interlayers (i.e., right side of photo) that are internally deformed and strongly resemble phyllitic lithologies of the Lower Unit (e.g., microphotograph F). Abbreviations: Cal, calcite; Chl, chlorite; Ctd, chloritoid; Gln, glaucophane; Grt, garnet; Lws, lawsonite; Wm, white mica; Qz, quartz.
Minerals 10 00125 g002
Figure 3. Electron microprobe (WDS) chemical maps of Si for samples of the upper (AD) and Lower Unit rocks (EH). (A,B) White mica grains from the foliated blueschists. (C) A bundle of white mica from the massive blueschist. (D) White mica from the schistose marble. (E) White mica that defines the foliation of the phyllite proximal to the bounding thrust of the two units. (F,G) White mica grains that define the foliations of phyllitic rocks distal from the bounding thrust. (H) White mica within well-foliated micaceous clasts in the breccia from the Lower Unit. All maps are presented according to the lower scale of Si counts. Abbreviations: Wm, white mica.
Minerals 10 00125 g003
Figure 4. Results of in situ white mica 40Ar/39Ar geochronology from the Upper Unit (top) and the Lower Unit (bottom). The left diagrams show the individual dates (±1σ uncertainty) organized from oldest to youngest. The right side depicts histograms of the samples with corresponding relative frequency curves. The populations were derived by Gaussian deconvolution of each entire sample dataset. The grey bars represent the uncertainty of each population that has been attributed geological significance. Interpretations of each population are presented within the grey bars.
Minerals 10 00125 g004
Figure 5. Back-scattered electron images of monazite showing representative textures and relations with other minerals. (AC) Depictions of monazite for sample SN18-05A. Monazite is typically found as ‘archipelagos’ of irregularly shaped monazite in close spatial association with chlorite that is aligned with the foliation. Internally, the monazite exhibits a very porous texture. (DF) Monazite of sample SN18-06 nucleating on grains of florencite. These grains are also associated with chlorite and show porous internal textures. (GI) Monazite from sample SN18-12. These monazite grains are closely linked with chlorite in the main foliation and sometimes show textural zoning with porous cores surrounded by non-porous rims. No distinction in dates were obtained between the textural cores and rims. Abbreviations: Chl, chlorite; Fc, florencite; Mnz, monazite; Qz, quartz; Wm, white mica.
Minerals 10 00125 g005
Figure 6. Monazite chemistry plots vs. Th-U-total Pb dates for ThO2 (left side) and Y2O3 (right side) for all three samples. No trends were observed for SN18-05A or ThO2 vs. dates of sample SN18-06A. A slight decrease of Y2O3 was observed with decreasing dates for sample SN18-06. The same trends were noted for both ThO2 and Y2O3 vs. dates for SN18-12.
Minerals 10 00125 g006
Figure 7. Results of monazite Th-U-total Pb geochronology of samples SN18-05A (top), SN18-06 (middle) and SN18-12 (bottom). The left diagrams show the individual dates (±2σ uncertainty) organized from oldest to youngest. The right side depicts histograms of the samples with corresponding relative frequency curves. The populations were derived by Gaussian deconvolution of each entire sample dataset. The grey bars represent the uncertainty of each population that has been attributed geological significance. Interpretations of each population are presented within the grey bars.
Minerals 10 00125 g007
Figure 8. Schematic structural reconstructions, after Labrousse et al. [16], annotated with the geochronological ages of events constrained by this study. (A) The state of the Vestgӧtabreen Complex at Motalafjella in the late Ordovician to early Silurian, after (or during) deposition of the Bullbreen Group sediments, but prior to late Caledonian thrusting. Cooling of the Upper Unit occurred at 476 ± 2 Ma, followed by assembly of the units at 454 ± 6 Ma and then surface exposure and deposition of the Bullbreen Group in the Late Ordovician to early Silurian. (B) Geometry of the exposure in the present-day. Late Caledonian thrusting (c. 430–400 Ma) is depicted in association with emplacement of the Upper Unit onto the Lower Unit and deformation of the Bullbreen Group. Representative sample locations are plotted.
Minerals 10 00125 g008
Figure 9. Schematic reconstruction of the positions of the Arctic islands of Canada and Greenland (i.e., Laurentia), Scandinavia (Baltica) and Svalbard in post-Ellesmerian time. The overlays of Caledonian and Ellesmerian tectonism are after Gee and Teben’kov [2] and Piepjohn et al. [17]. The deformation corresponding to Eurekan tectonism across the Arctic has been removed to highlight the distribution of Caledonian and Ellesmerian tectonism. A detailed illustration of all three tectonic events can be found in Piepjohn et al. [17]. The strike-slip faults through Svalbard and along the Pearya Terrane are Caledonian in age. Locations of the Vestgӧtabreen Complex in Svalbard, Tsäkkok Lens in the Scandinavian Caledonides and the Pearya Terrane in the Canadian Arctic are highlighted.
Minerals 10 00125 g009
Table 1. Summary of geochronological results for all samples.
Sample NameRock TypeCoordinates 1Number of Wm 2 Analyses40Ar/39Ar Date Range40Ar/39Ar Date Populations 3Number of Mnz 4 AnalysesTh-U-Total Pb Date RangeTh-U-Total Pb Date Populations 3
Upper Unit
MIK18-01Garnet-white mica schist78°26′23.09″N; 12°53′06.03″E9c. 498 Ma and c. 481–473 Ma493 ± 7 Ma; 476 ± 2 Ma; 440 ± 6 MaN/AN/AN/A
MIK18-02Well-foliated Blueschist78°26′28.08″N; 12°53′06.03″E9c. 490–471 MaN/AN/AN/A
MIK18-06AWell-foliated Lws-blueschist78°26′28.00″N; 12°52′55.06″E8c. 483–474 MaN/AN/AN/A
MIK18-07AMassive Lws-blueschist78°26′27.05″N; 12°53′10.08″E8c. 498–491 Ma and c. 478–468 MaN/AN/AN/A
SN18-14Schistose marble78°25′33.38″N; 12°52′51.39″E7c. 447–431 MaN/AN/AN/A
Lower Unit
SN18-06Phyllite78°25′13.59"N; 12°53′35.31"EN/AN/AN/A28c. 294–607 Ma585 ± 44 Ma; 495 ± 27 Ma; 410 ± 10 Ma; 344 ± 15 Ma
MIK18-03BBrecciated white mica schist78°26′28.06"N; 12°53′14.04"E7c. 458–445 Ma and c. 395 Ma454 ± 6 Ma; 426 ± 4 Ma; 398 ± 6 Ma; 365 ± 11 MaN/AN/AN/A
SN18-05APhyllite78°25′14.33"N; 12°53′26.66"E10c. 463–363 Ma55c. 303–607 Ma595 ± 30 Ma; 523 ± 22 Ma; 434 ± 14 Ma; 394 ± 7 Ma; 344 ± 24 Ma
SN18-09BRetrogressed blueschist78°25′17.79"N; 12°54′16.84"E9c. 466–423 MaN/AN/AN/A
SN18-11BPhyllite78°25′20.93"N; 12°54′31.55"E9c. 429–364 MaN/AN/AN/A
SN18-12Phyllite78°25′31.10"N; 12°53′46.48"E8c. 487 Ma and c. 433–406 Ma28c. 319–529 Ma485 ± 23 Ma; 409 ± 11 Ma; 345 ± 32 Ma
1 Using WGS 84 geographic coordinate system; 2 Abbreviation: white mica; 3 Age populations calculated using the Gaussian deconvolution method; 4 Abbreviation: monazite.