Article

Rock-Fill Cofferdam Crest Settlement Behavior Analysis Through Geodetic Monitoring Data

1
Faculty of Natural Sciences and Engineering, University of Ljubljana, 1000 Ljubljana, Slovenia
2
Technical Department, Premogovnik Velenje d.o.o., 3320 Velenje, Slovenia
*
Author to whom correspondence should be addressed.
Minerals 2020, 10(2), 152; https://doi.org/10.3390/min10020152
Submission received: 26 December 2019 / Revised: 31 January 2020 / Accepted: 8 February 2020 / Published: 11 February 2020

Abstract

:
Construction of rock-fill dams requires extensive preparatory work. The rationality of construction, ecological aspects, and flood safety must be considered. Potential catastrophic consequences of failure or collapse classify dam structures as high-risk objects which are built according to all safety regulations, and their conditions must be monitored. In this study, we focus on the settlement behavior of a cofferdam crest by analyzing the obtained monitoring data with a non-exponential modified sigmoid function, developed at the Faculty of Natural Sciences and Engineering (FNSE model). Furthermore, monitoring adjustment is introduced, and future settlement is estimated based on verification with actual values.

1. Introduction

In countries with a developed water management system, hydrodynamic embankments or dam structures are built for water redistribution, drainage retention and flood prevention by high water peak reduction [1,2]. Embankment dams are also used to harness water power in terms of electricity generation. Such hydropower structures need huge amounts of water to serve as a cooling medium and are nowadays constructed 300 m high [3,4]. Constructing large-scale rock-fill dams raises new challenges about safety provision during and after construction. And with a higher risk of failure, more frequent and precise monitoring is required [5].
The general types of hydropower embankments are rock-fill dams, consisting mostly of fragmented rock with an impermeable core. The core and the rock shells are separated by a series of correctly-graded material and, in certain cases, where there is insufficient non-permeable material, concrete, asphalt, or steel plates can also be installed [6]. During construction and impounding of the reservoir, the impermeable core goes through complex seepage and deformation processes [7,8] which continue long after construction has been completed [9]. Therefore, long-term monitoring is essential to ensure safety even during the structure’s operational period.
Most studies for characterizing the structural behavior of rock-fill dams are conducted based on various geodetic monitoring techniques [2,5,7,10,11,12,13,14,15,16,17,18,19,20,21]. Geometric and triangulation levelling techniques are some of the most viable and commonly used approaches for monitoring vertical displacements (settlement) of dam structures [10,11,12]. To assure precise monitoring data acquisition, observation points must be placed and fixed in stable areas [5,12,16]. The latter can be done by establishing points as concrete pillars, grounded on the crest of the dam [12]. Geometric levelling allows settlement data to be measured with a better accuracy than 1.7 mm/km [13], while the accuracy of triangulation levelling measurements is about 3.6 mm/km [7]. Conventional levelling methods, although precise, can be long-lasting. Modern geodetic sensors are thus becoming increasingly popular for developing automated and high-precision monitoring systems. With robotic total stations, the spatial coordinates of observation points are obtained through reflectors that are placed on fixed pillars [14]. By eliminating the human factor, the time of data acquisition is reduced, and the number of measurement repetitions is increased. Besides terrestrial levelling techniques, in recent years, GNSS (Global Navigation Satellite System) has gained a substantial role in geodetic dam monitoring [15]. The biggest advantages of GNSS implementation into a monitoring system are, amongst other things, the potential of constant data acquisition and the option to integrate with conventional terrestrial approaches [16,17]. Two main GNSS methods were presented by Montillet [18]: the static post-processing method with an accuracy below 1 cm, and the real-time kinematic (RTK) method with an accuracy of about ±1 cm. So, it is understood that the static GNSS measurements can be used for long-term monitoring, while RTK is more suitable for early-warning systems. Chrzanowski and Szostak-Chrzanowski [19] also report that the use of GNSS and robotic total stations can be the best solution for a continuous and completely automated monitoring system. Other possible approaches for crest settlement monitoring are remote sensing techniques. Here, the terrestrial laser scanning (TLS) method [20] and the satellite differential interferometric synthetic aperture radar (DInSAR) [21] must be emphasized. TLS is a time-efficient method for the acquisition of high-density 3D point clouds with an accuracy comparable to conventional geodetic methods. However, the challenge of using TLS in long-term monitoring of high-risk objects is the identification of control points within the 3D cloud, and then the comparison of their exact locations in multiple epochs [20]. DInSAR faces similar challenges as TLS but allows for the monitoring of a much wider area with a lesser accuracy [21]. By combining DInSAR with TLS, the settlement behavior of specific parts of the dam, the entire structure, or the surrounding area can be monitored.
Unexpected dam settlements are the first and only indicator of the impermeable core’s failure. With regular monitoring and the option to predict the long-term settlement, a comparison of the predicted values with those measured can alert the engineer of any potential failures [22]. The prediction model provides information on the expected deformations and therefore contributes to the design of the monitoring scheme.
Analyzing long-term settlement data, which were derived from any type of geodetic or remote-sensing monitoring technique, can give insight into future settlement behavior. There are many mathematical models that can be used together with monitoring data to predict future settlement behavior and assess dam safety during its operation [6,23]. Depending on the state of the dam structure (reservoir filling, construction work, maintenance) and settlement trend or pattern, the analysis complexity varies. The most reliable and commonly-used are numerical and statistical techniques [24,25]. Using numerical techniques to predict dam settlement values, such as finite fem method (FEM), can reach an exceptionally good verification with geodetic monitoring data up to a few centimeters [8,24]. However, geotechnical and/or geological parameters as well as knowledge of soil mechanics are required to determine the numerical model. A different approach is using statistical analyses where geo-mechanical aspects are not taken into account. When long-term monitoring data is available, future settlement behavior can be predicted, as shown by Pytharouli and Stiros [25]. By analyzing a 35-year-old monitoring record, largely composed of geodetic data, the future behavior of the dam’s crest can be estimated using a polynomial function. Even though such specific statistical methods are used to establish the relationship between dam settlement behavior and external influences, it can serve as an appropriate general framework (theory) for further analysis and model selection processes.
The presented study refers to the application of a mathematical model, which can be used in combination with any type of geodetic monitoring data (settlement values). To achieve a reliable estimate of future nonlinear settlement behavior for optional points within the observed area, the well-established logistic function [26] is a possible approach. Although logistic functions have a low number of parameters, they contain exponentials and are therefore more complex for fitting to data [27]. The alternative we have chosen for the purposes of our research is a non-exponential modified sigmoid function (developed at the Faculty of Natural Sciences and Engineering (FNSE)) [28].
The main purpose was to verify the applicability of the FNSE model to geodetic monitoring data. During the research, we did not focus on monitoring performance or accuracy, but only on settlement data. With the use of the proposed and verified FNSE model, a further goal was to implement the model into the monitoring scheme and, based on extrapolated values, adjust the time and frequency of measurements. This provides field operators with information on when to expect intense settlement and more frequent measurements are needed, or when the settlement is approaching its final value (consolidation) and geodetic monitoring can be less frequent.
In this paper, the behavior of the crest is investigated during construction of a rock-fill cofferdam with an impermeable clay core. Geodetic monitoring data of twenty-six observational points was analyzed to determine settlement behavior during stages of first and second reservoir filling. Based on the results, critical points were identified, and the monitoring scheme was accordingly adjusted.

2. Materials and Methods

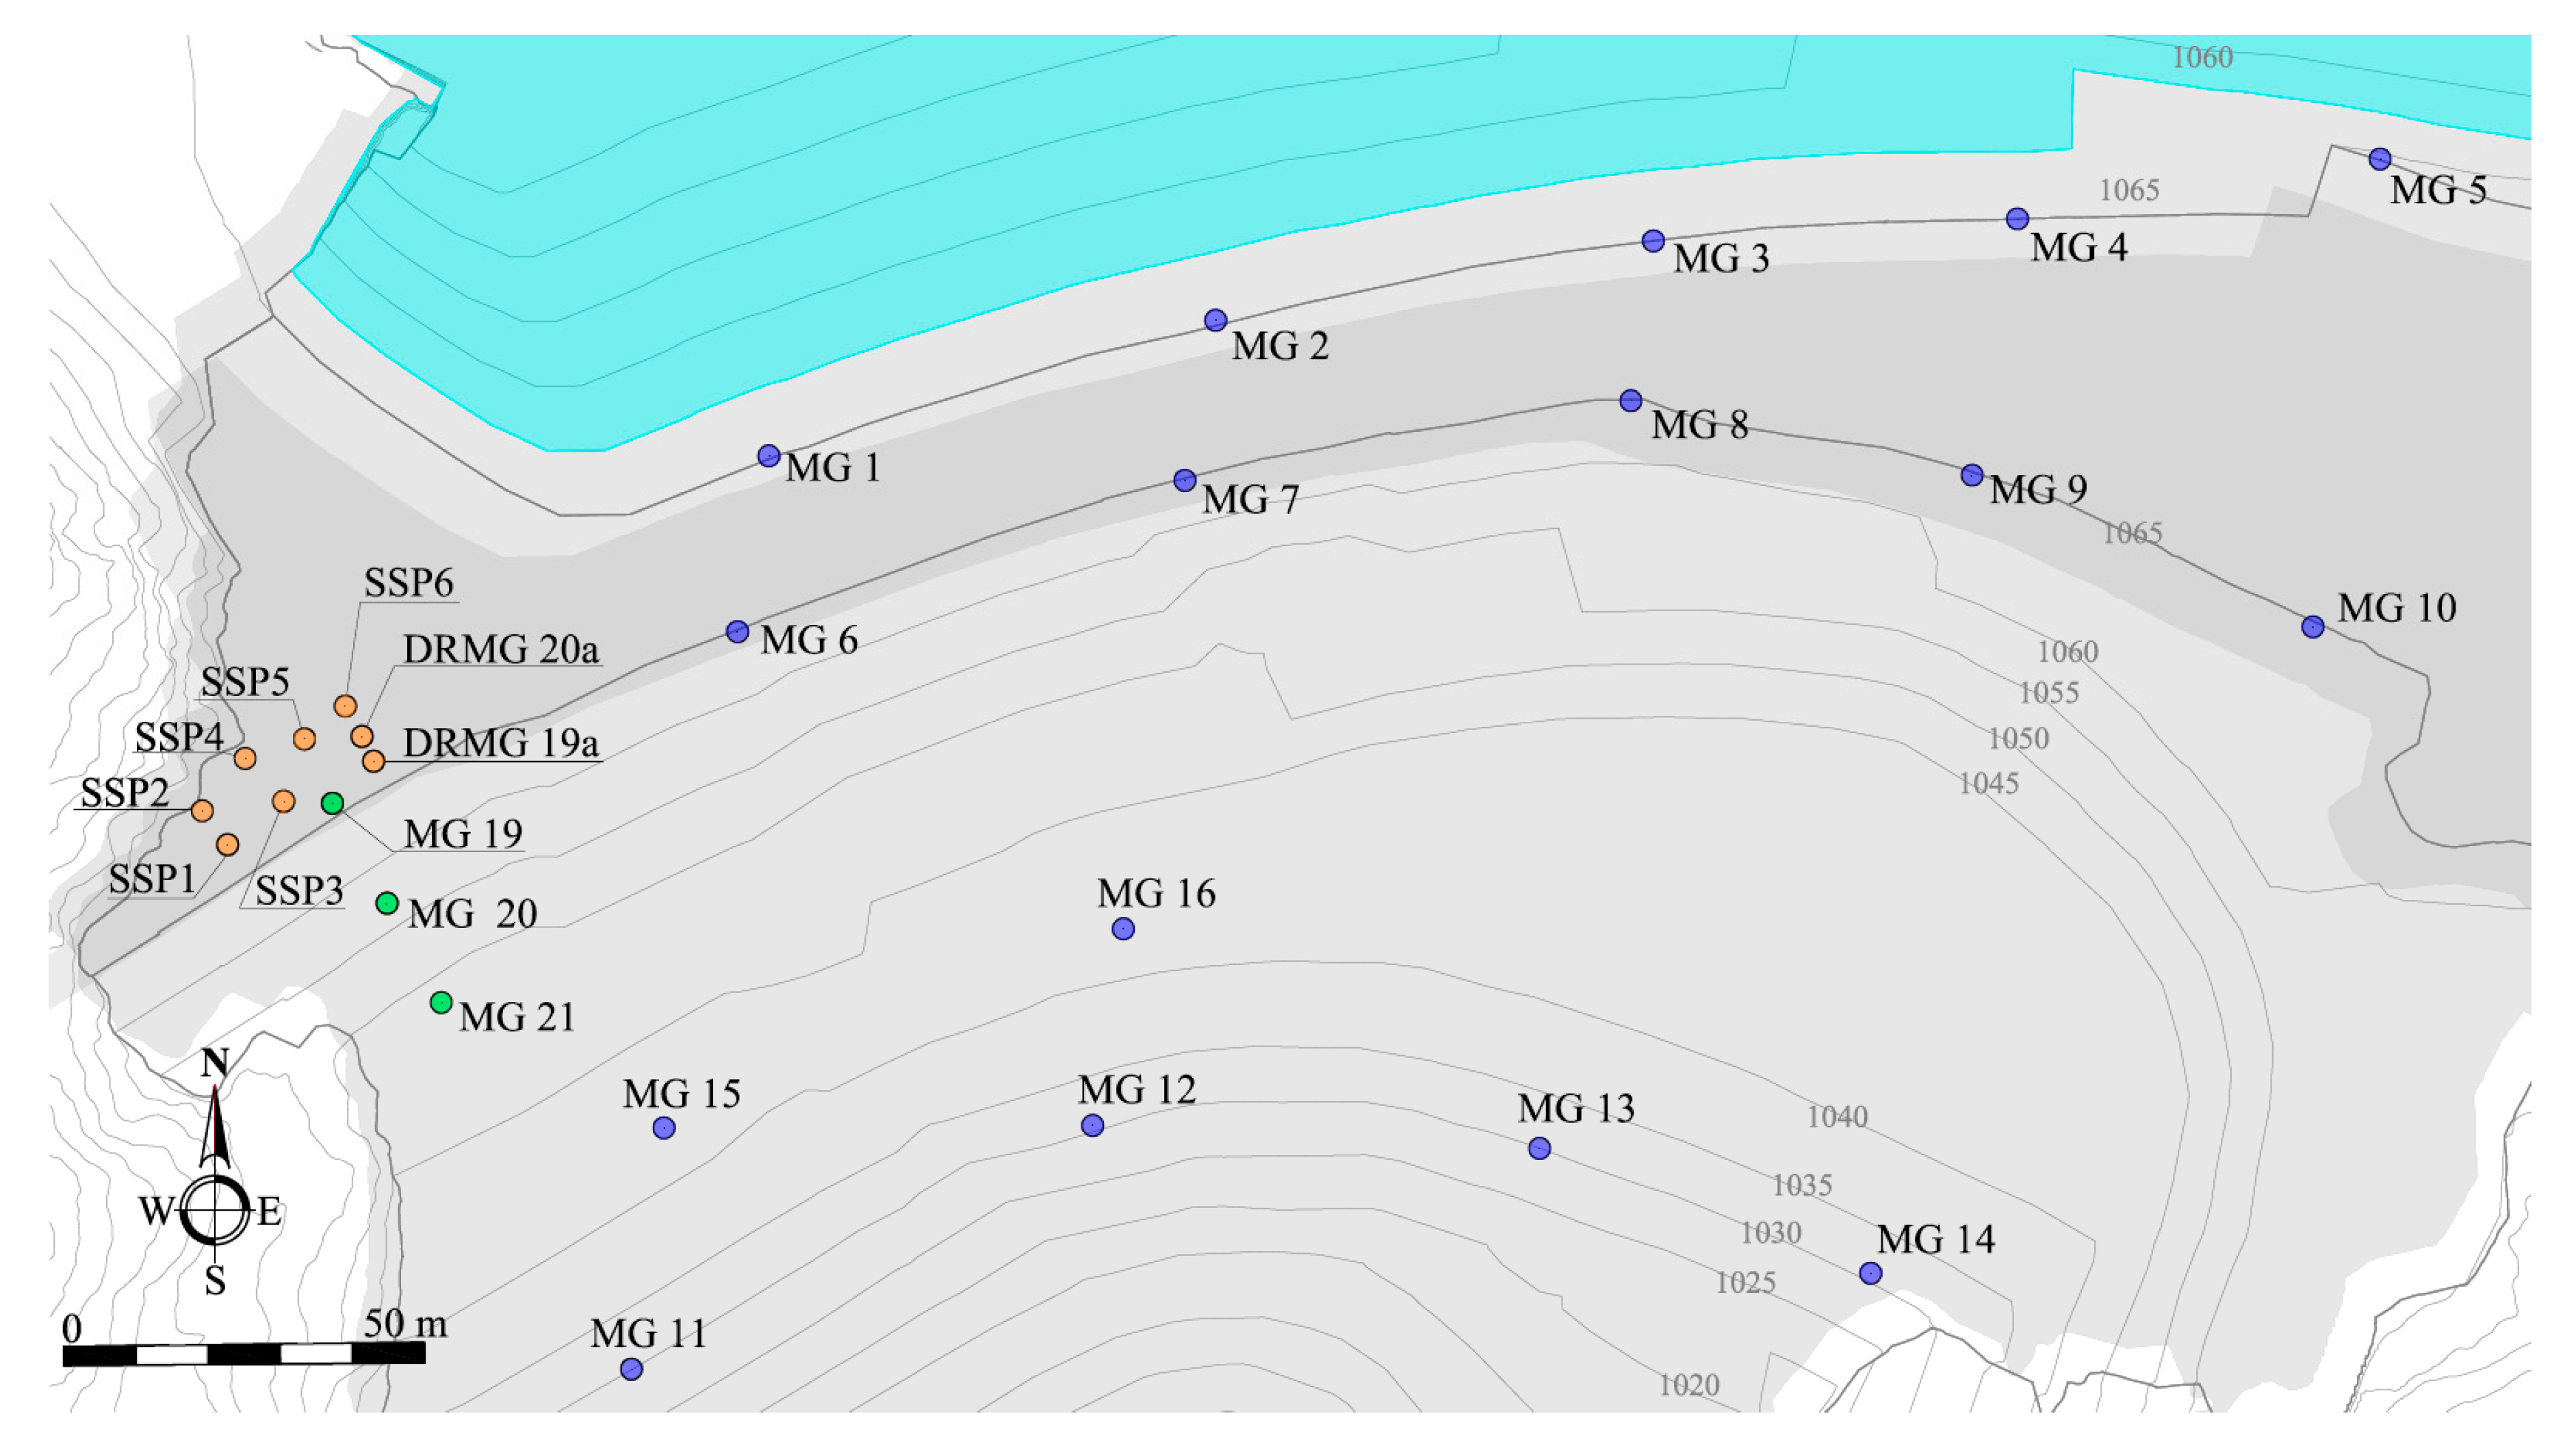
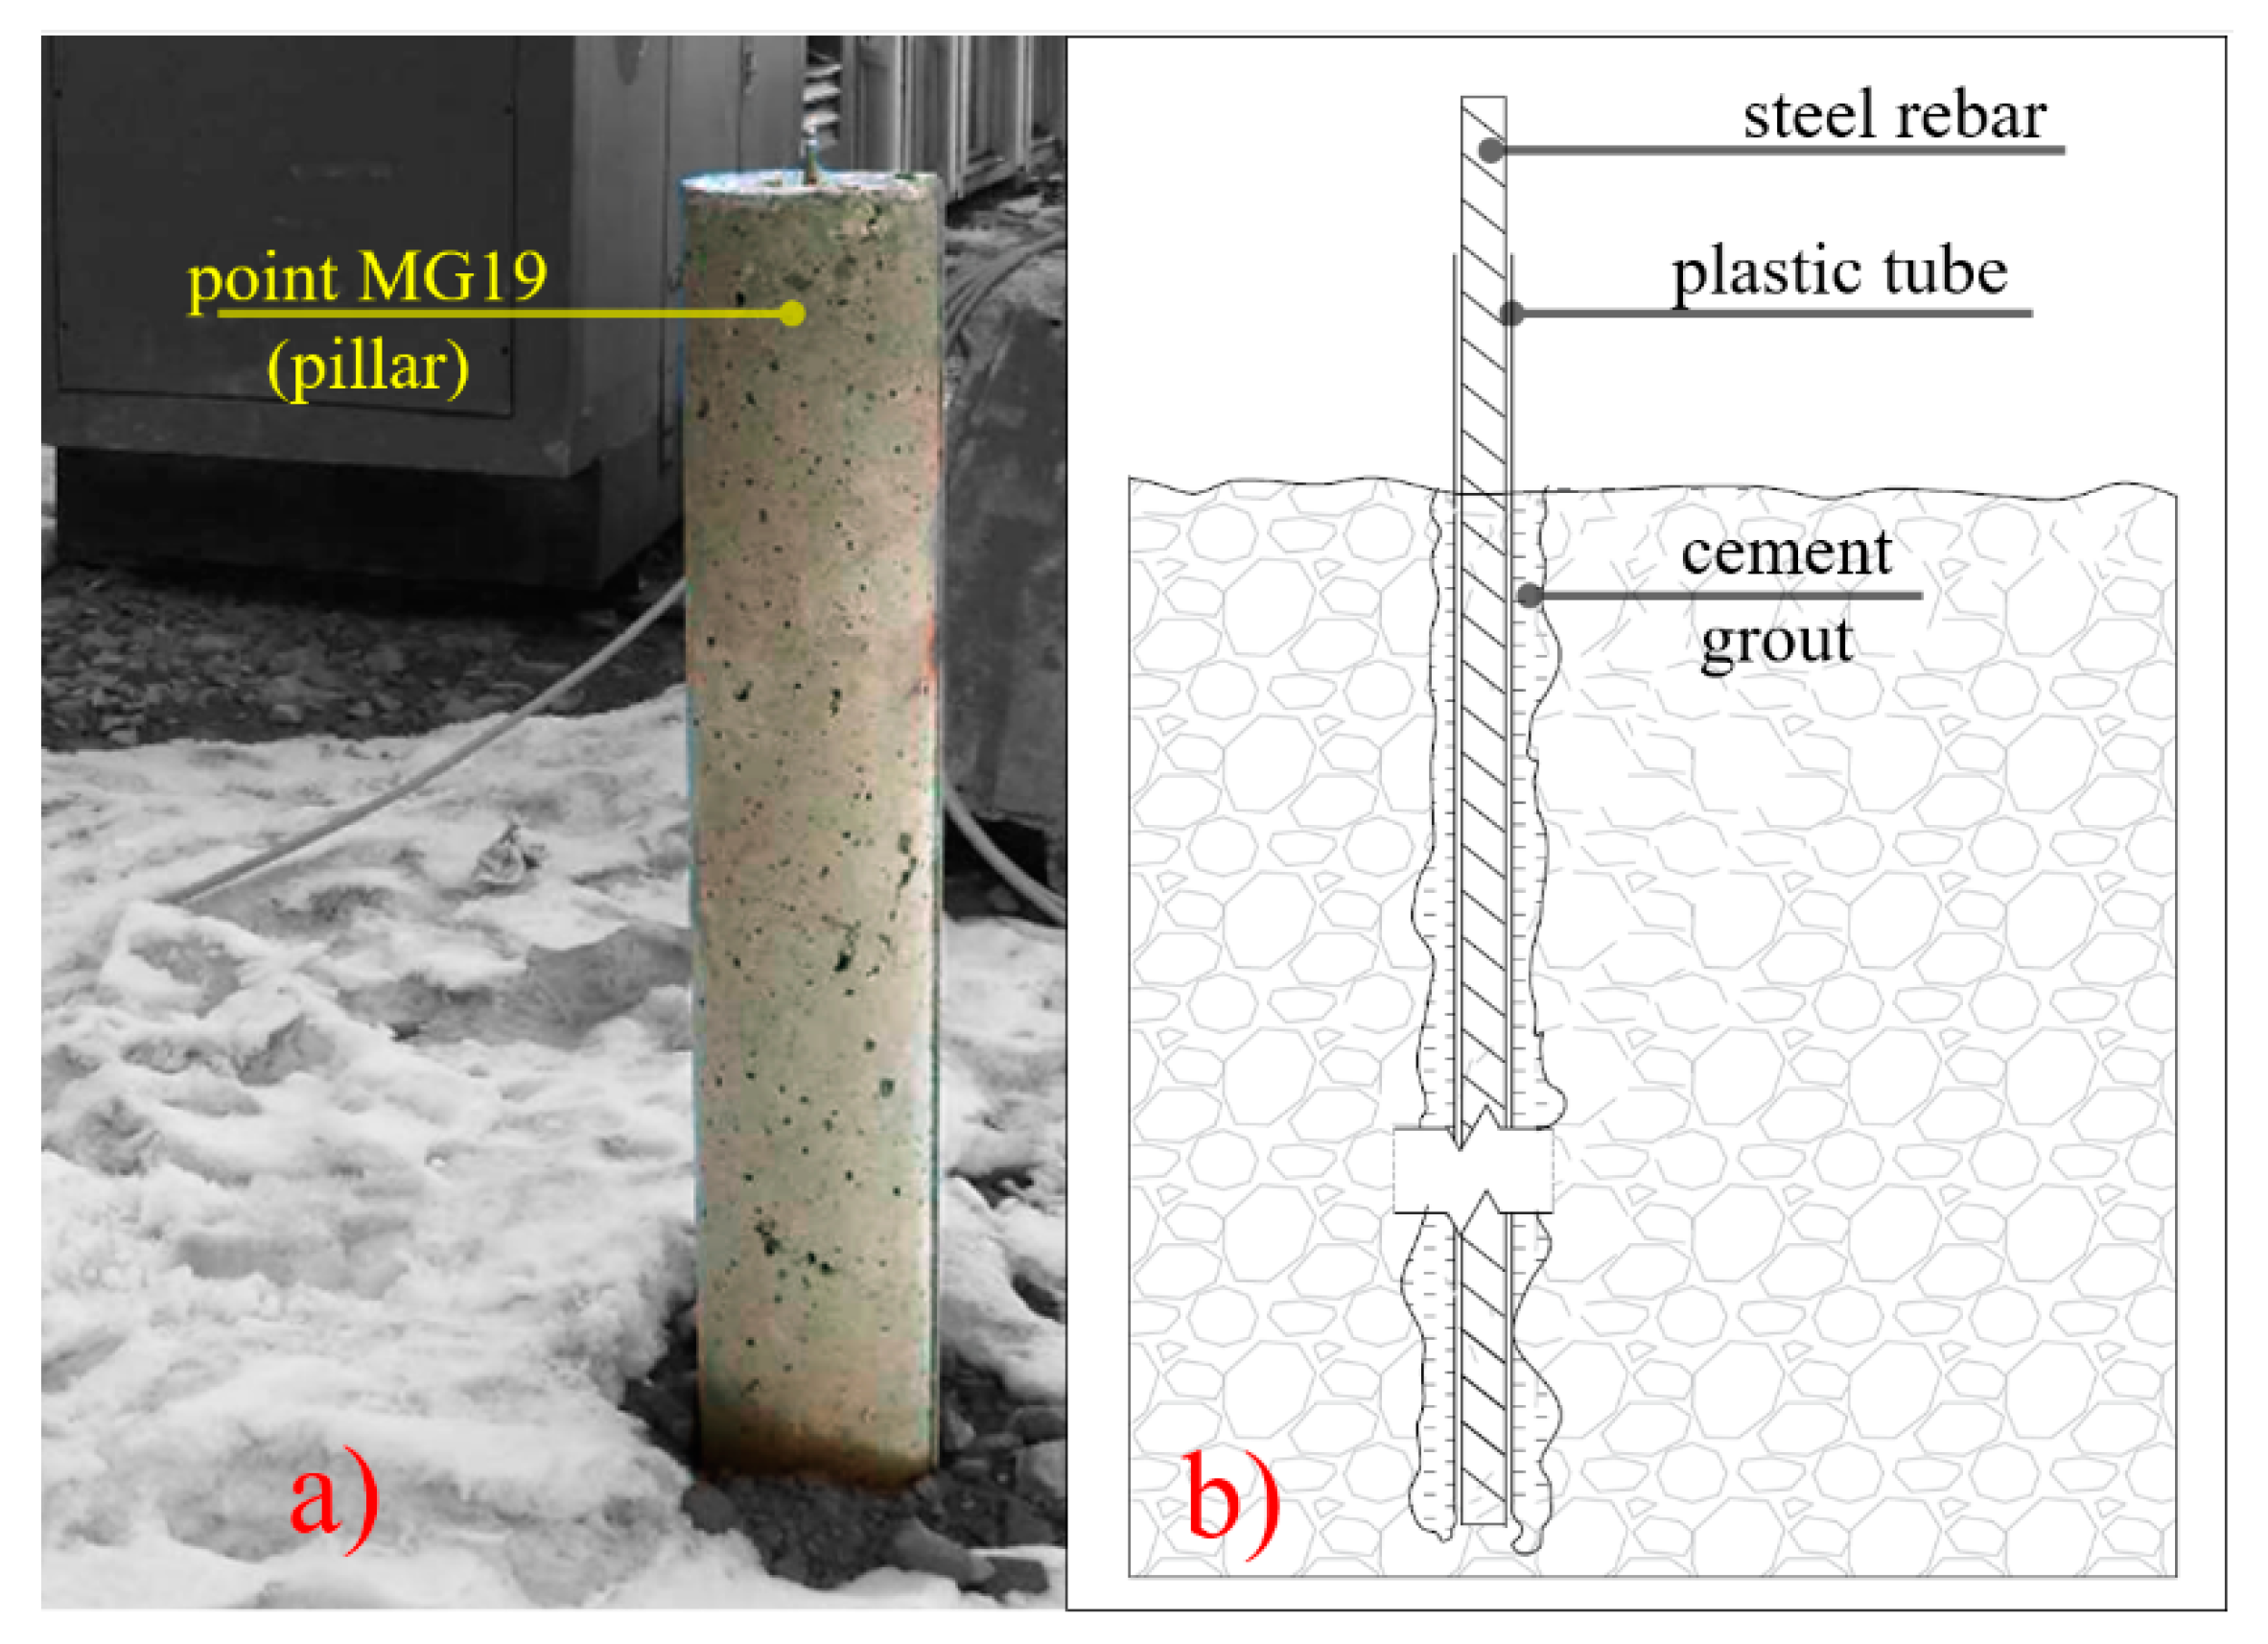
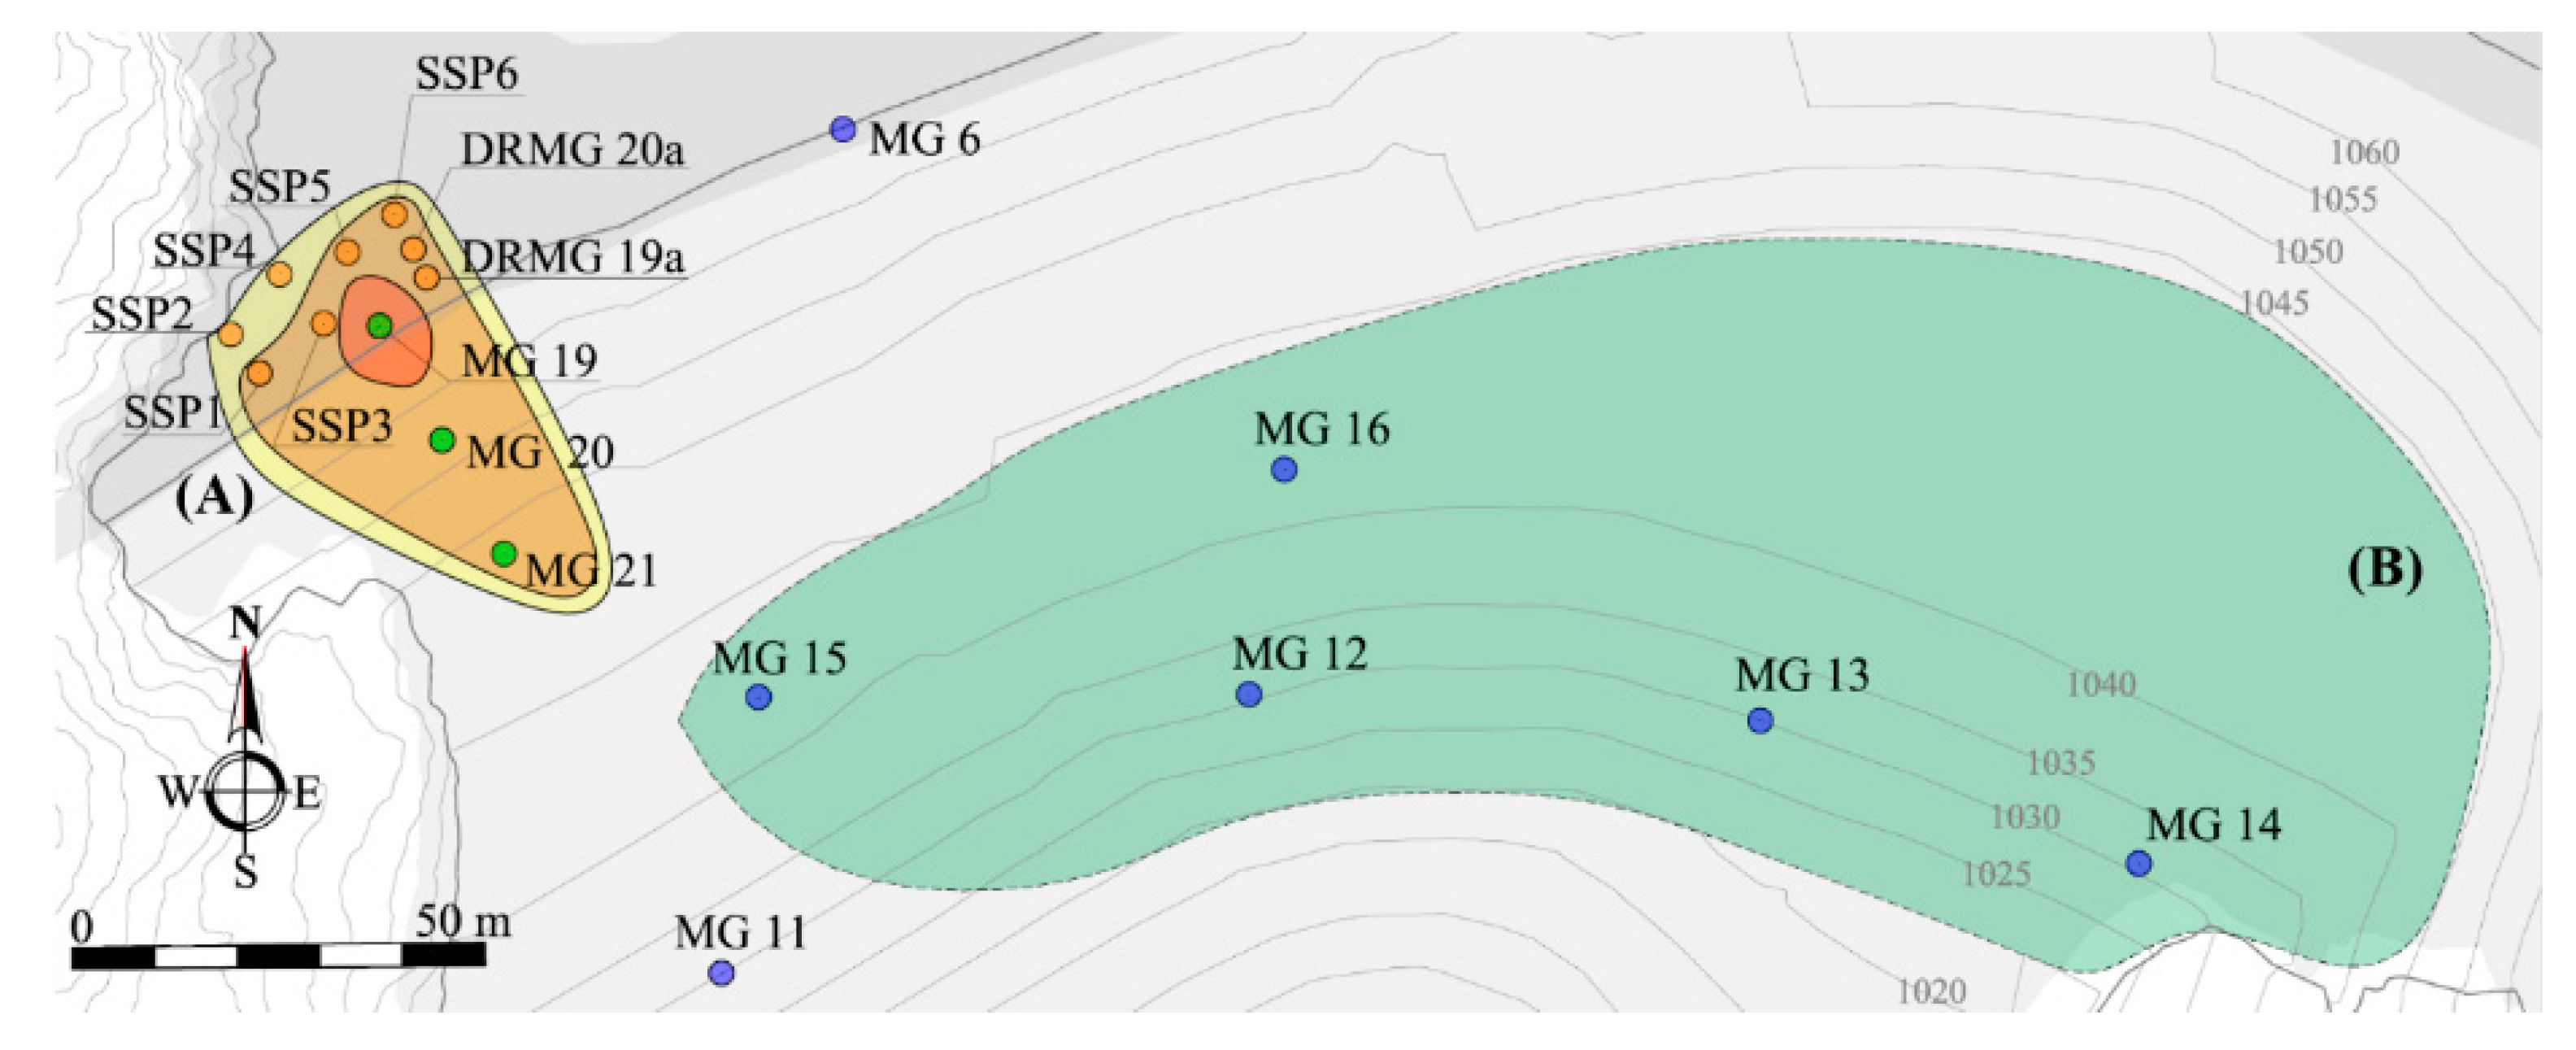
2.1. Monitoring Location and Strategy

The presented monitoring data was obtained by measuring vertical displacements (settlement) of twenty-six observational points as shown in Figure 1. Of 26 points, 20 were located along the crest cofferdam (points MG1-MG10, points SSP1 to SSP5, points MG19, DRMG19a and DRMG20a) and 6 on the cofferdam body (points MG11 to MG16). On Figure 1 it can be seen that points MG1–MG5 were established in the upper stream side of the crest, while points MG6–MG10 were established in the downstream side of crest. The reasons for this were the verification of crest settlement on both sides of the crest (overall crest) and to obtain enough data even if any of the points were to be destroyed during monitoring.
The stabilization of observation points MG1 to MG10 and MG19 was done with concrete round-shaped pillars, grounded on solid rock (Figure 2a). To enable the height of specific points to be increased where additional construction work was possible or to assess the depth extent of the settlement, points MG11 to MG16, SSP1 to SSP6, DRMG19a and DRMG20a were stabilized with a combination of steel rebar, plastic tube and cement grout (Figure 2b). These specific points were then taken altogether and anchored to a depth of about eight meters. All points were clearly defined with a metallic nail.
The initial set of observation points (colored blue in Figure 1) was used to monitor the settlement of crest and cofferdam body during the first reservoir filling. Points were placed at various altitudes to enable settlement magnitude investigations at different elevation levels of the cofferdam. The values of altitudes for each point at the time of the first and last measurement, when the first filling was finished, are given in Table 1. Based on the results of seepage investigations during first filling, a decision was made to stabilize the body of the cofferdam. This meant emptying the reservoir and raising specific existing points after additional construction works (area B in Figure 3). Unfortunately, monitoring of these areas was not possible at this stage. During the second filling, a depression appeared on the crest next to the western bank. From visual observations, the affected area seemed to be in the order of 100 m2, as shown in Figure 3 (area A). This led to an establishment of 10 new points (green and orange color in Figure 1 and Figure 3) with the intention to cover the western part of crest via intensive monitoring and providing better information on the extent of the depression.

2.2. Monitoring Data

In this chapter, geodetic monitoring data that was used for settlement analysis is presented. Monitoring of initial points was regularly conducted during the first filling from the end of August 2018 to October 2018 (Figure 4 and Figure 5).
When the cofferdam body was stabilized and additional construction work finished, the heights of points MG11 to MG16 were raised at the same position, and monitoring of all points (MG1–MG16) continued during the second and final filling (Figure 6 and Figure 7). Due to area stabilization (area B in Figure 3), the altitudes of the raised points were greater than their initial ones (Table 2). For better visualization of time-dependent settlement, graphs on Figure 7 are relative to the points’ initial altitudes from 1st filling.
Points MG19 to MG21 were monitored during second filling from 02/02/2019 to 14/04/2019, as well as some time after the last measurements on 19/05/2019 (Figure 8). While points DRMG19a, DRMG20a and SSP1 to SSP6 were monitored from roughly the same initial time (04/02/2019, 06/02/2019), monitoring ended on 21/03/2018 (Figure 9 and Figure 10).
When additional construction works were carried out, some points had to be destroyed before the reservoir was filled. DRMG20a, SSP5, and SSP6 were destroyed on 13/02/2019 (Figure 9 and Figure 10), while monitoring of points DRMG19 and points SSP1 to SSP4 continued until 21/03/2019. Afterwards, they were destroyed during the final stabilization. To examine further settlement in this area, points MG19 to MG21 were observed until the time of the last measurement on 19/05/2019 (Figure 8).
The height values of the mentioned points, at the beginning and end of monitoring, are respectively given in Table 3.
Settlement data of points MG1 to MG19, obtained during the second filling of the reservoir, were used in the analysis to determine the appropriate model and approach for future monitoring adjustments.

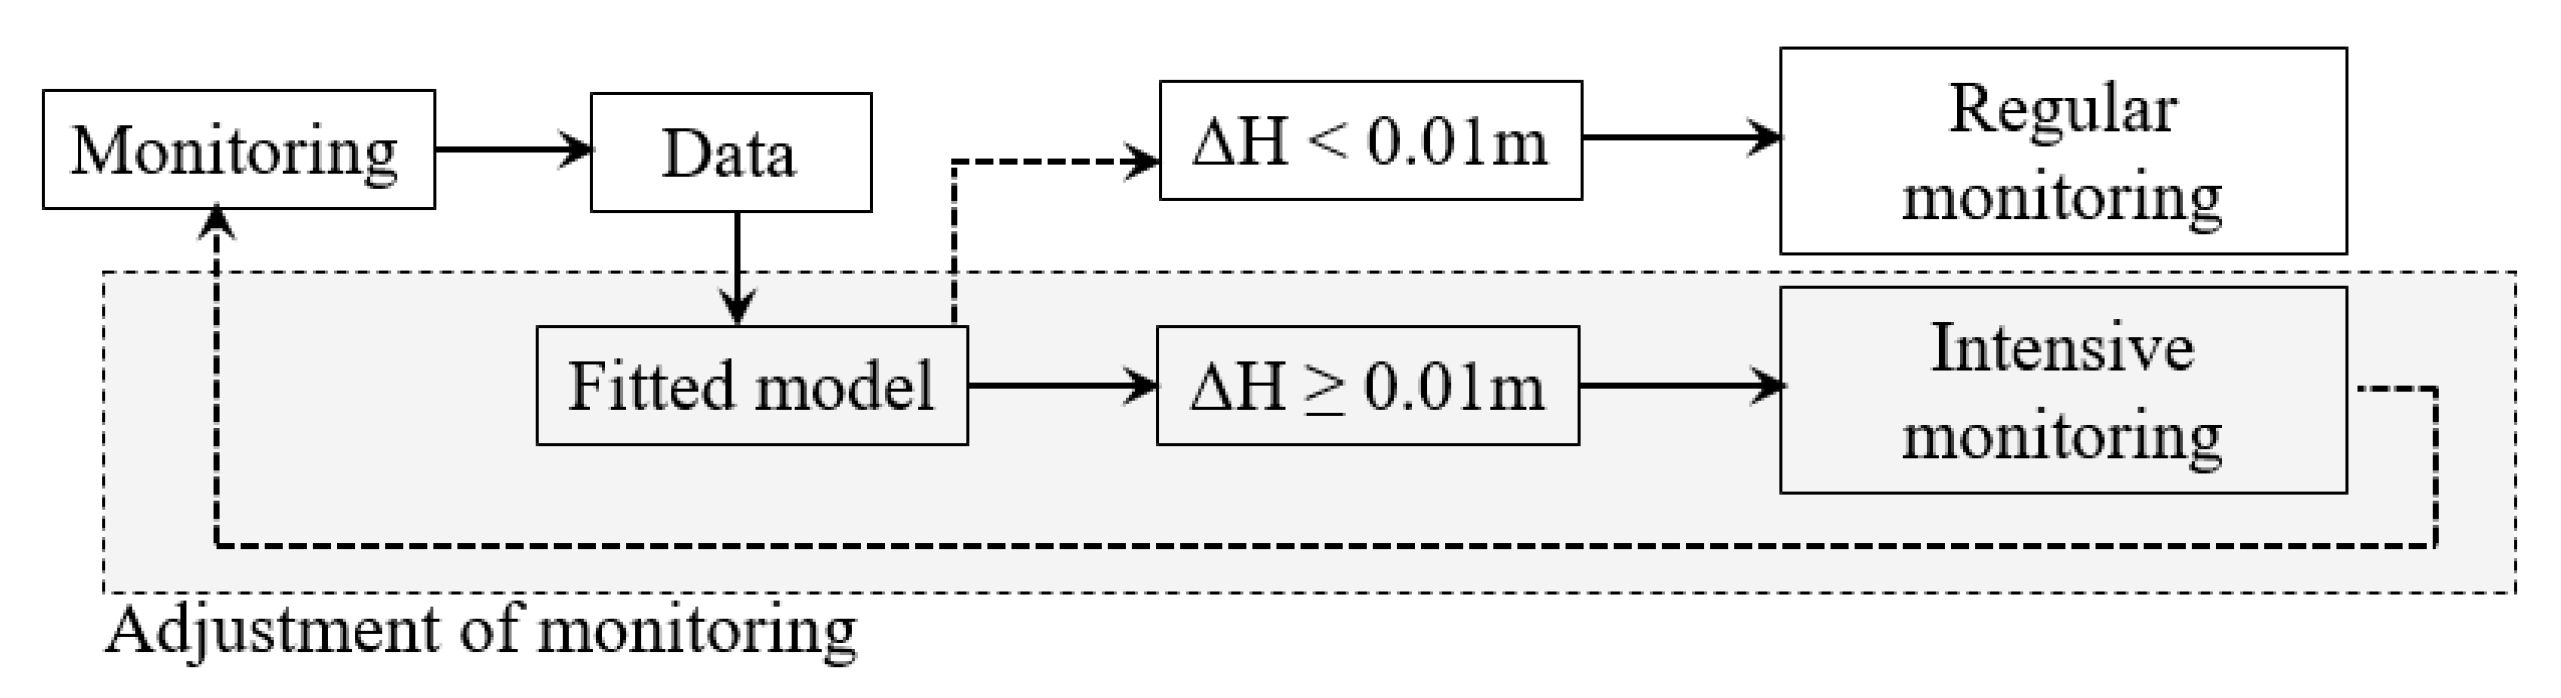
2.3. FNSE Model and Monitoring Adjustment

In a number of case studies, the graphical presentation of the crest settlement versus time is reflected in an ‘S’-shaped behavior [9]. A model that gives the best fit to the symmetrically distributed nonlinear data had to be chosen. Based on preliminary research on the complexity of fitting the model to obtained data, the FNSE model is the model with the greatest ‘simplicity’ and therefore the most practical choice for further monitoring adjustment. The four-parameter FNSE model is given by [28]:
F N S E = f ( t ) = a + b a 2 ( 1 + t p s ( t p s ) 2 ) ,
where a is the ordinate value of left asymptote and b is the ordinate value of right asymptote. Multiplying the function values by (a + b)/2 enables scaling of the curve along the ordinate, while scaling of the abscissa axis is achieved by variations of parameter s. The point of influence on the abscissa is defined with parameter p.
Using the obtained data of points MG1 to MG19 during second reservoir filling, from 04/01/2019 to 14/04/2019, the FNSE model was fitted with nonlinear least-squares regression [29]. Comparing the fitted model to the actual data and the statistical results (standard deviation for each parameter estimate, error variance and coefficient of determination) showed that the FNSE model is acceptable for monitoring adjustment and future settlement prediction.
The concept of monitoring adjustment is the use of the FNSE model in combination with a decision algorithm, as shown in Figure 11. When the model reaches a stationary state, settlement is ceasing and approaching its right (lower) asymptote b or final value (Equation (1)). Further settlement will be negligible, and monitoring can proceed in a regular fashion. If equilibrium is not reached, the settlement is active, and more intensive monitoring is needed.
Settlement is defined as active until the ordinate change (ΔH), within the time period of two measurements, is less than the determined degree of tolerance (0.01 m). Intensive monitoring is needed within the time when the absolute change of the ordinate value is greater than or equal to the determined tolerance. After the time of intensive monitoring, the obtained data is included in the refitting of the FNSE model and monitoring is readjusted.

3. Results and Discussion

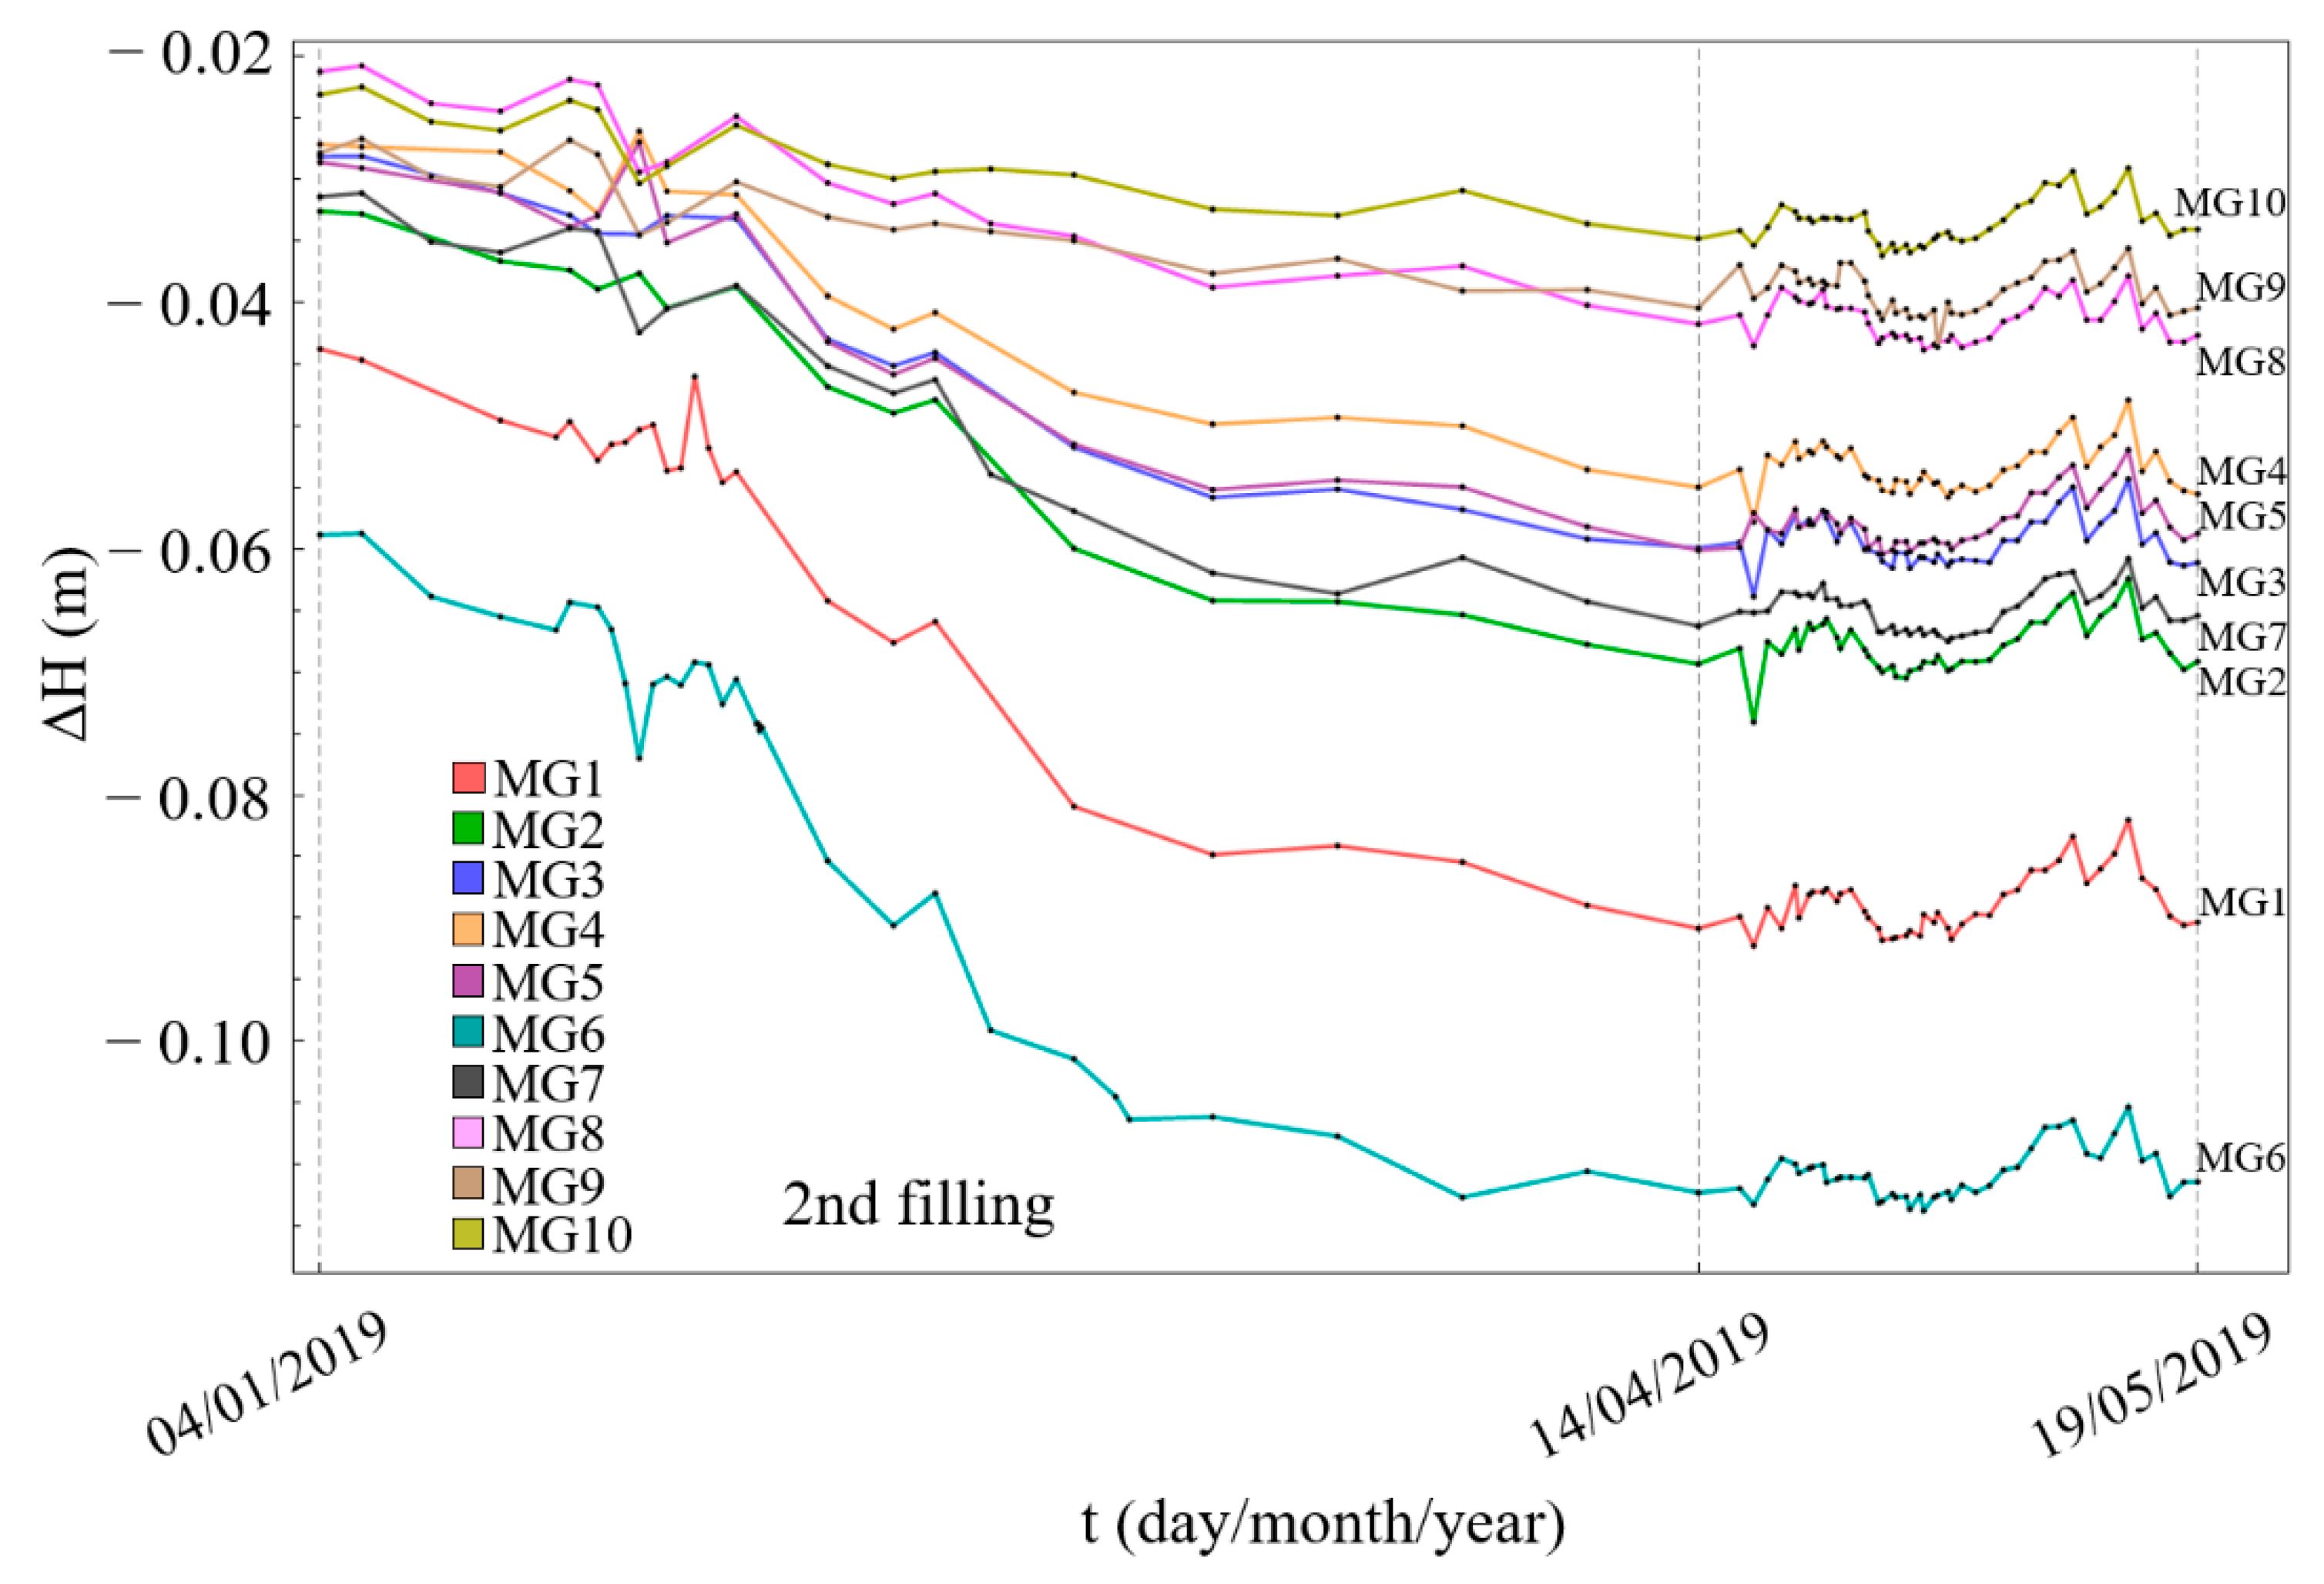
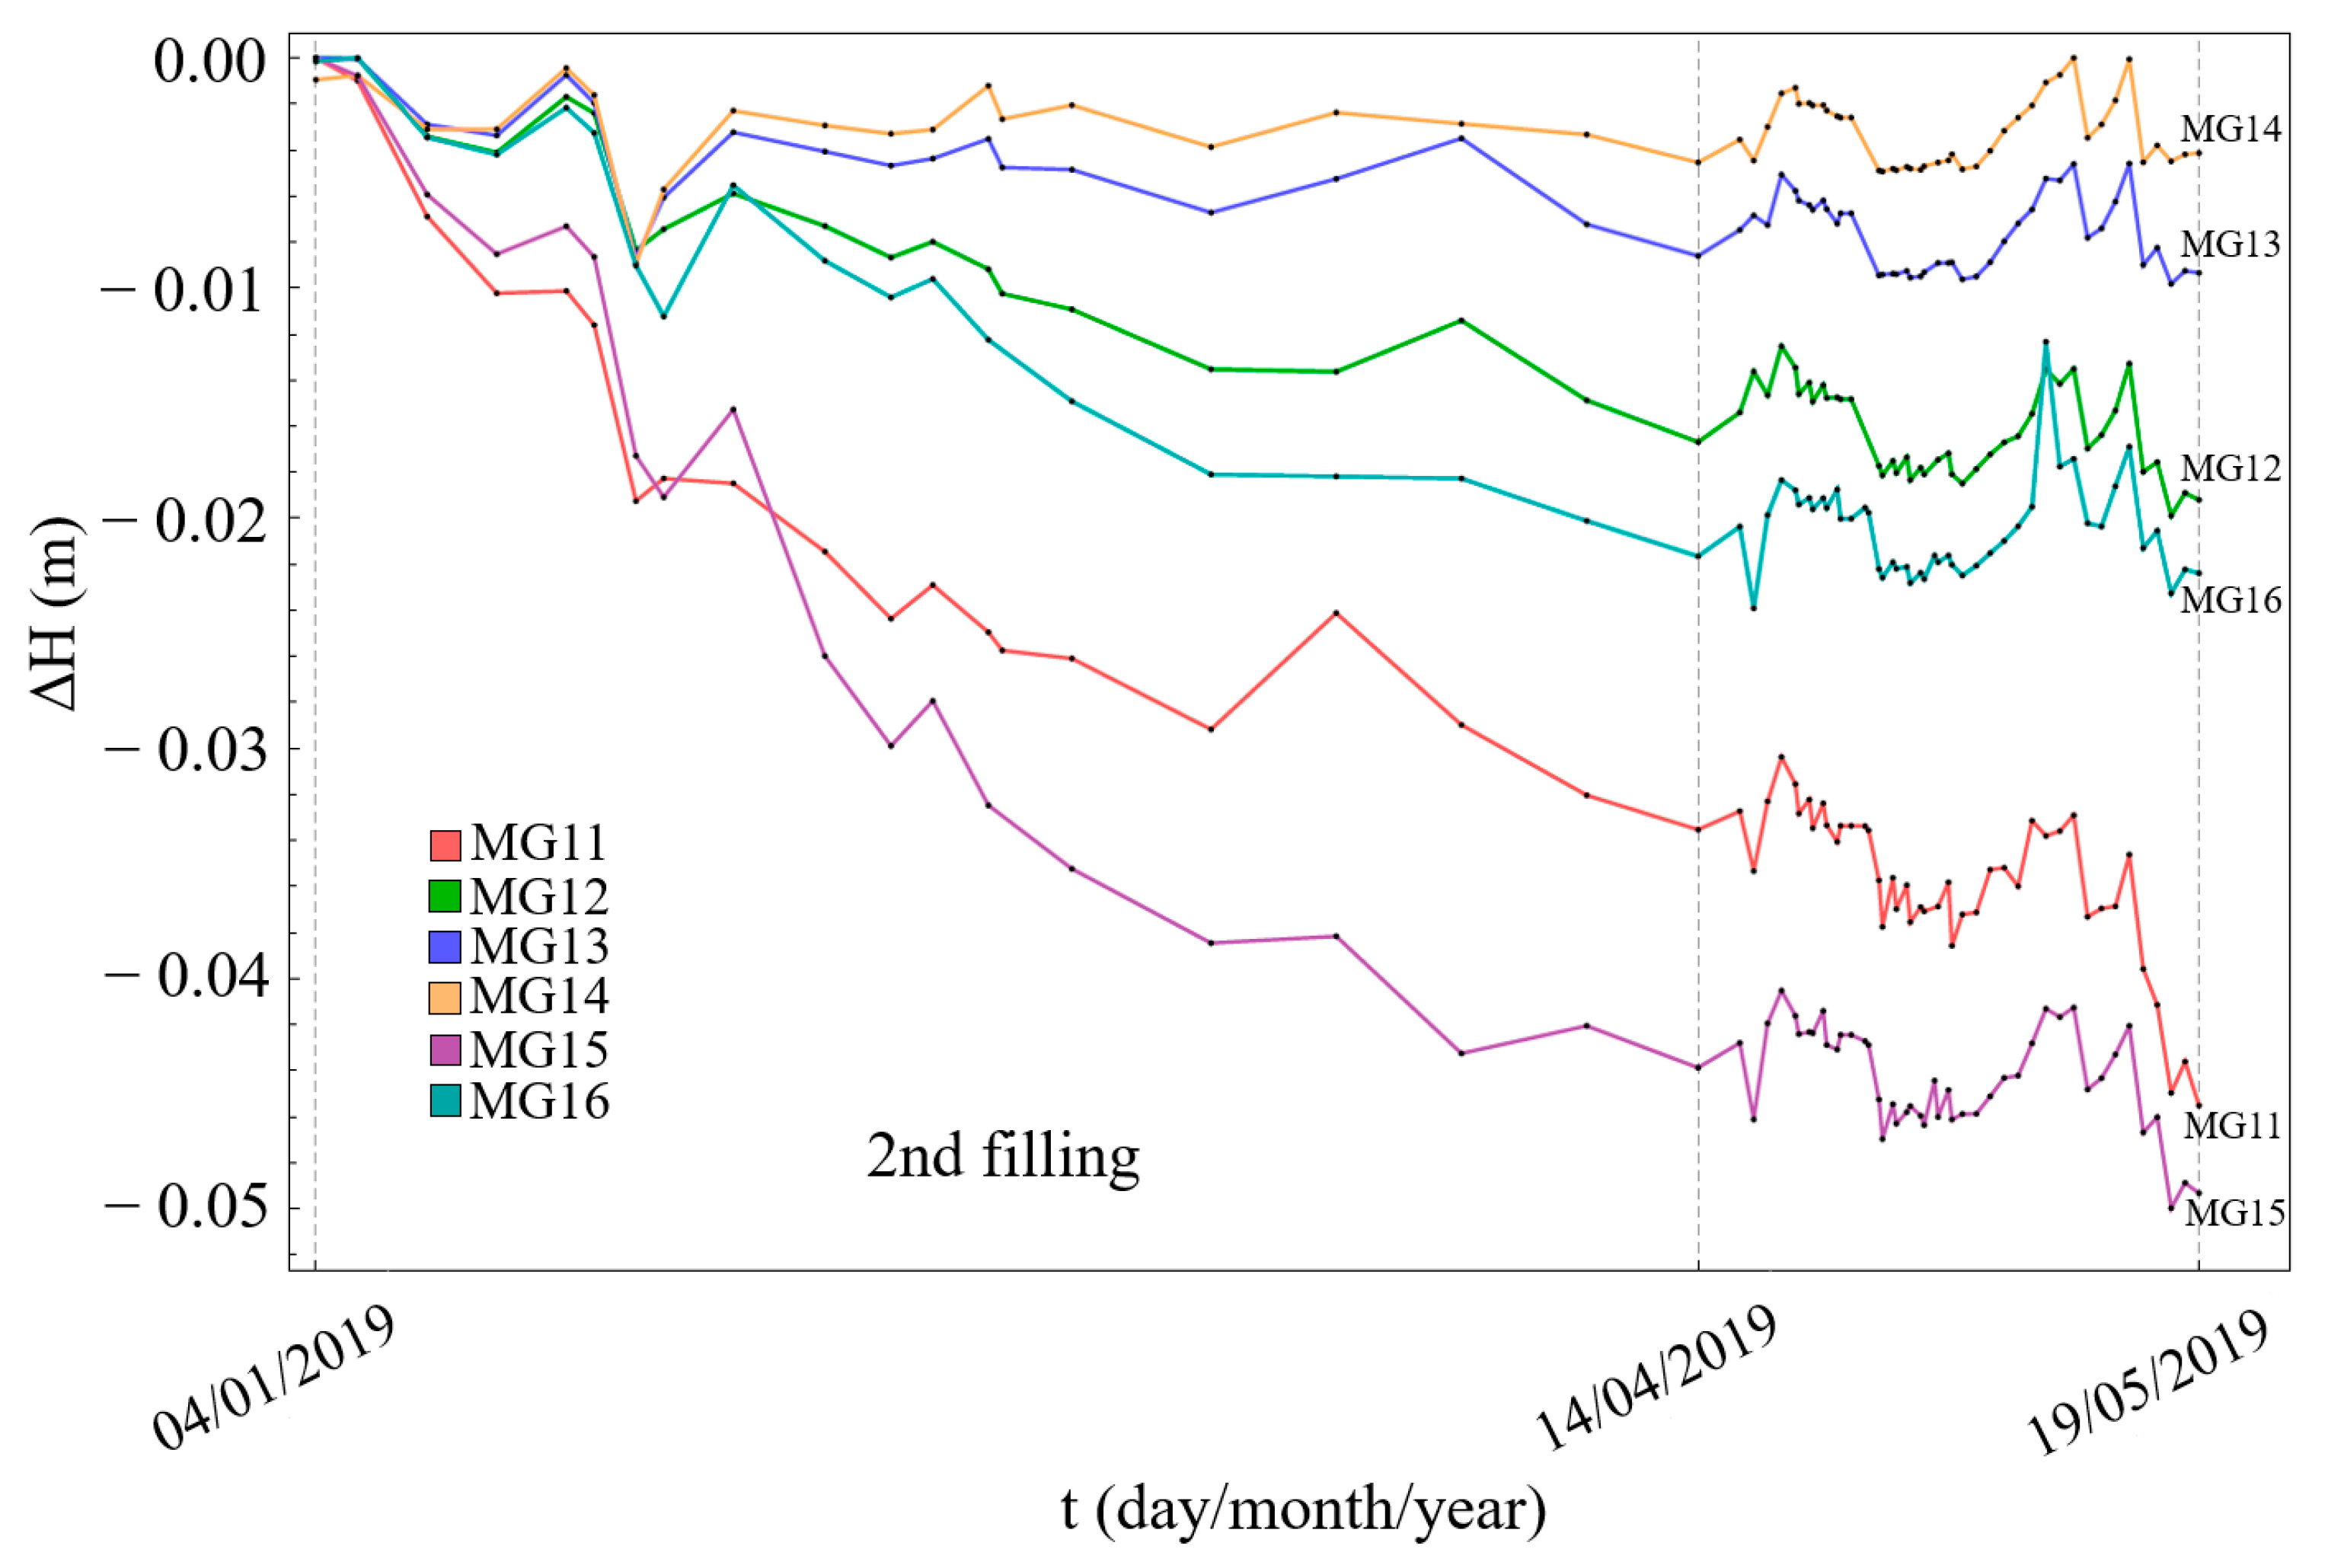
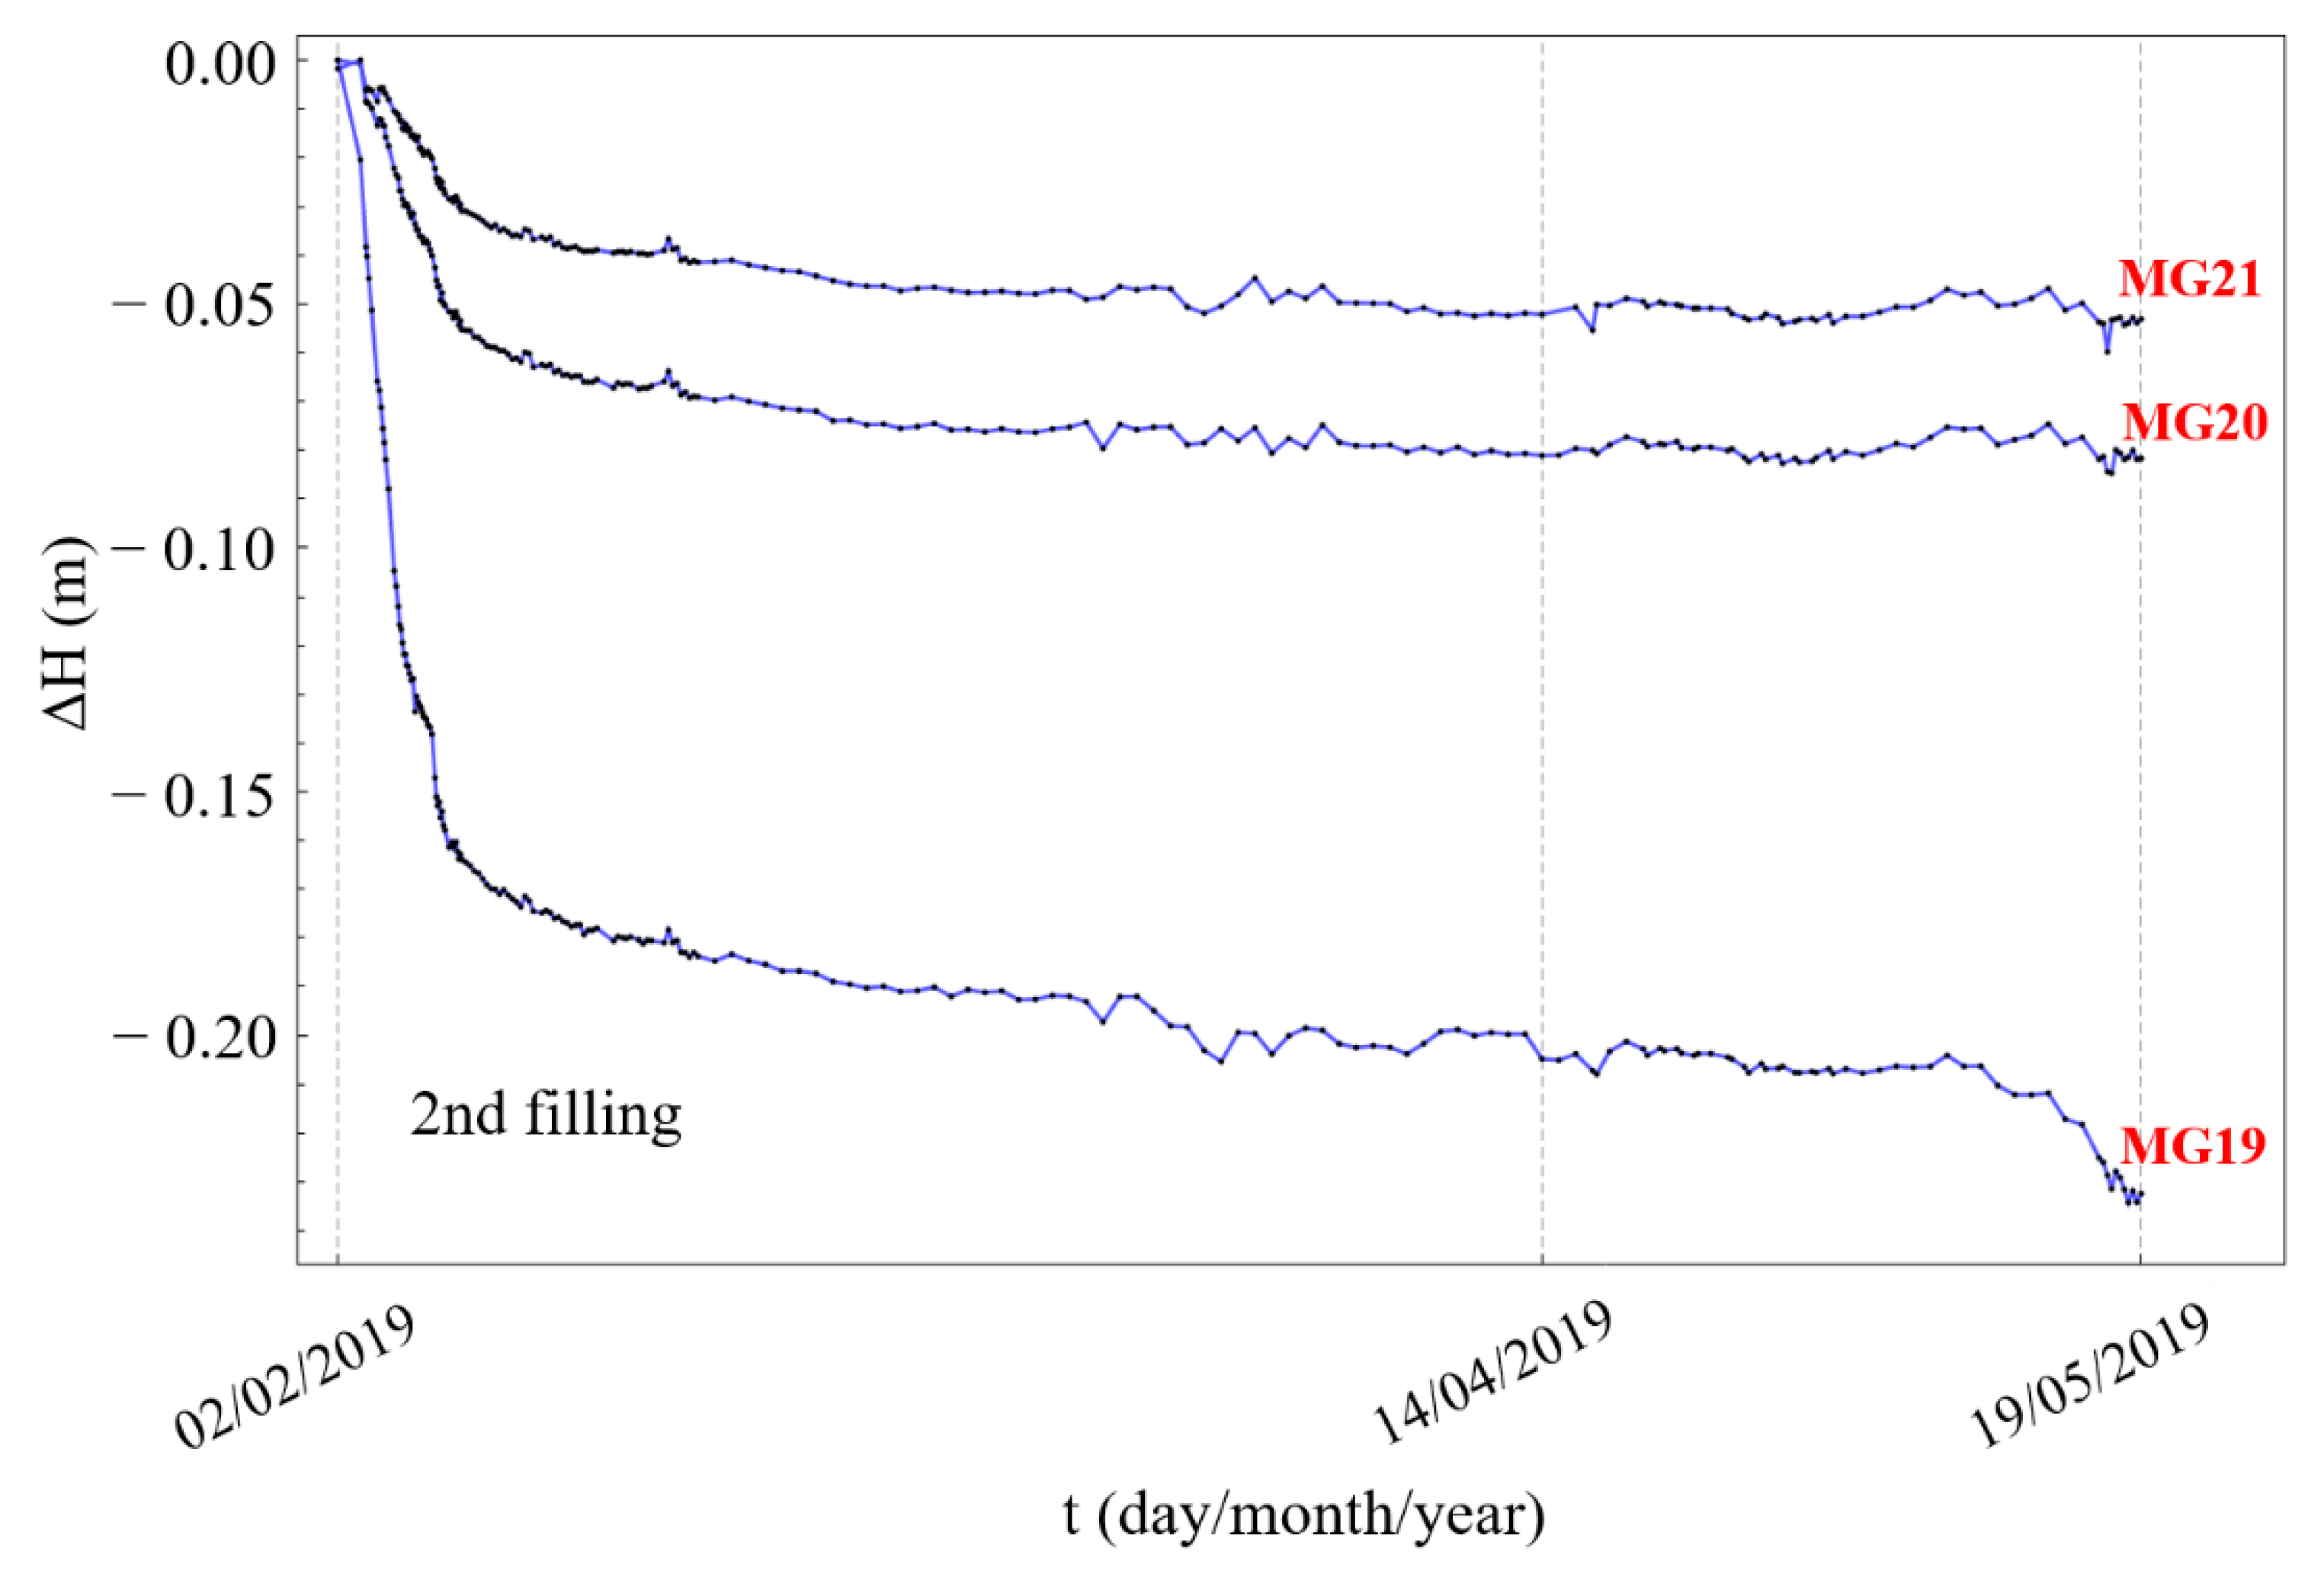
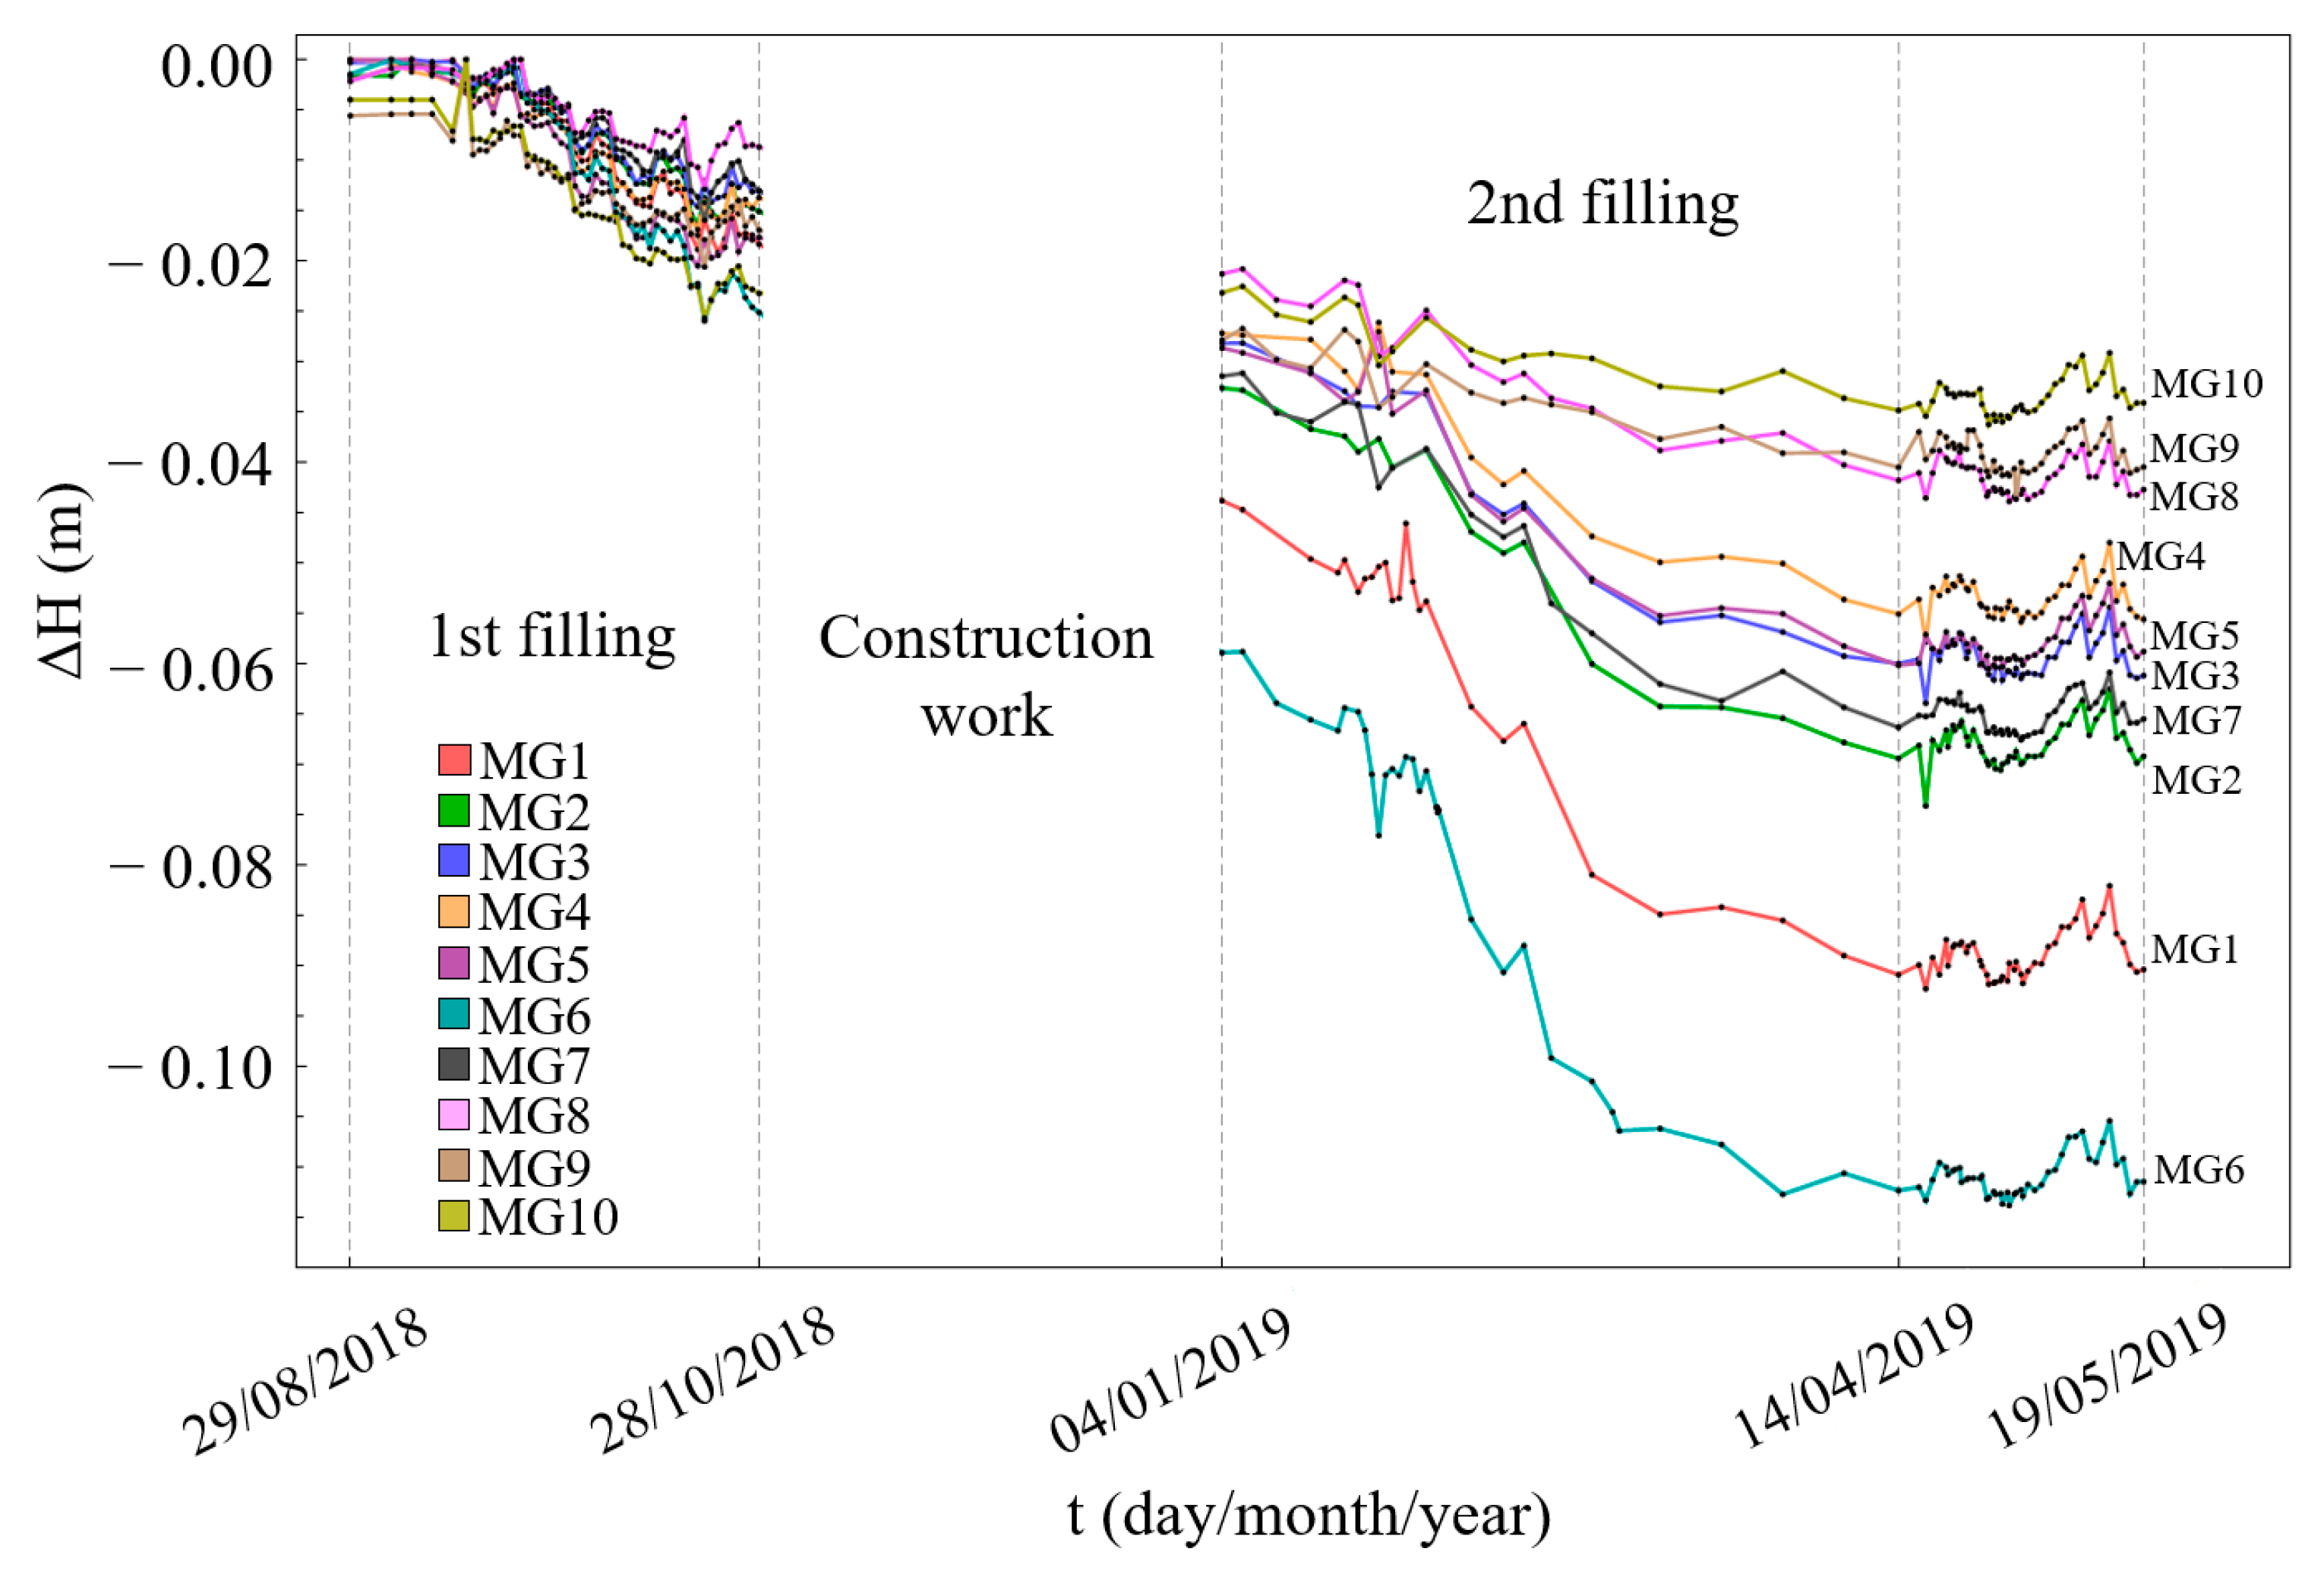
3.1. Monitoring Results and Analysis

In this paper, ten points were selected to show the typical crest settlement characteristics, including the occurred settlement during the first and after the second filling of the reservoir (Figure 12). Although missing data (construction work), we get an insight that this data behaved in a nonlinear fashion, approaching the right asymptote or settlement final value. This is especially noticeable after 04/01/2019, where the settlement occurs during second filling. Based on visual confirmation of the data trend, the FNSE model was initially fitted to the data from the 1st reservoir filling to verify the model’s applicability, and then to the data from the 2nd filling to predict future settlement and adjust the monitoring scheme.
The results of fitting the FNSE model to the obtained settlement data of the represented points (Figure 12) are shown in Figure 13 and Figure 14. It can be seen that the model (curve) is close to the actual data. Accuracy of each model was evaluated to confirm the fit. As shown for point MG19 of Figure 15, the model describes the data agreeably, so R2 is high (close to value 1) and variance is small (close to zero). Therefore, fitting accuracy was acceptable and FNSE was used for monitoring adjustment.
Standard deviations of estimated parameters, variance, and coefficient of determination were used to evaluate the accuracy of the fitted model to the monitoring data. This is shown for point MG19 in Figure 15, where the model was fitted to obtained data during second filling. Estimated parameter values are a → 0.0553, b → −0.1801, s → 3.2790, p → 3.2790, and their standard deviations 0.0081, 0.0012, 0.1158 and 0.1124. The calculated variance and coefficient of determination are 12.2437 × 10⁻⁶ and 0.9994. Visualization of the uncertainty of the fitted model was done with confidence intervals to show actual values that lie within one (blue color, μ ± σ) and three standard deviations (green color, μ ± 3σ) of the mean.

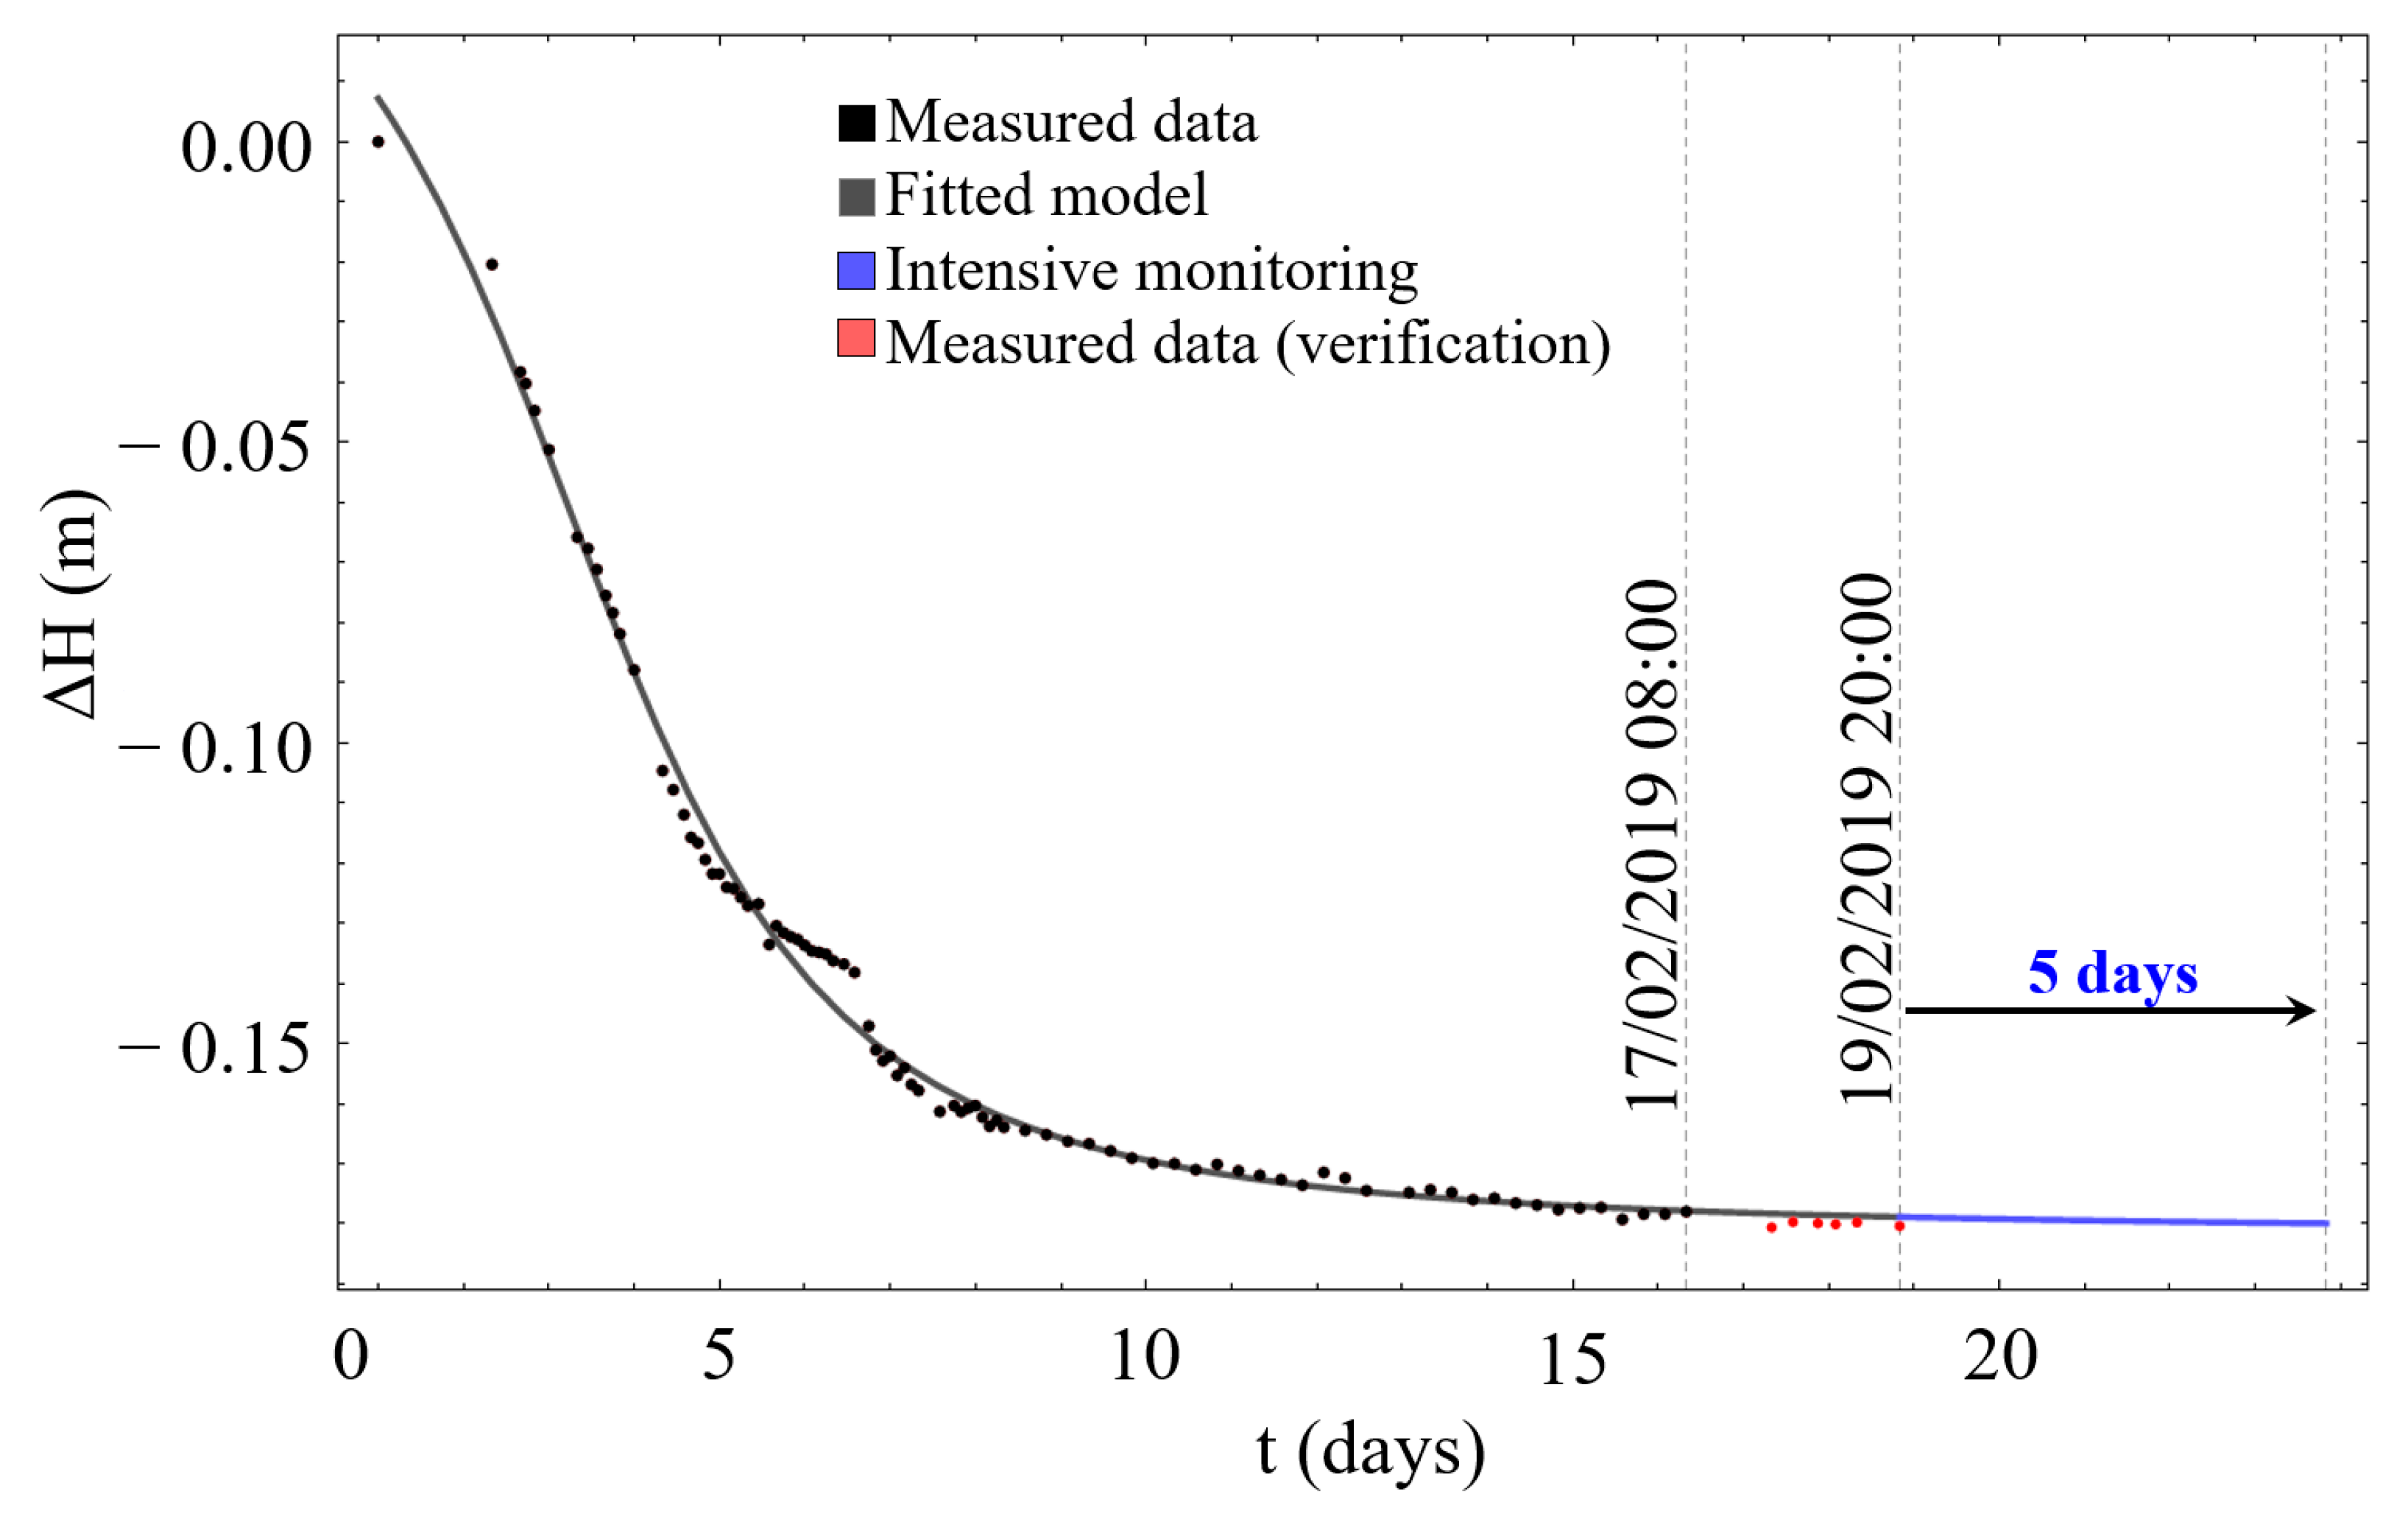
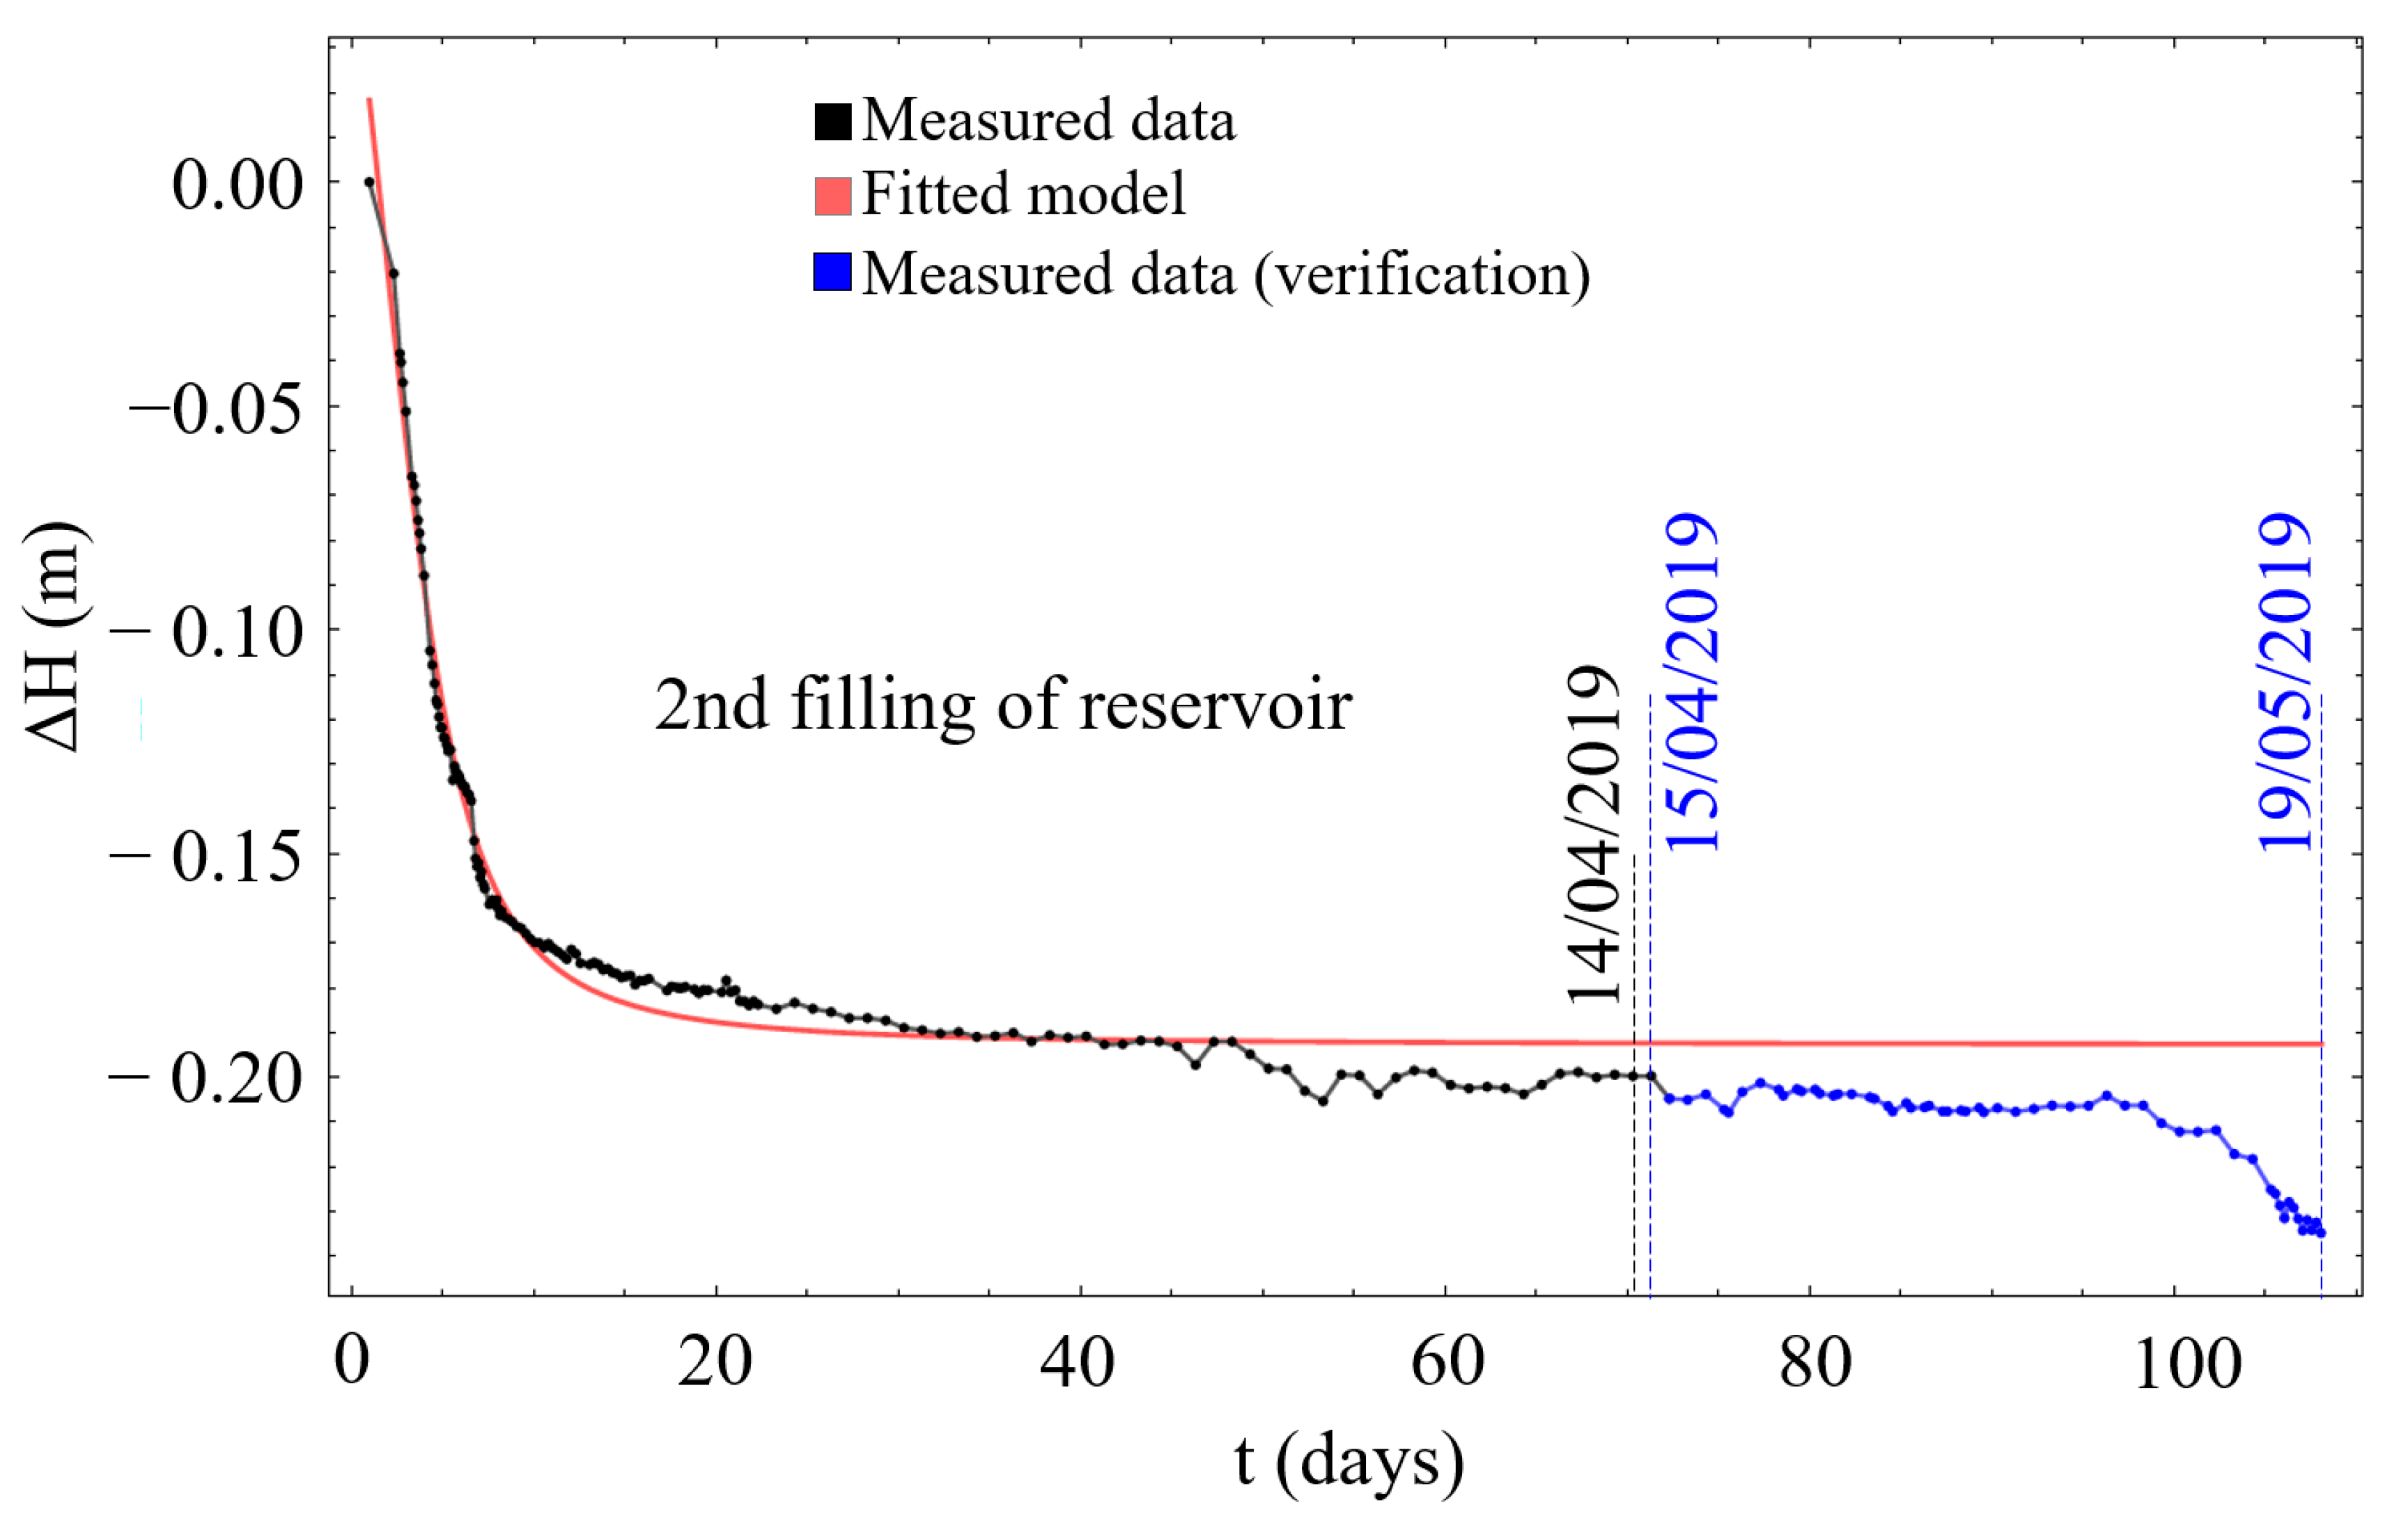
3.2. Monitoring Adjustment and Settlement Prediction

In this section, point MG19 was chosen to present the results of monitoring adjustment based on the obtained settlement data from 02/02/2019 to 14/02/2012 and the fitted FNSE model. Below, three monitoring adjustments for point MG19 are shown on Figure 16, Figure 17 and Figure 18. Adjustment was implemented constantly during monitoring, and the final fitted FNSE model was used for future settlement prediction (Figure 19).
In the first stage of monitoring, adjustment of point MG19 indicates that intense monitoring is required in the next 48 hours (2 days) from last measurement on 14/02/2019 at 20:00, as shown on Figure 16. This was applied to the monitoring scheme, and six measurements were conducted in the required timeline, including the last observation on 17/02/2002 at 08:00. With newly-obtained data, the model was refitted and the monitoring adjustment was restarted. The second adjustment, as shown in Figure 17, results in a 72-hour intense monitoring scheme. Again, six measurements were conducted over the next 3 days until 19/08/2019 at 20:00. Figure 18 shows the last demonstrated adjustment on the basis of which it was necessary to conduct 5-day intensive monitoring. Adjustment of the monitoring scheme was continuously implemented during the entire process of the second reservoir filling.
Monitoring adjustment was done until the end of the second reservoir filling, and then the final fitted model accuracy was again evaluated, as shown in Figure 19. Estimated parameter values are a → 0.1486, b → −0.1925, s → 4.4234, p → 2.0066, and their standard deviations 0.0247, 0.0008, 0.1263 and 0.2957. The calculated variance and coefficient of determination are 33.0499 × 10⁻⁶ and 0.9988. Future settlement prediction for point MG19 is shown in Figure 20. With the fitted FNSE model (color red) prediction of future settlement was made until 19/05/2019, and the estimated values were verified with actual settlement values (color blue).
The final fitted model accuracy for point MG19 was evaluated as shown in Figure 19. As fitting accuracy was acceptable, future settlement values were predicted until the end of monitoring on day 19/05/2019. On the basis of this prediction, the settlement value of point MG19 was estimated on day 17/04/2019 as −0.19216 m and on day 19/05/2019 as −0.19233 m, while the actual measured values were −0.20506 m and −0.23245 m. Comparing the two values gives a 93.71% and 82.47% match; meanwhile, comparing all measured values with the predicted ones showed a 90.96% compatibility.
The presented adjustment approach with the FNSE model contributes to a more efficient surface monitoring of high-risk structures such as the considered rock-fill cofferdam, enabling the estimation of future settlement development and determining the intensity of monitoring. With an insight of settlement dynamics, new opportunities for additional research open. Further development of the FNSE must include splitting of data to illustrate the cascading behavior of the settlement, resulting from the construction works and other interventions while observations are conducted.

4. Conclusions

This paper presents an analysis of settlement data, obtained from monitoring the rock-fill cofferdam crest. For analysis, twenty-six observational points were used, and the focus was on point MG19. Monitoring times of observational points differ since additional construction work was required. Based on the obtained data, the settlement of the crest was interpreted with a mathematical model, one with an ‘S’-shaped behavior. Using a simple decision algorithm and an appropriate model, it was possible to approximate the process of settlement and plan future measurements.
The following conclusions can be made:
(i)
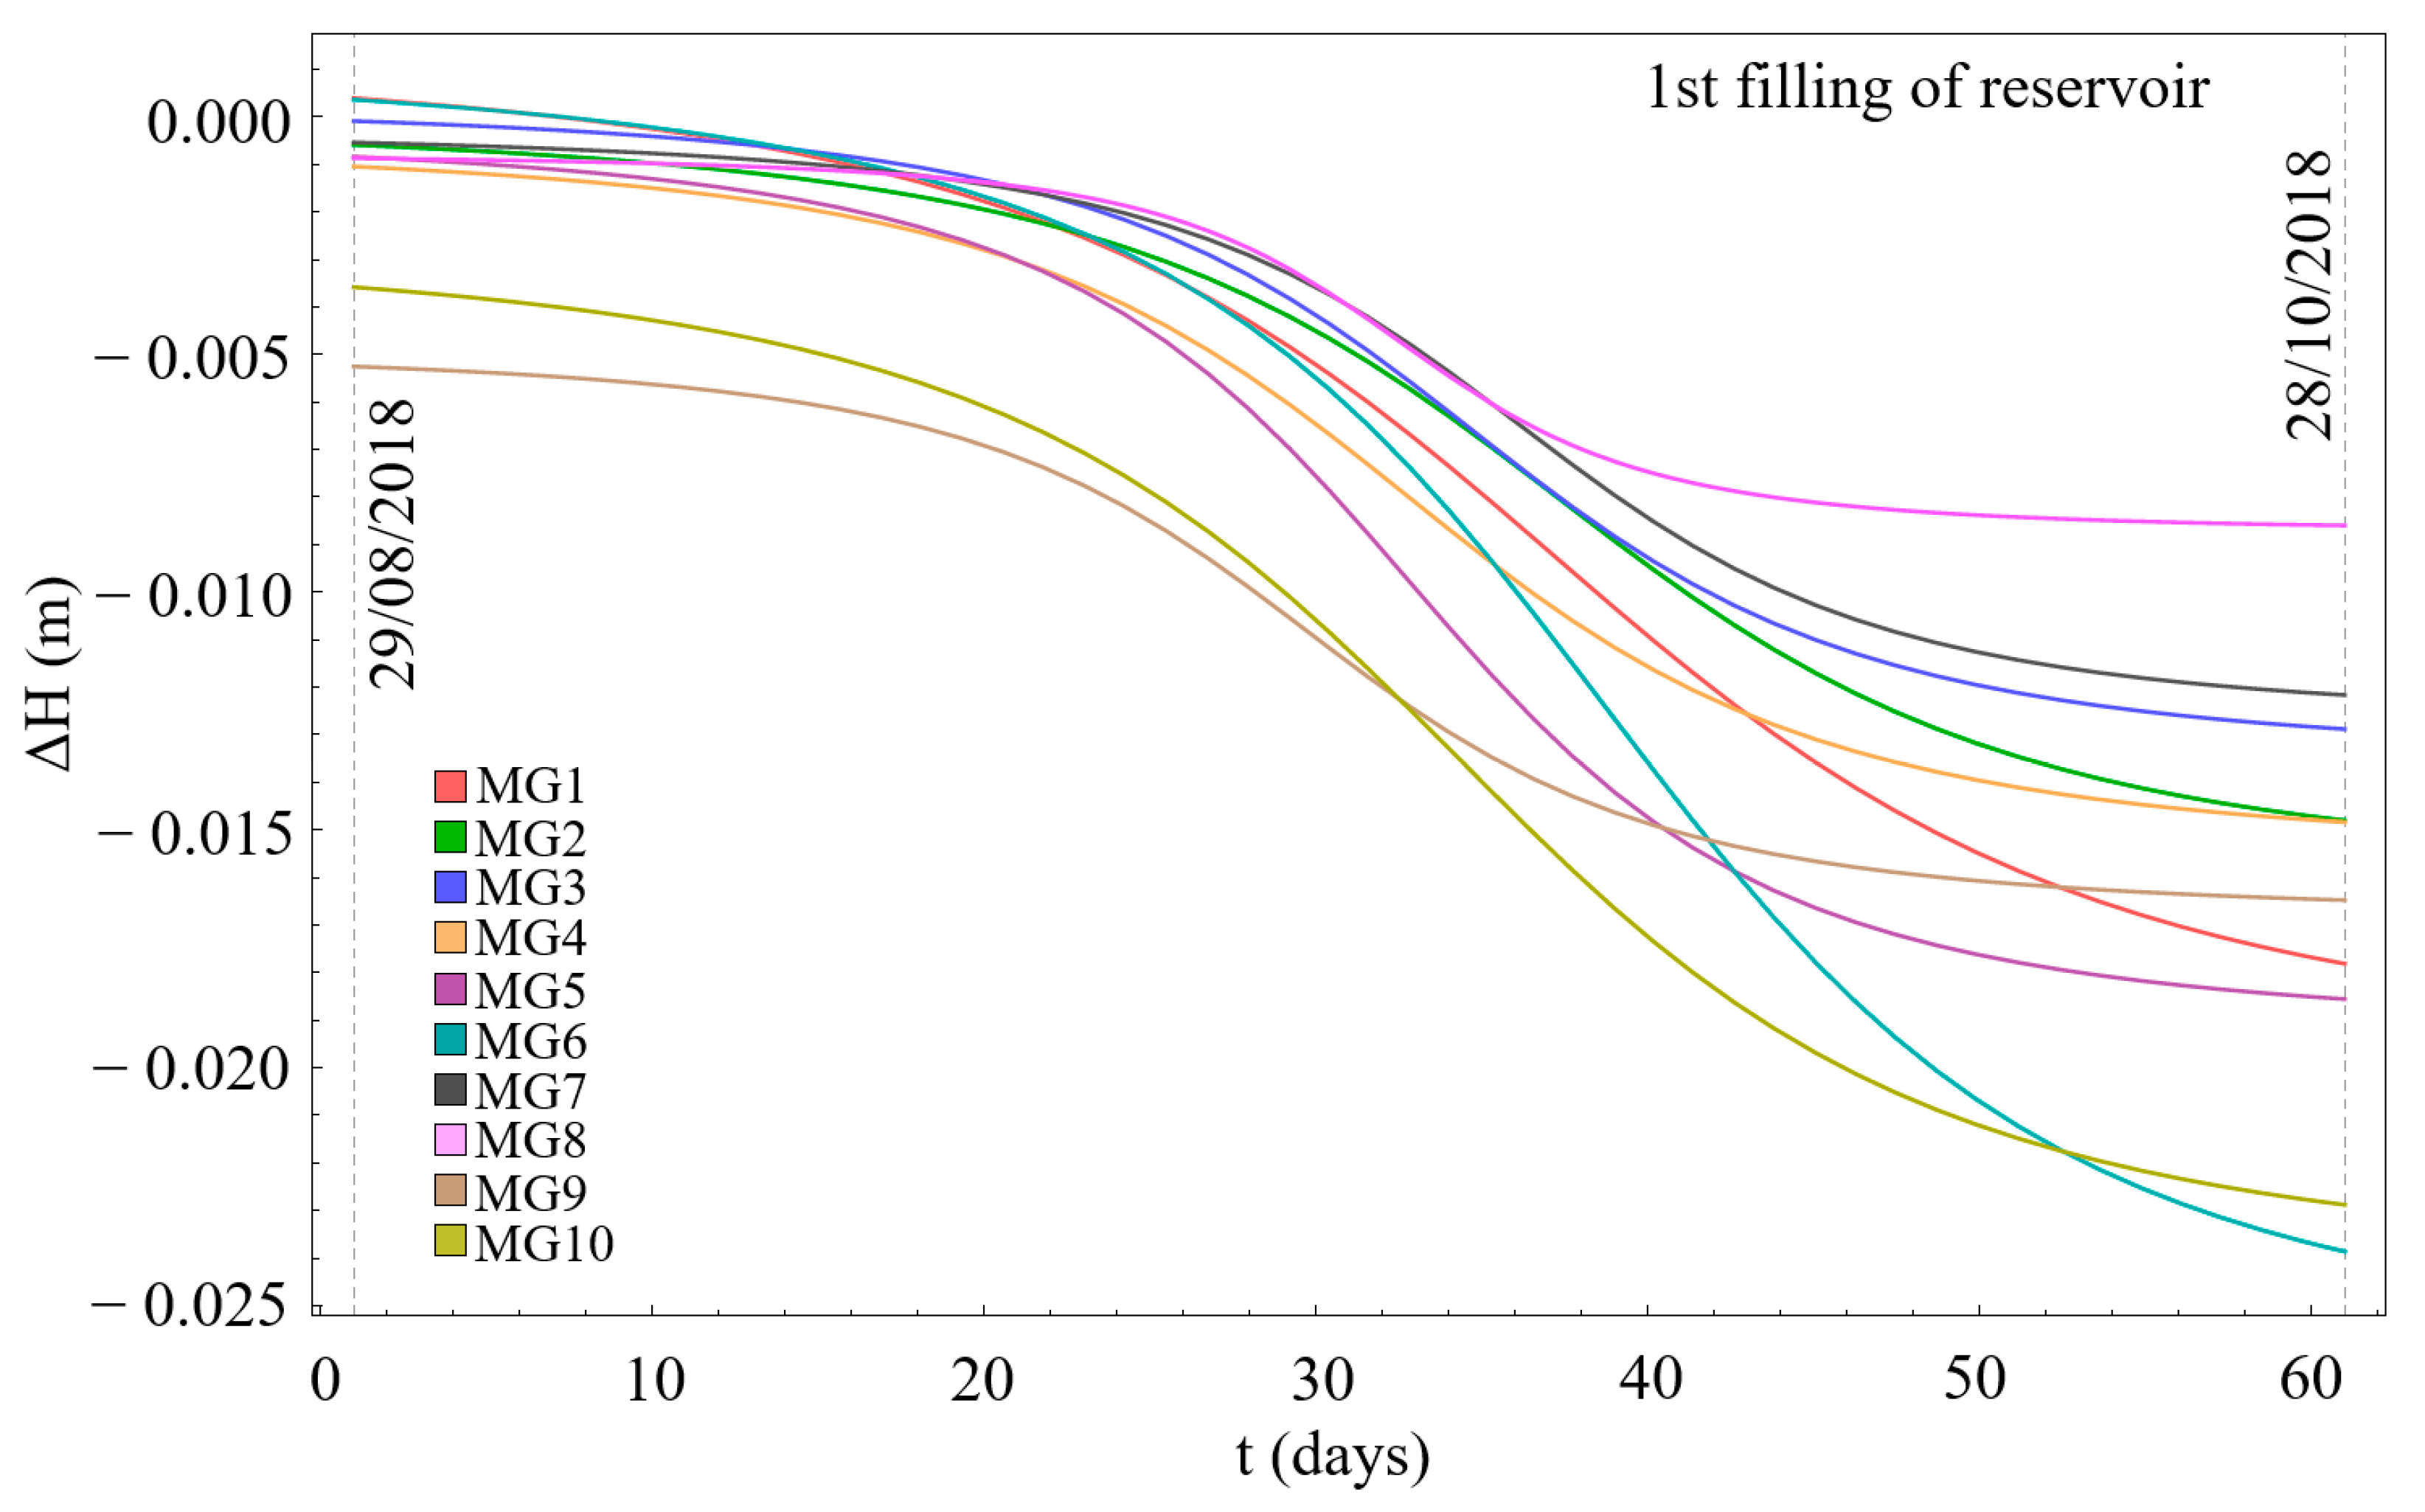
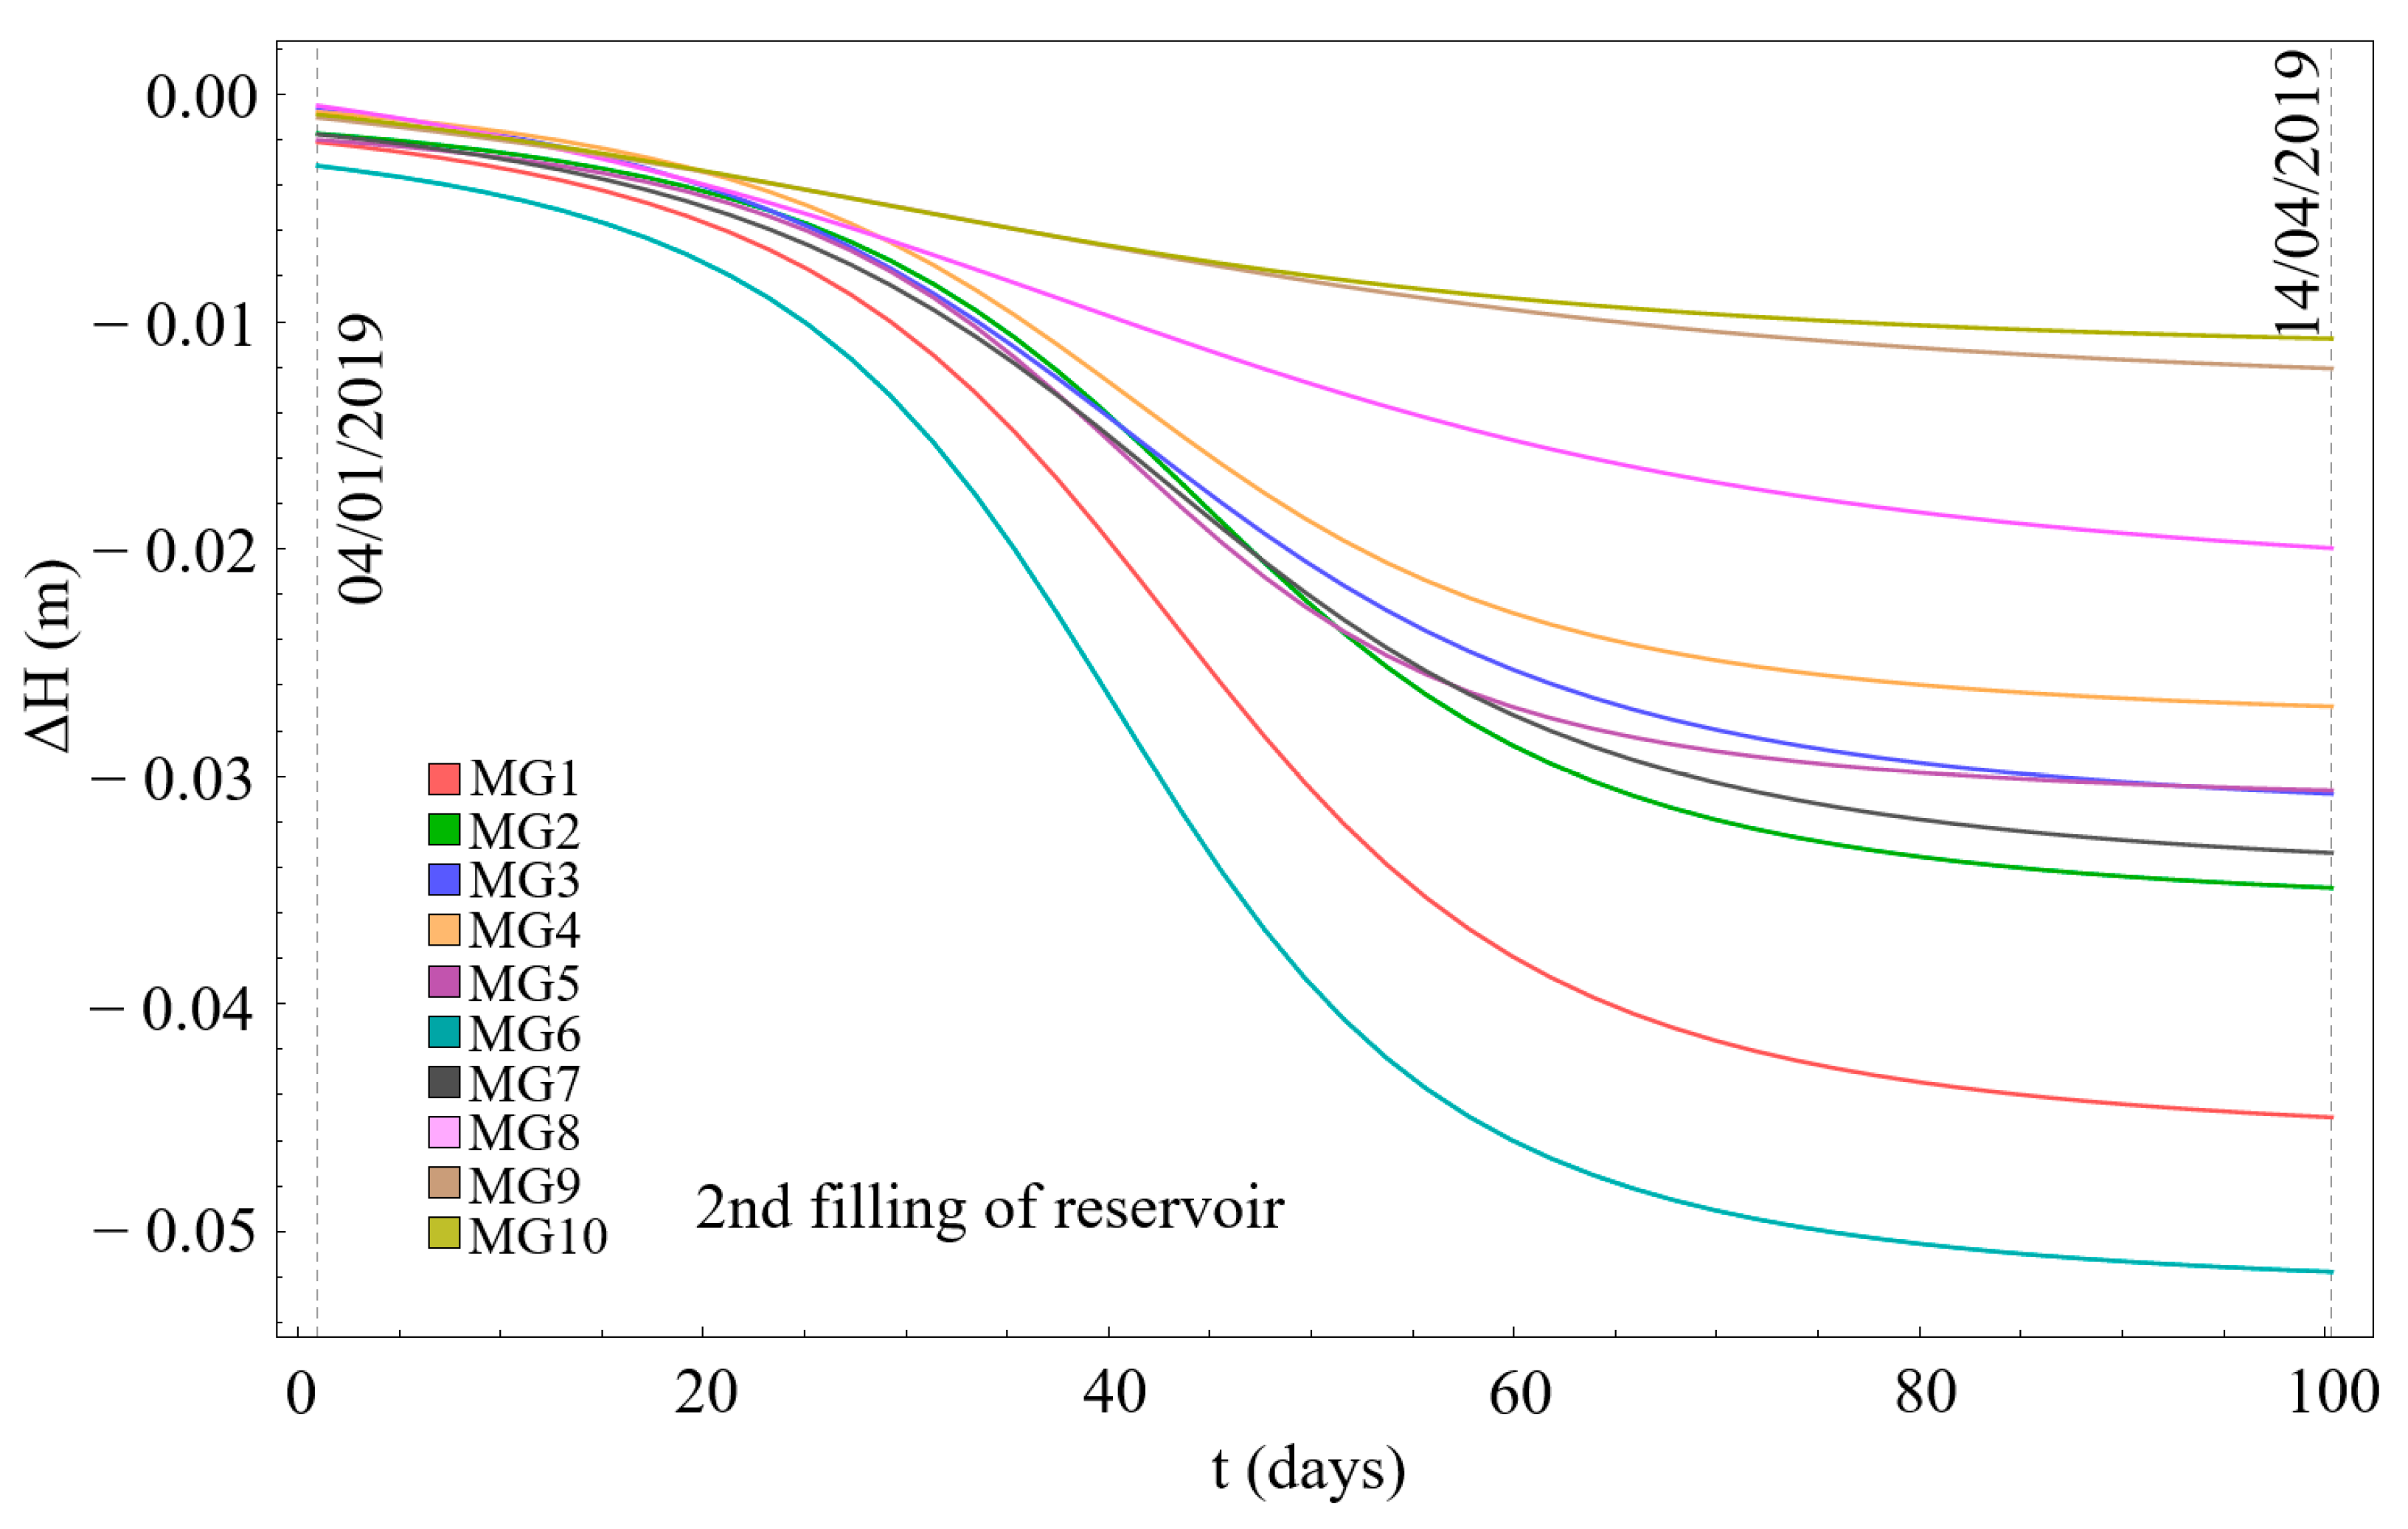
During filling of reservoir the settlement of observed points on cofferdam crest is behaving in a nonlinear fashion, slowly ceasing and asymptotically approaching its final value.
(ii)
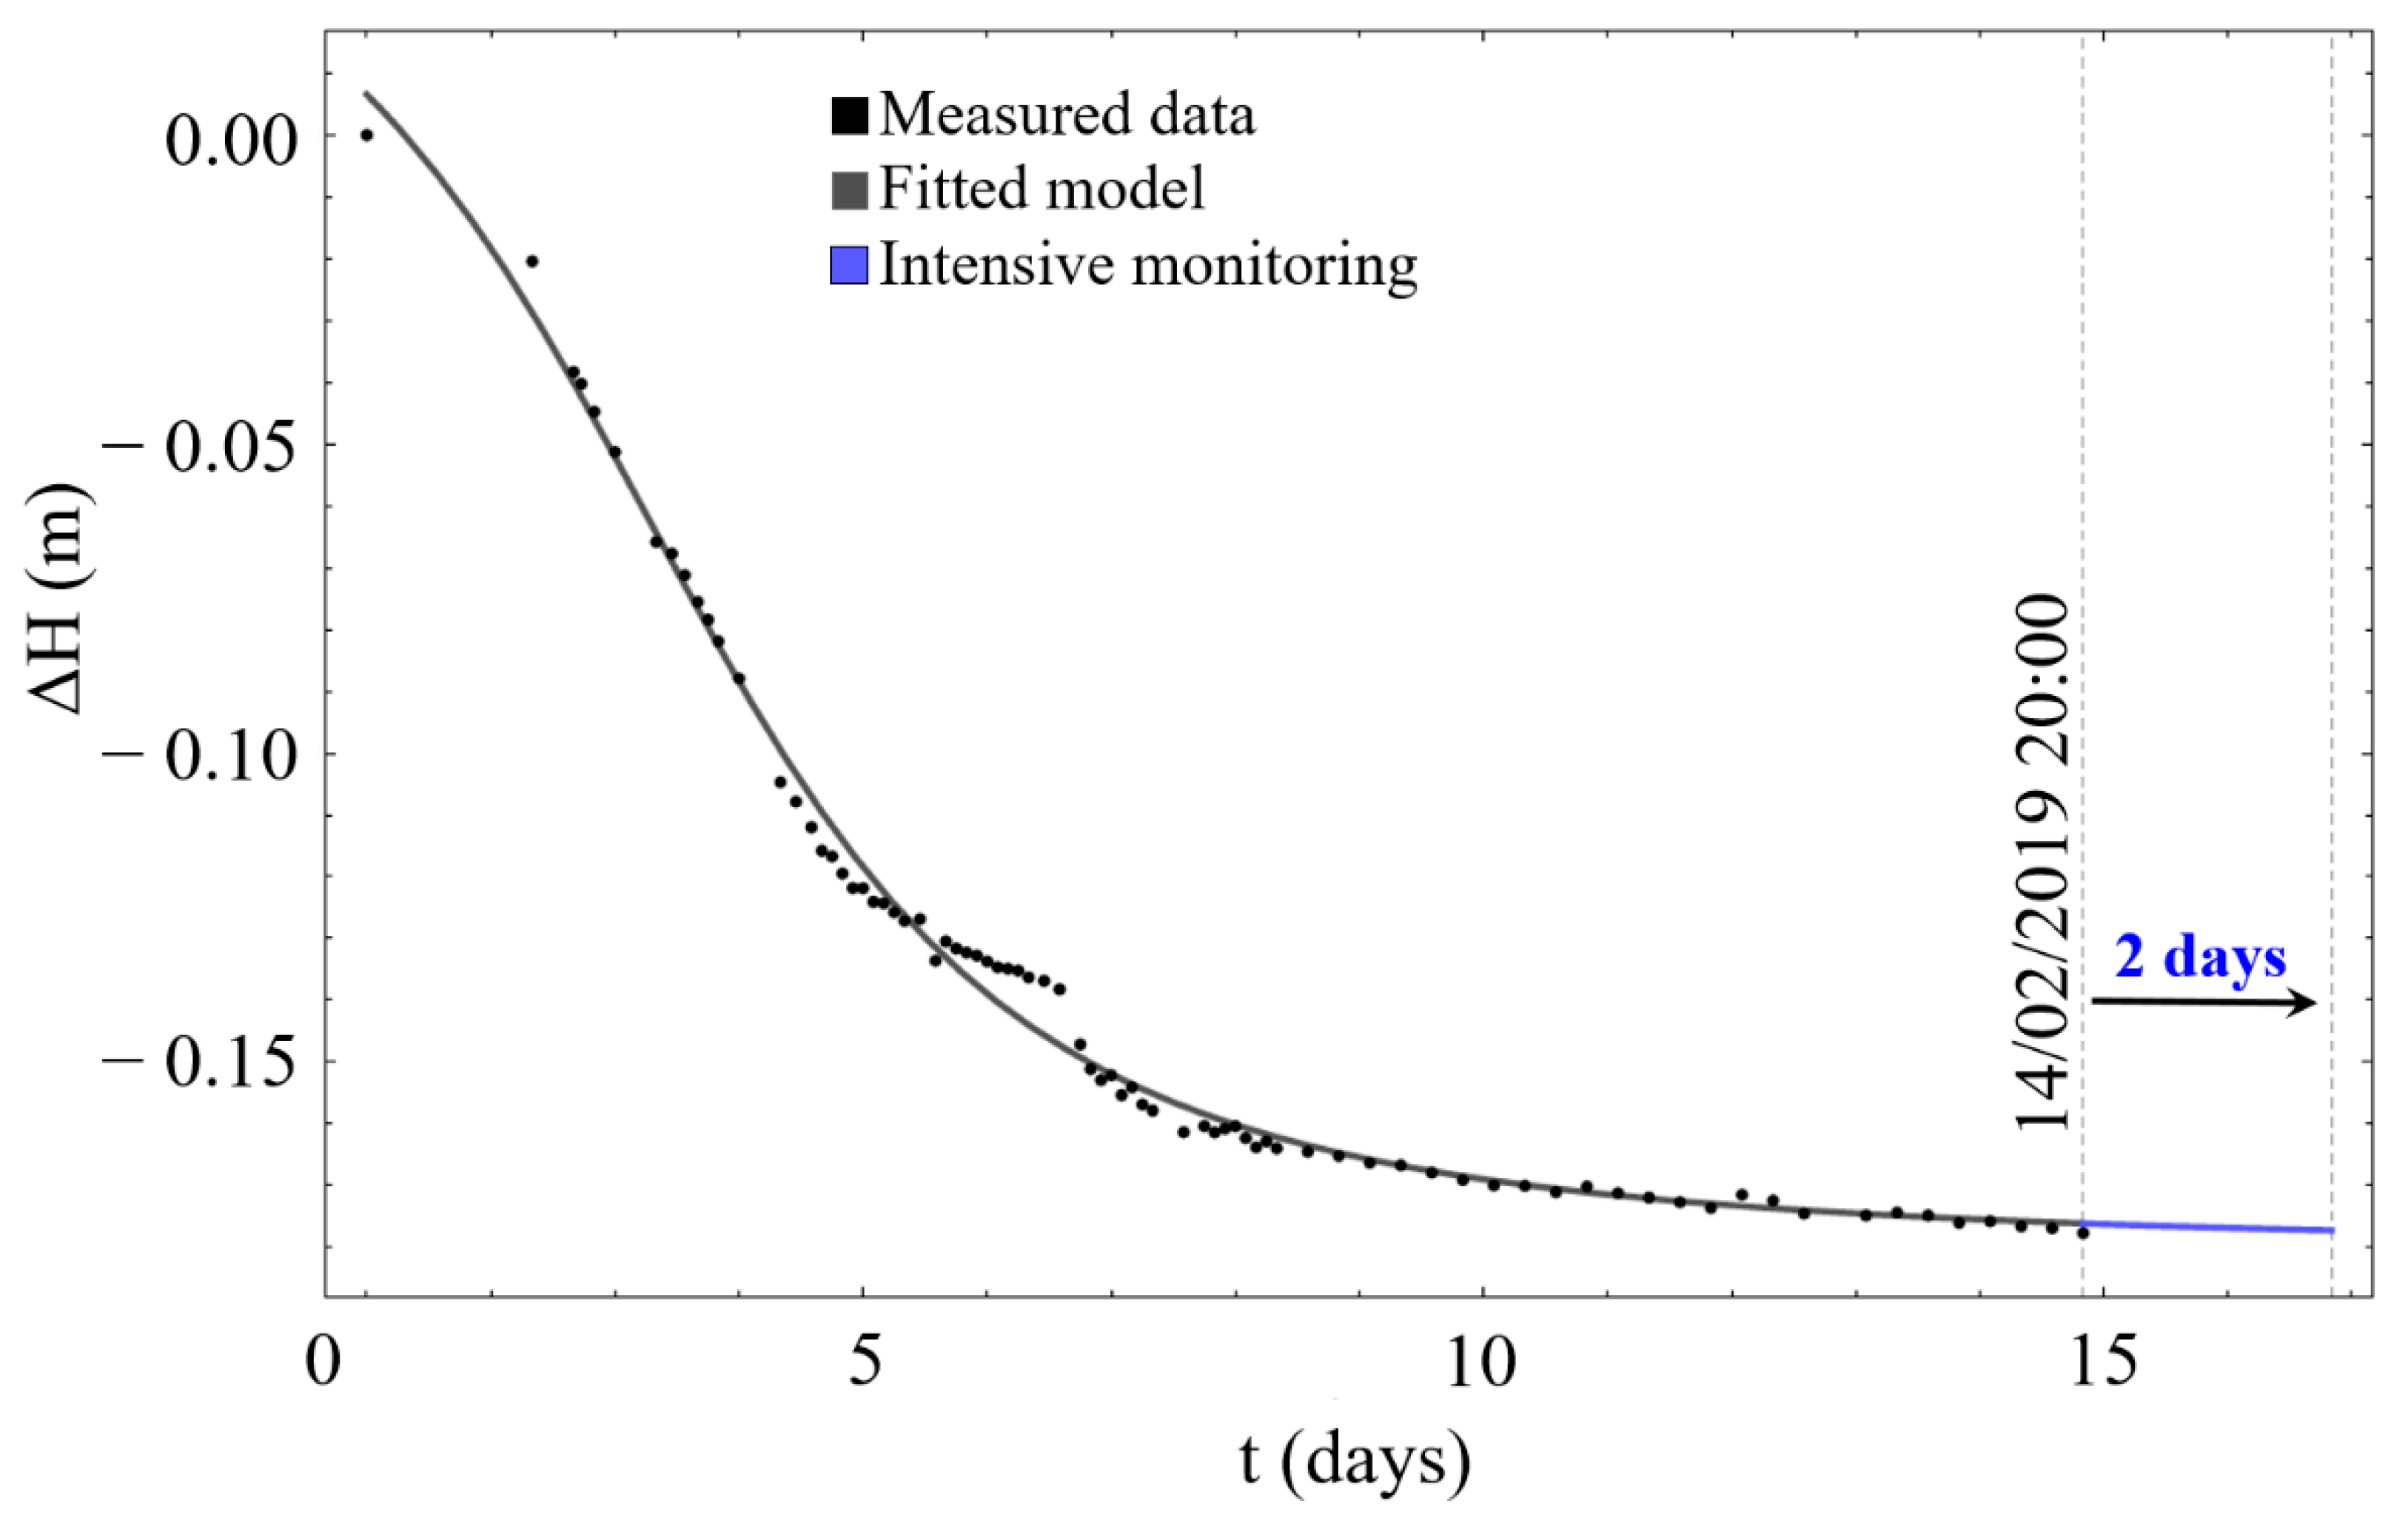
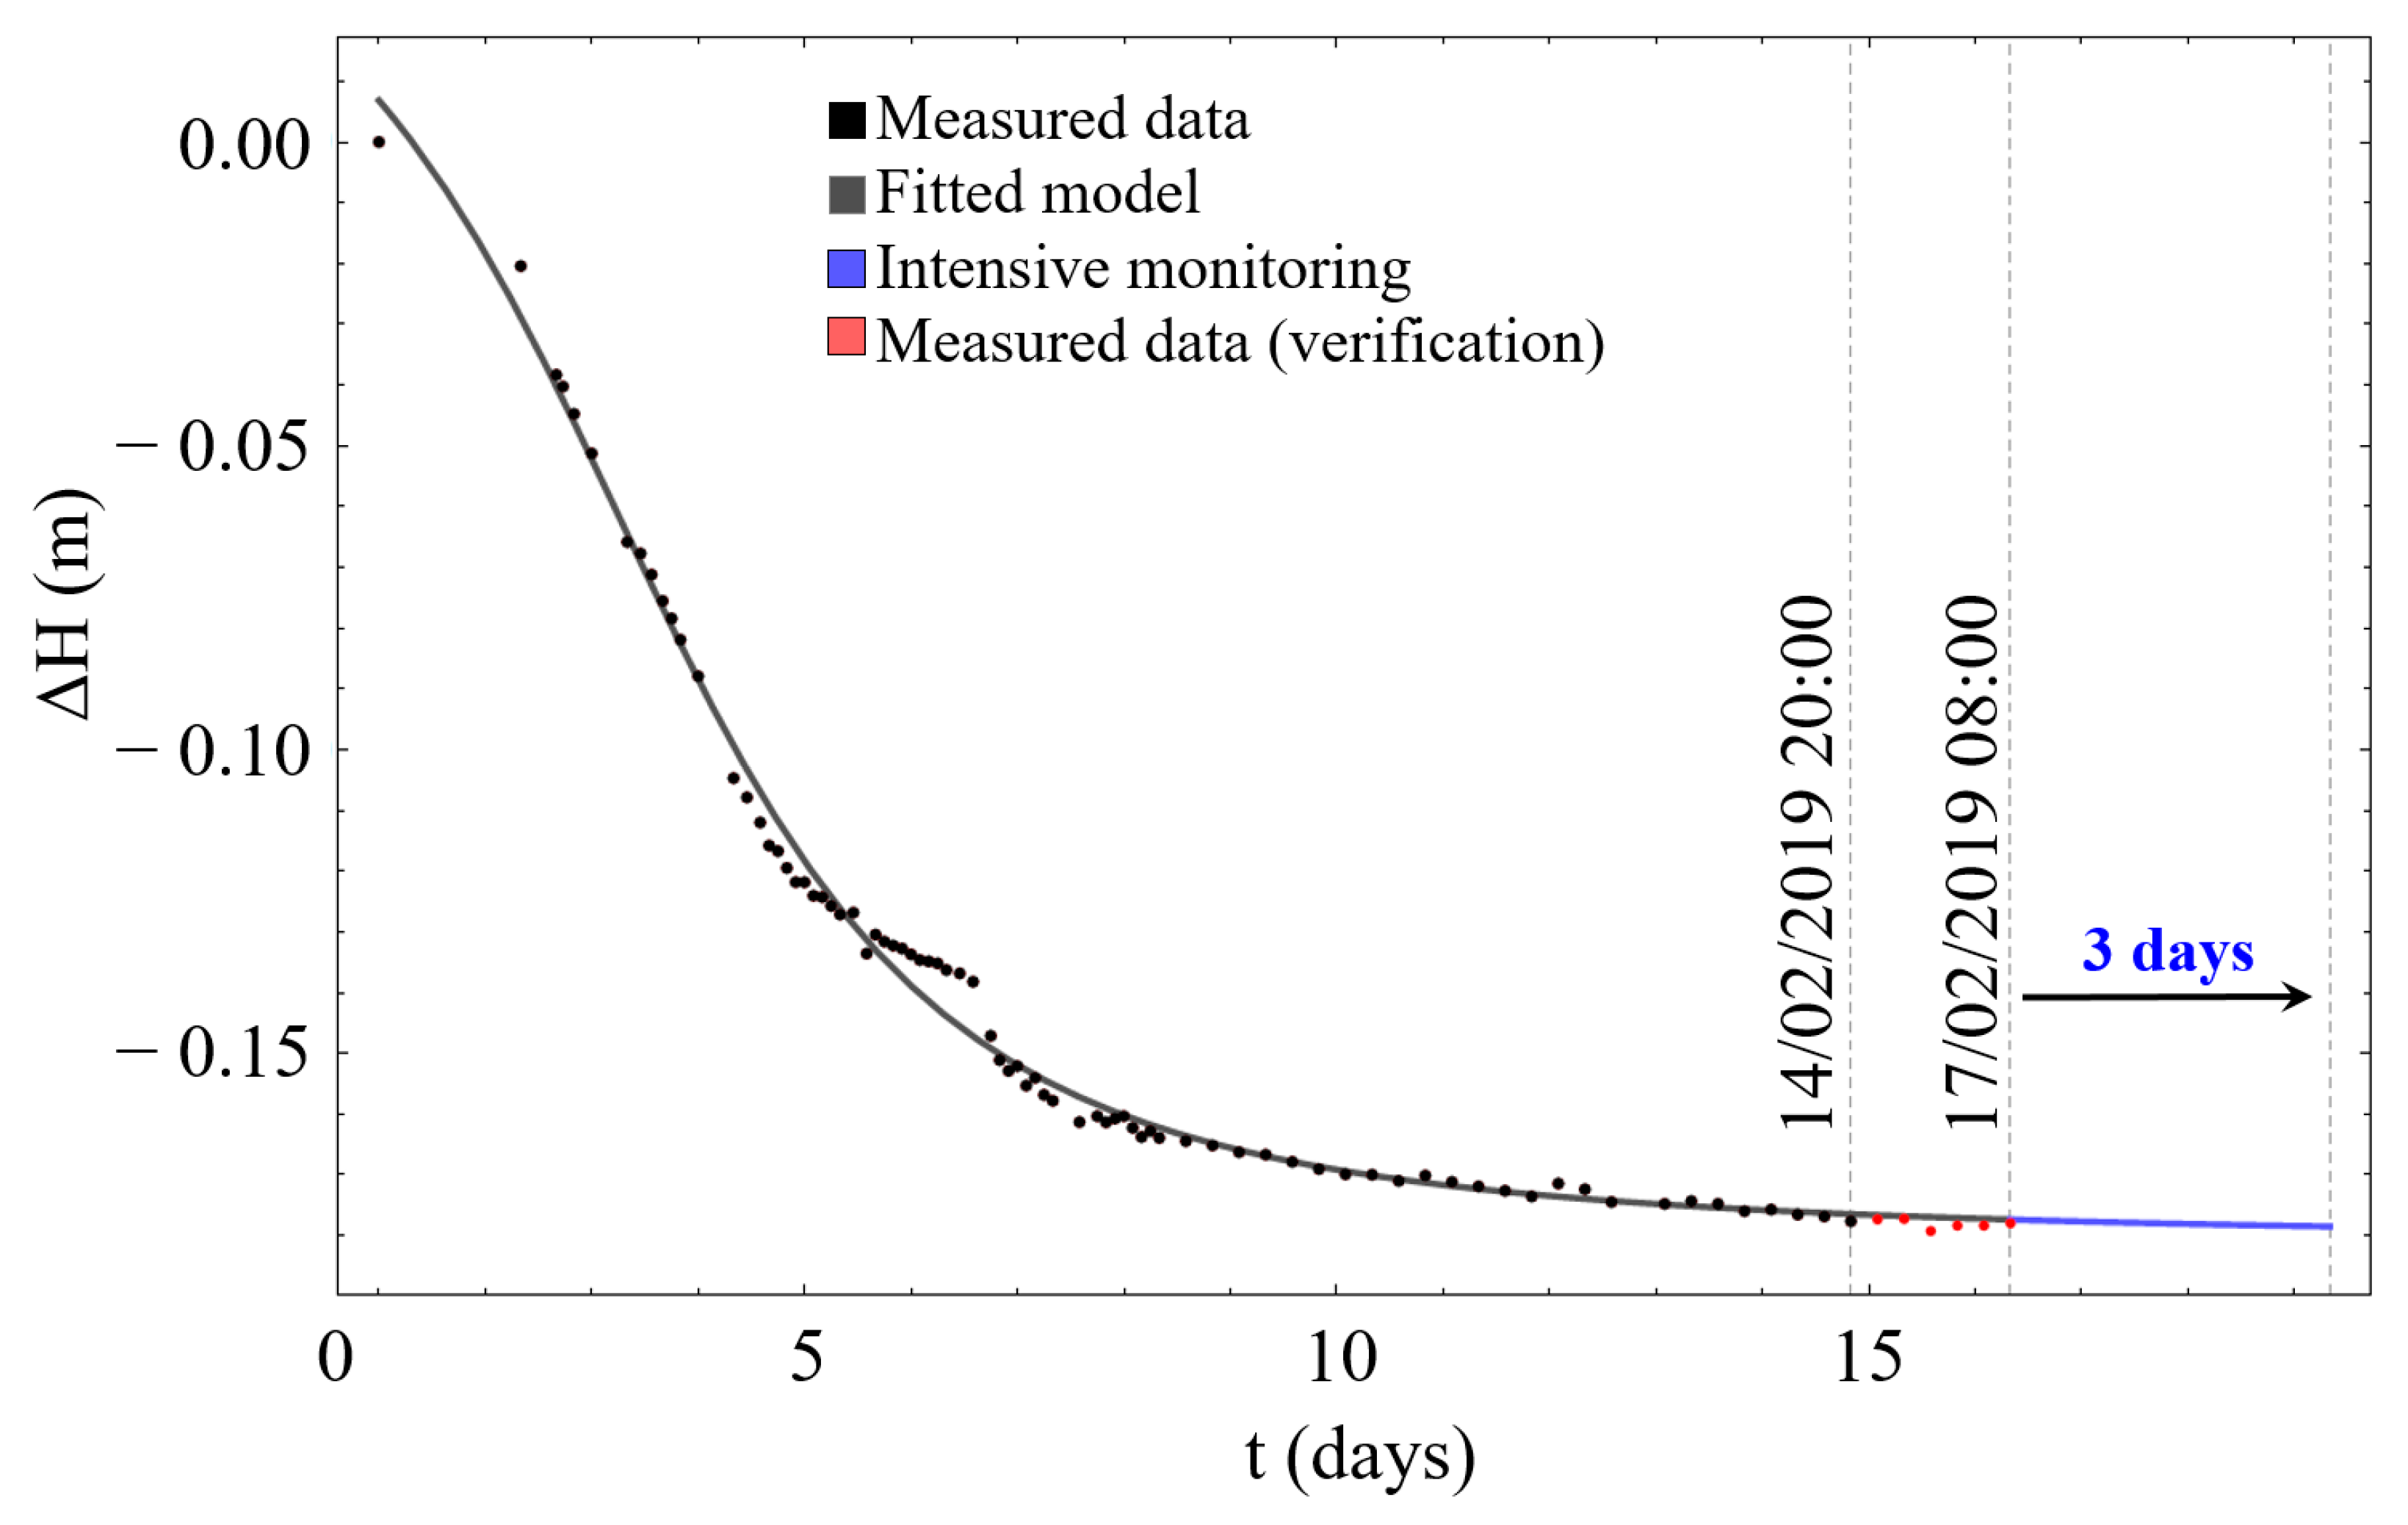
FNSE model can be used to predict the settlement of the crest.
(iii)
With the use of a decision algorithm and the FNSE model, monitoring adjustment can be implemented to optimize the time and intensity of future measurements.

Author Contributions

Conceptualization, A.P. and M.V.; Formal analysis, A.P and D.P.; Methodology, M.V.; Writing—review & editing, A.P. All authors have read and agreed to the published version of the manuscript.

Funding

The APC was funded by Premogovnik Velenje d.o.o.

Acknowledgments

This study was conducted with the support of the research program P2-0268 and the Young Researcher grant (1000-15-0510) financed by the Slovenian Research Agency. The authors are grateful to Matej Nagy (Salini Impregilo S.p.A.) for data provision. We are also grateful to the anonymous reviewers and members of the editorial team for their comments.

Conflicts of Interest

The authors declare no conflict of interest.

References

  1. Dounias, G.T.; Anastasopoulos, K.; Kountouris, A. Long-term behaviour of embankment dams: Seven Greek dams. Proc. Inst. Civ. Eng. Geotech. Eng. 2012, 165, 157–177. [Google Scholar] [CrossRef]
  2. Yavaşoğlu, H.H.; Kalkan, Y.; Tiryakioğlu, İ.; Yigit, C.O.; Özbey, V.; Alkan, M.N.; Alkan, R.M. Monitoring the deformation and strain analysis on the Ataturk Dam, Turkey. Geomat. Nat. Hazards Risk 2018, 9, 94–107. [Google Scholar] [CrossRef] [Green Version]
  3. Desmond, N.D.H.; Gregory, B.B. Risk and Uncertainty in Dam Safety; Thomas Telford Publishing, Thomas Telford Ltd.: London, UK, 2004. [Google Scholar]
  4. Zhong, D.; Cui, B.; Liu, D.; Tong, D. Theoretical research on construction quality real-time monitoring and system integration of core rockfill dam. Sci. China Ser. E Technol. Sci. 2009, 52, 3406–3412. [Google Scholar] [CrossRef]
  5. Scaioni, M.; Marsella, M.; Crosetto, M.; Tornatore, V.; Wang, J. Geodetic and remote-sensing sensors for dam deformation monitoring. Sensors 2018, 18, 3682. [Google Scholar] [CrossRef] [PubMed] [Green Version]
  6. Hunter, G.; Fell, R. The Deformation Behaviour of Rockfill; UNICIV Report No. 405; University of New South Wales: Sydney, Australia, 2002. [Google Scholar]
  7. Gikas, V.; Sakellariou, M. Settlement analysis of the Mornos earth dam (Greece): Evidence from numerical modeling and geodetic monitoring. Eng. Struct. 2008, 30, 3074–3081. [Google Scholar] [CrossRef]
  8. Acosta, L.E.; De Lacy, M.; Ramos, M.I.; Cano, J.P.; Herrera, A.M.; Avilés, M.; Gil, A.J. Displacements study of an earth fill dam based on high precision geodetic monitoring and numerical modeling. Sensors 2018, 18, 1369. [Google Scholar] [CrossRef] [Green Version]
  9. Clements, R.P. Post-construction deformation of rockfill dams. J. Geotech. Eng. 1984, 110, 821–840. [Google Scholar] [CrossRef]
  10. Guler, G.; Kilic, H.; Hosbas, G.; Ozaydin, K. Evaluation of the movements of the dam embankments by means of geodetic and geotechnical methods. J. Surv. Eng. 2006, 132, 31–39. [Google Scholar] [CrossRef]
  11. de Lacy, M.C.; Ramos, M.I.; Gil, A.J.; Franco, Ó.D.; Herrera, A.M.; Avilés, M.; Domínguez, A.; Chica, J.C. Monitoring of vertical deformations by means high-precision geodetic levelling. Test case: The Arenoso dam (South of Spain). J. Appl. Geod. 2017, 11, 31–41. [Google Scholar] [CrossRef]
  12. Saidi, S.; Houimli, H.; Zid, J. Geodetic and GIS tools for dam safety: Case of Sidi Salem dam (northern Tunisia). Arab. J. Geosci. 2017, 10. [Google Scholar] [CrossRef]
  13. Guedes, Q.M.; Silva, I.D. Technical report: Shell dam horizontal displacement monitoring-comparative study using geodetic measurement, optical plumb and GPS technologies. J. Appl. Geod. 2009, 3, 249–255. [Google Scholar] [CrossRef]
  14. Ehrhart, M.; Lienhart, W. Object tracking with robotic total stations: Current technologies and improvements based on image data. J. Appl. Geod. 2017, 11, 131–142. [Google Scholar] [CrossRef]
  15. Ghilani, C.D. Elementary Surveying: An Introduction to Geomatics; Pearson Education Limited: Boston, MA, USA, 2016; Volume 14. [Google Scholar]
  16. Alcay, S.; Yigit, C.O.; Inal, C.; Ceylan, A. Analysis of Displacement Response of the Ermenek Dam Monitored by an Integrated Geodetic and Pendulum System. Int. J. Civ. Eng. 2018, 16, 1279–1291. [Google Scholar] [CrossRef]
  17. Barzaghi, R.; Cazzaniga, N.E.; De Gaetani, C.I.; Pinto, L.; Tornatore, V. Estimating and comparing dam deformation using classical and GNSS techniques. Sensors 2018, 18, 756. [Google Scholar] [CrossRef] [Green Version]
  18. Montillet, J.P.; Szeliga, W.M.; Melbourne, T.I.; Flake, R.M.; Schrock, G. Critical infrastructure monitoring with global navigation satellite systems. J. Surv. Eng. 2016, 142. [Google Scholar] [CrossRef] [Green Version]
  19. Chrzanowski, A.; Szostak-Chrzanowski, A. Deformation monitoring surveys—Old problems and new solutions. Rep. Geod. 2009, 2/87, 85–103. [Google Scholar]
  20. Mukupa, W.; Roberts, G.W.; Hancock, C.M.; Al-Manasir, K. A review of the use of terrestrial laser scanning application for change detection and deformation monitoring of structures. Surv. Rev. 2017, 49, 99–116. [Google Scholar] [CrossRef]
  21. Anghel, A.; Vasile, G.; Boudon, R.; D’urso, G.; Girard, A.; Boldo, D.; Bost, V. Combining spaceborne SAR images with 3D point clouds for infrastructure monitoring applications. ISPRS J. Photogramm. Remote Sens. 2016, 111, 45–61. [Google Scholar] [CrossRef]
  22. Szostak-Chrzanowski, A.; Deng, N.W.; Li, M.; Massiéra, M. Discussion on monitoring and deformation aspects of concrete face rockfill dam. Yantu Gongcheng Xuebao Chin. J. Geotech. Eng. 2008, 30, 1651–1656. [Google Scholar]
  23. Singh, V.P. Dam Breach Modeling Technology; Water Science and Technology Library: Dordrecht, The Netherlands, 1996; Volume 17, p. 242. [Google Scholar]
  24. Yigit, C.O.; Alcay, S.; Ceylan, A. Displacement response of a concrete arch dam to seasonal temperature fluctuations and reservoir level rise during the first filling period: Evidence from geodetic data. Geomat. Nat. Hazards Risk 2016, 7, 1489–1505. [Google Scholar] [CrossRef] [Green Version]
  25. Pytharouli, S.I.; Pytharouli, S.I.; Stiros, S.C. Investigation of the parameters controlling the crest settlement of a major earthfill dam based on the threshold correlation analysis. J. Appl. Geod. 2009, 3, 55–62. [Google Scholar] [CrossRef]
  26. Battaglio, M.; Bellomo, N.; Bonzani, I.; Lancellotta, R. Non-linear consolidation models of clay which change type. Int. J. Non-Linear Mech. 2003, 38, 493–500. [Google Scholar] [CrossRef]
  27. Gottschalk, P.G.; Dunn, J.R. The five-parameter logistic: A characterization and comparison with the four-parameter logistic. Anal. Biochem. 2005, 343, 54–65. [Google Scholar] [CrossRef] [PubMed]
  28. Vulić, M. Sigmoidna Funckija (Internal Mine Surveying Lecture Series); University of Ljubljana, Faculty of Natural Sciences and Engineering: Ljubljana, Slovenia, 2013. [Google Scholar]
  29. Hayter, J.A. Probability and Statistics for Engineers and Scientists, 4th ed.; Brooks/Cole: Boston, MA, USA, 2013. [Google Scholar]
Figure 1. The monitoring area with observational points alongside the crest (points MG1-MG10, points SSP1 to SSP5, points MG19 to MG21, DRMG19a and DRMG20a) and on the cofferdam body (points MG11 to MG16).
Minerals 10 00152 g001
Figure 2. (a) Concrete pillar point MG19; (b) point stabilization with a combination of steel rebar, plastic tube and cement grout.
Minerals 10 00152 g002
Figure 3. The area of observed maximum settlement (A) and the associated points SSP1 to SSP6, points MG19 to MG21, point DRMG19a, and point DRMG20a. Re-established points MG11 to MG16 and area of elevated cofferdam body are shown (B).
Minerals 10 00152 g003
Figure 4. Settlement visualization of points MG1 to M10, from 29/08/2018 to 28/10/2018.
Minerals 10 00152 g004
Figure 5. Settlement visualization of points MG11 to M14, from 29/08/2018 to 14/10/2018, and of points MG15 and M16, from 29/08/2018 to 08/10/2018.
Minerals 10 00152 g005
Figure 6. Settlement visualization of points MG1 to M10, from 04/01/2019 to 19/05/2019.
Minerals 10 00152 g006
Figure 7. Settlement visualization of points MG11 to M16, from 04/01/2019 to 19/05/2019.
Minerals 10 00152 g007
Figure 8. Settlement visualization of points MG19, MG20 and MG21, from 02/02/2019 to 19/05/2019.
Minerals 10 00152 g008
Figure 9. Settlement visualization of points DRMG19a and DRMG20, from 04/02/2019 to 21/03/2019 (13/02/2018).
Minerals 10 00152 g009
Figure 10. Settlement visualization of points SSP1 to SSP6, from 06/02/2019 to 21/03/2019 (13/02/2018).
Minerals 10 00152 g010
Figure 11. The decision algorithm for monitoring adjustment.
Minerals 10 00152 g011
Figure 12. Settlement visualization of points MG1 to M10, from 29/08/2018 to 19/05/2019.
Minerals 10 00152 g012
Figure 13. Fitted Faculty of Natural Sciences and Engineering (FNSE) models for points MG1 to M10, from 29/08/2018 to 28/10/2018.
Minerals 10 00152 g013
Figure 14. Fitted FNSE models for points MG1 to M10, from 04/01/2019 to 14/04/2019.
Minerals 10 00152 g014
Figure 15. The fitted model for point MG19, based on obtained data from 02/02/2019 to 14/02/2019; actual data (black), best-fitted FNSE model (red), μ±σ confidence interval (blue) and μ±3σ confidence interval (green).
Minerals 10 00152 g015
Figure 16. First monitoring adjustment for point MG19.
Minerals 10 00152 g016
Figure 17. Second monitoring adjustment for point MG19.
Minerals 10 00152 g017
Figure 18. Third monitoring adjustment for point MG19.
Minerals 10 00152 g018
Figure 19. Fitted model for point MG19, based on obtained data from 02/02/2019 to 14/04/2019; actual data (black), best fitted FNSE model (red), μ±σ confidence interval (blue) and μ±3σ confidence interval (green).
Minerals 10 00152 g019
Figure 20. Visual presentation of future settlement prediction for point MG19; settlement data used for fitting (black), fitted FNSE model (red) and verification settlement data (blue).
Minerals 10 00152 g020
Table 1. Height values of points MG1 to MG16, relating to the start and end time of monitoring during the first filing of the reservoir.
Point IDDateHeight (m)DateHeight (m)
MG129/08/20181066.170128/10/20181066.1518
MG229/08/20181066.121128/10/20181066.1077
MG329/08/20181066.132228/10/20181066.1194
MG429/08/20181066.143928/10/20181066.1302
MG529/08/20181066.880828/10/20181066.8631
MG629/08/20181066.203428/10/20181066.1797
MG729/08/20181066.165928/10/20181066.1550
MG829/08/20181066.123428/10/20181066.1168
MG929/08/20181066.011528/10/20181066.0002
MG1029/08/20181065.979428/10/20181065.9602
MG1129/08/20181037.591714/10/20181037.5553
MG1229/08/20181031.469714/10/20181031.4598
MG1329/08/20181026.074114/10/20181026.0867
MG1429/08/20181022.745414/10/20181022.7445
MG1529/08/20181007.116308/10/20181007.1058
MG1629/08/20181009.364108/10/20181009.3605
Table 2. Height values of points MG1 to MG16, relating to the start and end time of second reservoir filing, and the time of the last measurement.
Point IDDateHeight (m)DateHeight (m)DateHeight (m)
MG104/01/20191066.126314/04/20191066.079319/05/20191066.0798
MG204/01/20191066.121114/04/20191066.053419/05/20191066.0536
MG304/01/20191066.132214/04/20191066.072519/05/20191066.0713
MG404/01/20191066.116714/04/20191066.088919/05/20191066.0884
MG504/01/20191066.852214/04/20191066.820719/05/20191066.8220
MG604/01/20191066.145914/04/20191066.092519/05/20191066.0934
MG704/01/20191066.136514/04/20191066.101719/05/20191066.1025
MG804/01/20191066.104214/04/20191066.083719/05/20191066.0828
MG904/01/20191065.989214/04/20191065.976619/05/20191065.9766
MG1004/01/20191065.960314/04/20191065.948619/05/20191065.9493
MG1104/01/20191031.527214/04/20191031.493719/05/20191031.4817
MG1204/01/20191031.601914/04/20191031.585219/05/20191031.5827
MG1304/01/20191031.736714/04/20191031.728119/05/20191031.7274
MG1404/01/20191031.792014/04/20191031.788419/05/20191031.7888
MG1504/01/20191045.999314/04/20191045.955419/05/20191045.9499
MG1604/01/20191045.509914/04/20191045.488419/05/20191045.4876
Table 3. Height values of points MG19 to MG21, points DRMG19a and DRMG20a, and points SSP1 to SSP6, relating to the start and end time of monitoring.
Point IDDateHeight (m)DateHeight (m)
MG1902/02/20191066.846019/05/20191066.6112
MG2002/02/20191058.434919/05/20191058.3533
MG2102/02/20191052.281819/05/20191052.2299
DRMG19a04/02/20191066.778521/03/20191066.6719
DRMG20a04/02/20191066.693513/02/20191066.5630
SSP106/02/20191066.487221/03/20191066.4530
SSP206/02/20191066.878221/03/20191066.8746
SSP306/02/20191066.272321/03/20191066.2226
SSP406/02/20191067.006721/03/20191067.0006
SSP506/02/20191066.438313/02/20191066.4033
SSP606/02/20191066.441513/02/20191066.4114

