Article

Coupling between Diagenetic Environment and Porosity Evolution—A Quantitative Study of the Zhuhai Formation in the Huizhou Sag, Pearl River Mouth Basin, South China Sea

1
State Key Laboratory of Petroleum Resources and Prospecting, China University of Petroleum, Beijing 102249, China
2
College of Geosciences, China University of Petroleum, Beijing 102249, China
3
Shenzhen Branch, China National Offshore Oil Corporation, Shenzhen 518000, China
*
Authors to whom correspondence should be addressed.
Minerals 2020, 10(2), 170; https://doi.org/10.3390/min10020170
Submission received: 27 December 2019 / Revised: 11 February 2020 / Accepted: 12 February 2020 / Published: 14 February 2020
(This article belongs to the Section Mineral Deposits)

Abstract

:
The diagenetic environment is vital in controlling reservoir quality by influencing diagenetic processes, especially porosity evolution. The Zhuhai Formation is a critical exploration target in the Huizhou Sag. However, there are considerable differences between the reservoirs in the west (Huixi) and east (Huidong) Huizhou Sag with only a 400 m difference in burial depth. To investigate causes of these differences, scanning electron microscopy (SEM), cathodoluminescence analysis, fluorescence analysis, and fluid inclusion analysis are employed for the petrological and diagenetic characterization of the target formation. Moreover, image analysis software is used to qualitatively evaluate the impacts of diagenesis on porosity. The results show that the digenetic environments in Huixi and Huidong are different. Huixi is characterized by a high content of feldspar with a stronger dissolution phenomenon than that observed in Huidong. The main cement types in Huixi are siliceous cement and kaolinite. Moreover, Huixi had a low palaeo-temperature, low palaeo-salinity, and low palaeo-pH diagenetic environment. In contrast, Huidong is accessible via deep faults and rich in lithic fragments which show visible deformation. Moreover, cements in this area include carbonate, gypsum, quartz overgrowth, kaolinite, and chlorite. This evidence confirms that the diagenetic environment in Huidong was a high palaeo-temperature and high palaeo-salinity environment with high palaeo-pH. Additionally, the palaeo-pH evolved following the sequence of weakly alkaline, acidic, alkaline and acidic. Microscopy evidence indicates that the Dongsha Uplift was a likely source of Huixi sediments during the deposition of the Zhuhai Formation. The determination of the porosity evolution shows that compaction and lithic fragment content are the main controlling factors on the reservoir quality of the Zhuhai Formation.

1. Introduction

Porosity and permeability are the critical parameters that represent reservoir quality [1,2], and both are mainly controlled by the initial sedimentary structure and later diagenesis. Hence, high porosity and high permeability are the results of comprehensive interactions among primary sedimentary composition, texture, and diagenetic processes such as compaction, cementation, and dissolution [3]. During a long burial history, diagenesis is significantly influenced by the diagenetic environment. Ultimately, diagenesis will affect reservoir quality through various physical and chemical means, and thus will determine the pore volume, pore geometry and filling state of the pore space [4]. Therefore, understanding the coupling between the diagenetic environment and porosity evolution is of significant importance in oil and gas exploration.
Traditional methods used to reconstruct porosity evolution are mainly realized by establishing functions among burial depth, geological time and geological temperature without considering the effects of diagenesis [5,6,7]. Based on sandstone properties, some scholars have utilized numerical simulation and mathematical statistics to create charts and models of different sedimentary or diagenetic facies. However, these charts and models are only applicable to areas with similar geological settings [8,9,10,11]. In recent years, an increasing number of scholars have used Porosity Inversion and Back Stripping (PIBS) [12,13], which mainly uses data extracted from thin sections to calculate the porosity evolution [14,15,16,17]. This method also has some drawbacks. For example, it neglects the reduction in the rock bulk volume of rock underground and attributes the loss of porosity by compaction to the early diagenetic process [18,19,20,21,22]. Most importantly, this method requires knowledge of the true porosity. Under circumstances without enough samples for physical property tests, the application of PIBS is limited. In this case, scholars usually first analyse suitable mathematical models to fit the relation between areal porosity and true porosity, and then use the fitted porosity to replace true porosity in PIBS [21,23,24,25].
The coupling between the diagenetic environment and porosity evolution has attracted worldwide attention [26,27,28], since a better understanding of this relationship is helpful in forecasting reservoir quality. However, studying different research areas with different geological backgrounds can complicate this research. One reservoir that experienced different diagenetic environments in one sag is more suitable for such research. As one of the most important petroliferous basins in China, the Pearl River Mouth Basin has significance in terms of its energy reserves. The Huizhou Sag located in the Zhu I Depression has been viewed as the most hydrocarbon-rich sag in the basin [14], and the Zhuhai Formation sandstone reservoir has been a vital exploration target in recent years. Several studies have been performed on the Zhuhai Formation, investigating aspects including its structure, provenance, sedimentation, and petroleum system [14,29,30,31,32,33,34,35,36,37,38,39,40]. However, few of these studies have focused on reservoir characterization.
In the early stage of exploration, several scholars have investigated the reservoir characteristics of the Zhuhai Formation and concluded that the target formation in the Huizhou Sag has the same reservoir characteristics, suggesting that the Zhuhai Formation formed in a homogeneous diagenetic environment [41,42,43,44,45]. However, due to the limitations of exploration, most scholars only investigated samples from the Huixi graben. Several wells have been drilled in the Huidong graben to explore the oil and gas potential of the Zhuhai Formation in recent years. Furthermore, according to the China National Offshore Oil Corporation’s Shenzhen Branch reports from 2018, there is a considerable difference in reservoir quality between the Huixi graben and Huidong graben (hereinafter referred to as Huixi and Huidong) with only approximately 400 m difference in burial depth. For example, the reservoirs in Huixi have an average porosity of approximately 18.1 ± 6.9% and a high oil production rate, but those in Huidong have an average porosity of approximately 10.2 ± 2.4% and a low oil production rate. These differences indicate that the reservoir characteristics must be different between Huixi and Huidong, with different diagenetic histories, providing favourable conditions for research on the coupling between digenetic environment and porosity evolution.
The aims of the present work are as follows: 1. Quantitively reconstruct the diagenetic history of the target reservoir; 2. Investigate the coupling between the diagenetic environment and porosity evolution by analysing and comparing the diagenetic characteristics in Huixi and Huidong; 3. Clarify the main controlling factors on reservoir quality.

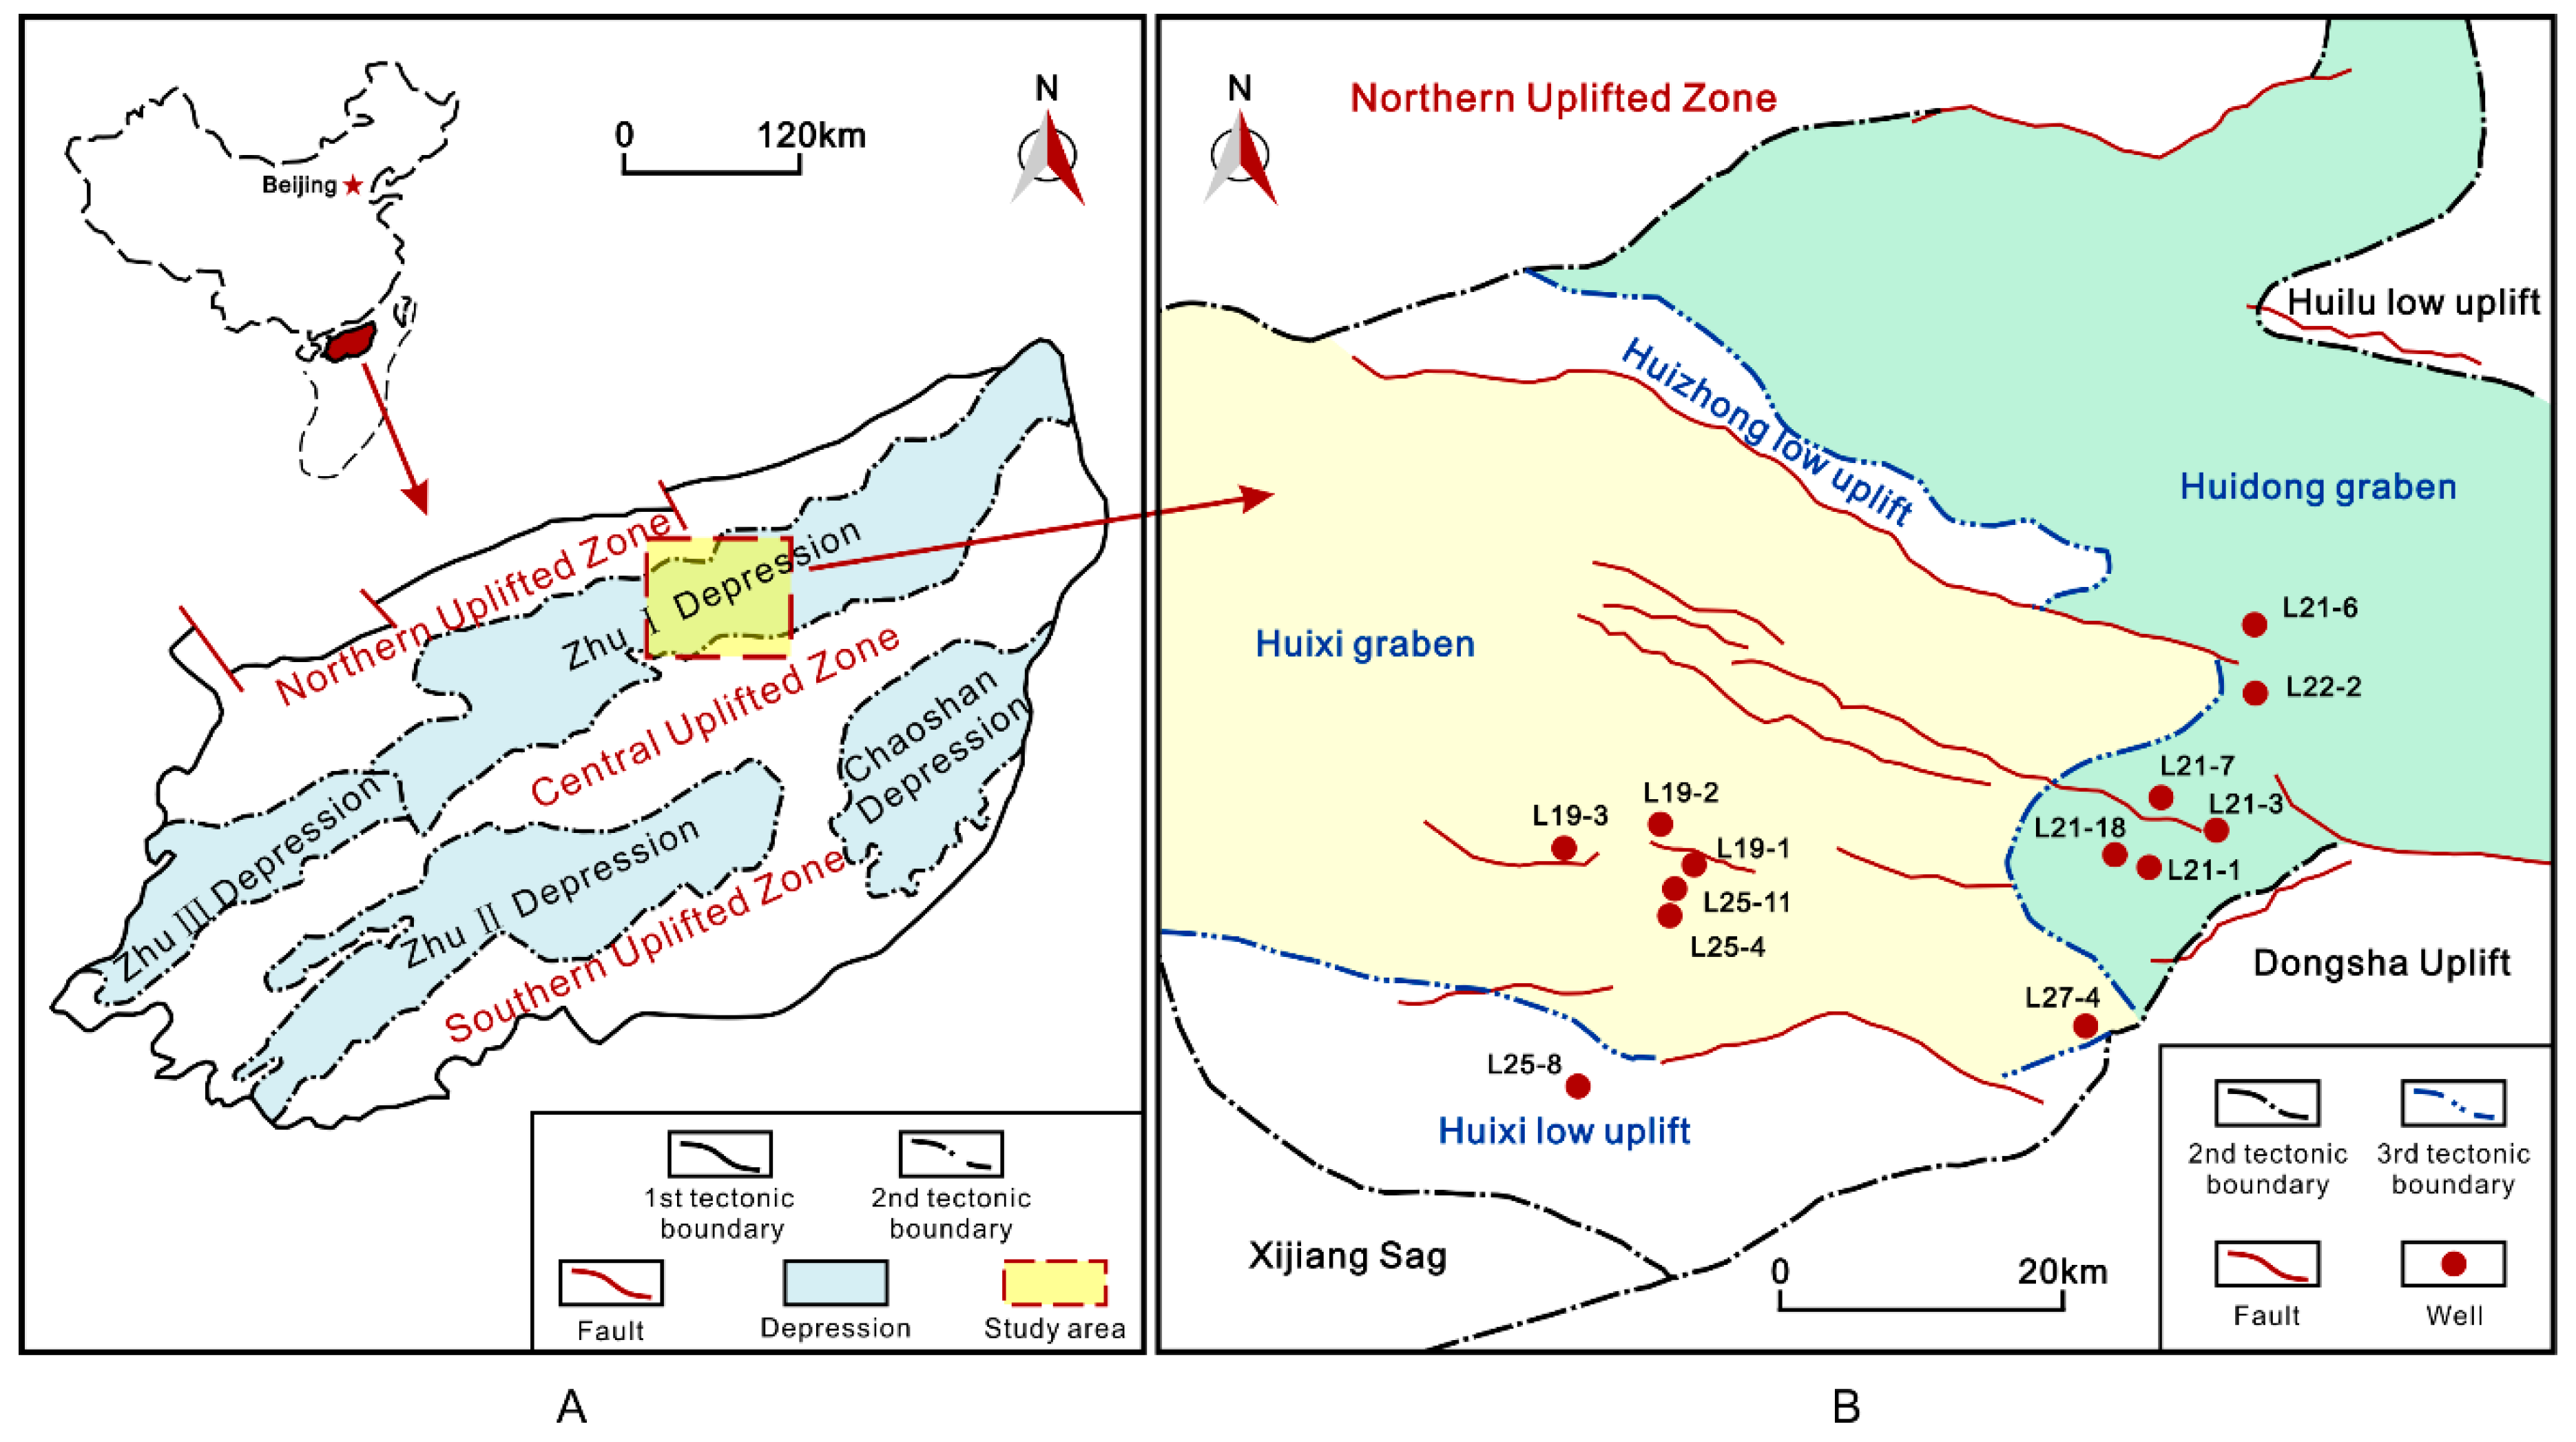
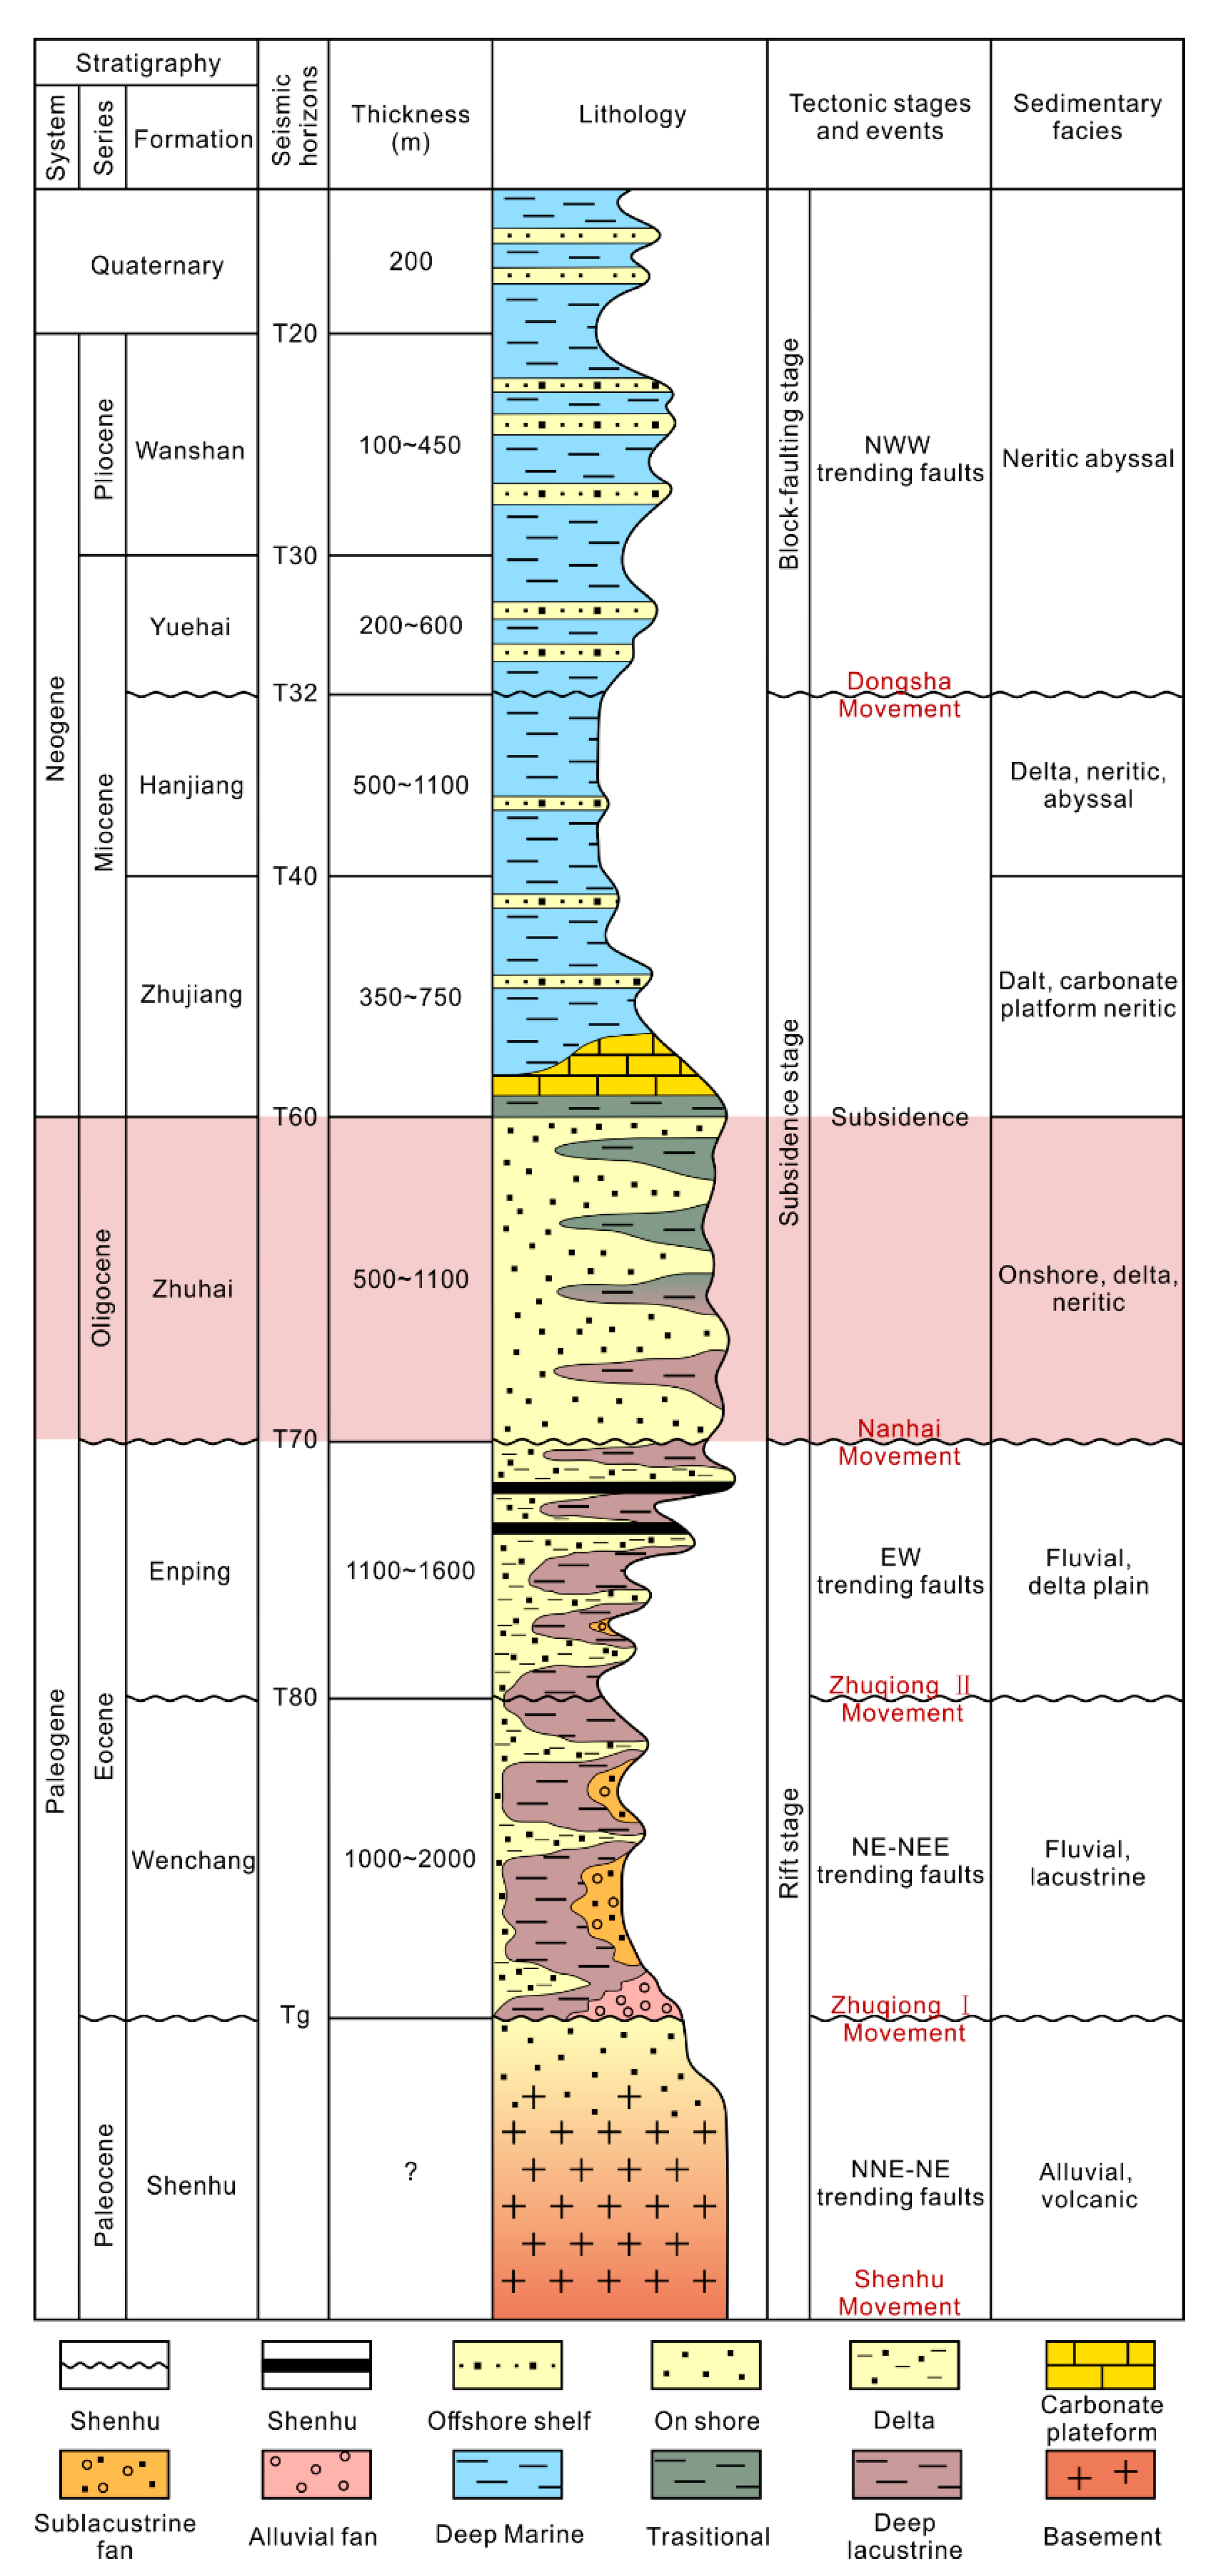
2. Geological Background

The Pearl River Mouth Basin is a Mesozoic-Cenozoic sedimentary basin located in the northern South China Sea (Figure 1A). It is a typical passive continental margin basin developed on a heterogeneous basement. From north to south, the basin can be divided into five primary NE trending tectonic units: The Northern Uplift Belt, Northern Depression Belt (containing the Zhu I Depression and Zhu III Depression), Central Uplift Belt, Southern Depression Belt (containing the Zhu II Depression and Chaoshan Depression), and Southern Uplift Belt [33,39,44]. All the tectonic units can be further divided into smaller units. The Huizhou Sag, located in the middle of the Zhu I Depression, is composed of four small units: the Huixi low uplift, Huixi graben, Huizhong low uplift, and Huidong graben [43] (Figure 1B).
The Zhuhai Formation formed in the Cenozoic era, during which the sedimentation in the Huizhou Depression was characterized by a continental-marine transition (Figure 2). Since the Late Cretaceous, the Pearl River Mouth Basin has mainly gone through three tectonic evolutionary stages: the rift stage (Palaeocene to Oligocene), subsidence stage (Late Oligocene to Early Miocene), and block faulting stage (since the Miocene). As a result, a bilayer structure formed with a lower fault-characterized part and an upper depression-characterized part [46,47,48,49,50].
The rifting stage is characterized by the Shenhu Movement and Zhuqiong Movement (two episodes), and as a result, NNE-NE-trending and NE-NEE-trending faults developed widely. Moreover, the Shenhu Formation, Wenchang Formation, and Enping Formation were deposited during this stage [41,51]. During the subsidence stage which is mainly characterized by the Nanhai Movement, regional thermal subsidence and deposition of the Zhuhai Formation, Zhujiang Formation, and Hanjiang Formation. The block faulting stage is characterized by the Dongsha Movement, which induced extensive fault activities and the Miocene Yuehai Formation to the Quaternary formations were deposited in this stage [52] (Figure 2).

3. Methods

3.1. Sampling and Analytical Techniques

All the samples were collected from the Zhuhai Formation in the research area (Huizhou, China), covering almost all the exploratory wells drilled into the Zhuhai Formation. These wells were from the L19, L21, L22, L25 and L27 Well Areas. A total of 117 small core samples were thin-sectioned (0.03 mm) for microscopic observation, and all of these small core samples were injected with blue epoxy to help differentiate between the pores and grains. Additionally, half of each thin section was stained with Alizarin Red S for observation of calcareous cements. Among the 117 thin sections, 24 were stained with potassium ferricyanide to help verify feldspar types. A total of 7 small core samples were thin-sectioned (0.05 mm) for inclusion analysis.
The analytical techniques used in this research include scanning electron microscopy (SEM), cathodoluminescence, fluorescence analysis, and fluid inclusion analysis. All the analytical techniques were performed at the State Key Laboratory of Petroleum Resources and Prospecting, China University of Petroleum (Beijing, China). SEM (instrument type: Phenom XL, Beijing, China) was used to observe pore structure and distinguish minerals; cathodoluminescence (instrument type: BII CLF-2, Beijing, China) was performed on thin sections to analyse mineral types and contact types; fluorescence analysis (instrument type: XSP-BM21AY, Beijing, China), which can distinguish hydrocarbon maturity, was employed to analyse the hydrocarbon charging stages; inclusion analysis (instrument type: THMSG600, Beijing, China) was conducted to measure the homogenization temperature of aqueous two-phase inclusions (maximum temperature at which contents in inclusions can remain in gas–liquid two-phase).
The grain size, areal porosity, and pore type data were collected through image analysis with the assistance of NASE Geo software (V.18.3.6.1, SIENCE, Suzhou, China). NASE Geo is image analysis software that can semi-automatically analyse areal porosity and grain size. Regarding the areal porosity, this software can distinguish pores from grains according to their differences in colour, as can Photoshop (the colour tolerance can be adjusted by the researcher). Furthermore, NASE Geo can calculate the areal porosity of different types of pores based on the delineation of pore edges by the researcher. Grain size analysis can automatically be executed after the delineation of the grain edge by the researcher, and the standard used is ASTM E 1382-97 (Standard Test Methods for Determining Average Grain Size Using Semiautomatic and Automatic Image Analysis). Moreover, more than 300 grains were delineated in at least four micrographs when performing the grain size image analysis and areal porosity analysis. The classification of sandstone was performed by using the classification of Folk, et al. [55].

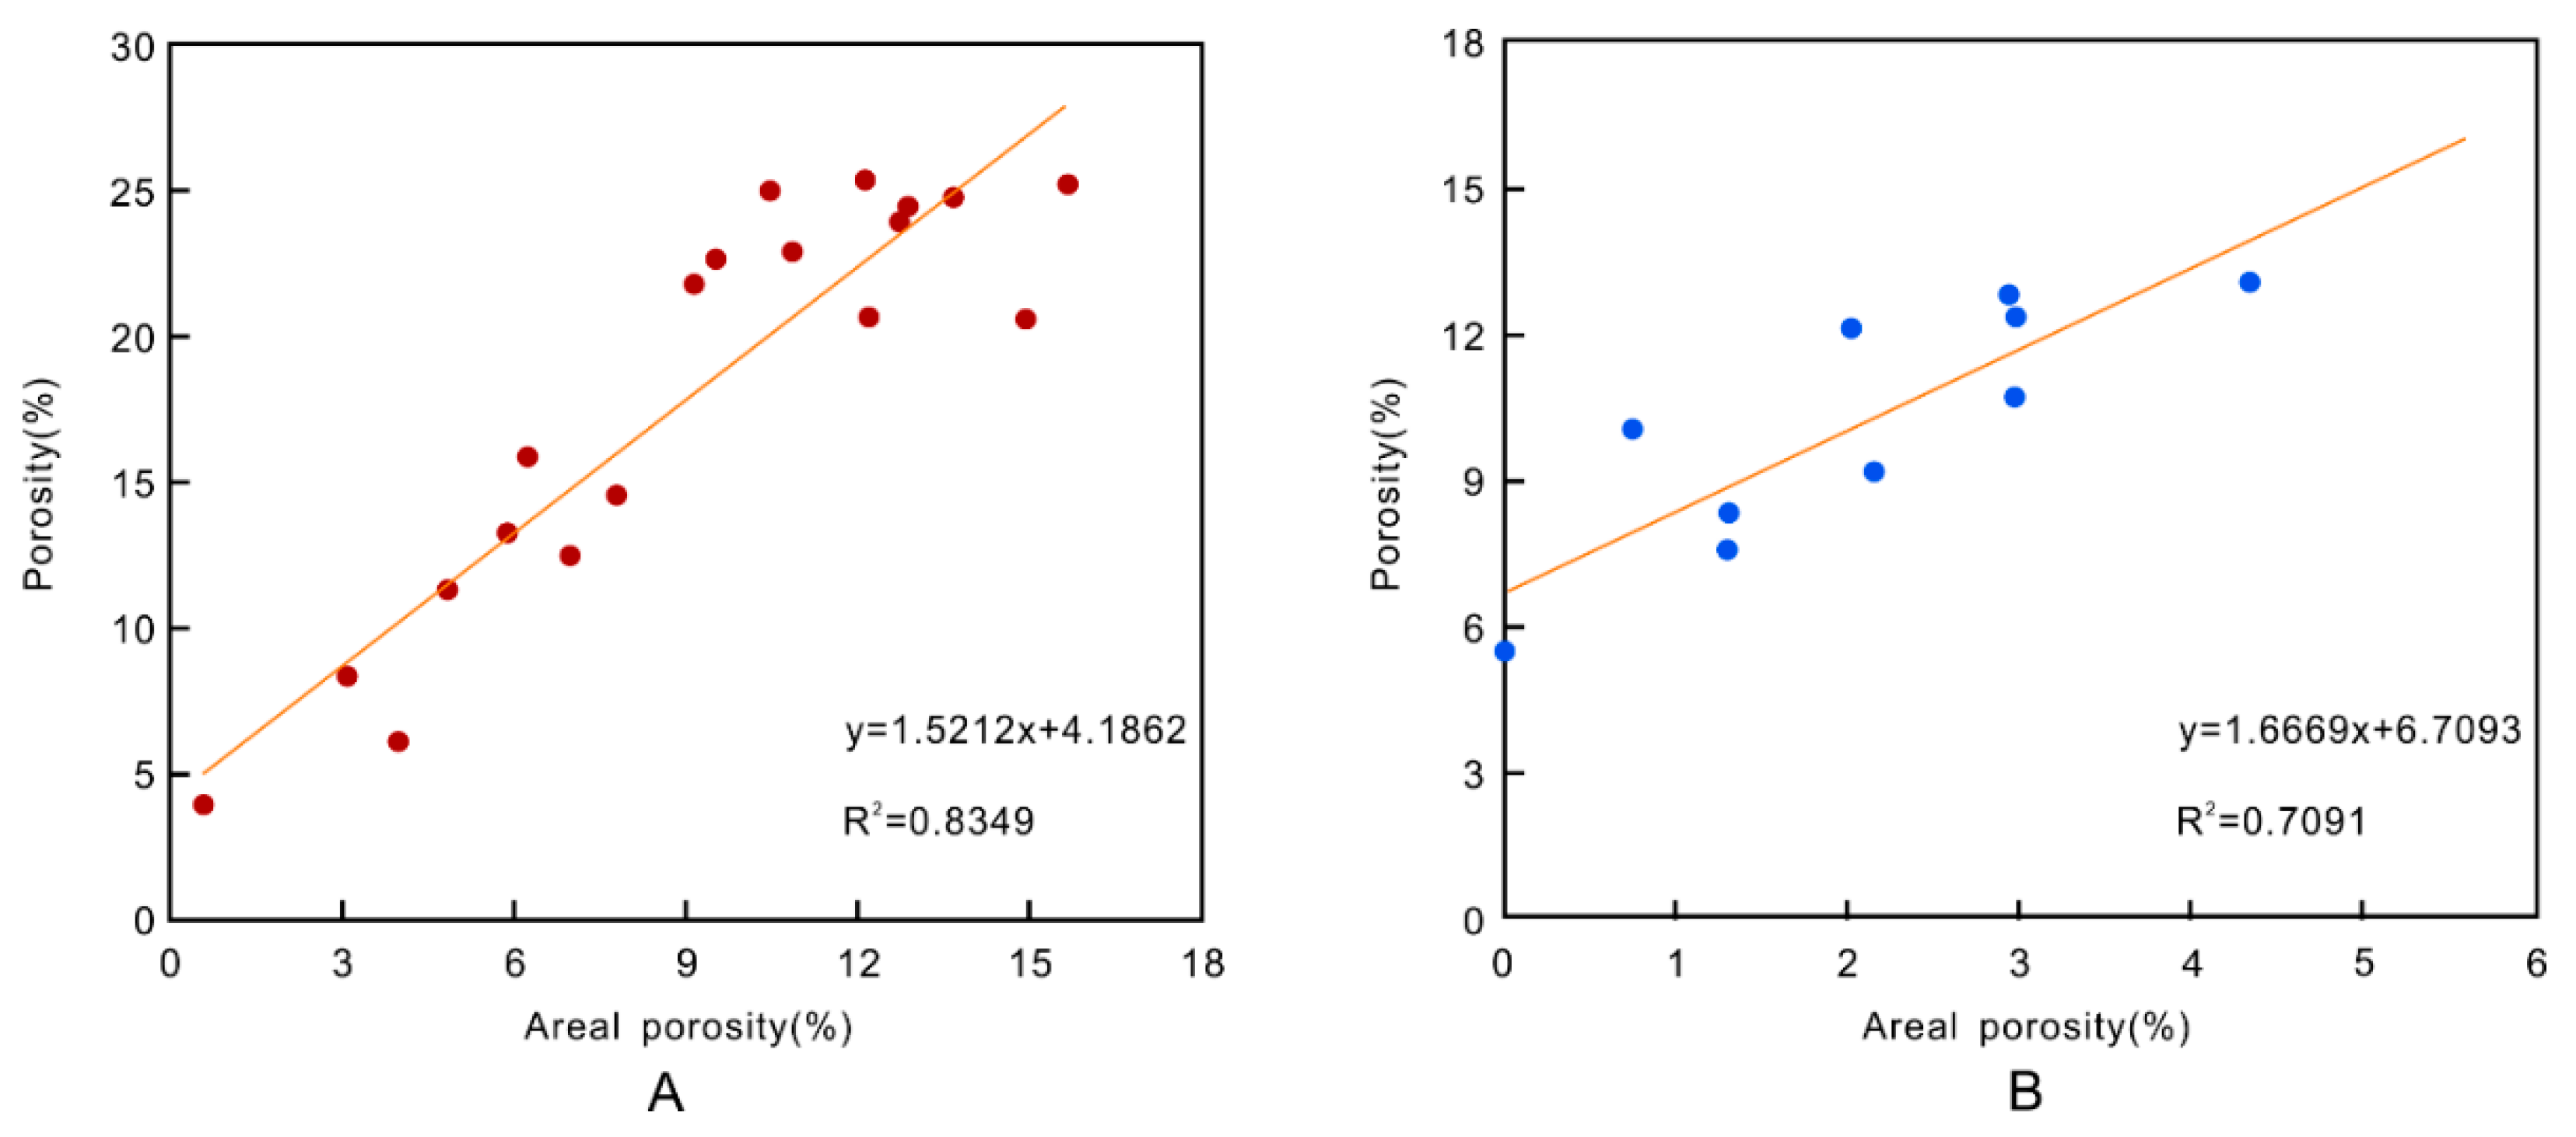
3.2. Reconstruction of Porosity Evolution (PIBS Method)

3.2.1. Fitting of Porosity

As mentioned above, scholars can find a suitable mathematical model to fit the relation between areal porosity (pore area measured from thin sections) and true porosity (porosity measured from core samples). In some areas, porosity is a function of a power of areal porosity [24]; in other areas, porosity is a function of the index of areal porosity [23]; in most cases, porosity is linearly related to areal porosity [21,25]. In the present work, due to the scarcity of core samples in the research area, most samples are only thin-sectioned for micro-observation without true porosity testing. To quantitatively determine the porosity evolution of samples, first, the relationship between areal porosity and true porosity was analysed via samples in which the true porosity was measured. Then, the porosity of all the other samples was fitted with this function.

3.2.2. Calculation of Porosity Evolution

1. Initial Porosity
According to previous studies on the initial porosity of clastic rock [7,56], the calculation of the initial porosity recovery is as follows:
Φ0 = 20.91 + 22.90/S0
S0 = (P25/P75)1/2
where Φ0 = initial porosity; S0 = Trask sorting coefficient; P25 = grain size of the point in the grain size cumulative probability curve with a cumulative content of 25%; and P75 = grain size of the point in the grain size cumulative probability curve with a cumulative content of 75%.
2. Porosity reduction due to compaction
The effects of compaction on porosity (ΦL) can be calculated by using Equation (3):
ΦL = Φ0 − {[(Pi + Pcd)/Pa] × Φ + C}
where Pi = areal porosity of the intergranular pores; Pcd = areal porosity of the dissolution pores in the cements; Pa = areal porosity; Φ = fitted porosity or true porosity; and C = cement content.
1. Porosity reduction due to cementation
The effects of cementation on porosity (ΦCL) can be calculated by using Equation (4):
ΦCL = (Pcd/Pa) × Φ + C
2. Porosity enhancement due to dissolution
The effects of dissolution on porosity (ΦD) can be calculated by using Equation (5):
ΦD = [(Pid + Pgd + Pcd)/Pa] × Φ
where Pid = areal porosity of the intergranular dissolution pores and Pgd = areal porosity of the intragranular dissolution pores.

4. Results

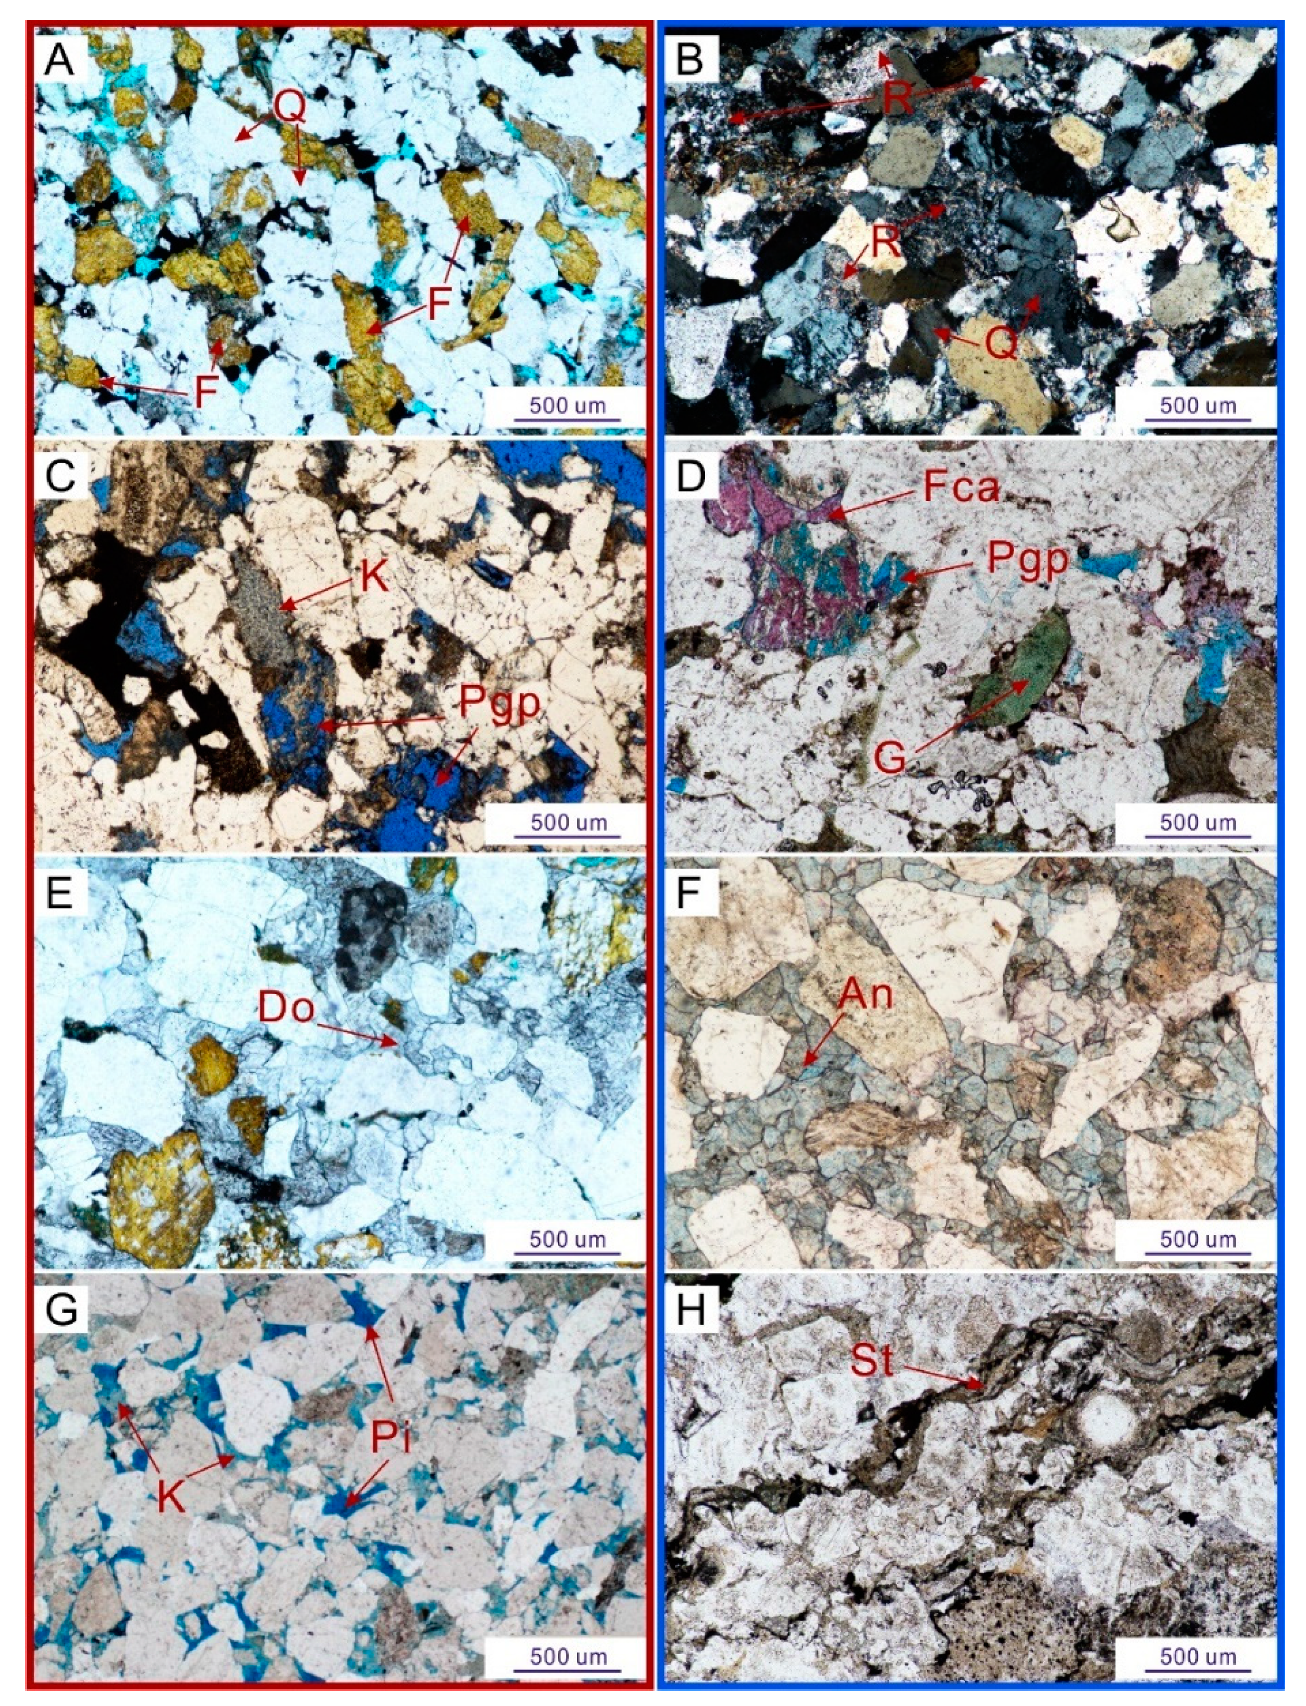
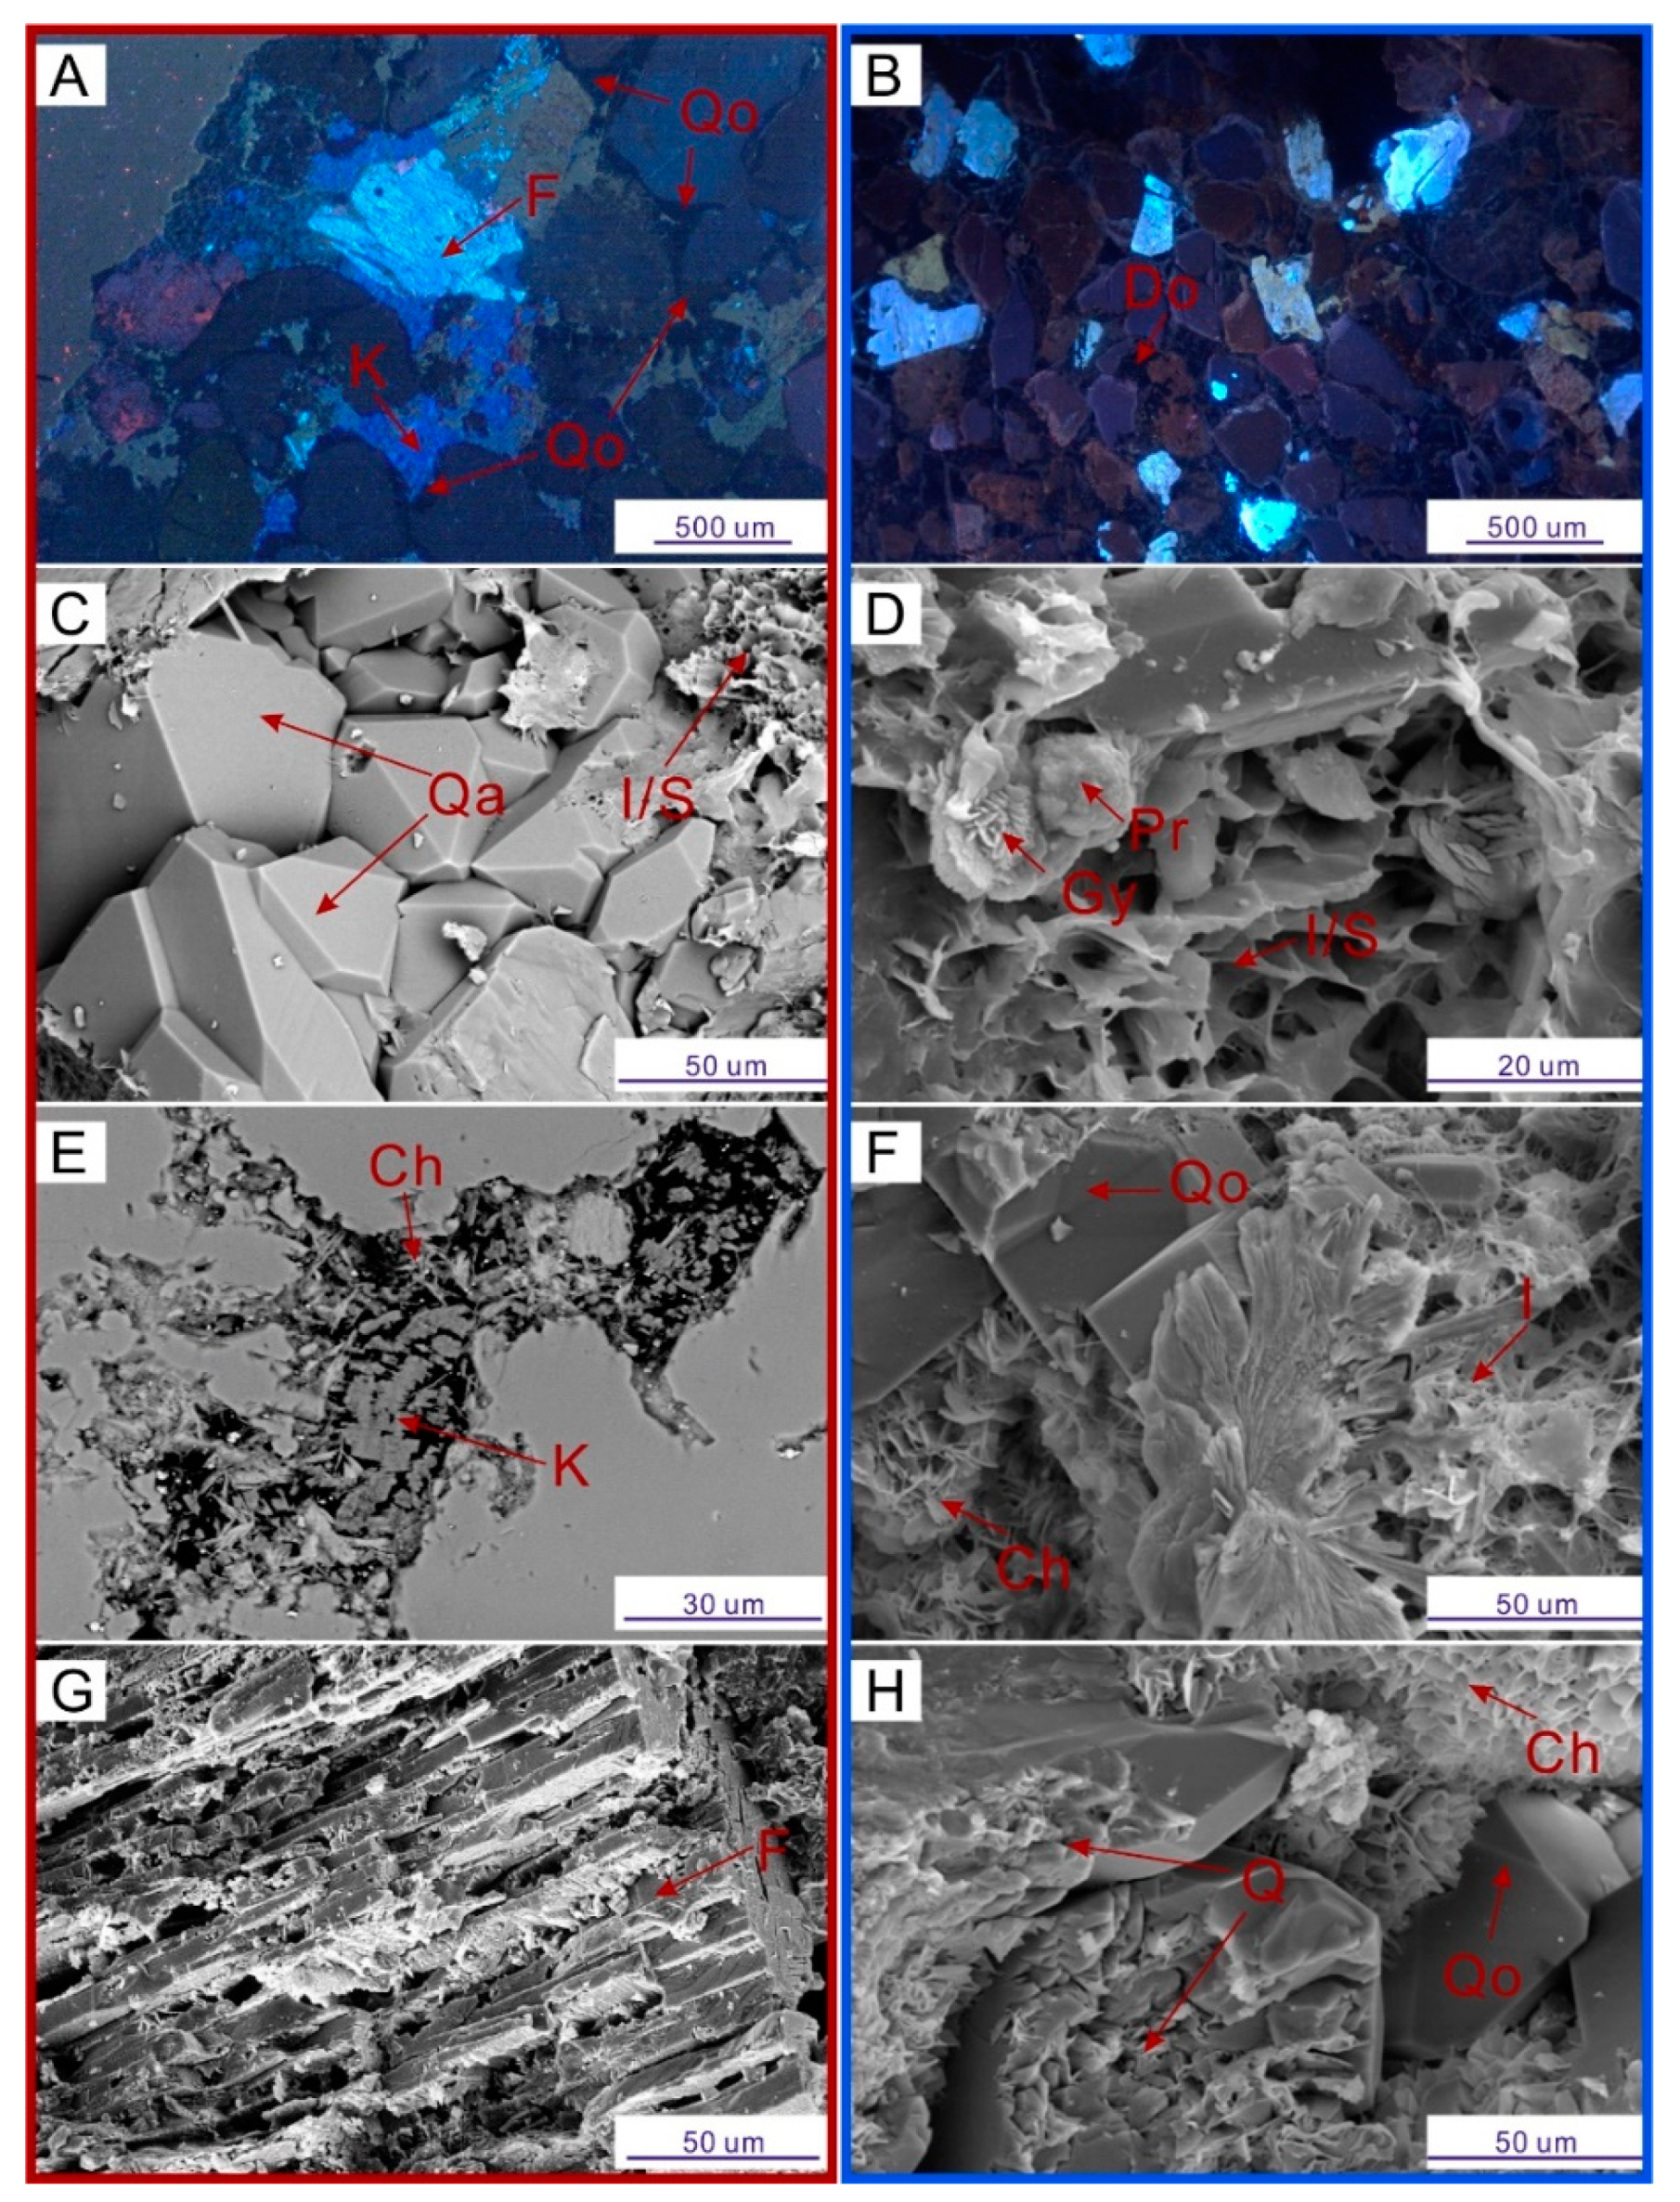
4.1. Petrographical Characteristics

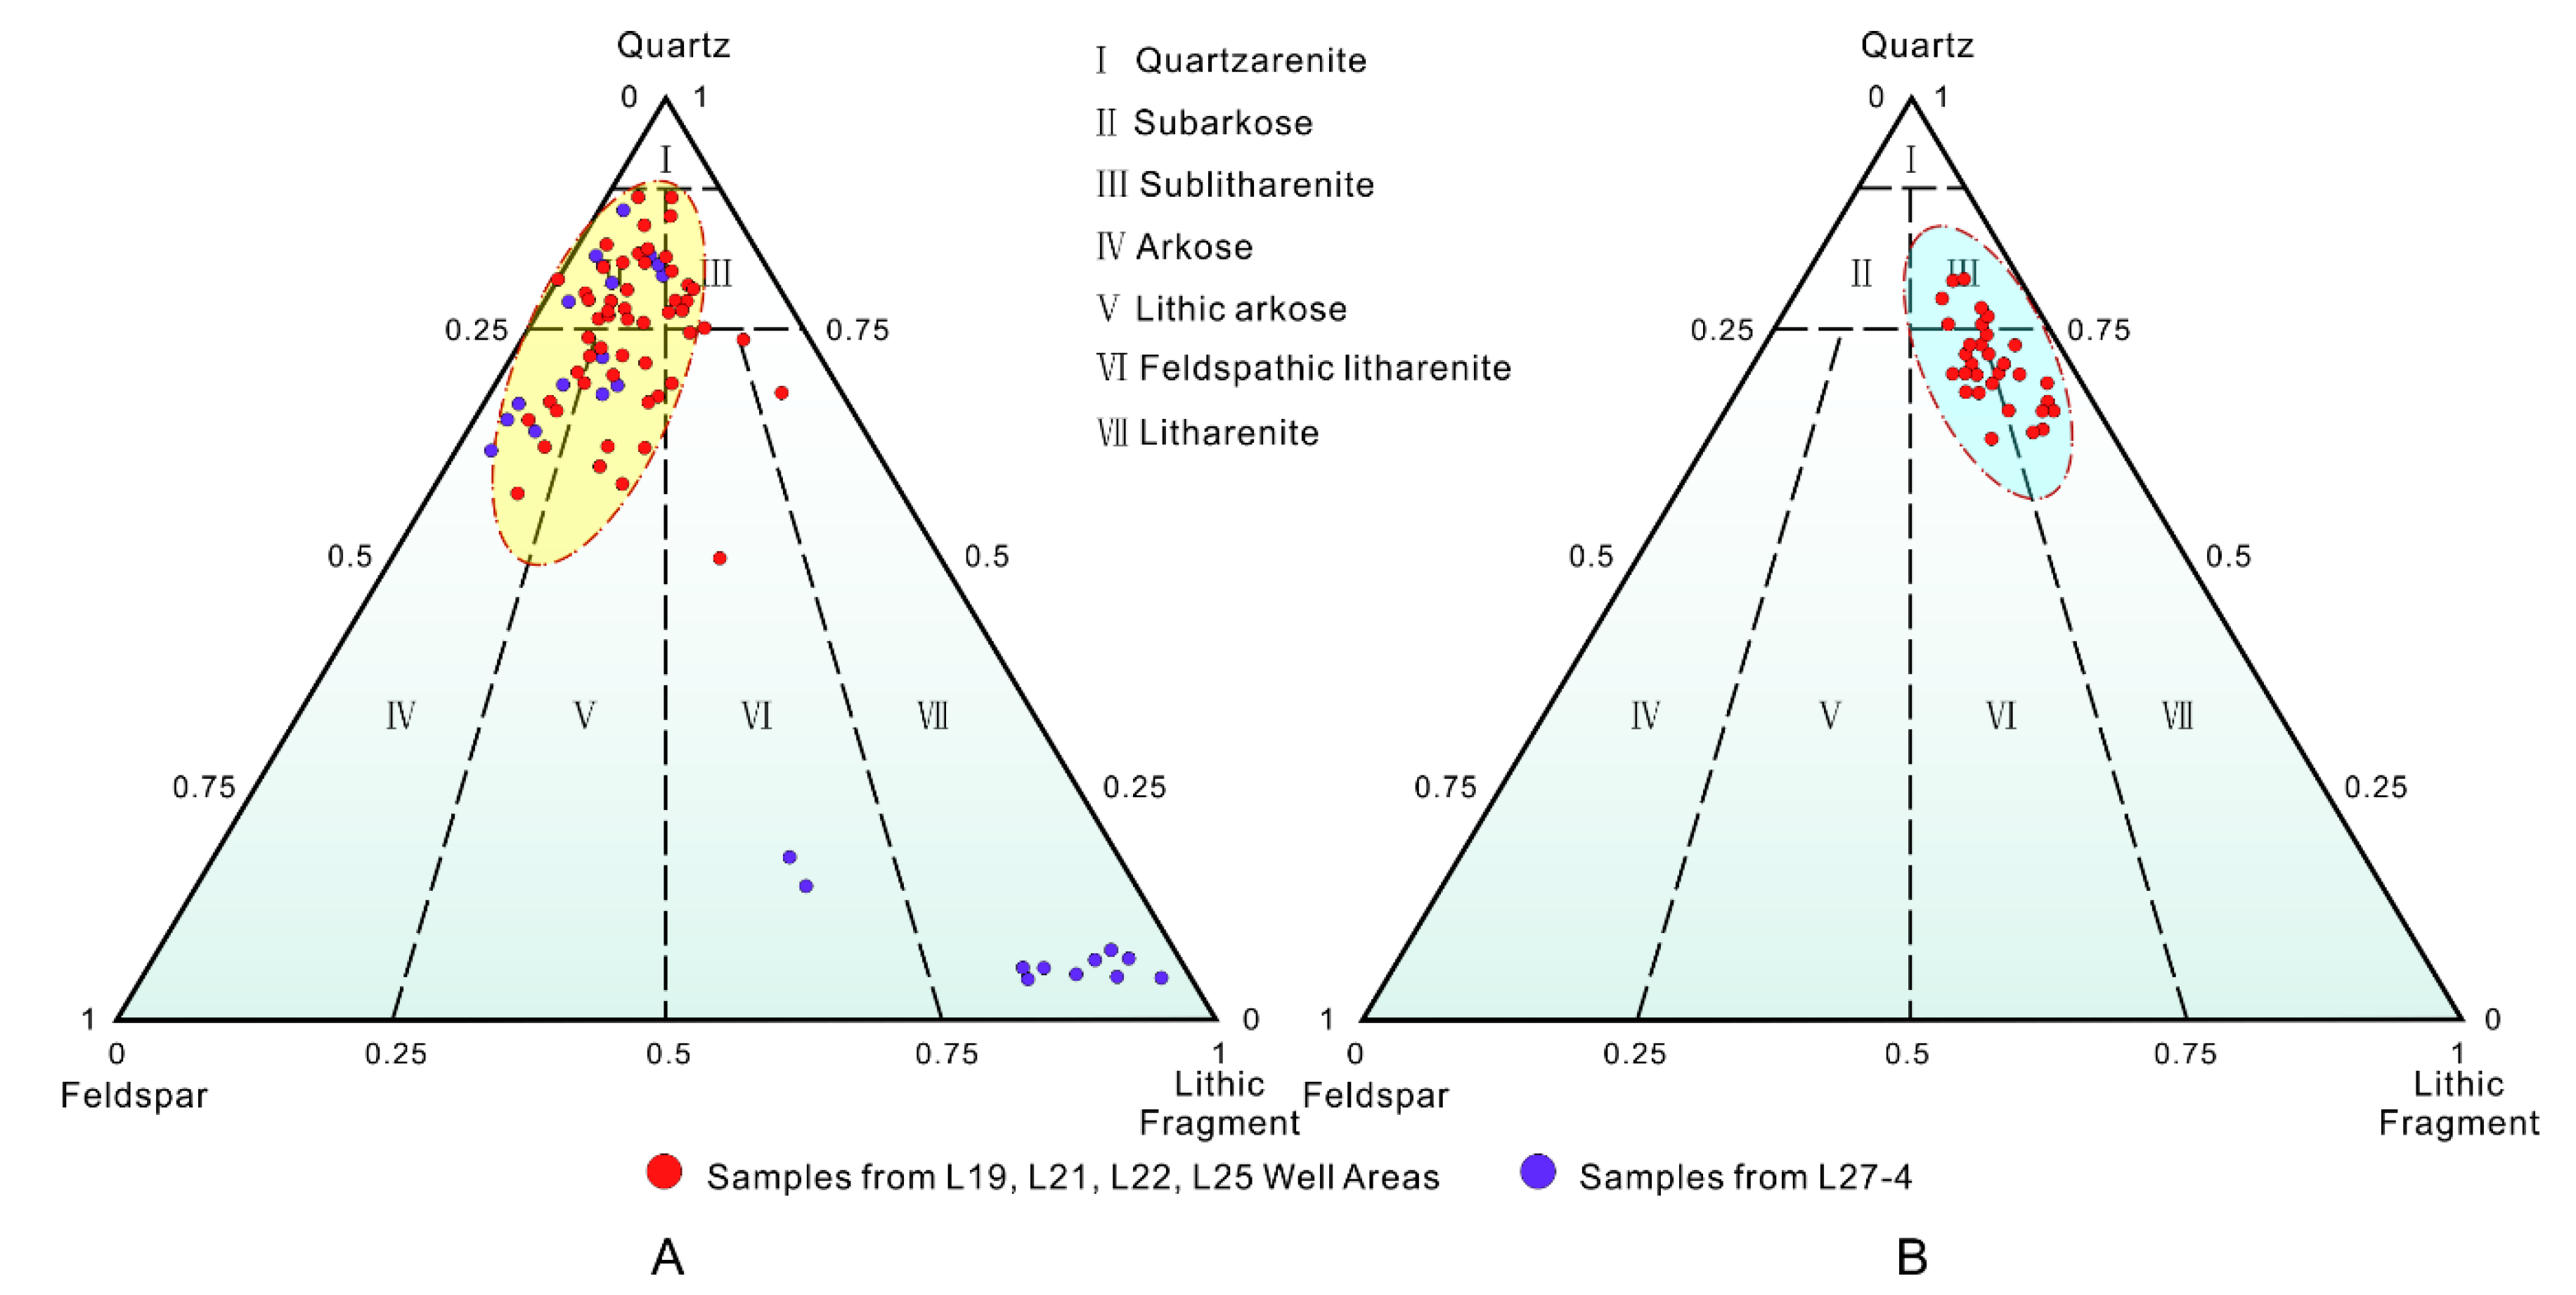
4.1.1. Detrital Composition

The sandstone reservoirs of the Zhuhai Formation in the Huizhou Sag are typical clastic reservoirs. Although quartz is the dominant mineral and its content is similar (73.1 ± 7.3%) in Huixi and Huidong, the detrital composition is different in the two areas.
Huixi is rich in feldspar (16.2 ± 6.8%), but the lithic fragment content is relatively low (9.7 ± 5.6%) (Figure 3A and Figure 4A). Moreover, the main sandstone types in Huixi are subarkose, arkose, and lithic arkose sandstones. In contrast, Huidong is relatively rich in lithic fragments (22.4 ± 4.6%) and relatively poor in feldspar content (6.8 ± 2.0%) (Figure 3B and Figure 4B). Furthermore, granular glauconite can be observed in several wells in Huidong (Figure 4D). Sublitharenite, feldspathic litharenite, and litharenite sandstone are the main sandstone types in Huidong. Samples from L27-4 show different petrographic characteristics (Figure 3A), which will be discussed later.

4.1.2. Detrital Texture

In general, samples of the Zhuhai Formation are characterized by medium to coarse grain sizes, moderate sorting, and long contacts. However, samples in Huixi are slightly finer (0.4 ± 0.2 mm) with better sorting, and the proportion of samples with medium or larger grains is 71% (Figure 5). Moreover, the contact types between grains are mainly point contacts or long contacts (Figure 4A,G). The grain size of samples in Huidong is slightly coarser (0.5 ± 0.2 mm), and sorting is relatively weak, the proportion of samples with medium or larger grains accounts for 49% (Figure 5). However, the grains are more tightly packed, and the primary contact types are long and concave-convex contacts (Figure 4B,H).

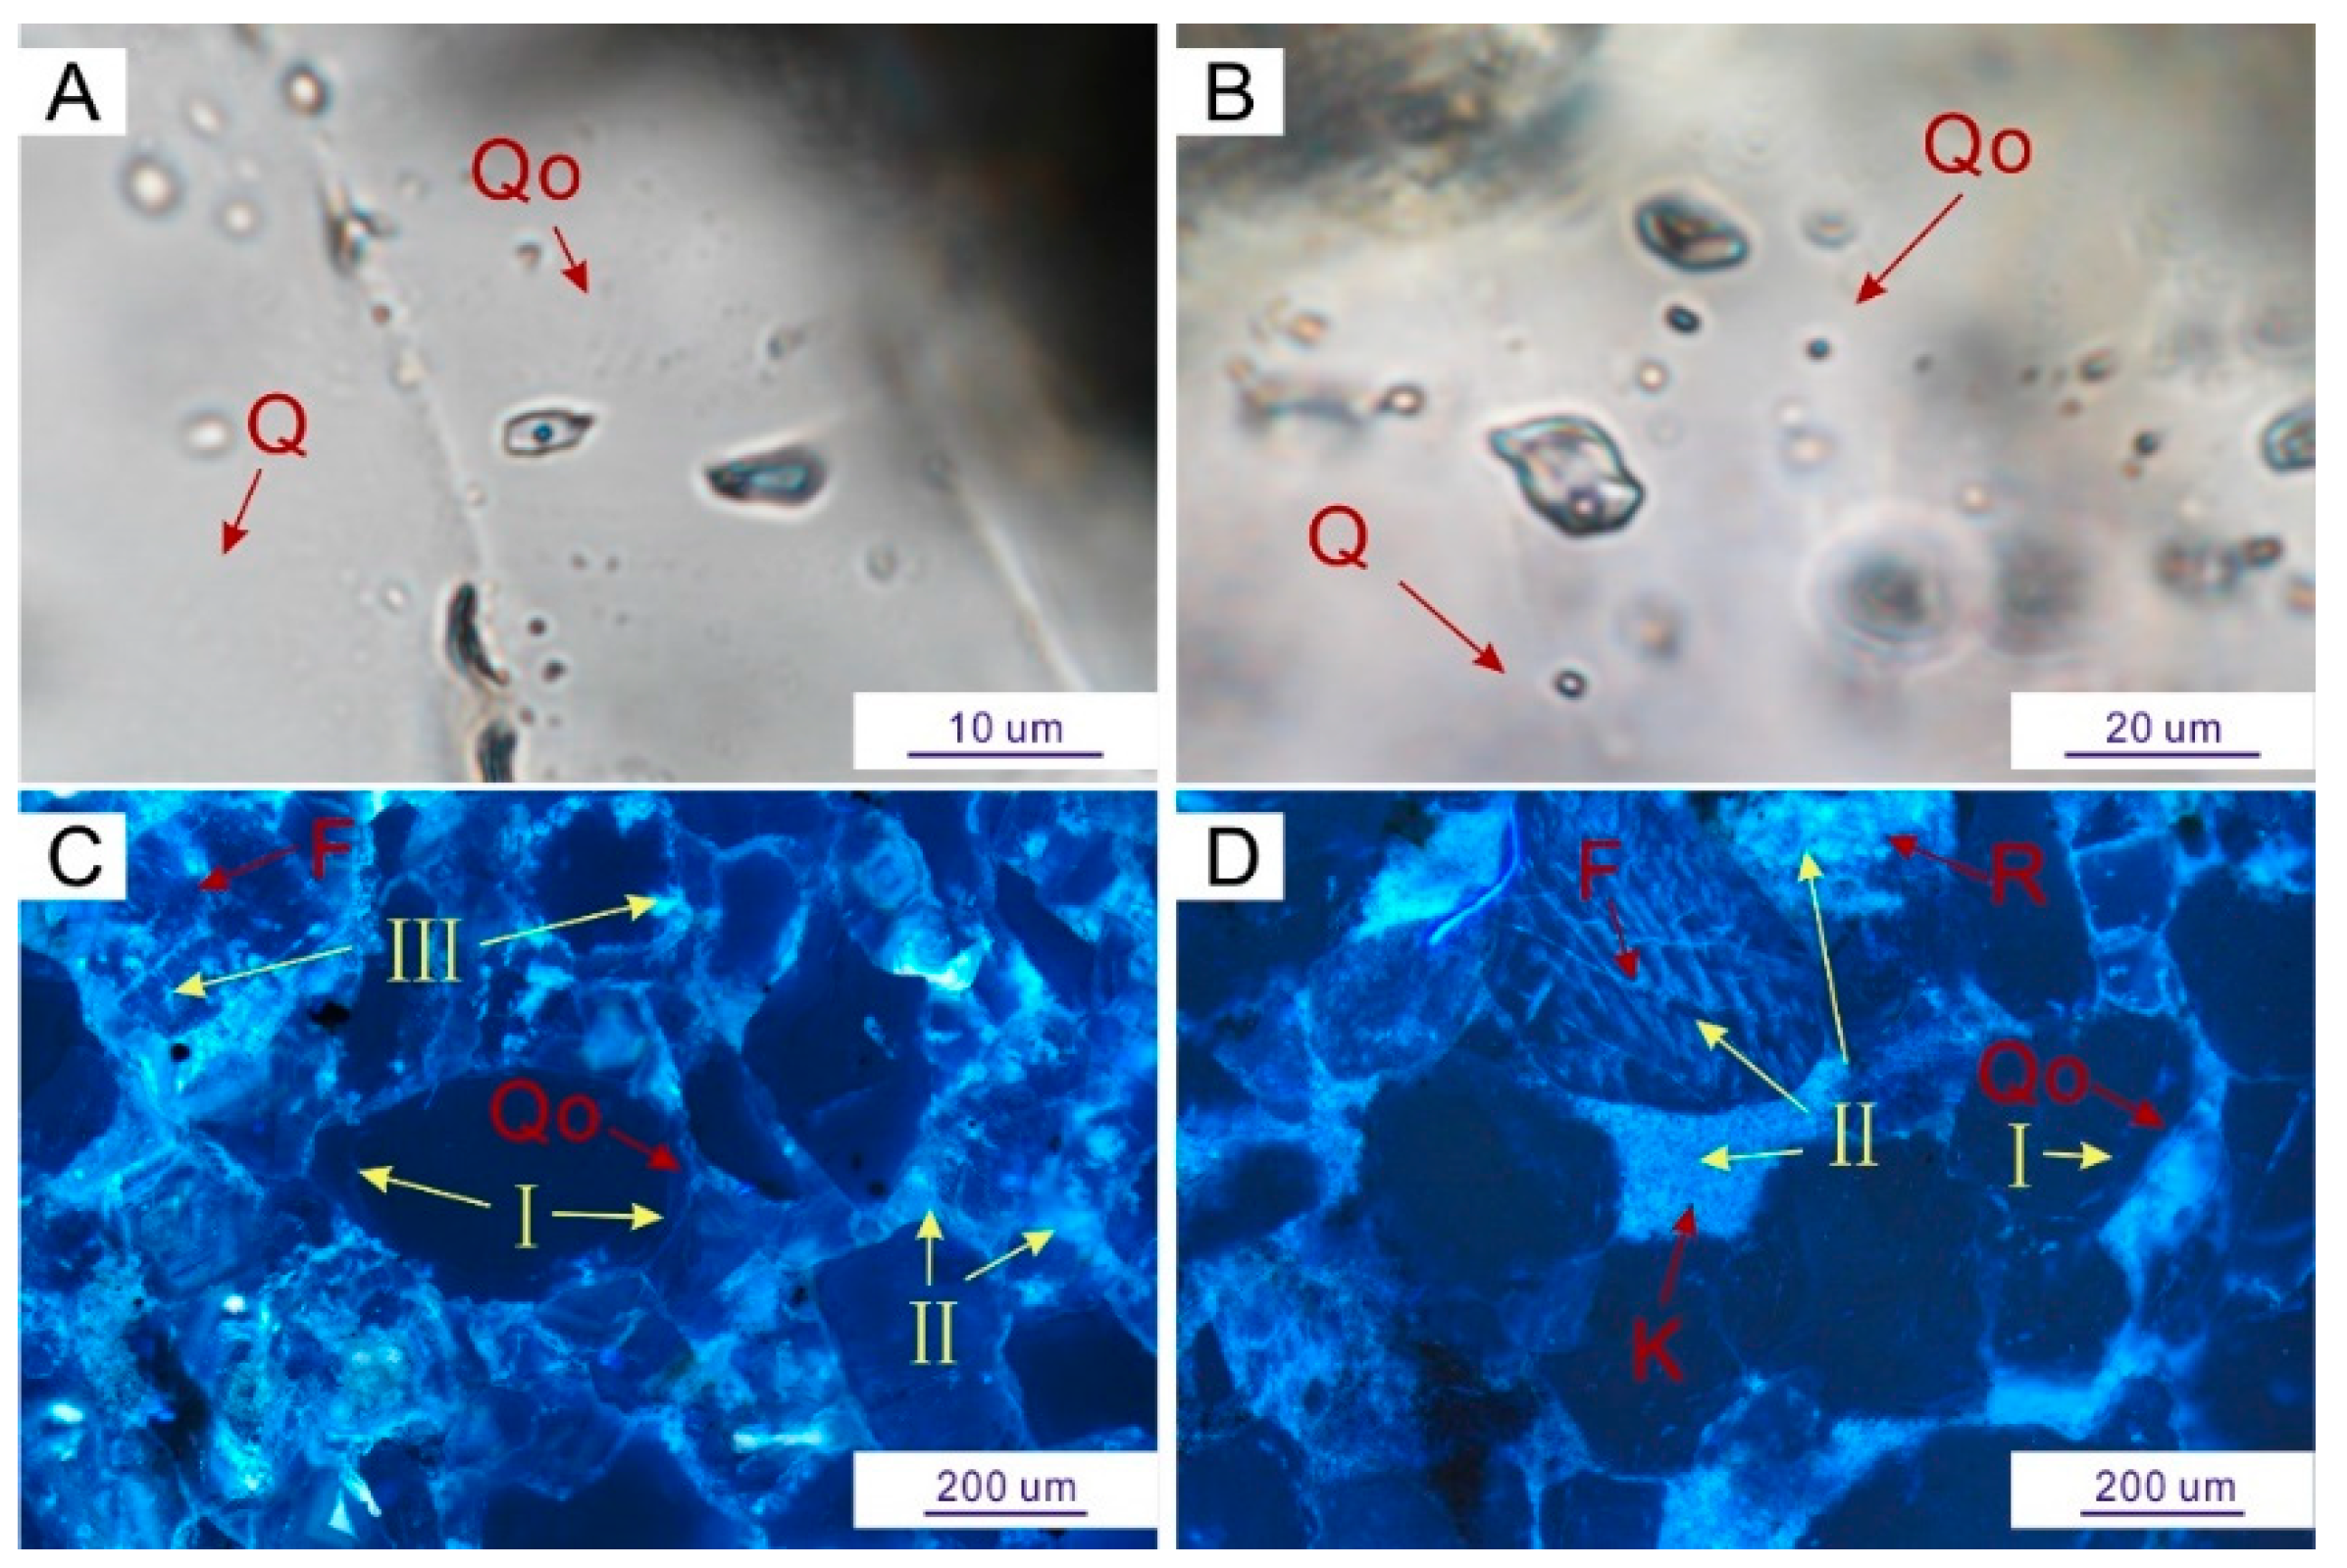
4.2. Fluid Inclusion Analysis

In Huixi, the homogenization temperature of primary inclusions found in quartz overgrowths (Figure 6A,B) ranges from 114.1 °C to 120.9 °C with an average of 117.5 ± 4.5 °C. However, this temperature ranges from 143.5 °C to 144.5 °C, with an average of 144 ± 0.5 °C in Huidong (Table 1).

4.3. Fluorescence Analysis

The fluorescence analysis results show that there were at least three phases of hydrocarbon charging in the target formation. The first phase was weak and small-scale blue fluorescence mainly observed between quartz grains and quartz overgrowths; the second phase was stronger, causing blue fluorescence to appear between grains; the third phase resulted in blue-white fluorescence located in the dissolution pores of feldspar and lithic fragments, and in the intercrystallite pores of kaolinite (Figure 6C,D).

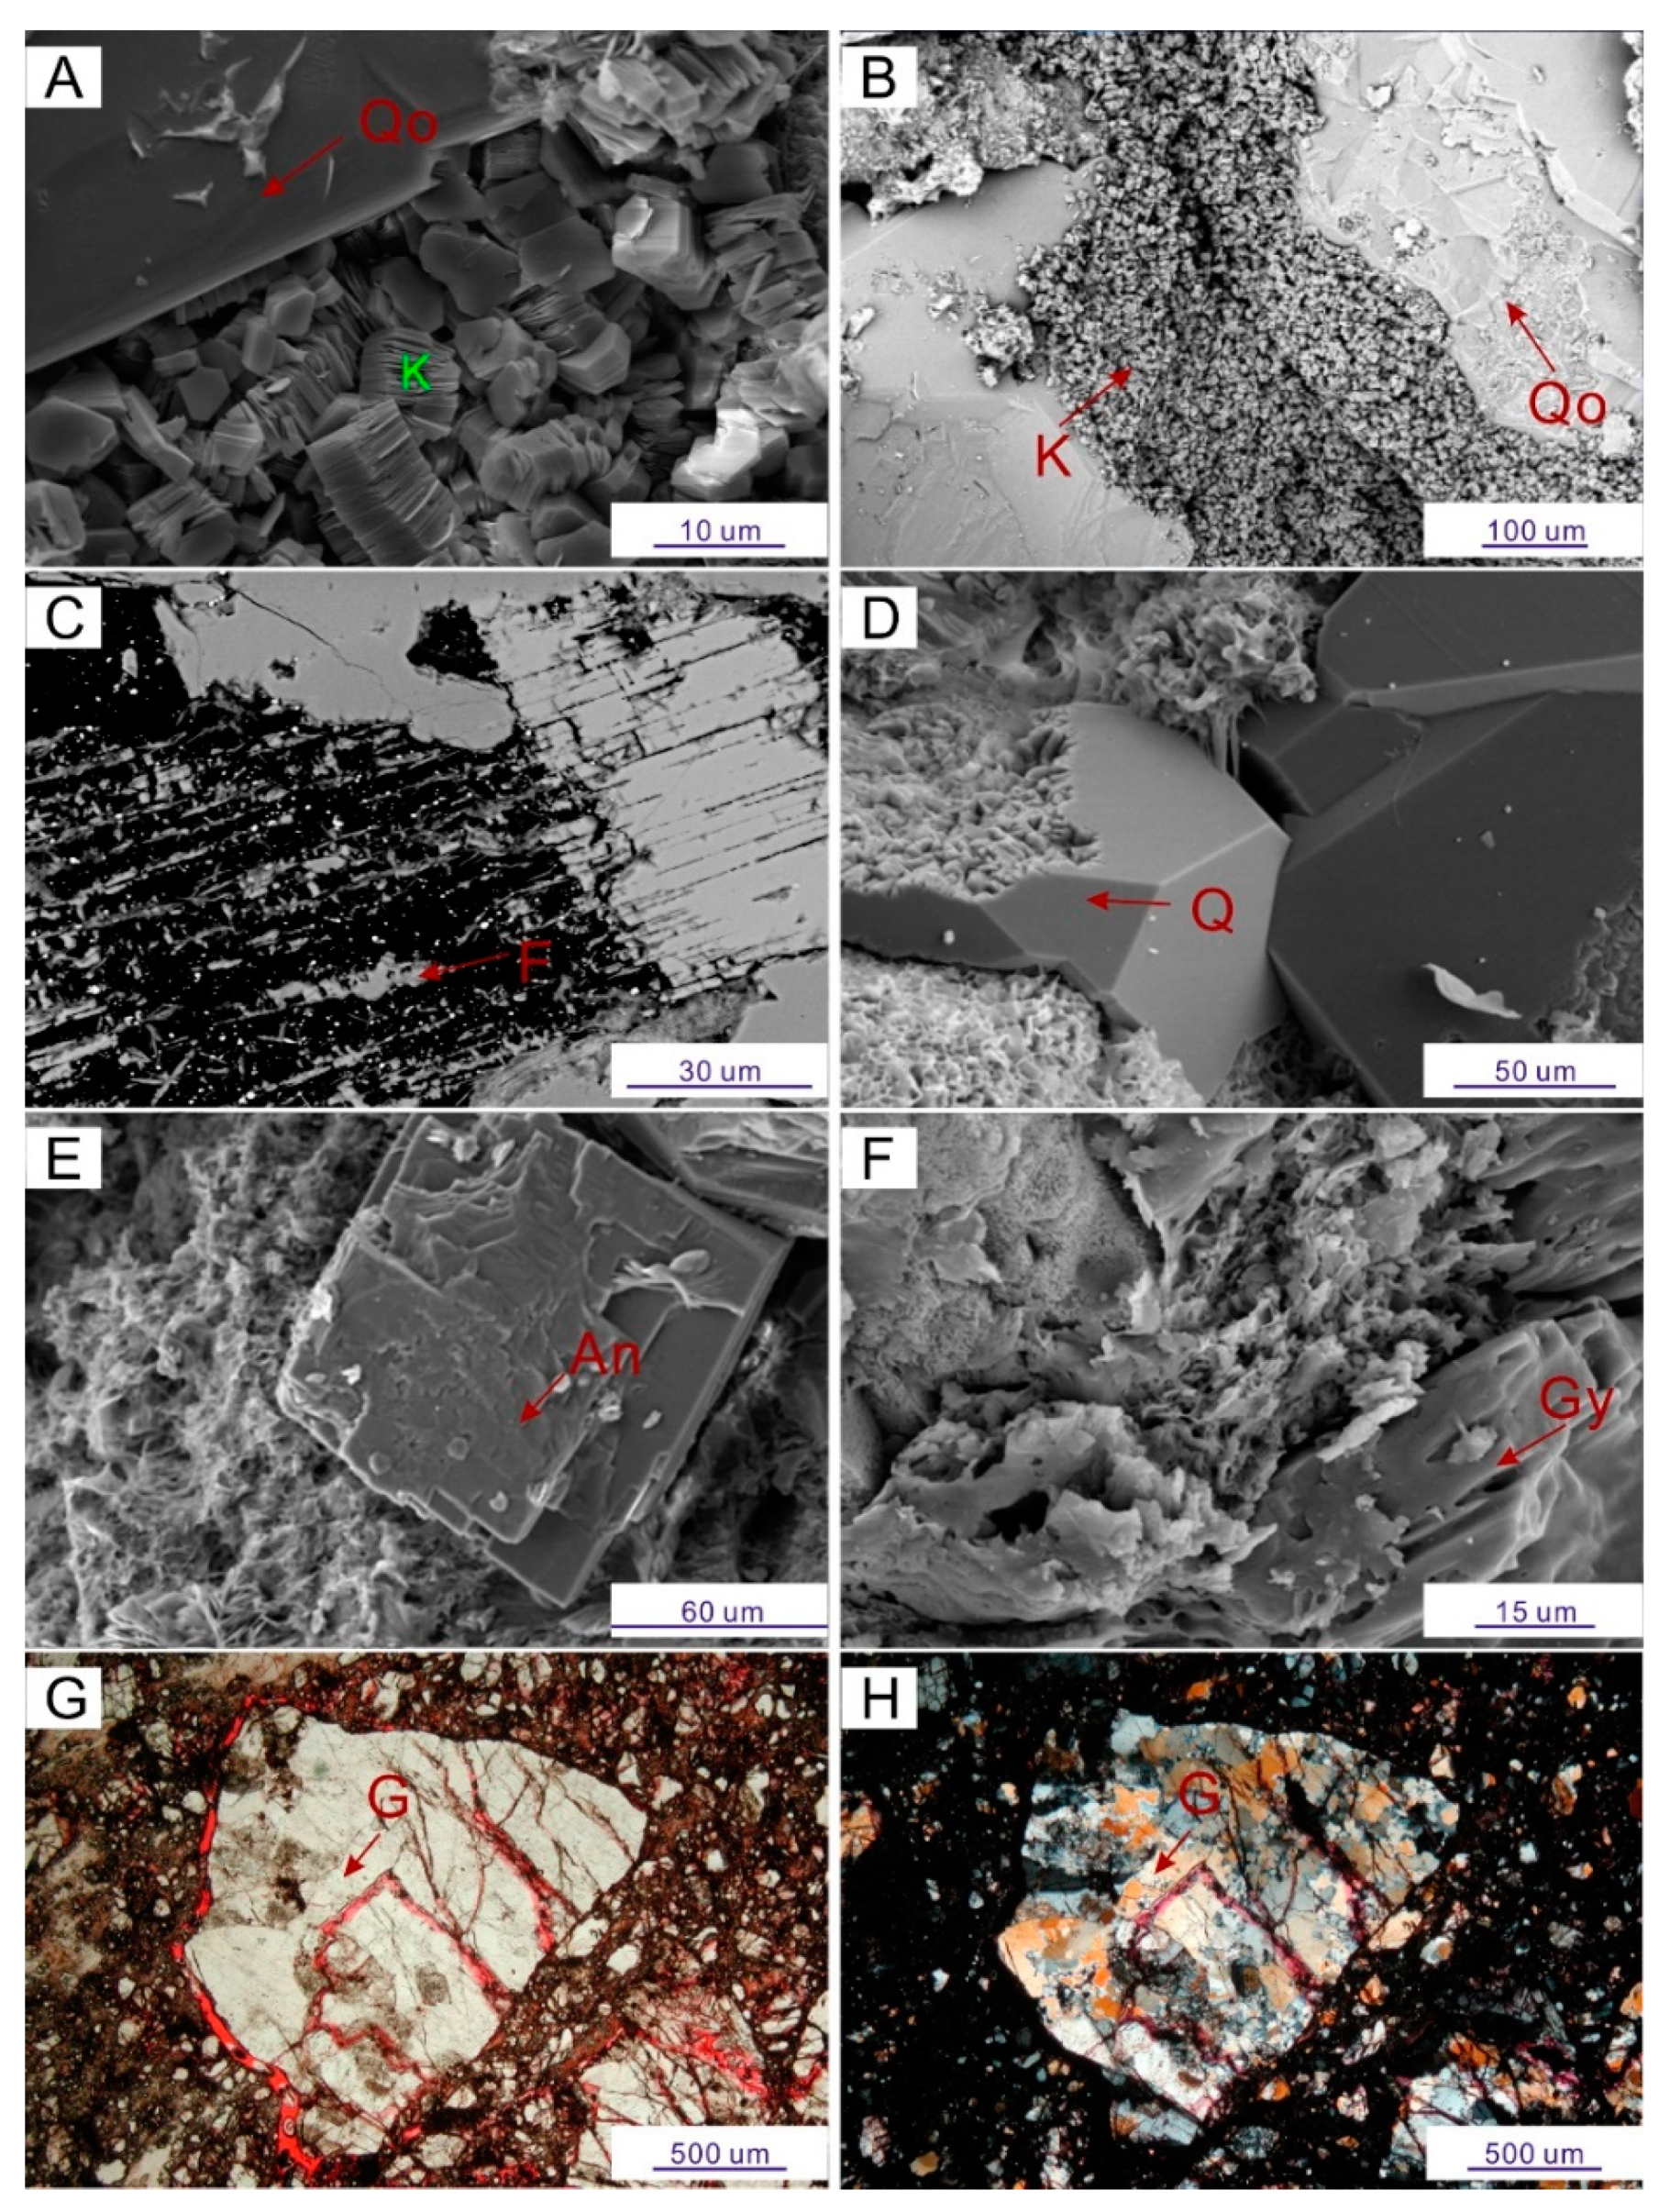
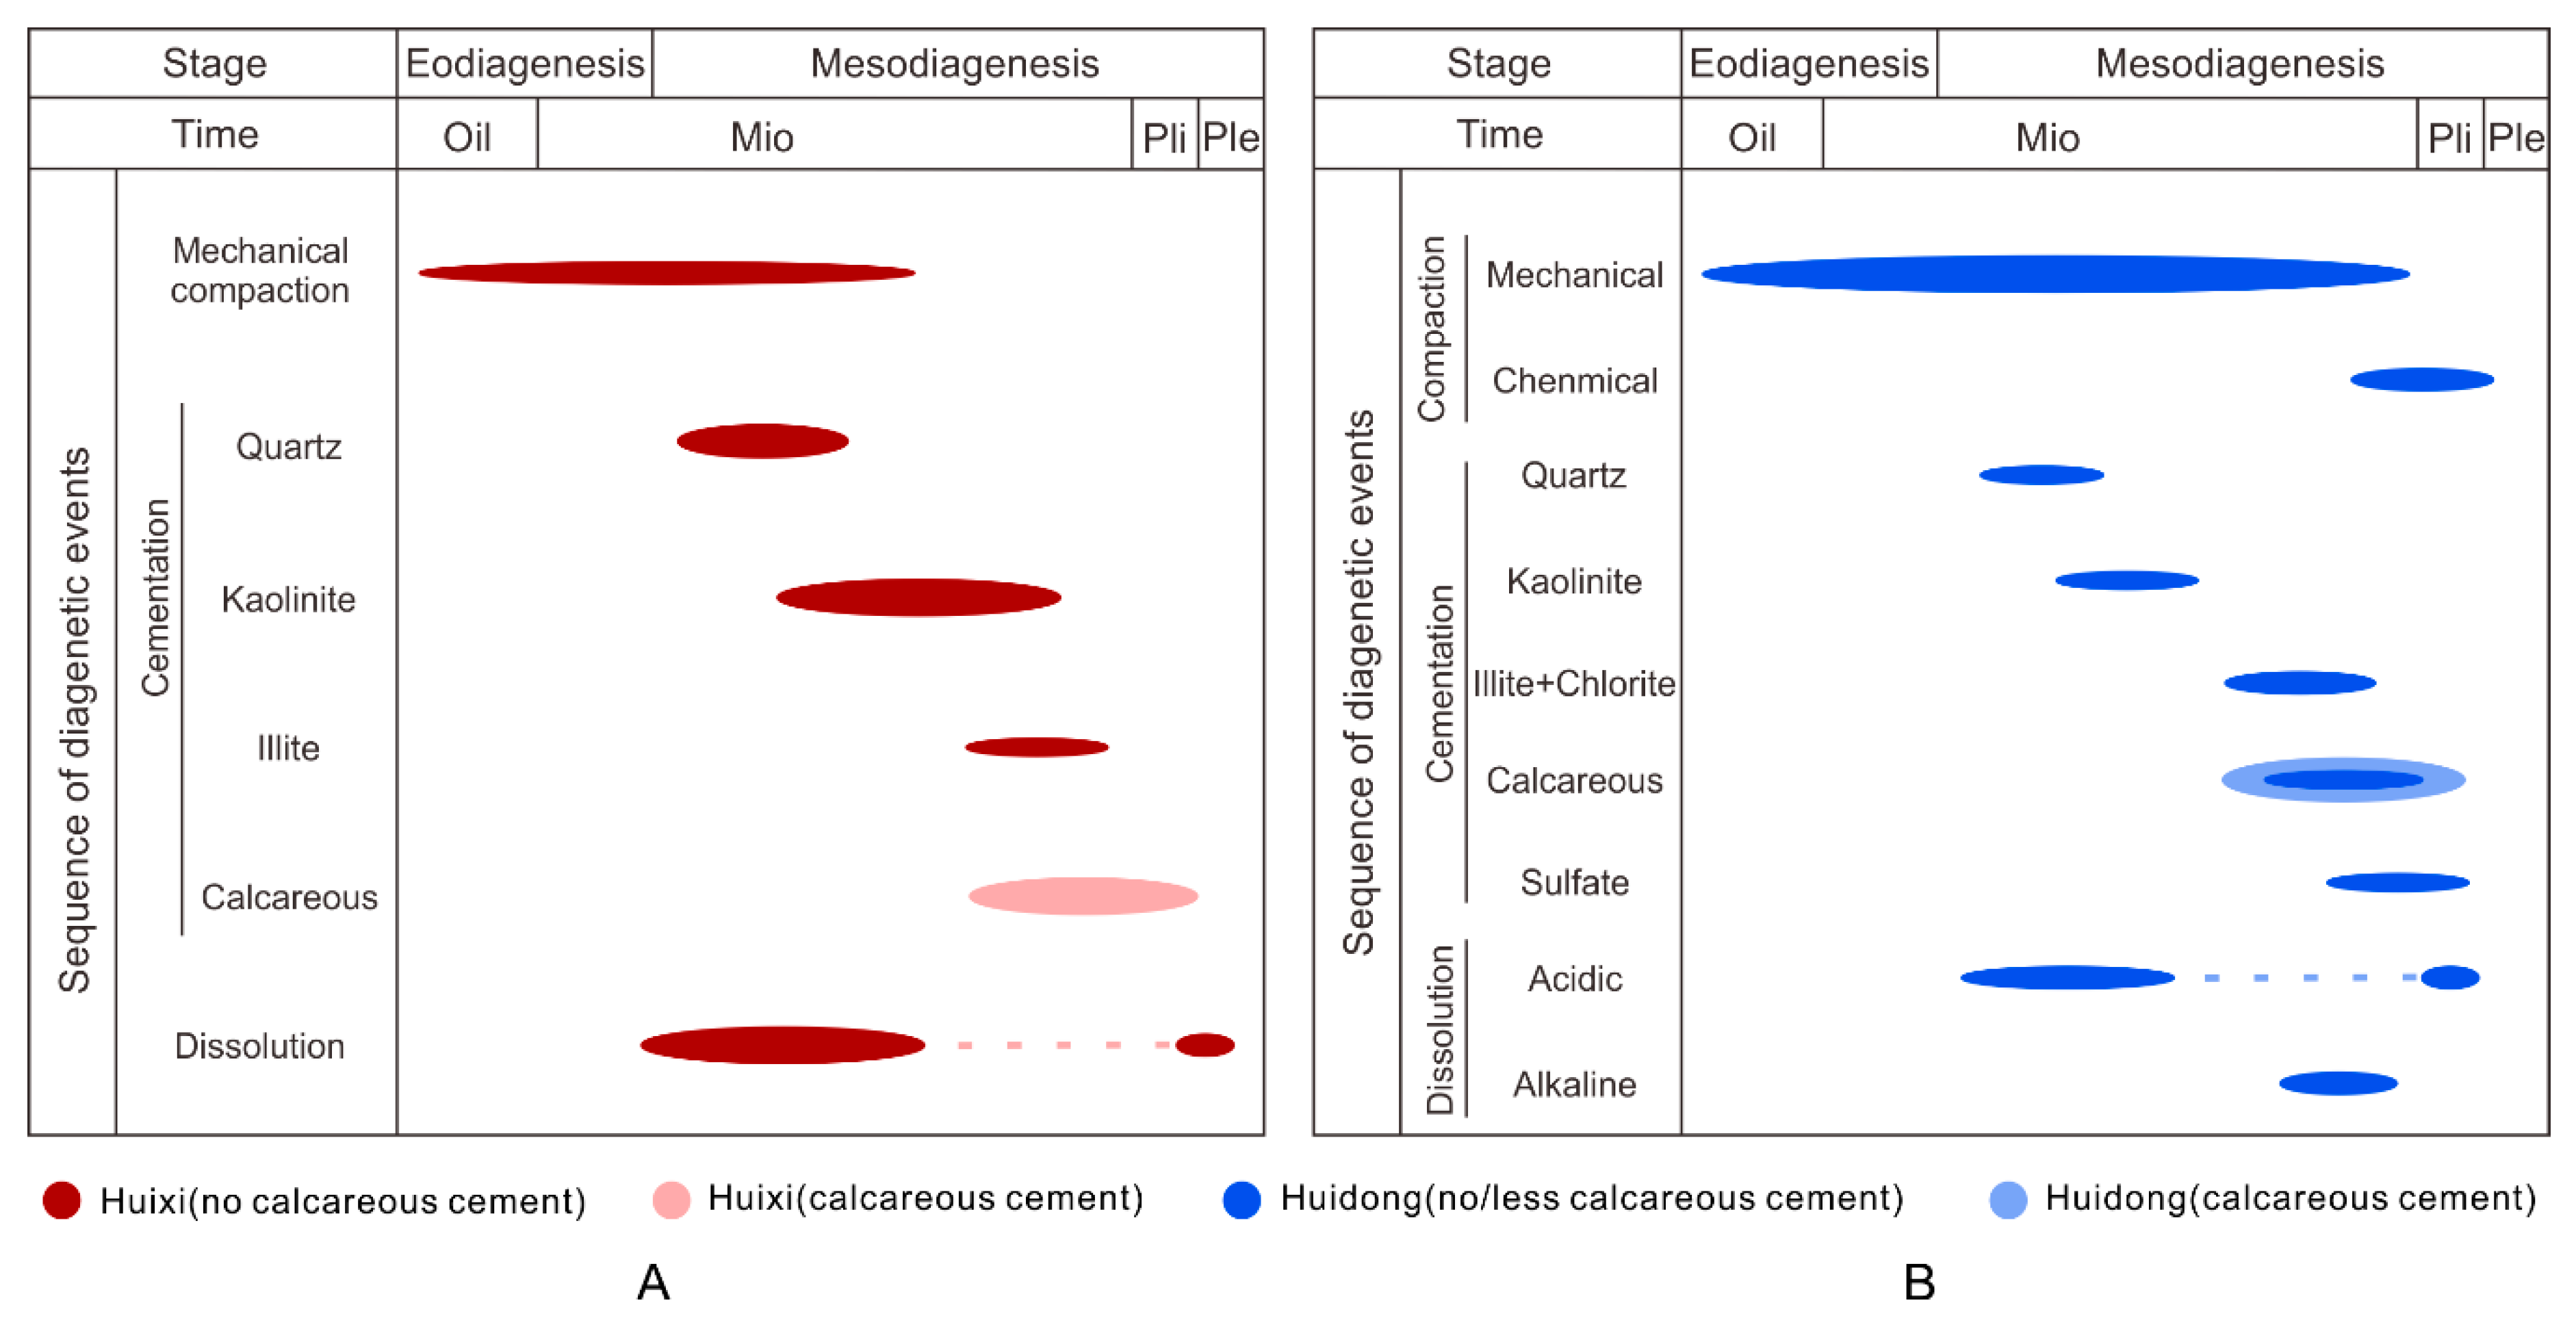
4.4. Diagenetic Events and Characteristics

4.4.1. Compaction

As one of the most common diagenetic processes, compaction can be divided into two types: mechanical compaction and chemical compaction [57]. The detrital texture of the samples indicated different degrees of compaction in Huixi and Huidong.
In Huixi, point and long contacts account for most contact types among the grains. Moreover, primary pores are preserved relatively well (Figure 4C,G). Although lithic fragments are less abundant in Huixi, mica and other plastic debris show no visible deformation. This indicates that the vertical stress during burial was not considerable. The relatively loose detrital texture and other vertical stress indicators in Huixi suggest a low degree of compaction.
In Huidong, the influence of compaction is stronger than that in Huixi. With increasing burial depth, plastic debris such as mica and mudstone debris deform greatly (Figure 4B). The contact types among grains are mainly long and concave-convex contacts. The deeper the sample was buried, the larger the contacts. Fewer primary pores were preserved in Huidong due to the strong vertical stress and the filling by compressed plastic debris. Furthermore, visible compression-dissolving structures such as stylolite (Figure 4H) can be observed. These phenomena indicate strong compaction in Huidong.

4.4.2. Cementation

The cementation degree in the research area varies from sample to sample. For most samples, only a few cements can be found in pores or attached to the grain surface. However, some samples are characterized by strong calcareous cementation which can cover up to 40% of the surface area in the thin sections. Although the average cement content in the Huizhou Sag is 4.9 ± 8.0%, there is still a large difference in cementation between Huixi and Huidong.
The cementation is slightly more extensive in Huixi than in Huidong. The average content of cement in Huixi is approximately 5.5 ± 8.7%, which is mainly accounted for by two types of cement: kaolinite (Figure 4C) and quartz overgrowth (Figure 7A). Kaolinite is usually observed near or around dissolved feldspars (Figure 4C,G) and shows a book-like shape under SEM and microscopy (Figure 7E). Quartz overgrowths (Qo-I mainly) are commonly observed with sharp edges and corners under unpolarized light and SEM. Moreover, authigenic quartz grains with perfect crystal form are visible in several samples (Figure 7C). Although large areas of granular cementation of dolomite and ankerite are developed in a few samples (Figure 4E), no calcareous cement is found in others.
In Huidong, the average content of cement is 3.7 ± 6.3%, which indicates a lower degree of cementation. However, the types of cement vary in this area. The most common types of cement in this area include illite, chlorite, gypsum, calcareous cement, pyrite and quartz overgrowth (Figure 7B,F). Under SEM, the illite and illite-smectite are mostly filamentous, chlorite is acicular and flaky, and pyrite is strawberry-shaped or spherical (Figure 7C–F,H). Clay mineral types are further determined according to the results of energy dispersive spectrometer of SEM and previous research [43,58]. Several samples developed large-scale granular cementation of calcite, dolomite or ankerite (Figure 4F) which can account for 20%–40% of the surface area in the thin sections. However, calcareous cements are also observed in other samples (Figure 4D).

4.4.3. Dissolution

Although dissolution is widely developed in the research area, this dissolution is weak. The average content of dissolution pores is 2.2 ± 1.5%. The primary dissolution phenomenon is the intragranular dissolution of grains, especially feldspar (Figure 7G), and some dissolution pores can be observed in lithic fragments and cements. Intergranular dissolution is rare in the research area.
In Huixi, feldspar dissolution is more common with hard or complete dissolution phenomena, and the dissolution of lithic fragments is rare. Moreover, intragranular dissolution pores and mouldic pores of feldspar are widespread with an average content of approximately 2.2 ± 1.5%. In Huidong, feldspars and lithic fragments are usually partly dissolved with no mouldic pores, and the average content of dissolution pores is 1.2 ± 0.7%. However, the dissolution of quartz (both grains and overgrowths) can be observed in several samples (Figure 7H). Furthermore, the dissolution of cements observed in the samples shows a second dissolution stage occurred in both Huixi and Huidong.

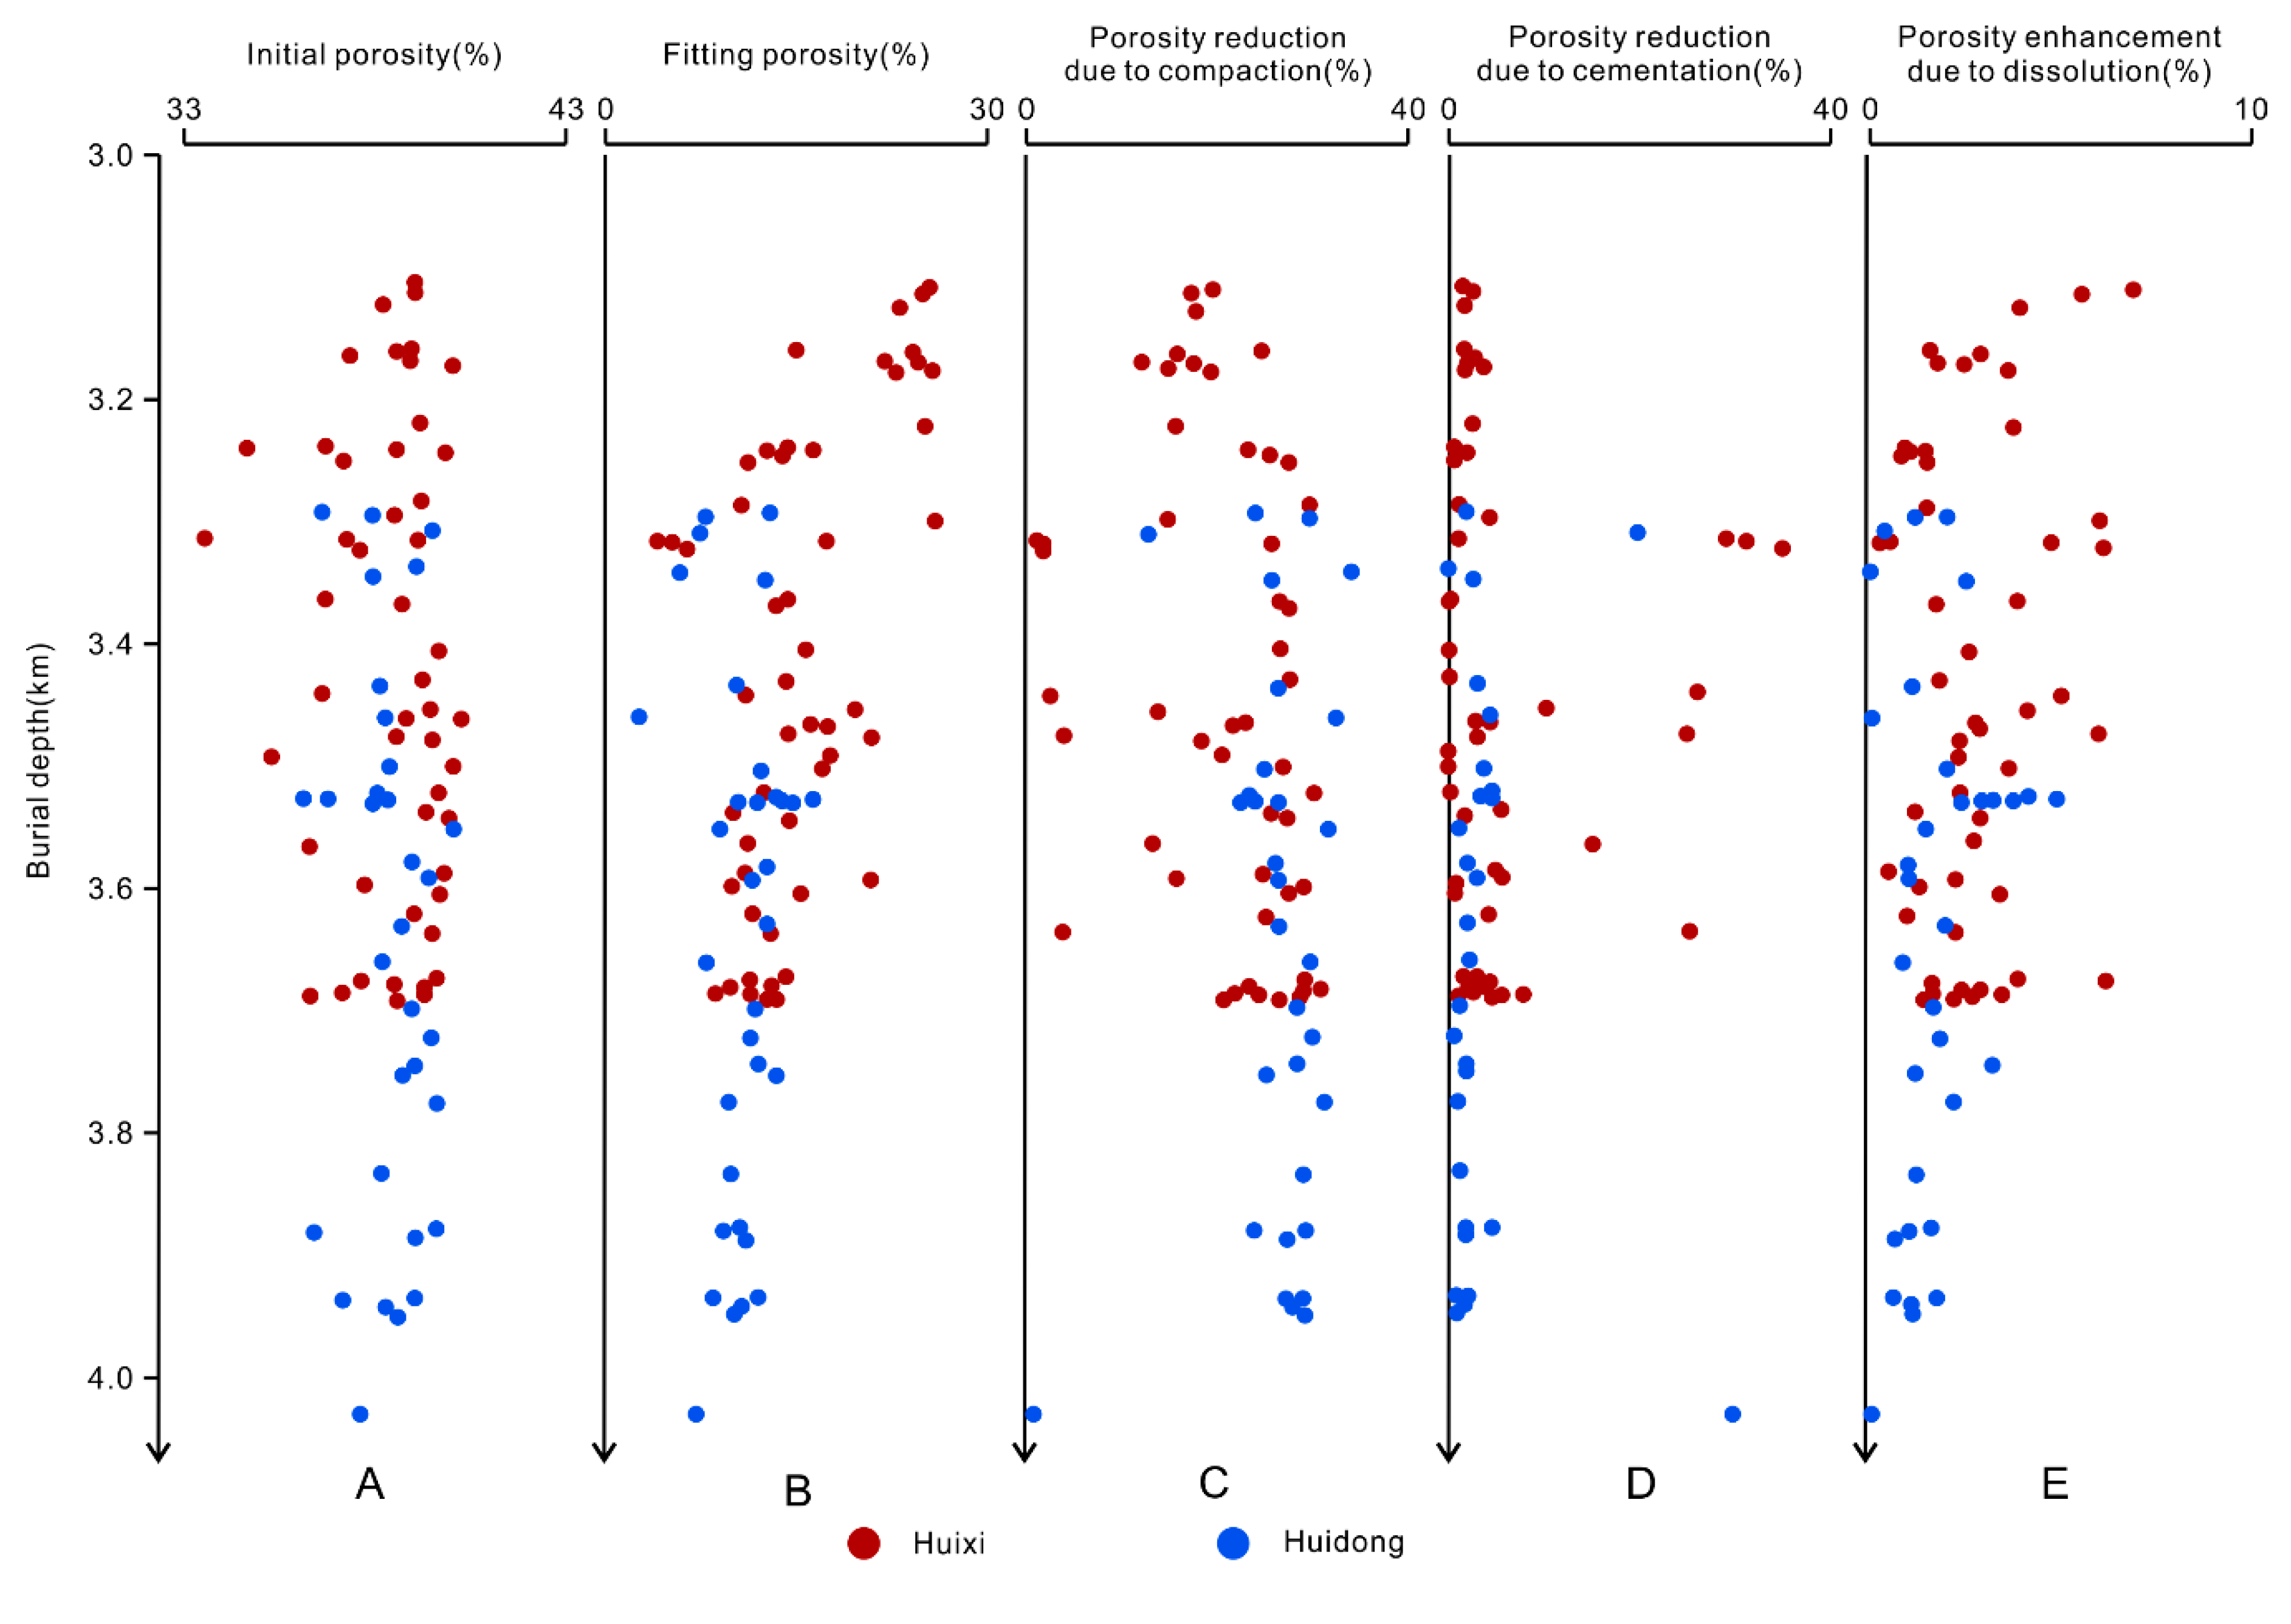
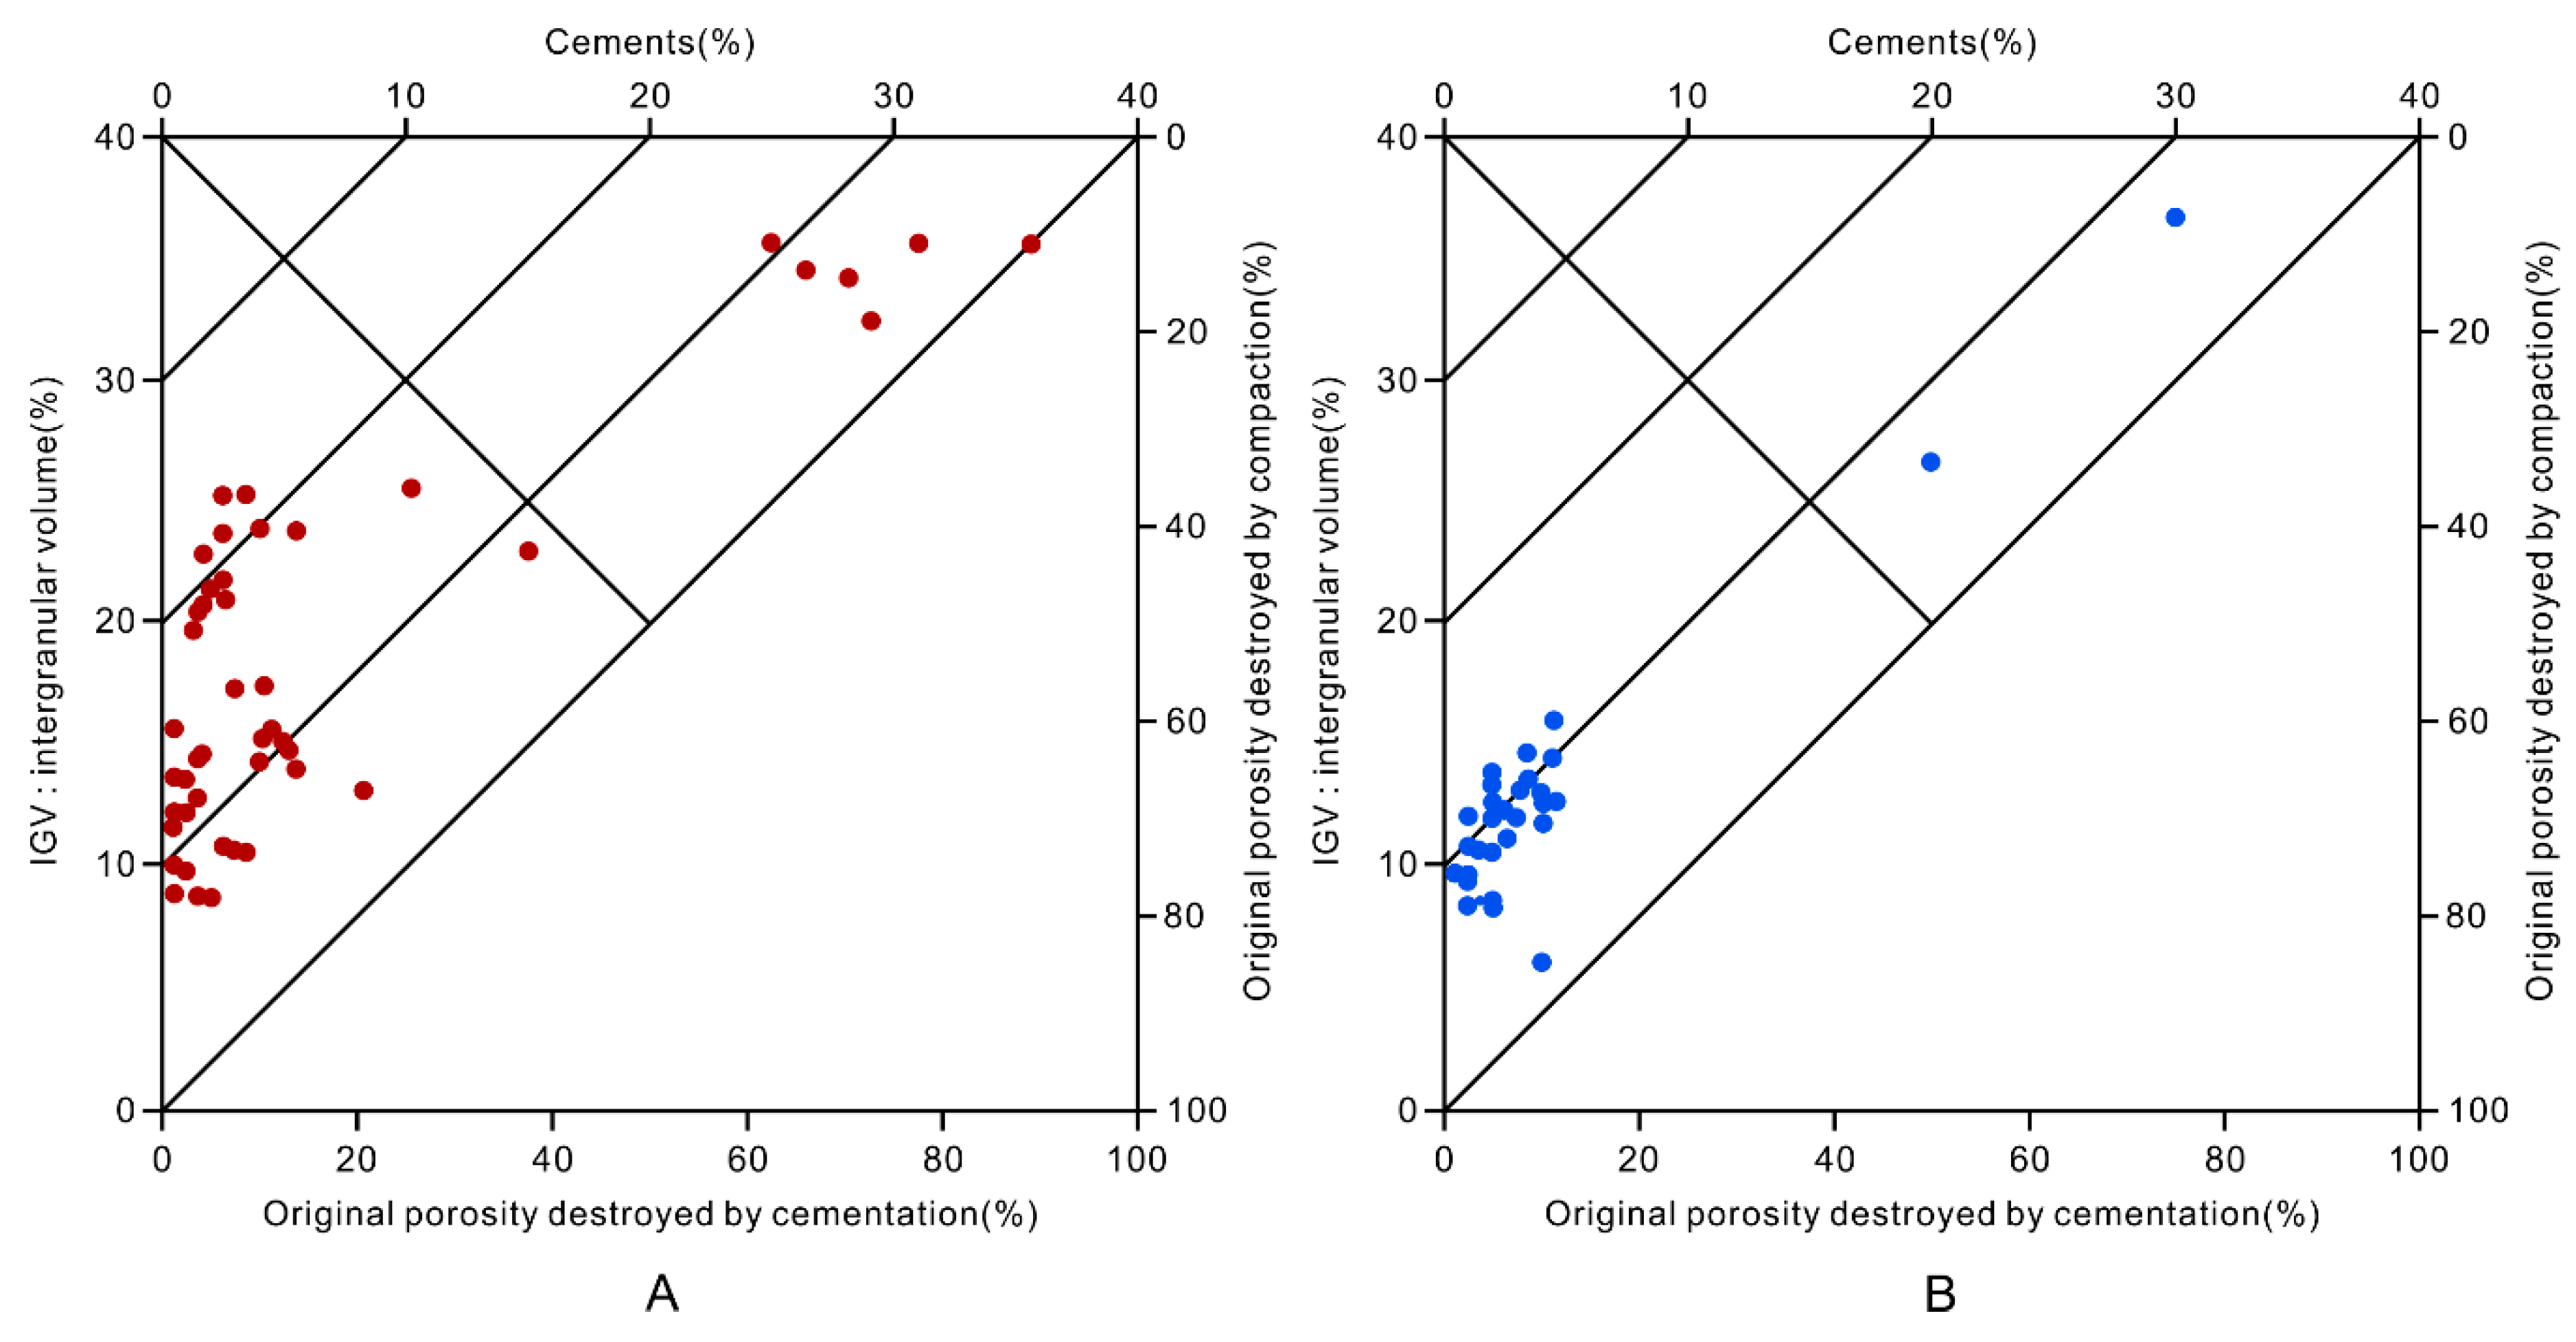
4.5. Quantitative Analysis of the Porosity Evolution

Lu, Zhao, Zhu, Yuan, Li and Deng [25] confirmed that the sandstone sample data from the Zhuhai Formation in the Wenchang Sag located in Zhu III Depression exhibits a linear relation between true porosity and areal porosity. In the present work, we use several models, including a linear function, an exponential function, a logarithmic function, and a power function to fit the relation between areal porosity and the true porosity, and the goodness of fit of the linear function is the highest, which means that the linear fitting of areal porosity and true porosity worked best. The fitting process is shown in Figure 8.
The fitting results show that the relation between areal porosity and true porosity in Huixi is:
Φa = 1.5212Pa + 4.1862    R2 = 0.8349
where Φa = fitted porosity, Pa = areal porosity, and R2 = goodness of fit.
Moreover, the relation between areal porosity and true porosity in Huidong shows:
Φa = 1.6669Pa + 6.7093    R2 = 0.7091
Based on the fitting results, the average porosity in Huixi is 15.0 ± 5.6%, and in Huidong the average porosity is 9.9 ± 2.5%.
The determination of the porosity evolution shows that the initial porosity of the research area varies from 33.5% to 40.2%, and that there is no significant difference between the two areas. The average initial porosity in the Huizhou Sag is 38.3 ± 1.3%. In Huixi, the porosity reductions caused by compaction and cementation are approximately 20.4 ± 8.0% and 5.6 ± 8.9%, respectively, and the porosity enhancement due to dissolution is approximately 2.8 ± 1.6%. For Huidong, the porosity reductions caused by compaction and cementation are approximately 26.2 ± 6.2% and 3.7 ± 6.3%, respectively, and the porosity enhancement due to dissolution is approximately 1.3 ± 0.8%. All samples of L27-4 are seriously broken, and neither image analysis nor porosity evolution calculation is carried out.
Some of the important calculation results of samples with true porosity tests are listed in Table 2, and all calculation results are listed in Table A1.

5. Discussion

5.1. Diagenetic Evolution and Environment

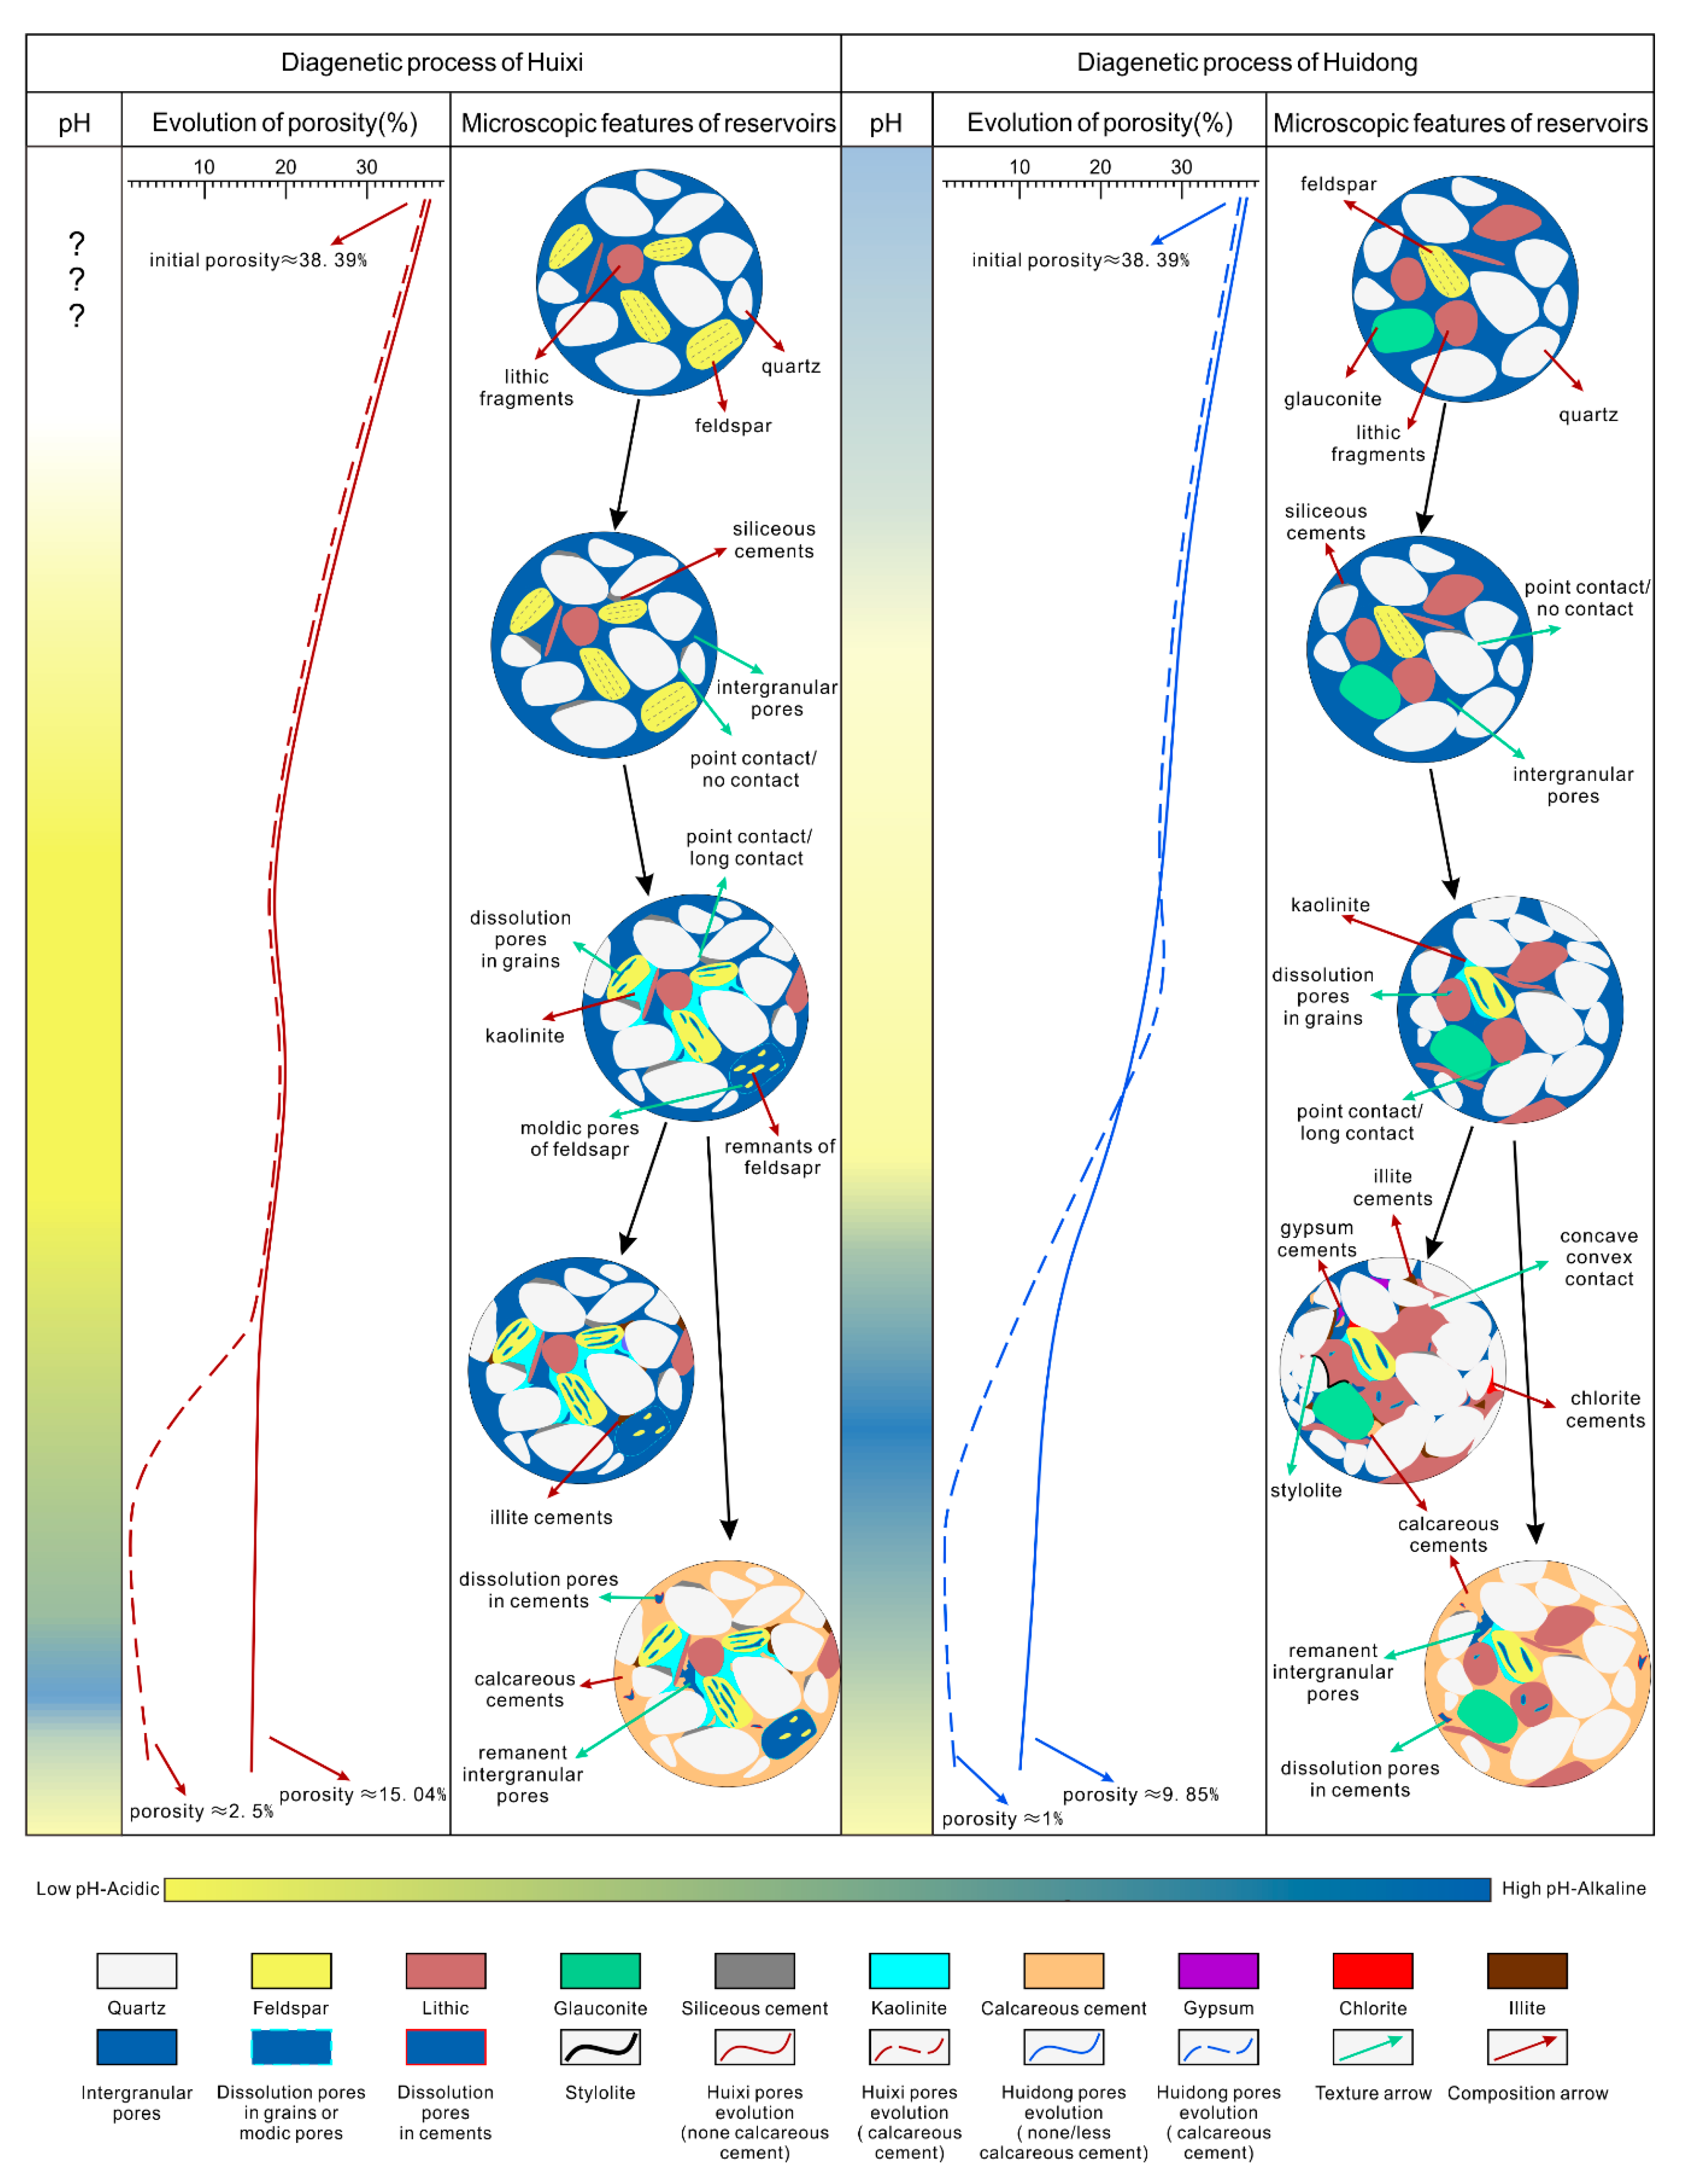
5.1.1. Evolution of Sandstone Diagenesis

The diagenetic process of sandstone can usually be divided into the eogenesis stage, mesogenesis stage and telodiagenesis stage based on depth, temperature, and later tectonic uplift. Moreover, 2 km is usually the approximate boundary between the eogenesis stage and the mesogenesis stage, corresponding to a temperature of approximately 70 °C [59]. The results from fluorescence analysis show that hydrocarbon charging occurs at least three times. Fluorescence from weak blue to blue-white reflects the hydrocarbon maturity from low to high and can be viewed as an indicator of time [60,61]. The first stage occurred before the cementation of the quartz overgrowths; the second stage occurred before the dissolution of the feldspar; the third stage occurred after the kaolinite cementation. Therefore, the sequence of these three events is as follows: quartz cementation, feldspar dissolution, and kaolinite cementation.
Microscopically, the contact relationships among minerals are good indicators of the sequence of the main cementation events. Kaolinite is usually observed adhered to the surface of quartz overgrowth (Figure 9A,B). Illite, chlorite, and calcareous cement filled the intergranular pores and dissolution pores or were attached to the quartz overgrowth surfaces. Gypsum is often found in intergranular pores and attached to the surface of calcareous cement. The dissolution of gypsum, siliceous and calcareous cement indicates another phase of dissolution (Figure 9D–F). Additionally, the homogenization temperatures of quartz overgrowths from Huixi and Huidong indicate that quartz cementation developed during mesogenesis.
The sequence of diagenetic events of Huixi and Huidong are summarized in Figure 10.

5.1.2. Diagenetic Environment

A compressive analysis indicates differences in the diagenetic environment between Huixi and Huidong, which are mainly reflected by palaeo-temperature, palaeo-pH and palaeo-salinity.
In Huixi, the homogenization temperature result shows that the palaeo-temperature is relatively low. Quartz overgrowth and kaolinite are typical cements that form abundantly in acidic fluid media (pH < 7) [62,63,64,65]. Moreover, strong dissolution of feldspar also suggested a strong movement of acidic fluid. There are two main hydrocarbon kitchens located around the L19 and L25 Well Areas (Figure 11A). During the generation of hydrocarbons, these hydrocarbon kitchens can provide abundant acidic fluids, which can easily move upward into the target formation and react with minerals [66,67] (Figure 11B). Relatively few cement types is also an indicator of low palaeo-salinity. In conclusion, Huixi had a low palaeo-temperature, low palaeo-pH and low palaeo-salinity diagenetic environment.
In Huidong, the results of fluid inclusion analysis show that the palaeo-temperature in the same stage is approximately 27 °C higher than that in Huixi. Although the burial depth is deeper in Huidong than in Huixi, the difference is less than 400 m which cannot account for such a large temperature difference. Abnormal temperature differences may be affected by adjacent deep faults. The deep faults that formed during the Dongsha Movement [41,51] extended from north Huixi to south Huidong and reached the L21 and L22 Well Areas. Through these faults, heat flux from deep heat sources could easily arrive at the target formation and result in high palaeo-temperatures (Figure 11A).
In Huidong, the existence of glauconite, which can only form in water with a pH of approximately 7.5~8.5 [68,69], indicates that the fluid environment during glauconite formation is weakly alkaline. However, the dissolution of feldspar and lithic fragments and cementation of quartz overgrowth and kaolinite indicate that the fluid environment changed to acidic. Moreover, quartz is a stable mineral under acidic conditions, but it will dissolve in a strong alkaline medium [64,70]. Therefore, the dissolution of quartz shows that the fluid environment in Huidong changed again to alkaline. The change in the fluid environment may result from the dissolution of lithic fragments. Under high temperatures, lithic fragments react with pore water and produce large amounts of metal ions that can easily be hydrolysed and form large quantities of hydroxyl ions (Figure 11B). Thus, the pore water became alkaline with a high salinity. In particular, the dissolution of volcanic debris can provide considerable amounts of iron and magnesium, which is important for the formation of chlorite [26,71], which can only form in a high-salinity environment rich in iron and magnesium [28,72]. Furthermore, various types of cement in Huidong also indicate a relatively high palaeo-salinity. The dissolution of cements indicates that there was another dissolution stage during which the fluid became acidic. Therefore, the diagenetic environment of Huidong is a high palaeo-temperature and high palaeo-salinity diagenetic environment in which the pore fluid evolved, following the sequence of weakly alkaline, acidic, alkaline, acidic.
Differences in petrological characteristics and different geological settings resulted in different diagenetic environments. However, the causes of different petrological characteristics are still unclear. In the present work, the source of a large amount of feldspar in Huixi may be the result of a potential provenance. Previous research concluded that the provenance of the Zhuhai Formation in the Pearl River Mouth Basin was the ancient Zhujiang Delta that came from the north [30]. With further exploration, the capability of Dongsha Uplift as a provenance during the deposition of the Zhuhai Formation has been discussed recently because the Dongsha Uplift was uplifted during the deposition of the Zhuhai Formation [29,37].
Observational results of L27-4 show abnormal petrographic characteristics. Some samples of L27-4 are the same as other samples in Huixi, which are characterized by high contents of quartz and feldspar, but other samples of L27-4 show extremely low quartz contents and high lithic fragment contents, especially granite fragment contents (Figure 3A, and Figure 9G,H). L27-4 is located near the boundary of the Huixi graben and Huixi low uplift and is not far from the Dongsha Uplift (Figure 11A). Moreover, the Shenhu Formation is characterized by felsic rocks (Figure 2). In this case, the Dongsha Uplift may have provided abundant feldspar for the target formation in Huixi after transportation and weathering. At the same time, the porosity distribution shown in Figure 8A exhibits a bimodal distribution which may be the result of a change in sedimentary facies or the mix of sediments from different provenances. All these phenomena implicate the Dongsha Uplift as a potential source for the target reservoir in Huixi.

5.2. Reconstruction of Diagenetic History

Based on the analysed diagenetic environments and the determined porosity evolution, the diagenetic processes of Huixi and Huidong can be summarized as follows (Figure 12):

5.2.1. Eogenesis Stage

Eogenesis is a diagenetic stage that occurs near shallow surfaces and is strongly governed by factors such as the chemical composition of water, detrital composition, and deposition rate [61]. The main diagenetic processes of the target formation in this stage were as follows (Figure 12):
1. Detrital composition and initial porosity: Clastic debris rich in lithic fragments from the ancient Zhujiang Delta flowed into Huidong and deposited, and clastic debris rich in feldspar from the Dongsha Uplift deposited in Huixi. The loose deposits had an initial porosity of 38.4 ± 1.3%.
2. Alteration of faecal pellets to glauconite: The glauconites in Huidong show complete granular forms with similar grain sizes. These results indicate that glauconites are most likely the parautochthonous type developed at the beginning of sediment deposition [73]. In this stage, the fluid environment in Huidong was weakly alkaline, but the fluid environment in Huixi is unknown.
3. Mechanical compaction: Mechanical compaction started immediately after deposition [74]. With the increase in burial depth, the vertical stress started compacting loose deposits and changing contact types. At approximately 2 km, mechanical compaction reached a limit, and in Huixi it resulted in a 20.4% loss of porosity. However, in Huidong, plastic debris deformed greatly, resulting in a greater loss of porosity; approximately 26.2%.

5.2.2. Mesogenesis Stage

Mesogenesis occurred when sediments were no longer influenced by surface processes. In this stage, diagenetic processes are mainly governed by temperature, chemically changed fluids and the degree to which sandstones have been changed during the previous stage [75]. The main diagenetic processes of the Zhuhai Formation in this stage developed as follows (Figure 12):
1. Generation and migration of organic acids: In this stage, hydrocarbon kitchens started generating hydrocarbons with organic acids and then hydrocarbons and organic acids moved upward and caused the fluid environment in Huixi and Huidong to become acidic. Moreover, deep faults in Huidong formed before the acidification of pore water.
2. Siliceous cementation: Under the acidic fluid environment, quartz cements started to fill pores. The lower palaeo-pH in Huixi facilitated the deposition of quartz, which accounted for a 1.2% decrease in porosity. The relatively high palaeo-pH in Huidong resulted in less quartz cement and a porosity reduction of approximately 0.6%.
3. Dissolution of grains: Due to the organic acid, feldspar and some lithic fragments began to dissolve [66]. In Huixi, a large number of feldspars were dissolved, increasing the porosity by 2.8 ± 1.6%. Then, the palaeo-pH increased due to the consumption of organic acid. Conversely, in Huidong, under higher palaeo-temperatures, some lithic fragments dissolved, which increased the porosity by approximately 1.3 ± 0.8% and charged metal ions in the pore water.
4. Kaolinite cementation: In an open fluid environment, chemicals produced by dissolution can be continuously released from reservoirs [76,77]. However, in a closed fluid environment, fluids produced by feldspar dissolution can undergo further chemical reactions and deposit kaolinite in nearby pores [78,79]. As a result of the greater feldspar content and lower pH in Huixi than those in Huidong, more kaolinite was deposited in the pores in Huixi, producing a kaolinite content of approximately 2.5%. Conversely, the kaolinite content in Huidong is 0.8%.
5. Illite and chlorite cementation: The reduction in acid and the increase in metal ions (especially iron and magnesium) in pore water changed the fluid environment in Huidong into an alkaline environment with a higher salinity. In this case, some of the clay minerals were gradually converted into illite and chlorite.
6. Dissolution of quartz (grain and cement): High pH values and high temperatures can strongly increase the solubility of SiO2 [27]. In Huidong, the high palaeo-pH and high palaeo-temperature environment caused the quartz grains and cements to partially dissolve.
7. Calcareous cementation: In Huidong, under alkaline environment patch-like calcareous cements deposited, which accounted for a 1.7% porosity reduction. large area granular calcareous cements developed in both Huixi and Huidong may be the result of regional (the whole Huizhou Sag or Zhu I Depression) events that made the regional fluid environment alkaline.
8. Other types of cementation: In Huidong, as the palaeo-salinity continued to increase, when pore water was supersaturated with minerals, other types of cements such as gypsum were deposited.
9. Chemical compaction: In Huidong, under the high pressure and high temperature, the solubility of contact points among grains increased and resulted in compression–dissolution structures.
10. Dissolution of cements: After the first hydrocarbon generation stage, the source rocks started the second or even the third hydrocarbon generation stage, which produced new acids that entered the target formation, resulting in the dissolution of cements.

5.3. Controlling Factors of Reservoir Quality

5.3.1. Initial Detrital Composition and Texture

Reservoir quality is primarily a complex result of provenance, sedimentary texture and diagenesis [80]. However, the initial porosity values in Huixi and Huidong are similar. Therefore, the initial detrital composition and texture of the sediments did not have direct influences on the reservoir quality. However, the detrital composition can have an important influence on later diagenesis [81,82].

5.3.2. Diagenetic Processes

In general, the dissolution of the Zhuhai Formation in the Huizhou Sag is weak. Although the dissolution of the Zhuhai Formation is stronger in Huixi, the average content of dissolution pores is only 2.8 ± 1.6% (Figure 13E), which cannot explain the difference in reservoir quality between Huixi and Huidong. In both Huixi and Huidong, a few samples show large quantities of calcareous cement. However, with the exception of these samples, the average cement content is only 2.4 ± 2.4% in the Huizhou Sag. Therefore, cementation in the Huizhou Sag is also weak (Figure 13D).
The analysis of pore evolution and the relation between intergranular volume and porosity reduction due to cementation show that compaction is the most critical effect on intergranular volume in the Huizhou Sag (Figure 14). The comprehensive influence of compaction and plastic lithic fragments makes porosity reduction due to compaction much stronger in Huidong than in Huixi, which can also be confirmed by Figure 13C. The reduction in porosity due to compaction in Huixi accounts for 73% of the total loss of porosity, while that in Huidong is 90%. Therefore, diagenesis which has the greatest influence on the porosity evolution in the research area included compaction and calcareous cementation (specific samples) (Figure 13C,D).

6. Conclusions

(1) The present work established a model to quantitively reconstruct the evolution of porosity for the Zhuhai Formation in the Huizhou sag based on PIBS. This model can mainly use data extracted from thin sections and is feasible in cases in which thin sections are the main research objects and true porosity is of shortage.
(2) Huixi is characterized by a high content of feldspar, mainly kaolinite cements and quartz overgrowth, and strong feldspar dissolution. Conversely, Huidong is rich in lithic fragments with various types of cement, and relatively weak dissolution of feldspar and lithic fragments.
(3) The diagenetic environment in Huixi is simpler than that in Huidong and is characterized by low palaeo-temperature, low palaeo-salinity, and low palaeo-pH. However, the diagenetic environment in Huidong is mainly high palaeo-temperature, high palaeo-salinity, and high palaeo-pH with the environment changing from weakly alkaline to acidic, to alkaline, and finally to acidic.
(4) The Zhuhai Formation has mainly gone through a diagenetic process characterized by strong compaction, weak cementation, and weak dissolution. Furthermore, compaction is much stronger in Huidong than that in Huixi, and cementation and dissolution are slightly stronger in Huixi than that in Huidong.
(5) For most samples, the main controlling factors of reservoir quality are the plastic debris content and compaction. Several special samples were greatly influenced by calcareous cementation.
Several issues remain unclear.
(1) The porosity distribution exhibited a bimodal distribution, and there is no clear interpretation of this distribution. Whether it is the result of the changes in sedimentary facies or the mixing of different provenances requires further research.
(2) The capacity of the Dongsha Uplift to provide sediment during the formation of the Zhuhai Formation in Huixi is not clear. The evidence from thin sections is not persuasive enough, and this implication requires direct evidence such as heavy mineral analysis and U-Pb dating.
(3) The large quantities of granular calcareous cements that developed in both Huixi and Huidong may be the result of regional (the whole Huizhou Sag or Zhu I Depression) events, which requires further research.

Author Contributions

Methodology and writing—original draft preparation, X.C.; supervision, D.Z.; investigation, H.S. and T.C.; visualization and formal analysis, Z.S.; writing—review and editing, S.G.; project administration, J.L. and F.W. All authors have read and agreed to the published version of the manuscript.

Funding

This research was funded by the National Natural Science Foundation of China, grant number 41802148 and State Key Laboratory of Petroleum Resources and Prospecting, grant number 2462017YJRC025.

Conflicts of Interest

The authors declare no conflict of interest.

Appendix A. Porosity Evolution Statistics

Table A1. Porosity evolution statistics of all wells.
WellDepth (m)Pi (%)Pgd (%)Pcd (%)S0Pa (%)Φa (%)Φ0 (%)ΦL (%)ΦCL (%)ΦD (%)
L19-13248.509.601.430.001.414.5011.0337.1527.050.501.43
L19-13283.408.831.440.001.264.0010.2739.0129.181.001.44
L19-13313.2012.634.670.001.268.6217.3039.0225.391.004.67
L19-13362.2010.313.810.001.466.5314.1236.6326.320.003.81
L19-13366.4011.651.740.001.296.0513.3938.6426.990.001.74
L19-13403.5013.252.520.001.237.6215.7839.5826.330.002.52
L19-13427.5012.031.800.001.256.3413.8339.2227.190.001.80
L19-13439.506.032.742.191.464.4510.9636.592.3728.194.93
L19-13445.50
L19-13464.2014.362.740.001.288.4917.1038.7521.393.002.74
L19-13473.408.164.501.411.296.5014.0738.614.0426.415.91
L19-13490.0015.102.260.001.608.6617.3635.2420.140.002.26
L19-13499.5013.403.560.001.208.4016.9639.9426.540.003.56
L19-13522.009.872.320.001.235.2612.1939.5229.650.002.32
L19-13536.208.561.170.001.243.649.7239.3125.265.501.17
L19-13542.0011.362.840.001.226.5814.2039.7126.851.502.84
L19-13551.80
L19-13562.508.002.670.001.504.2610.6736.1813.1815.002.67
L19-13576.20
L19-13587.2010.210.540.001.224.3110.7439.6924.485.000.54
L19-13598.208.431.260.001.373.629.6937.6228.690.501.26
L19-13603.5011.813.330.001.237.2015.1439.5727.270.503.33
L19-13622.5010.360.900.001.274.6511.2638.9324.574.000.90
L19-13636.0010.702.190.001.245.7212.8939.373.6825.002.19
L19-23295.0019.915.950.001.3114.2525.8638.4514.534.005.95
L19-23453.0015.414.100.001.244.3119.5039.4413.8310.204.10
L19-23462.2013.282.720.001.196.2216.0040.2122.734.202.72
L19-23476.9018.422.280.001.2412.2020.7039.3818.352.602.28
L19-23591.4018.332.270.001.2314.9220.6039.4715.645.502.27
L19-23673.507.755.950.141.236.3413.8339.4928.802.946.09
L19-23674.507.323.770.001.384.5411.0937.5628.741.503.77
L19-23681.507.142.380.001.253.519.5339.2328.593.502.38
L19-23683.006.722.880.001.253.569.6039.1630.442.002.88
L19-23686.384.902.740.661.423.518.3037.0523.898.263.40
L19-23687.008.422.660.001.254.5311.0839.2028.282.502.66
L19-23678.8811.211.400.131.305.6212.7438.4723.144.131.53
L19-23688.149.631.570.001.504.8411.2036.1821.345.201.57
L19-23690.6211.172.130.001.505.8713.3036.1820.504.502.13
L19-23691.0011.231.390.001.305.5412.6138.5326.311.001.39
L19-33104.8018.476.830.001.2715.6525.3038.9319.161.306.83
L19-33110.5019.345.460.001.2713.6524.8038.9617.122.505.46
L19-33121.0019.013.890.001.3310.8322.9038.1717.661.503.89
L19-33159.0021.122.640.241.3012.7024.0038.5315.671.742.88
L19-33165.0022.791.720.001.4012.8824.5037.2711.982.501.72
L19-33167.0019.402.400.001.289.1621.8038.8517.452.002.40
L19-33171.0021.843.560.001.2012.1425.4039.9514.613.503.56
L19-33173.0019.073.410.231.219.5322.7039.8019.001.733.63
L19-33218.0021.253.750.001.2610.5125.0039.0415.292.503.75
L21-183290.4910.752.050.001.462.5412.8036.5923.842.002.05
L21-183294.006.441.140.001.350.527.5837.8929.452.001.14
L21-183308.016.740.350.001.240.237.0939.4112.6720.000.35
L21-183338.015.440.000.001.270.005.4438.9933.550.000.00
L21-183339.99
L21-183344.999.922.480.001.352.4312.4037.8525.432.502.48
L21-183433.509.041.120.001.332.0710.1638.0826.033.001.12
L21-63697.509.911.610.001.272.8911.5338.8827.971.001.61
L21-63722.009.361.780.001.242.6611.1439.4029.540.501.78
L21-63745.008.582.590.591.273.0311.7638.9527.782.593.18
L21-63776.007.241.690.471.235.229.4039.5230.811.472.16
L21-73458.702.200.000.001.320.002.2038.2332.034.000.00
L21-73500.8010.141.930.001.321.9612.0738.2924.653.501.93
L21-73549.807.511.430.001.211.348.9439.9031.391.001.43
L22-23580.0011.451.000.001.273.4412.4438.9625.512.001.00
L22-23592.5010.130.890.111.242.6511.1339.3826.153.111.00
L22-23630.0010.651.880.001.293.4912.5338.6526.012.001.88
L22-23660.006.770.840.001.341.297.6038.0529.292.000.84
L22-23753.0011.901.180.001.294.3313.0838.6124.712.001.18
L22-23834.008.511.160.001.333.529.6738.0928.581.001.16
L22-23880.508.681.530.001.232.1010.2139.5428.862.001.53
L22-23882.008.150.920.091.492.159.1636.2923.554.591.01
L22-23888.0010.020.640.001.272.9610.6638.9726.952.000.64
L22-23936.5011.160.590.001.273.0211.7438.9426.781.000.59
L22-23937.506.571.750.001.411.298.3237.1128.542.001.75
L22-23934.409.281.030.001.332.1610.3138.1827.401.501.03
L22-23950.008.831.090.001.301.939.9338.5528.721.001.09
L22-24032.106.710.000.001.380.006.7137.480.7730.000.00
L25-113157.0012.991.460.151.288.8214.6038.8224.181.651.61
L25-113237.6013.230.840.001.466.5014.0736.6122.880.500.84
L25-113238.7011.131.380.001.687.8312.5034.5422.910.501.38
L25-113239.5015.230.970.001.307.9016.2038.5422.810.500.97
L25-113242.0012.970.830.001.2212.6413.8039.7225.251.500.83
L25-113312.403.430.390.081.830.583.9033.460.9529.080.47
L25-113313.504.660.250.001.407.254.9037.251.5931.000.25
L25-113321.010.005.490.611.383.976.1037.491.8835.616.10
Pi = areal porosity of intergranular pores; Pid = areal porosity of intergranular dissolution pores, Pcd = areal porosity of dissolution pores in cements; S0 = Trask sorting coefficient; Pa = areal porosity; Φa = fitting porosity; Φ1 = true porosity; Φ0 = initial porosity; ΦL = porosity reduction due to compaction; ΦCL = porosity reduction due to cementation; ΦD = porosity enhancement due to dissolution.

References

  1. Fic, J.; Pedersen, P.K. Reservoir characterization of a “tight” oil reservoir, the middle Jurassic Upper Shaunavon Member in the Whitemud and Eastbrook pools, SW Saskatchewan. Mar. Pet. Geol. 2013, 44, 41–59. [Google Scholar] [CrossRef]
  2. Stroker, T.M.; Harris, N.B.; Crawford Elliott, W.; Marion Wampler, J. Diagenesis of a tight gas sand reservoir: Upper Cretaceous Mesaverde Group, Piceance Basin, Colorado. Mar. Pet. Geol. 2013, 40, 48–68. [Google Scholar] [CrossRef]
  3. Worden, R.H.; Burley, S. Sandstone Diagenesis: The Evolution of Sand to Stone. Sandstone Diagenesis 2009, 4, 3–44. [Google Scholar]
  4. Slatt, R.M. Chapter 5—Basics of Sequence Stratigraphy for Reservoir Characterization. In Developments in Petroleum Science; Slatt, R.M., Ed.; Elsevier: Amsterdam, The Netherlands, 2013; Volume 61, pp. 203–228. [Google Scholar]
  5. Athy, L.F. Density, Porosity, and Compaction of Sedimentary Rocks1. AAPG Bull. 1930, 14, 1–24. [Google Scholar]
  6. Schmoker, J.W.; Gautier, D.L. Sandstone porosity as a function of thermal maturity. Geology 1988, 16, 1007–1010. [Google Scholar] [CrossRef]
  7. Scherer, M. Parameters Influencing Porosity in Sandstones: A Model for Sandstone Porosity Prediction1. AAPG Bull. 1987, 71, 485–491. [Google Scholar] [CrossRef]
  8. Jiang, S.; Henriksen, S.; Wang, H.; Lu, Y.; Ren, J.; Cai, D.; Feng, Y.; Weimer, P. Sequence-stratigraphic architectures and sand-body distribution in Cenozoic rifted lacustrine basins, east China. AAPG Bull. 2013, 97, 1447–1475. [Google Scholar] [CrossRef]
  9. Taylor, T.R.; Giles, M.R.; Hathon, L.A.; Diggs, T.N.; Braunsdorf, N.R.; Birbiglia, G.V.; Kittridge, M.G.; Macaulay, C.I.; Espejo, I.S. Sandstone diagenesis and reservoir quality prediction: Models, myths, and reality. AAPG Bull. 2010, 94, 1093–1132. [Google Scholar] [CrossRef]
  10. Lander, R.H.; Bonnell, L.M. A model for fibrous illite nucleation and growth in sandstones. AAPG Bull. 2010, 94, 1161–1187. [Google Scholar] [CrossRef]
  11. Umar, M.; Friis, H.; Khan, A.S.; Kassi, A.M.; Kasi, A.K. The effects of diagenesis on the reservoir characters in sandstones of the Late Cretaceous Pab Formation, Kirthar Fold Belt, southern Pakistan. J. Asian Earth Sci. 2011, 40, 622–635. [Google Scholar] [CrossRef]
  12. Houseknecht, D.W. Assessing the Relative Importance of Compaction Processes and Cementation to Reduction of Porosity in Sandstones1. AAPG Bull. 1987, 71, 633–642. [Google Scholar]
  13. Ehrenberg, S.N. Assessing the Relative Importance of Compaction Processes and Cementation to Reduction of Porosity in Sandstones: Discussion; Compaction and Porosity Evolution of Pliocene Sandstones, Ventura Basin, California: Discussion1. AAPG Bull. 1989, 73, 1274–1276. [Google Scholar]
  14. Ge, J.; Qin, C.; Zhu, X.; Chen, S.; Liu, Y.; Zang, X. Characteristics and origin of low porosity and low permeability sandstone reservoir of Wenchang Formation in HZ25-7 structural belt of Huizhou Depression. Lithol. Reserv. 2014, 26, 36–43. [Google Scholar]
  15. Henares, S.; Caracciolo, L.; Cultrone, G.; Fernández, J.; Viseras, C. The role of diagenesis and depositional facies on pore system evolution in a Triassic outcrop analogue (SE Spain). Mar. Pet. Geol. 2014, 51, 136–151. [Google Scholar] [CrossRef]
  16. Zhu, H.; Zhong, D.; Yao, J.; Sun, H.; Niu, X.; Liang, X.; You, Y.; Li, X. Alkaline diagenesis and its effects on reservoir porosity: A case study of Upper Triassic Chang 7 tight sandstones in Ordos Basin, NW China. Pet. Geol. Exp. 2015, 42, 51–59. [Google Scholar] [CrossRef]
  17. Li, J. Temporal-spatial evolution of diagenetic environment and diagenesis pore evolutionary process of red beds in the eastern Dongying Sag, Bohai Bay Basin. Oil Gas Geol. 2017, 38, 90–97. [Google Scholar]
  18. Chester, J.S.; Lenz, S.C.; Chester, F.M.; Lang, R.A. Mechanisms of compaction of quartz sand at diagenetic conditions. Earth Planet. Sci. Lett. 2004, 220, 435–451. [Google Scholar] [CrossRef]
  19. Hao, G.; Shan, X.; Liu, W.; Wang, Q. Quantitative research of diagenesis: Its effect on pore evolution of the Fuyu oil reservoir in the north Qijia region. J. China Univ. Min. Technol. 2010, 20, 770–777. [Google Scholar] [CrossRef]
  20. Yang, R.; Fan, A.; Han, Z.; Wang, X. Diagenesis and porosity evolution of sandstone reservoirs in the East II part of Sulige gas field, Ordos Basin. Int. J. Min. Sci. Technol. 2012, 22, 311–316. [Google Scholar] [CrossRef]
  21. Wang, Y.; Cao, Y.; Xi, K.; Song, G.; Liu, H. A recovery method for porosity evolution of clastic reservoirs with geological time: A case study from the upper submember of Es4 in the Dongying depression, Jiyang Subbasin. Acta Pet. Sin. 2013, 34, 1100–1111. [Google Scholar]
  22. Feng, X.; Liu, L.; Li, Z.; Dou, W.; Zheng, S. Improvement and application of quantitative calculation of porosity evolution of clastic rock. Oil Gas Geol. 2017, 38, 1198–1207. [Google Scholar]
  23. Zhang, Q.; Sun, W.; Yang, X.; Li, H. Quantitative calculation of tight sandstone reservoir porosity evolution based on different diagenesis:A case study of Chang 6_3 reservoir in Huaqing area,Ordos Basin. Pet. Geol. Exp. 2017, 39, 126–133. [Google Scholar]
  24. Chen, R.; Luo, X.; Wu, Y. Construction of hydrocarbon passage framework using diagenetic sequence information. Acta Pet. Sin. 2007, 28, 43. [Google Scholar]
  25. Lu, J.; Zhao, Y.; Zhu, P.; Yuan, Q.; Li, S.; Deng, X. Application of Porosity Inversion Method to Reservoir Quantitative Prediction:Taking Wenchang Area in Zhu III Depression as an Example. Geol. Sci. Technol. Inf. 2018, 37, 105–114. [Google Scholar] [CrossRef]
  26. Ehrenberg, S.N. Preservation of Anomalously High Porosity in Deeply Buried Sandstones by Grain-Coating Chlorite: Examples from the Norwegian Continental Shelf1. AAPG Bull. 1993, 77, 1260–1286. [Google Scholar]
  27. Berger, G.; Cadore, E.; Schott, J.; Dove, P.M. Dissolution rate of quartz in lead and sodium electrolyte solutions between 25 and 300 °C: Effect of the nature of surface complexes and reaction affinity. Geochim. Cosmochim. Acta 1994, 58, 541–551. [Google Scholar] [CrossRef]
  28. Lanson, B.; Beaufort, D.; Berger, G.; Bauer, A.; Cassagnabere, A.; Meunier, A. Authigenic kaolin and illitic minerals during burial diagenesis of sandstones: A review. Clay Miner. 2002, 37, 1–22. [Google Scholar] [CrossRef]
  29. Cui, Y.; Cao, L.; Qiao, P.; Chen, S.; Pang, X.; Shao, L. Provenance Evolution of Paleogene Sequence (Northern South China Sea) Based on Detrital Zircon U-Pb Dating Analysis. Earth Sci. 2018, 43, 4169–4179. [Google Scholar]
  30. Deng, H.; Zheng, W. Depositional Characteristics of Offshore Tidal Deposits in the Lower Tertiary Zhuhai Formation, Huizhou Depression, Pearl River Mouth Basin. Geoscience 2009, 23, 767–775. [Google Scholar]
  31. Duan, W.; Luo, C.; Lou, Z.; Liu, J.; Jin, A.; Zhu, R. Diagenetic differences caused by the charging of natural gases with various compositions—A case study on the lower Zhuhai Formation clastic reservoirs in the WC-A sag, the Pearl River Mouth Basin. Mar. Pet. Geol. 2017, 81, 149–168. [Google Scholar] [CrossRef]
  32. Jiang, H.; Pang, X.; Shi, H.; Yu, Q.; Cao, Z.; Yu, R.; Chen, D.; Long, Z.; Jiang, F. Source rock characteristics and hydrocarbon expulsion potential of the Middle Eocene Wenchang formation in the Huizhou depression, Pearl River Mouth basin, south China sea. Mar. Pet. Geol. 2015, 67, 635–652. [Google Scholar] [CrossRef]
  33. Li, X. Sedimentary Facies and Paleogeographic Evolution of Huizhou Depression, Zhujiang Basin in Neogene. Master’s Thesis, Chengdu University of Technology, Chengdu, China, 2007. [Google Scholar]
  34. Peng, J.; Pang, X.; Peng, H.; Ma, X.; Shi, H.; Zhao, Z.; Xiao, S.; Zhu, J. Geochemistry, origin, and accumulation of petroleum in the Eocene Wenchang Formation reservoirs in Pearl River Mouth Basin, South China Sea: A case study of HZ25-7 oil field. Mar. Pet. Geol. 2017, 80, 154–170. [Google Scholar] [CrossRef]
  35. Peng, J.; Pang, X.; Shi, H.; Peng, H.; Xiao, S.; Yu, Q.; Wu, L. Hydrocarbon generation and expulsion characteristics of Eocene source rocks in the Huilu area, northern Pearl River Mouth basin, South China Sea: Implications for tight oil potential. Mar. Pet. Geol. 2016, 72, 463–487. [Google Scholar] [CrossRef]
  36. Su, M.; Alves, T.M.; Li, W.; Sha, Z.; Hsiung, K.-H.; Liang, J.; Kuang, Z.; Wu, N.; Zhang, B.; Chiang, C.-S. Reassessing two contrasting Late Miocene-Holocene stratigraphic frameworks for the Pearl River Mouth Basin, northern South China Sea. Mar. Pet. Geol. 2019, 102, 899–913. [Google Scholar] [CrossRef]
  37. Wang, C.; Wen, S.; Liang, X.; Shi, H.; Liang, X. Detrital zircon provenance record of the Oligocene Zhuhai Formation in the Pearl River Mouth Basin, northern South China Sea. Mar. Pet. Geol. 2018, 98, 448–461. [Google Scholar] [CrossRef]
  38. Wei, Q.; Zheng, R.; Shi, H.; Du, J.; Li, X. High Resolution Sequence Stratigraphic Characteristics of the Paleogene Zhuhai Formation in Huizhou Depression Marine Delta. Acta Sedimentol. Sin. 2008, 26, 744–752. [Google Scholar]
  39. Yan, H. Reservoir Description and Prediction of HZ19 Block in Huizhou Depression. Master’s Thesis, China University of Geosciences, Beijing, China, 2010. [Google Scholar]
  40. Zhu, M.; Dai, Y.; Zhu, J.; Shu, Y.; Lin, H.; Pang, X.; Jiang, H. Geological characteristics and accumulation mechanism of Paleocene reservoir in Huizhou sag,Pearl River Mouth basin. China Offshore Oil Gas 2017, 29, 1–11. [Google Scholar]
  41. Cheng, P.; Xiao, X.M.; Tian, H.; Huang, B.J.; Wilkins, R.W.T.; Zhang, Y.Z. Source controls on geochemical characteristics of crude oils from the Qionghai Uplift in the western Pearl River Mouth Basin, offshore South China Sea. Mar. Pet. Geol. 2013, 40, 85–98. [Google Scholar] [CrossRef]
  42. Long, G.; Shi, H.; Zheng, R.; Du, J.; Chen, S.; Ge, Y. Characteristics and development controlling factors of Paleogene deep reservoirs in Huizhou depression, Pearl River Mouth basin. Mar. Orig. Pet. Geol. 2011, 16, 71–78. [Google Scholar]
  43. Long, G.; Shi, H.; Zheng, R.; Du, J.; Liu, J.; Zhang, X. Diagenesis and porosity evolution of deep reservoirs in Huizhou depression, Pearl River Mouth basin. Acta Petrol. Mineral. 2011, 30, 665–673. [Google Scholar]
  44. Xiao, S. The geological Feature and Mechanism of Hydrocarbon Accumulation of Huizhou 27 Area. Master’s Thesis, China University of Petroleum, Beijing, China, 2016. [Google Scholar]
  45. Zhang, Y. Characteristies and Main Controlling Faetors of Hydrocarbon Aceumulation in the Eogene of Huizhou Depression. Master’s Thesis, China University Of Geosciences, Wuhan, China, 2011. [Google Scholar]
  46. Cui, S.; He, J.; Shenghong, C.; Zou, H.; Cui, J. Development Characteristics of Pearl River Mouth Basin and Its Geological Conditions for Oil and Gas Accumulation. Nat. Gas Geosci. 2009, 20, 384–391. [Google Scholar]
  47. Gong, Z.; Li, S.; Xie, J. Continental Margin Basin Analysis and Hydrocarbon Accumulation of the Northern South. China Sea; Science Press: Beijing, China, 1997; p. 510. [Google Scholar]
  48. Robison, C.R.; Elrod, L.W.; Bissada, K.K. Petroleum generation, migration, and entrapment in the Zhu 1 depression, Pearl River Mouth basin, South China Sea. Int. J. Coal Geol. 1998, 37, 155–178. [Google Scholar] [CrossRef]
  49. Zhang, C.; Li, S.; Yang, J.; Yang, S.; Wang, J. Petroleum migration and mixing in the Pearl River Mouth Basin, South China Sea. Mar. Pet. Geol. 2004, 21, 215–224. [Google Scholar] [CrossRef]
  50. Zhu, M.; Graham, S.; Pang, X.; McHargue, T. Characteristics of migrating submarine canyons from the middle Miocene to present: Implications for paleoceanographic circulation, northern South China Sea. Mar. Pet. Geol. 2010, 27, 307–319. [Google Scholar] [CrossRef]
  51. Zhao, F.; Wu, S.; Sun, Q.; Huuse, M.; Li, W.; Wang, Z. Submarine volcanic mounds in the Pearl River Mouth Basin, northern South China Sea. Mar. Geol. 2014, 355, 162–172. [Google Scholar] [CrossRef]
  52. Zhang, Y.F.; Sun, Z. A study of faulting patterns in the Pearl River Mouth Basin through analogue modeling. Mar. Geophys. Res. 2013, 34, 209–219. [Google Scholar] [CrossRef]
  53. Zhang, W.; Liang, J.; Lu, J.A.; Wei, J.; Su, P.; Fang, Y.; Guo, Y.; Yang, S.; Zhang, G. Accumulation features and mechanisms of high saturation natural gas hydrate in Shenhu Area, northern South China Sea. Pet. Explor. Dev. 2017, 44, 708–719. [Google Scholar] [CrossRef]
  54. Shi, H.; Min, H.; Zhang, L.; Yu, Q.; Xiong, P.; Zhong, Z.; Liu, L. Hydrocarbon geology, accumulation pattern and the next exploration strategy in the eastern Pearl River Mouth basin. China Offshore Oil Gas 2014, 26, 11–22. [Google Scholar]
  55. Folk, R.L.; Andrews, P.B.; Lewis, D.W. Detrital sedimentary rock classification and nomenclature for use in New Zealand. N. Z. J. Geol. Geophys. 1970, 13, 937–968. [Google Scholar] [CrossRef] [Green Version]
  56. Beard, D.C.; Weyl, P.K. Influence of Texture on Porosity and Permeability of Unconsolidated Sand1. AAPG Bull. 1973, 57, 349–369. [Google Scholar]
  57. Li, Y.; Chang, X.; Yin, W.; Sun, T.; Song, T. Quantitative impact of diagenesis on reservoir quality of the Triassic Chang 6 tight oil sandstones, Zhenjing area, Ordos Basin, China. Mar. Pet. Geol. 2017, 86, 1014–1028. [Google Scholar] [CrossRef]
  58. Morad, S.; Ketzer, J.M.; De Ros, L.F. Spatial and temporal distribution of diagenetic alterations in siliciclastic rocks: Implications for mass transfer in sedimentary basins. Sedimentology 2000, 47, 95–120. [Google Scholar] [CrossRef]
  59. Goldstein, R.; Reynolds, T. Systematics of Fluid Inclusions in Diagenetic Minerals. SEPM Short Course; Society for Sedimentary Geology: Tulsa, OK, USA, 1994; Volume 31. [Google Scholar]
  60. Stasiuk, L.D.; Snowdon, L.R. Fluorescence micro-spectrometry of synthetic and natural hydrocarbon fluid inclusions: Crude oil chemistry, density and application to petroleum migration. Appl. Geochem. 1997, 12, 229–241. [Google Scholar] [CrossRef]
  61. Stoessell, R. Kaolinite Formation in Clastic Reservoirs: Carbon Dioxide Factor: ABSTRACT. AAPG Bull. 1981, 65, 998–999. [Google Scholar]
  62. Franks, S.G.; Forester, R.W. Relationships Among Secondary Porosity, Pore-Fluid Chemistry and Carbon Dioxide, Texas Gulf Coast. In Memoir 37: Clastic Diagenesis; McDonald, D.A., Surdam, R.C., Eds.; AAPG: Tulsa, OK, USA, 1984; pp. 63–79. [Google Scholar]
  63. McBride, E.F. Quartz cement in sandstones: A review. Earth-Sci. Rev. 1989, 26, 69–112. [Google Scholar] [CrossRef]
  64. Osborne, M. Variation in Kaolinite Morphology with Growth Temperature in Isotopically Mixed Pore-Fluids, Brent Group, UK North Sea. Clay Miner. 1994, 29, 591–608. [Google Scholar] [CrossRef]
  65. Surdam, R.; Boese, S.; Crossey, L. The Chemistry of Secondary Porosity. In Clastic Diagenesis; Schmidt, V., McDonald, D.A., Eds.; Geological Society: London, UK, 1984; Volume 37, pp. 127–149. [Google Scholar]
  66. Surdam, R.C.; Crossey, L.J.; Hagen, E.S.; Heasler, H.P. Organic-inorganic and sandstone diagenesis. AAPG Bull. 1989, 73, 1–23. [Google Scholar]
  67. Odin, G.S.; Matter, A. De glauconiarum origine. Sedimentology 1981, 28, 611–641. [Google Scholar] [CrossRef]
  68. Odin, G.S.; Fullagar, P.D. Chapter C4 Geological Significance of the Glaucony Facies. In Developments in Sedimentology; Odln, G.S., Ed.; Elsevier: Amsterdam, The Netherlands, 1988; Volume 45, pp. 295–332. [Google Scholar]
  69. Dove, P.M. The dissolution kinetics of quartz in sodium chloride solutions at 25 °C to 300 °C. Am. J. Sci. 1994, 294, 665–712. [Google Scholar] [CrossRef]
  70. Grigsby, J.D. Origin and Growth Mechanism of Authigenic Chlorite in Sandstones of the Lower Vicksburg Formation, South Texas. J. Sediment. Res. 2001, 71, 27–36. [Google Scholar] [CrossRef]
  71. Berger, A.; Gier, S.; Krois, P. Porosity-preserving chlorite cements in shallow-marine volcaniclastic sandstones: Evidence from Cretaceous sandstones of the Sawan gas field, Pakistan. AAPG Bull. 2009, 93, 595–615. [Google Scholar] [CrossRef] [Green Version]
  72. Amorosi, A. Glaucony and sequence stratigraphy; a conceptual framework of distribution in siliciclastic sequences. J. Sediment. Res. 1995, 65, 419–425. [Google Scholar]
  73. Worden, R.H.; Mayall, M.; Evans, I.J. The Effect of Ductile-Lithic Sand Grains and Quartz Cement on Porosity and Permeability in Oligocene and Lower Miocene Clastics, South China Sea: Prediction of Reservoir Quality. AAPG Bull. 2000, 84, 345–359. [Google Scholar]
  74. Salem, A.M.; Ketzer, J.M.; Morad, S.; Rizk, R.R.; Al-Aasm, I.S. Diagenesis and Reservoir-Quality Evolution of Incised-Valley Sandstones: Evidence from the Abu Madi Gas Reservoirs (Upper Miocene), the Nile Delta Basin, Egypt. J. Sediment. Res. 2005, 75, 572–584. [Google Scholar] [CrossRef]
  75. Worden, R.H.; Morad, S. Quartz Cementation in Oil Field Sandstones: A Review of the Key Controversies. In Quartz Cementation in Sandstones; Worden, R.H., Morad, S., Eds.; International Association of Sedimentlologists: Oxford, UK; Northampton, UK, 2000; Volume 29, pp. 1–20. [Google Scholar]
  76. Wilkinson, M.; Darby, D.; Haszeldine, R.S.; Couples, G.D. Secondary Porosity Generation During Deep Burial Associated with Overpressure Leak-Off: Fulmar Formation, United Kingdom Central Graben1. AAPG Bull. 1997, 81, 803–813. [Google Scholar]
  77. Yuan, G.; Cao, Y.; Gluyas, J.; Li, X.; Xi, K.; Wang, Y.; Jia, Z.; Sun, P.; Oxtoby, N.H. Feldspar dissolution, authigenic clays, and quartz cements in open and closed sandstone geochemical systems during diagenesis: Typical examples from two sags in Bohai Bay Basin, East China. AAPG Bull. 2015, 99, 2121–2154. [Google Scholar] [CrossRef]
  78. Chuhan, F.A.; Bjørlykke, K.; Lowrey, C.J. Closed-System Burial Diagenesis in Reservoir Sandstones: Examples from the Garn Formation at Haltenbanken Area, Offshore Mid-Norway. J. Sediment. Res. 2001, 71, 15–26. [Google Scholar] [CrossRef]
  79. Higgs, K.E.; Zwingmann, H.; Reyes, A.G.; Funnell, R.H. Diagenesis, Porosity Evolution, and Petroleum Emplacement in Tight Gas Reservoirs, Taranaki Basin, New Zealand. J. Sediment. Res. 2007, 77, 1003–1025. [Google Scholar] [CrossRef]
  80. Xi, K.; Yingchang, C.; Jahren, J.; Zhu, R.; Bjørlykke, K.; Haile, B.; Lijing, Z.; Hellevang, H. Diagenesis and reservoir quality of the Lower Cretaceous Quantou Formation tight sandstones in the southern Songliao Basin, China. Sediment. Geol. 2015, 330, 90–107. [Google Scholar] [CrossRef]
  81. Bjørlykke, K. Relationships between depositional environments, burial history and rock properties. Some principal aspects of diagenetic process in sedimentary basins. Sediment. Geol. 2014, 301, 1–14. [Google Scholar] [CrossRef]
  82. Ramm, M. Reservoir quality and its relationship to facies and provenance in Middle to Upper Jurassic sequences, northeastern North Sea. Clay Miner. 2000, 35, 77–94. [Google Scholar] [CrossRef]
  83. Lundegard, P.D. Sandstone porosity loss; a “big picture” view of the importance of compaction. J. Sediment. Res. 1991, 62, 250–260. [Google Scholar] [CrossRef]
Figure 1. Geological background maps: (A) simplified structural map of the Pearl River Mouth Basin and location of research area; and (B) simplified structural map of the Huizhou Sag and well sites.
Minerals 10 00170 g001
Figure 2. Compressed lithostratigraphic columns and important tectonic movements of the Huizhou Sag (modified from Zhang et al. [53], Shi et al. [54]).
Minerals 10 00170 g002
Figure 3. Sandstone component ternary diagram (modified from Folk, Andrews and Lewis [55]) showing the detrital composition of the samples in (A) Huixi and (B) Huidong.
Minerals 10 00170 g003
Figure 4. Thin section photomicrographs of samples. Red border represents Huixi, and blue border represents Huidong: (A) L19-1, 3587.2 m, plane-polarized light. Large quantities of potassium feldspar (F) stained yellow by potassium ferricyanide, long contacts among grains. (B) L21-6, 3722 m, cross-polarized light. Large quantities of plastic lithic fragments (R) and concave-convex contact among grains. (C) L19-2, 3674.5 m, plane-polarized light. Intragranular dissolution pores (Pgp) of feldspar and kaolinite (K) filled among grains. (D) L22-2, 3880.5 m, plane-polarized light. Photomicrograph showing feldspar intragranular dissolution pores (Pgp), ferrocalcite (Fca) filled in pores, and granular glauconites (G). (E) L19-1, 3439.5 m, plane-polarized light. A large amount of granular dolomite (Do) cements between grains. (F) L22-2, 4032.1 m, plane-polarized light. A large amount of granular ankerite (An) cements between grains. (G) L25-11, 3242 m, plane-polarized light. Photomicrograph showing many intergranular pores (Pi), kaolinites (K), and point and long contacts among grains. (H) L21-18, 3294 m, plane-polarized light. Concave-convex contacts among grains and stylolite (St).
Minerals 10 00170 g004
Figure 5. Frequency distribution histograms of (A) grain size and (B) grain sorting
Minerals 10 00170 g005
Figure 6. Thin section and fluorescence photomicrographs of samples: (A) L19-2, 3687 m. Aqueous two-phase isolated primary inclusions in quartz overgrowth (Qo). (B) L21-3, 3203.0 m. Aqueous two-phase isolated primary inclusions in quartz overgrowth (Qo). (C) L21-18, 3308.01 m. Fluorescence photomicrograph showing three phases of hydrocarbon charging: I, weak small-scale blue fluorescence between quartz grains and their overgrowths (Qo); II, stronger blue fluorescence among grains; III, blue-white fluorescence in the dissolution pores of feldspar (F). (D) L21-18, 3433.5 m. Fluorescence photomicrograph showing two phases of hydrocarbon charging: I, weak small-scale blue fluorescence between quartz grains and their overgrowths (Qo); II, blue-white fluorescence in the dissolution pores of feldspar (F) and lithic fragments (R) and in the intercrystallite pores of kaolinite (K).
Minerals 10 00170 g006
Figure 7. SEM and cathodoluminescence photomicrographs of samples. Red border represents Huixi, and blue border represents Huidong: (A) L19-1, 3674.5 m. Cathodoluminescence photomicrograph showing feldspar (F) with blue luminescence, kaolinite (K) with dark blue luminescence and quartz overgrowths (Qo) with no luminescence. (B) L21-18, 3308.01 m. Cathodoluminescence photomicrograph showing potassium feldspar with blue luminescence and dolomite (Do) with no luminescence. (C) L25-11, 3238.7 m. SEM photomicrograph showing intergranular authigenic quartz crystals (Qa). (D) L22-2, 3950 m. SEM photomicrograph showing cementation of pyrite (Pr), gypsum (Gy) and I/S (I/S). (E) L19-2, 3697.3 m. SEM photomicrograph showing cementation of kaolinite (K) and chlorite (Ch); (F) L22-2, 3897.5 m. SEM photomicrograph showing the cementation of quartz overgrowth (Qo), illite (I) and chlorite (Ch). (G) L19-2, 3686.3 m. SEM photomicrograph showing feldspar dissolution (F) along cleavages. (H) L22-2, 3753 m. SEM photomicrograph showing the dissolution of quartz (Q).
Minerals 10 00170 g007
Figure 8. Fitting of the relation between areal porosity and true porosity in (A) Huixi and (B) Huidong.
Minerals 10 00170 g008
Figure 9. SEM photomicrographs of sandstone samples: (A) L21-18, 3433.5 m. SEM photomicrograph showing kaolinite (K) adhered to the surface of quartz overgrowth (Qo). (B) L25-11, 3238.7 m. SEM photomicrograph showing kaolinite (K) adhered to the surface of quartz overgrowth (Qo). (C) L19-2, 3697.3 m. SEM photomicrograph shows the dissolution of feldspar (F) along cleavage. (D) L22-2, 3834 m. SEM photomicrograph showing the dissolution of quartz (Q). (E) L22-2, 3812 m. SEM photomicrograph showing the dissolution of ankerite (An). (F) L22-2, 4032.1 m. SEM photomicrograph showing the dissolution gypsum (Gy). (G) L27-4, 3427.0 m, plane-polarized light. Photomicrograph showing granite fragments (G). (H) L27-4, 3427.0 m, cross-polarized light. Photomicrograph showing granite fragments (G).
Minerals 10 00170 g009
Figure 10. Diagenetic processes of sandstone samples in (A) Huixi and (B) Huidong.
Minerals 10 00170 g010
Figure 11. The evolution of the diagenetic environment. (A) the distribution of hydrocarbon kitchens and the section line, and (B) differences in the diagenetic environment between Huixi and Huidong.
Minerals 10 00170 g011
Figure 12. Diagenetic processes and porosity evolution of the Zhuhai Formation in the Huizhou Sag.
Minerals 10 00170 g012
Figure 13. Cross-plots of (A) initial porosity–burial depth. (B) fitted porosity–burial depth. (C) porosity reduction due to compaction–burial depth. (D) porosity reduction due to cementation–burial depth. (E) porosity enhancement due to dissolution–burial depth.
Minerals 10 00170 g013
Figure 14. Cross-plots of intergranular volume (IGV)–the volume of cement for samples from the Zhuhai Formation in (A) Huixi and (B) Huidong (modified from Houseknecht [12], Lundegard [83]).
Minerals 10 00170 g014
Table 1. Homogenization temperature of primary inclusions found in quartz overgrowths.
WellDepth (m)Mineral TypesTh (°C)
L19-13464.20 Quartz overgrowth114.10
L19-13464.20 Quartz overgrowth119.20
L19-13464.20 Quartz overgrowth114.20
L19-13576.20 Quartz overgrowth120.90
L19-13576.20 Quartz overgrowth119.30
L21-33203.00 Quartz overgrowth144.50
L21-33203.00 Quartz overgrowth143.50
Th = homogenization temperature.
Table 2. Porosity evolution statistics from vital exploration wells.
WellDepth (m)S0Pa (%)Φa (%)Φ1 (%)Φ0 (%)ΦL (%)ΦCL (%)ΦD (%)
L25-113157.00 1.28 8.82 17.60 14.60 38.82 24.18 1.65 1.61
L25-113238.70 1.68 7.83 16.10 12.50 34.54 22.91 0.50 1.38
L25-113312.40 1.83 0.58 5.07 3.90 33.46 0.95 29.08 0.47
L25-113321.01 1.38 3.97 10.23 6.10 37.49 1.88 35.61 6.10
L19-33104.80 1.27 15.65 27.99 25.30 38.93 19.16 1.30 6.83
L19-33110.50 1.27 13.65 24.95 24.80 38.96 17.12 2.50 5.46
L19-33121.00 1.33 10.83 20.66 22.90 38.17 17.66 1.50 3.89
L19-33159.00 1.30 12.70 23.51 24.00 38.53 15.67 1.74 2.88
L19-33165.00 1.40 12.88 23.78 24.50 37.27 11.98 2.50 1.72
L19-33167.00 1.28 9.16 18.12 21.80 38.85 17.45 2.00 2.40
L19-33171.00 1.20 12.14 22.65 25.40 39.95 14.61 3.50 3.56
L19-33173.00 1.21 9.53 18.68 22.70 39.80 19.00 1.73 3.63
L19-33218.00 1.26 10.51 20.17 25.00 39.04 15.29 2.50 3.75
L19-23462.20 1.19 6.22 13.65 16.00 40.21 22.73 4.20 2.72
L19-23476.90 1.24 12.20 22.74 20.70 39.38 18.35 2.60 2.28
L19-23591.40 1.23 14.92 26.88 20.60 39.47 15.64 5.50 2.27
L19-23686.38 1.42 3.51 9.53 8.30 37.05 23.89 8.26 3.40
L19-23688.14 1.50 4.84 11.55 11.20 36.18 21.34 5.20 1.57
L19-23690.62 1.50 5.87 13.12 13.30 36.18 20.50 4.50 2.13
L21-73500.80 1.32 1.96 9.98 12.07 38.29 24.65 3.50 1.93
L21-183290.49 1.46 2.54 10.94 12.80 36.59 23.84 2.00 2.05
L21-183338.01 1.27 0.00 6.71 5.44 38.99 33.55 0.00 0.00
L21-183344.99 1.35 2.43 10.76 12.40 37.85 25.43 2.50 2.48
L22-23660.00 1.34 1.29 8.86 7.60 38.05 29.29 2.00 0.84
L22-23753.00 1.29 4.33 13.93 13.08 38.61 24.71 2.00 1.18
L22-23834.00 1.33 3.52 12.58 9.67 38.09 28.58 1.00 1.16
L22-23882.00 1.49 2.15 10.29 9.16 36.29 23.55 4.59 1.01
L22-23888.00 1.27 2.96 11.64 10.66 38.97 26.95 2.00 0.64
L22-23937.50 1.41 1.29 8.86 8.32 37.11 28.54 2.00 1.75
S0 = Trask sorting coefficient; Pa = areal porosity; Φa = fitted porosity; Φ1 = true porosity; Φ0 = initial porosity; ΦL = porosity reduction due to compaction; ΦCL = porosity reduction due to cementation; ΦD = porosity enhancement due to dissolution.

