Article

Ultrafast Elemental Mapping of Platinum Group Elements and Mineral Identification in Platinum-Palladium Ore Using Laser Induced Breakdown Spectroscopy

by
Kheireddine Rifai
1,2,*,
Lütfü-Çelebi Özcan
1,
François R. Doucet
1,
Kyle Rhoderick
3 and
François Vidal
3
1
ELEMISSION Inc., 3410, Thimens blvd., Montreal, QC H4R 1V6, Canada
2
Institut National de la Recherche Scientifique, 1650 Lionel-Boulet blvd., Varennes, QC J3X 1S2, Canada
3
First Drilling, 2990 N Townsend Ave, Montrose, CO 81401, USA
*
Author to whom correspondence should be addressed.
Minerals 2020, 10(3), 207; https://doi.org/10.3390/min10030207
Submission received: 7 January 2020 / Revised: 6 February 2020 / Accepted: 21 February 2020 / Published: 25 February 2020
(This article belongs to the Special Issue Modern Luminescence Spectroscopy of Minerals)

Abstract

:
This paper demonstrates the capability of performing an ultrafast chemical mapping of drill cores collected from a platinum/palladium mine using laser-induced breakdown spectroscopy (LIBS). A scan of 40 mm × 30 mm was performed, using a commercial LIBS analyzer, onto the flat surface of a drill core with a scanning speed of 1000 Hz, and a spatial resolution of 50 µm, in about 8 min. Maps of the scanned areas for seven chemical elements (platinum, palladium, nickel, copper, iron, silicon, and magnesium), as well as a single map including the seven elements altogether, were then generated using the proprietary software integrated into the LIBS analyzer. Based on the latter image, seven minerals were identified using the principal component analysis (PCA) and correlations with the elemental maps.

1. Introduction

Platinum (Pt), palladium (Pd), rhodium (Rh), ruthenium (Ru), iridium (Ir), and osmium (Os) form the family of the platinum group elements (PGE). These elements, possessing similar chemical properties, are sometimes associated in their deposits. Their physical properties are, however, different: platinum and palladium are ductile and easy to form whereas ruthenium and osmium are hard and brittle. Ruthenium, rhodium, and palladium have densities between 12.0 and 12.5 g cm−3, while those of platinum, iridium, and osmium are between 21.4 and 22.6 g cm−3 [1].
PGE are ranked in descending order of importance for applications: palladium, platinum, ruthenium, and rhodium. Palladium, platinum, and rhodium are mainly used in emission control catalysts for vehicles. Platinum is also popular in jewelry where 34% of the production was absorbed in 2018 [1]. Today, there is a growing need for PGE, but they are a scarce resource. Thus, to meet the needs of the market at an affordable price, the extraction of PGE must be optimized. This can be done by improving the PGE production lines to allow for rapid characterization of these elements in the rock.
The rapid characterization of PGE in rock in exploitation mines offers significant potential for efficiencies. The traditional method of grade control sampling involves collecting face samples or samples from a muck pile, blast hole cuttings, and conveyor belts. All of these samples require extensive handling and preparation prior to analysis. Typical “rush” samples can be prepared and analyzed 24 h after receipt in the laboratory. Standard samples may require 3–7 days or longer, depending on the backlog of the laboratory. This delay translates into a loss of productivity because the rock cannot be assigned to its proper destination (mill or waste pile) until the analysis is complete. Worse still, a wrong decision can be made because of the delay in the analysis: the rock is misdirected and eventually money is wasted and ore is lost. Rapid sample characterization can reduce all the above-mentioned issues.
Laser-induced breakdown spectroscopy (LIBS) is a fast way to characterize almost all types of samples. LIBS is based on using a laser beam (actually, high-repetition pulses of about 10 nanoseconds each) to vaporize the surface of the sample. Then, the light emission produced by the hot vaporized material (plasma) is analyzed using a spectrometer. The chemical composition of the sample is obtained from the distinctive spectral lines of each chemical element. With proper calibration, the measured intensity of the spectral lines can provide the concentration of the elements. Each laser pulse produces a spectrum that can come from a distinct spot on the sample. Unlike traditional methods, LIBS analysis can be performed on-site, without sample preparation, and the duration of the analysis depends on the number of laser shots required for analysis. For the 1000 Hz repetition rate system used in this work, 1000 spots of 50 µm in diameter (emitting plasma, spectrum) can be acquired and analyzed per second.
LIBS has already been applied to the analysis of ore samples. Some of this work has focused on quantitative analysis of minor and major elements in the ore, others on the identification and classification of ore to distinguish valuable minerals from gangues, and others on elemental imaging of the ore. Harmon et al. reviewed most of the LIBS publications related to geochemistry in the environmental analysis up to 2013 [2]. Motto-Ros et al. published several works dealing with elemental imaging on many types of samples [3,4]. Haavisto et al. reported the use of LIBS for rapid elemental analysis of drill cores [5]. In earlier work, we reported the use of LIBS for chemical mapping of precious elements, such as gold and silver, at a scanning speed of 1000 Hz [6]. Recently, Klus et al. presented a processing methodology that shows the way to reduce the dimensionality of big data and retain only the useful spectral information by utilizing self-organizing maps (SOM) [7]. More recently, Pagnotta et al. proposed a fast method for the quantitative analysis of μ-LIBS elemental images based on the application of the self-organizing map (SOM) method for the determination of the different classes of materials in the samples, followed by a calibration-free-LIBS (CF-LIBS) analysis of the average representative spectra [8]. The rapid characterization offered by “worksite” LIBS allows for quick decisions and huge cost savings in the quality control process by eliminating the need for sample collection and preparation prior to analysis. The LIBS technology continues to be perfected, but very encouraging results have been obtained in the area of Pt/Pd grade control, Cu/Ni quality control, and Ca/Mg characterization for cement and lime applications.
This paper focuses on the results of the rapid characterization of elements and minerals in core samples from a palladium/platinum mine in the western United States. Its purpose is to demonstrate the ability of a commercial LIBS analyser to scan drill core samples and quickly identify qualitatively its elemental content and mineralogy.

2. Materials and Methods

2.1. LIBS CORIOSITY Analyser

In this study, all the experiments were performed using the LIBS CORIOSITY GEM-III analyzer manufactured by ELEMISSION Inc. (Montréal, QC, Canada) [9,10]. The LIBS CORIOSITY analyzer is fully automated. It integrates electronics, the laser source, the spectrometer and the class 1 ablation chamber in a single box. The pulsed laser source is emitting at 1064 nm and enables a repetition rate from 1 to 1000 Hz. The laser source can deliver up to 1 mJ/pulse at the maximum repetition rate. The focusing optics can produce a laser spot size diameter of 50 µm on the target with a Rayleigh zone (depth of field) of 5 mm to accommodate rock surface roughness and imperfection. The working distance between the optical window, behind which are the laser and the spectrometer, and the surface of the sample is about 150 mm. This LIBS analyzer is also equipped with an autofocusing system to ensure the sample positioning at the focal plane (minimum spot size) within less than 30 µm. In addition, an overview of the sampling area allows precise positioning of the sample to scan the region of interest.
Plasma light, collected by means of standard achromatic lenses (to ensure a minimum chromatic shift over the entire spectrum), is sent by an optical fibre, of 400 μm in diameter, to a spectrometer equipped with a grating of 2400 lines/mm and covering the spectral range 252–371 nm. This spectral window contains the most intense spectral lines for palladium (340.46 nm), platinum (306.47 nm), nickel (352.45 nm), copper (324.75 nm), aluminum (309.27 nm), iron (259.94 nm), magnesium (279.55 nm and 285.21 nm), and silicon (288.16 nm) with a spectral resolution of 58 pm/pixels. The spectrometer was equipped with a cMOS camera (2 048 pixels) which is controlled by custom-made electronics. The CORIOSITY LIBS analyzer is also equipped with another spectrometer with a grating of 830 lines/mm covering the spectral range 616–971 nm. The spectral resolution of this spectrometer is 170 pm/pixels. This spectral window contains spectral lines of potassium (766.5 nm, 769.9 nm), sodium (818.33 nm, 819.48 nm), lithium (670.78 nm), sulfur (921.29 nm, 922.82 nm, 923.73), and oxygen (777.22). The readout of the camera is 1000 Hz. The LIBS CORIOSITY analyzer allows scans of 40 mm × 40 mm areas on the samples for each fixed position of the sample. Then a translation stage moves the sample to an adjacent scan area to generate a larger image through image stitching.

2.2. Ore Samples

A drill core containing palladium and platinum from the Stillwater mine in Montana, USA, was cut and a LIBS scan of 40 mm × 30 mm of its flat surface was made. More precisely, the drill core was collected from the JM Reef contained in the base of the Banded Series zone of the Stillwater Igneous Complex, a layer mafic intrusion in Southwestern Montana. There are three generalized zones within the complex, the Basal, the Ultramafic and the Banded Series. The Banded Series consists of alternating Gabbro, Norite and Anorthosites. The J-M Reef is similar to the Merensky Reef of the Bushveld complex of South Africa. The JM Reef consists of one to three-meter-thick pegmatitic peridotite and troctolite with disseminated sulfide minerals. Common sulfides include pyrrhotite, pentlandite (containing up to 5% Pd), and chalcopyrite. The drill core of 330 mm was taken from a depth of 270.6–273.9 m. It has been cut longwise and half of it was grinded, homogenized and analysed by fire assay. The obtained concentrations of Pd and Pt are respectively 110 and 21 ppm. Figure 1 shows an optical image of the scanned area (outlined in red). In this image, some yellowish areas highlighted by ellipses correspond to sulfide-based minerals (see also Figure 3) which can host or be associated with PGE. The LIBS spectra were collected at 1000 Hz with a step size of 50 μm, forming an image composed of 801 × 601 pixels, in about 8 min.

2.3. Identification of the Mineralogical Classes

We have recorded n = 801 × 601 spectra at different locations on the sample, each spectrum containing k = 4096 wavelengths. We used principal component analysis (PCA) to reduce dimensionality of the n × k data matrix X and create rapidly an image that identifies and locates the different minerals present on the rock surface. PCA allows us to reduce the dimensionality of the n × k matrix X to an n × a score matrix T and an k × a loading matrix T with a < k principal components which contain altogether most variations of the matrix X. The a principal components of the score matrix T are ranked according to the amount of variance of the matrix X they explain. The PCA decomposition can be expressed by [11]:
X = T P’ + E
where P’ is the k × a loading matrix and the n × k matrix E is the residual variance that is not included in T P’ for p principal components.
For image display purposes, only the 3 first principal components are retained to create the automated PCA mineral maps by range scaling the n × 3 score matrix T and multiplying it by 255 to make an 8 bits RGB (red–green–blue) image encoding. Reconstructing the image based on the n specific positions using the T (n × 3) scores encoded in RGB automatically reveals 7 clusters of different colors (scores express in RGB with the correct XY acquisition indexation) on the first visual inspection of the PCA map. Thereafter, the ELEditTM software allows us to target all the pixel positions corresponding to these 7 colored clusters and retrieves their corresponding mineral spectral fingerprints (as shown in Figure 2a,b) by clicking on the colored cluster. Hence, the mineral fingerprints can be used directly for machine learning to recognize these minerals in unknown rocks (data not shown as it is outside the scope of this manuscript). It is important to note that it is still possible that further mineralogical classes are left in the residual matrix E with the remaining noise since, for display purposes, only the first 3 principal components have been used. For further information about LIBS, PCA score maps can be found in the publication of Moncayo et al. [12]. The investigation of the remaining variance by using additional principal components is outside the scope of this manuscript.

3. Results and Discussion

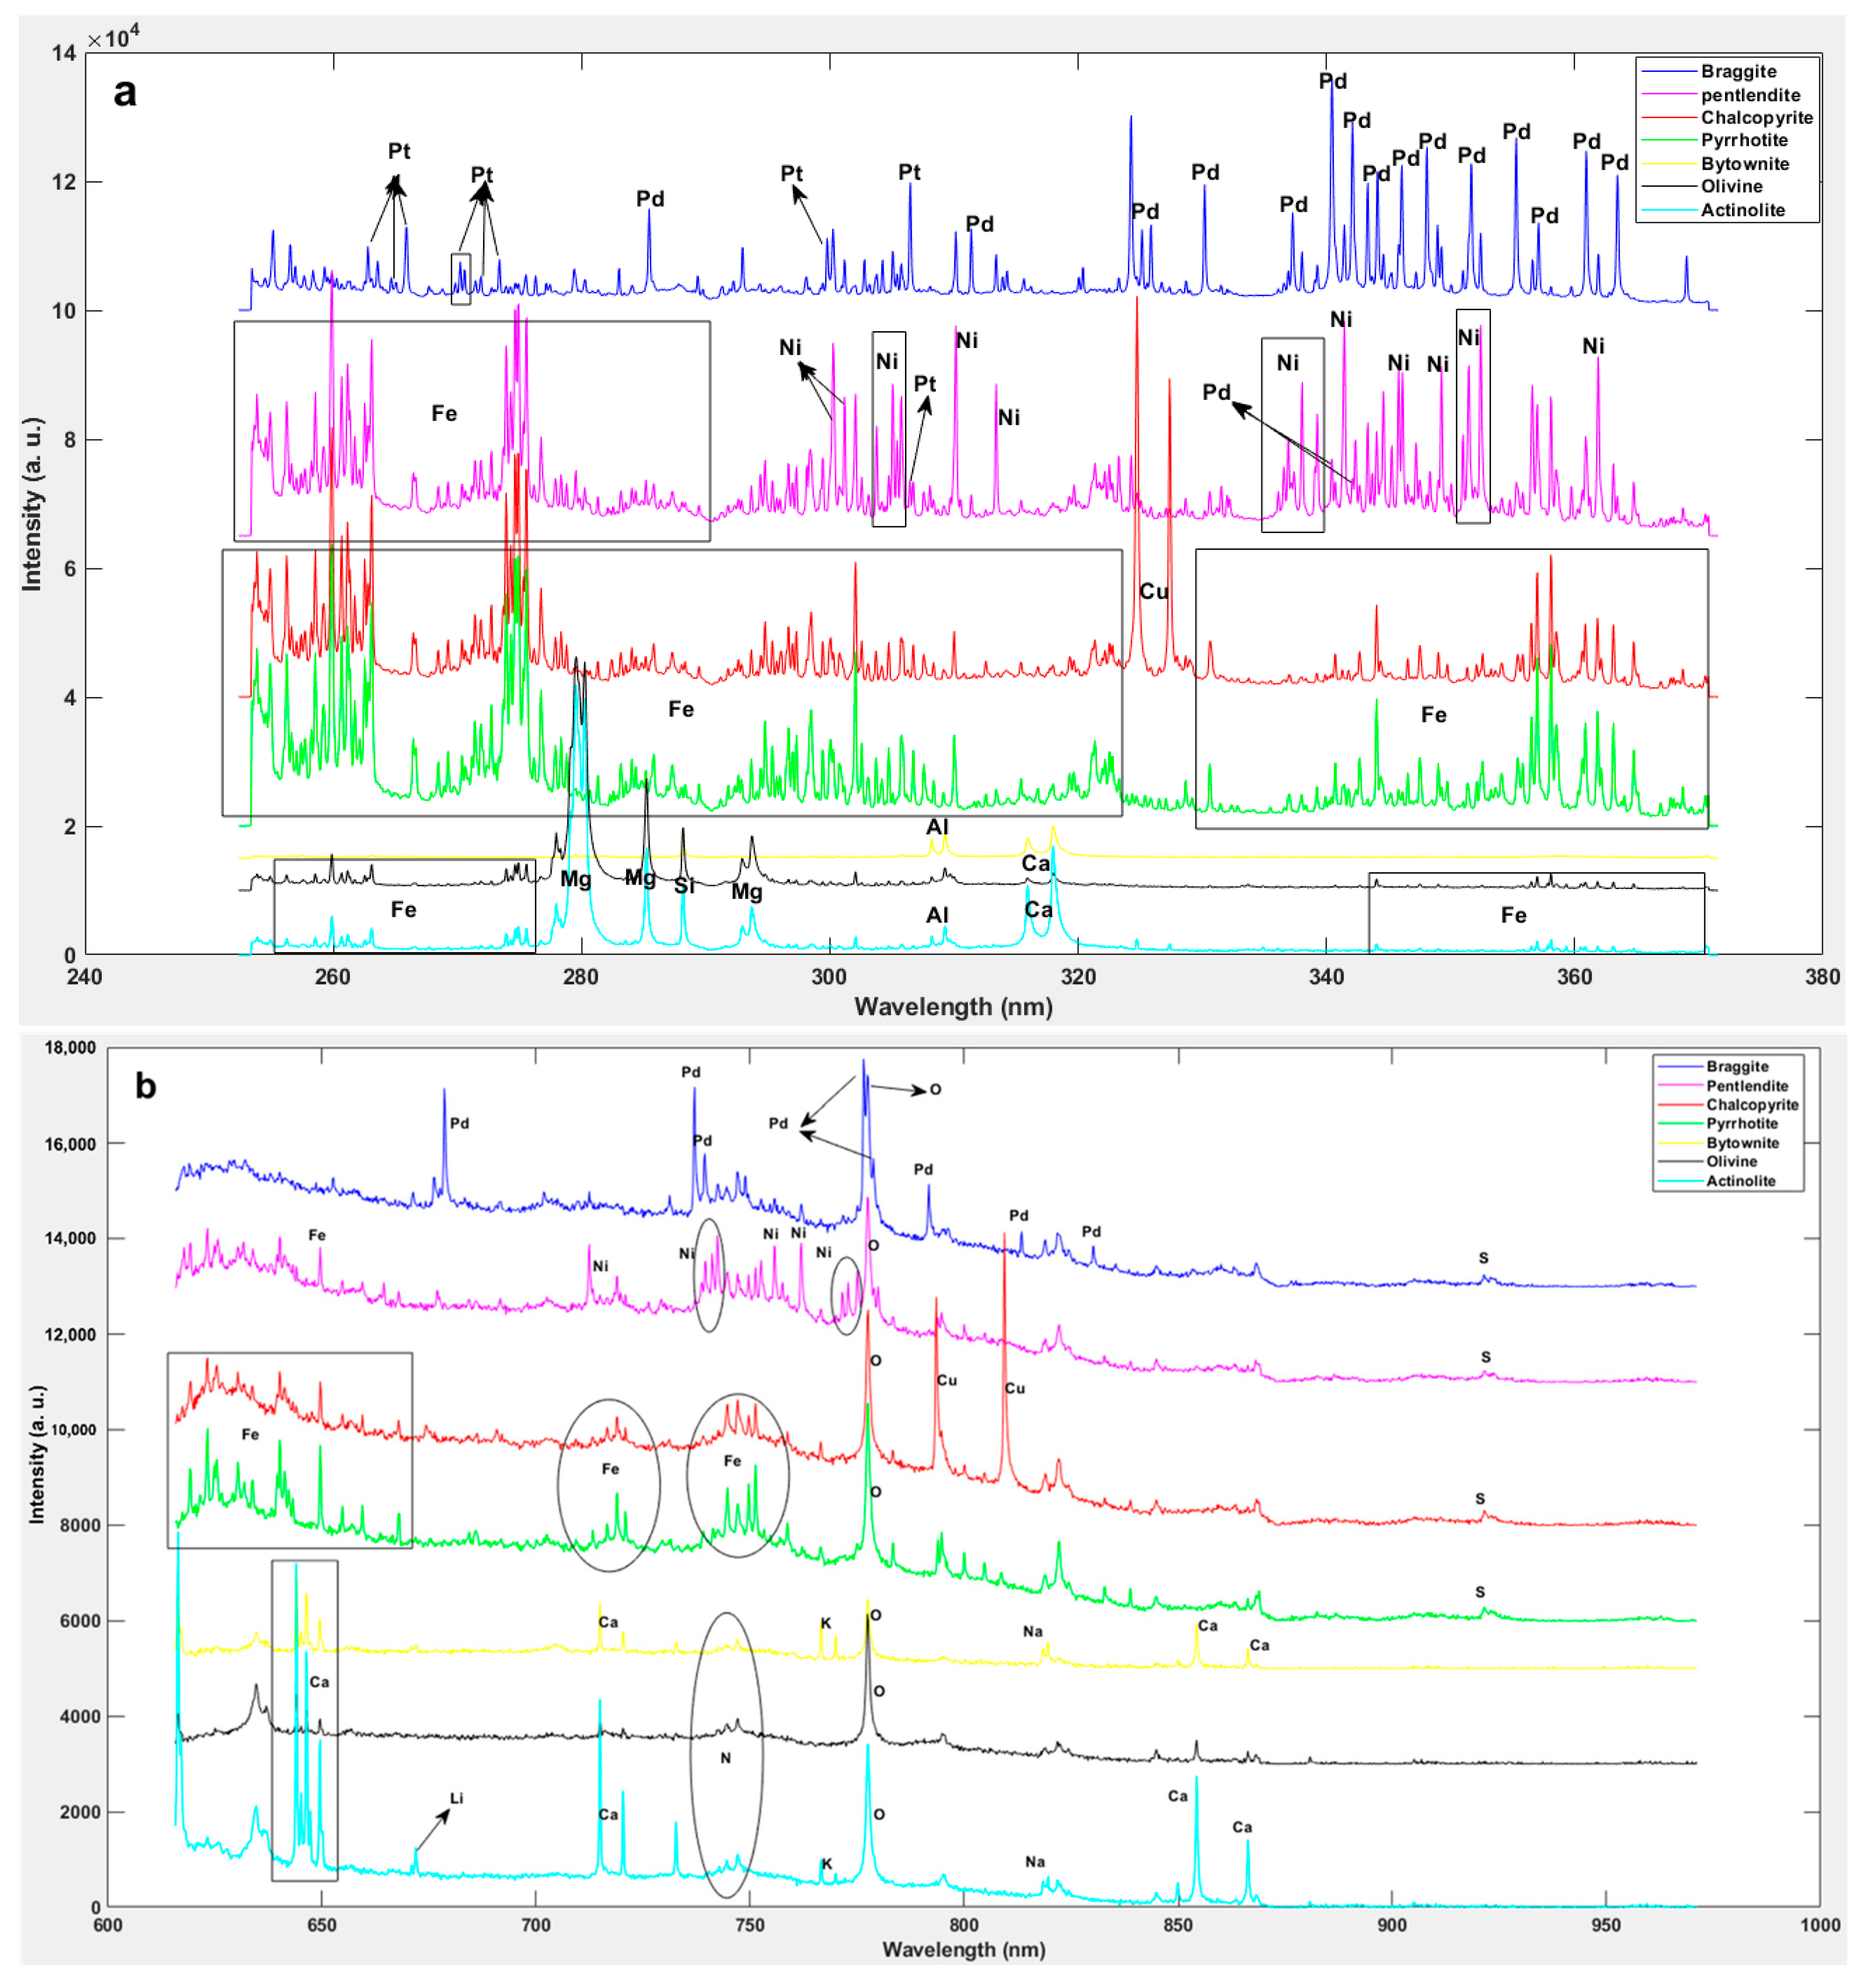
Figure 2a,b shows the seven mineral spectral fingerprints obtained from the automated mineral maps created by PCA for two wavelength intervals. In Figure 2a,b, 15 chemical elements were identified from the spectra for the minerals (Pd, O, S, Fe, Ni, Cu, Ca, K, Na, Li, Pt, Mg, Al, N, and Si) based on the atomic spectra database of the National Institute of Standards and Technology (NIST) [13].
Most of the mineralogical attributions given in the captions of Figure 2 were made using the multi-elemental spectral information along with previous mineralogical characterizations of Stillwater complex orebody [14,15]. Note that sodium, potassium, and lithium have been found in some spectral fingerprints although they are not part of the generic composition of the corresponding mineral. These elements, which are most likely in the sub-ppm range, are nevertheless detected by LIBS due to their intense spectral lines. In the following, the generic composition of the minerals is indicated in square brackets.
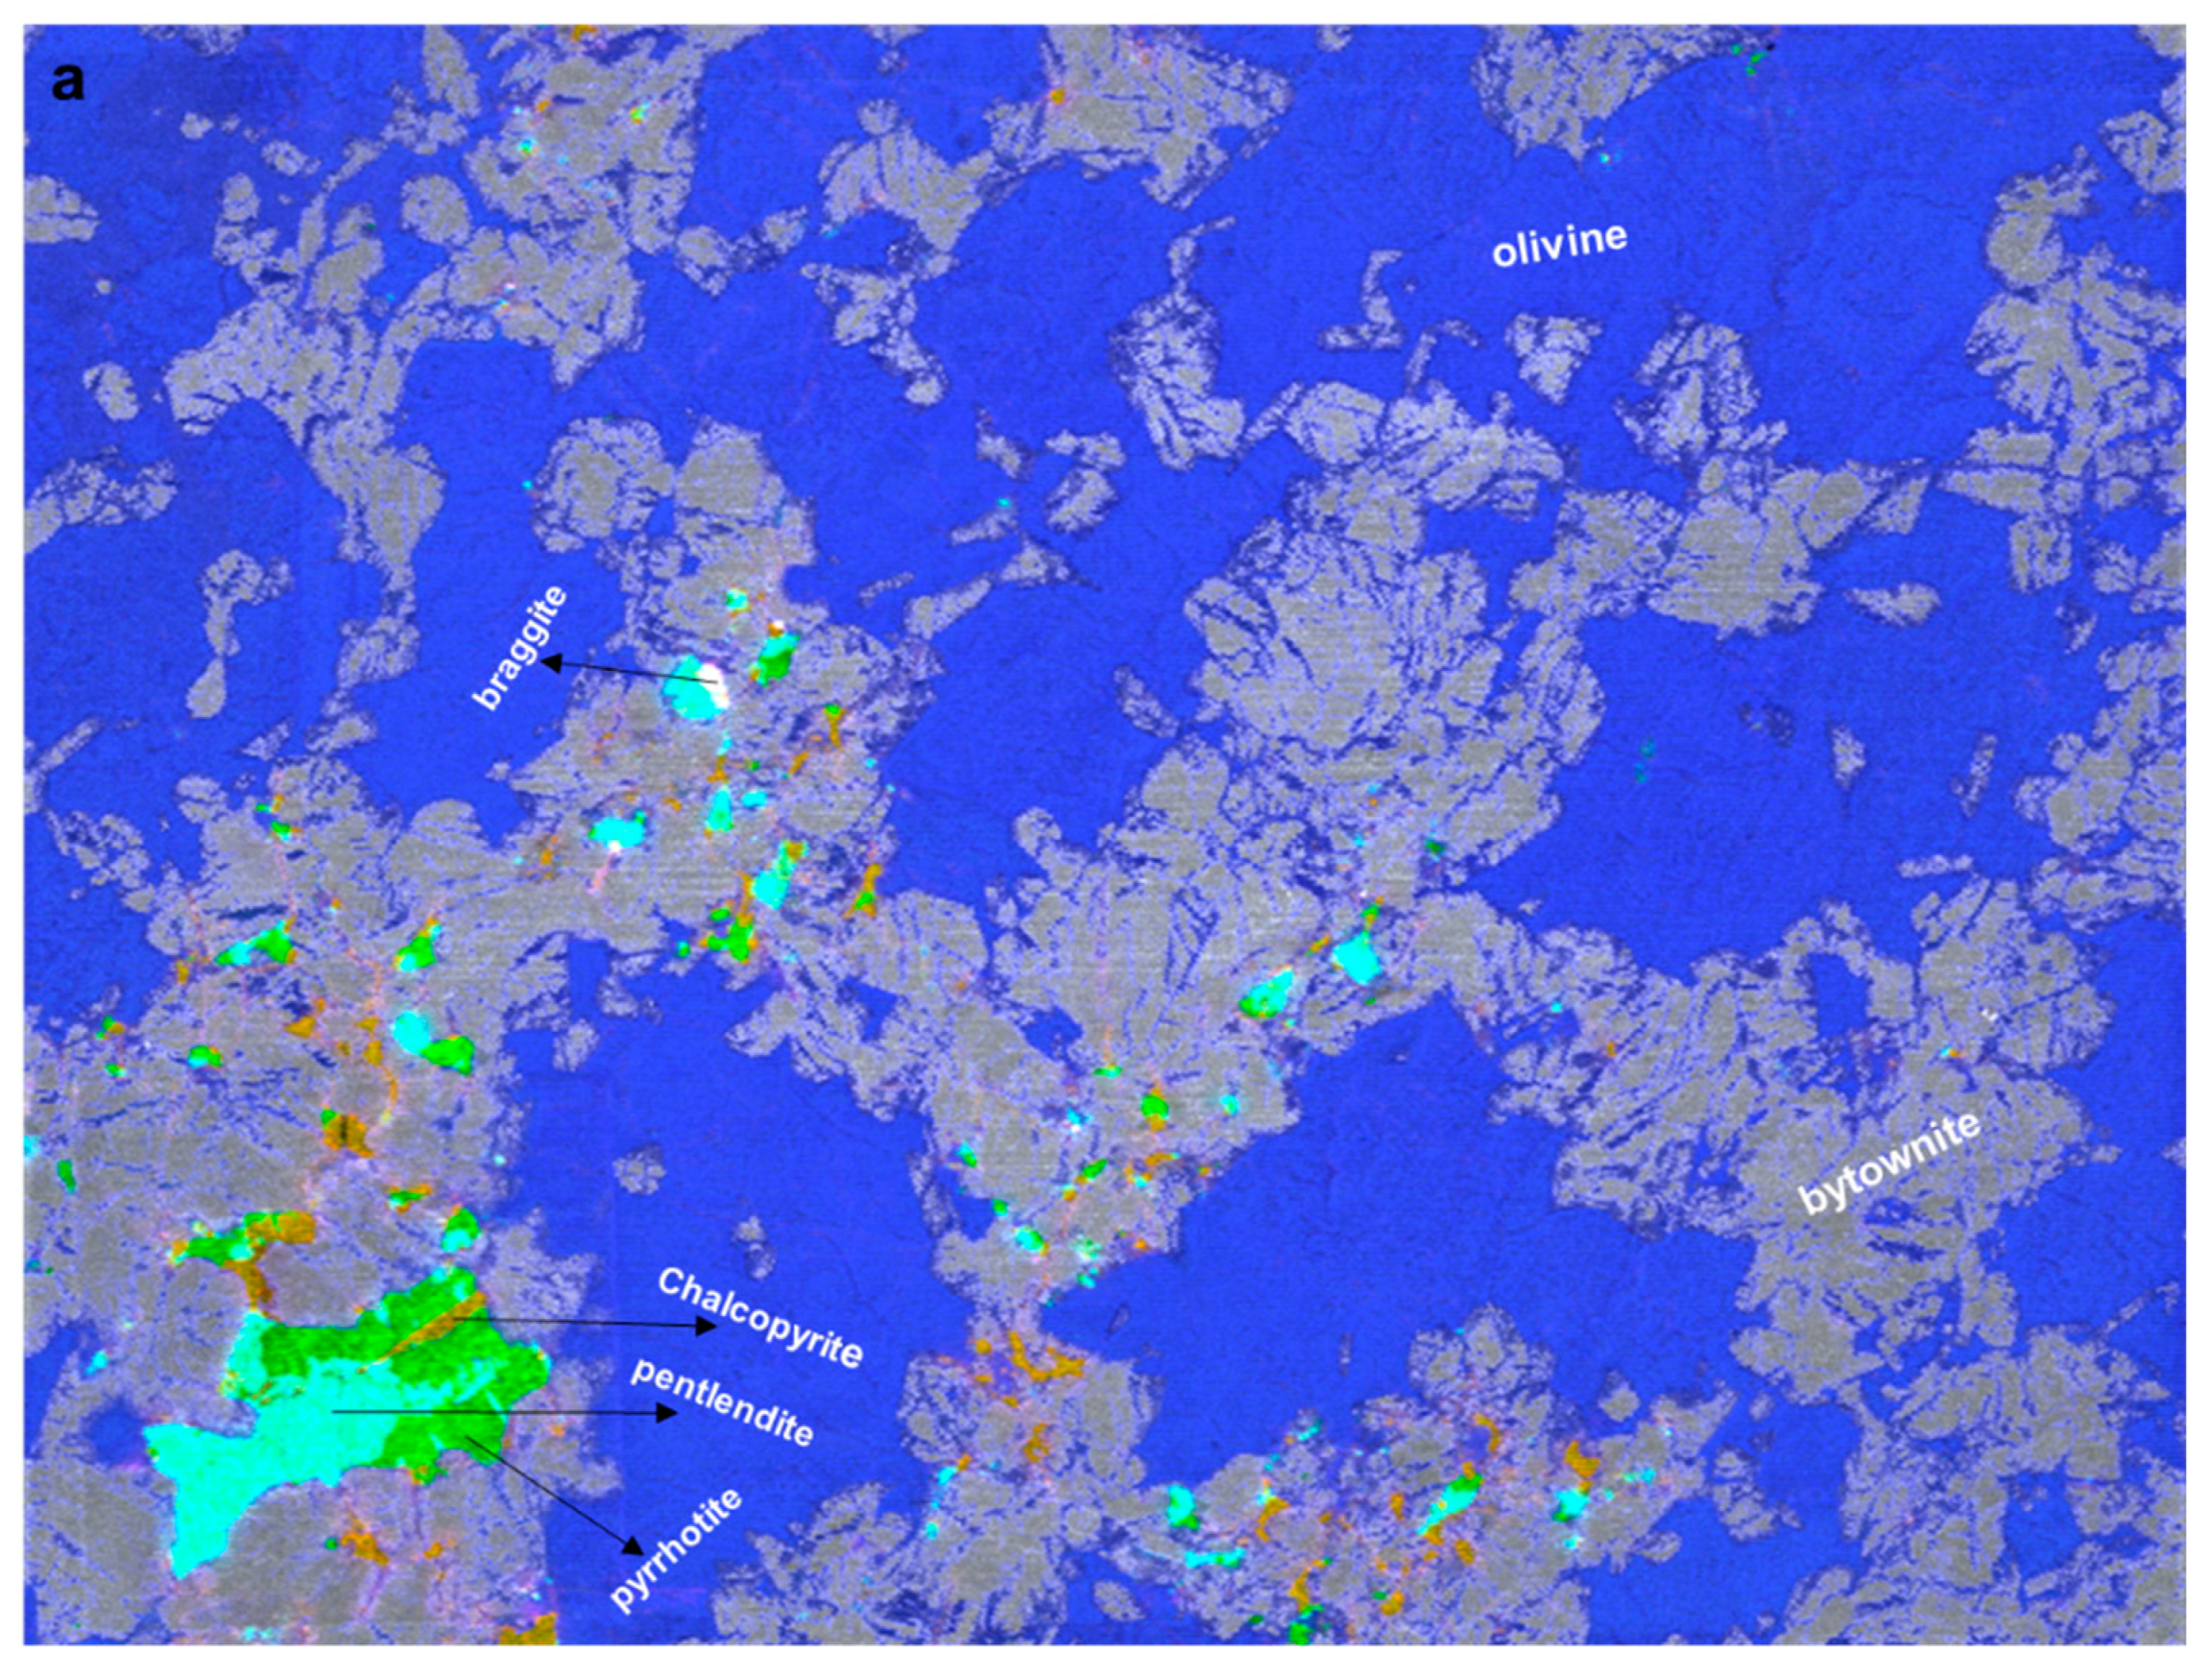
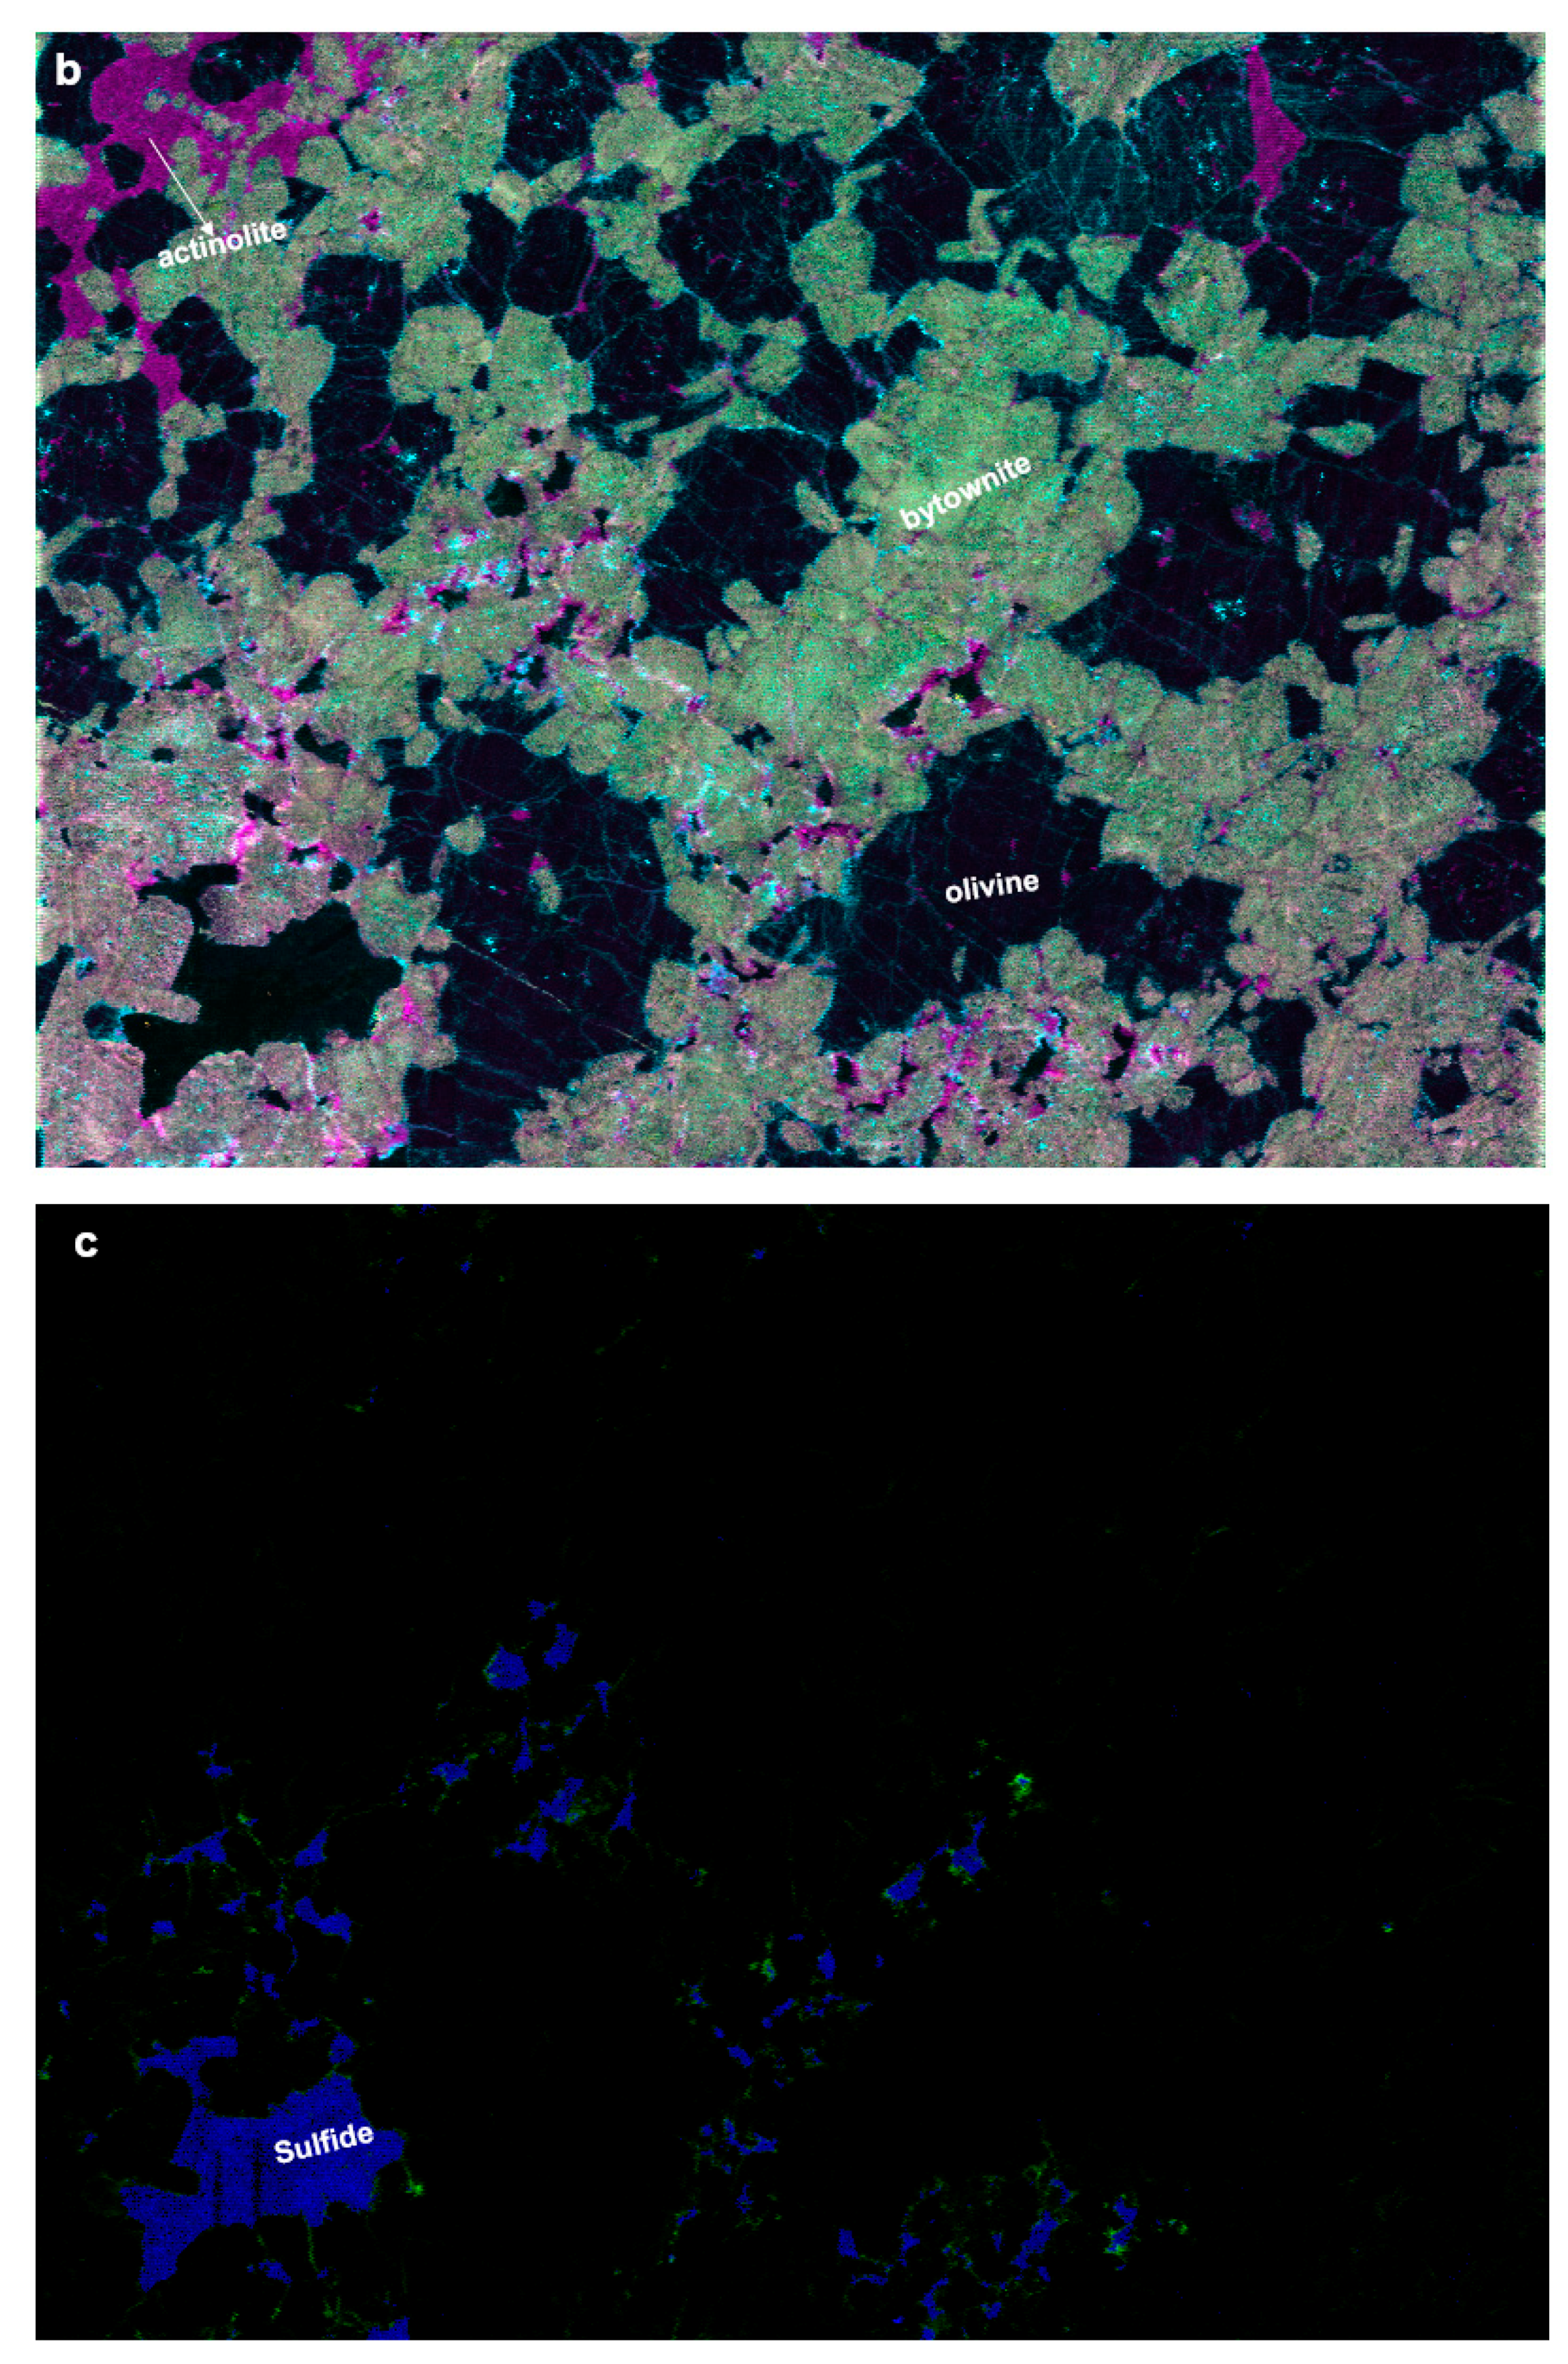
The braggite [(Pt,Pd,Ni)S] spectral fingerprint contains mainly platinum, palladium, and sulfur with small amounts of nickel as seen in the corresponding PCA spectra of Figure 2. Therefore, it was impossible for LIBS to distinguish between these two minerals. The pentlandite [(Fe, Ni)9S8] spectral fingerprint mostly contains iron, nickel, and sulfur, as well as traces of palladium and platinum. The chalcopyrite [CuFeS2] spectral fingerprint is characterized by its large amounts of copper, iron, and sulfur [6,16]. The pyrrhotite [Fe1.0–0.8S0.0–0.2] spectral fingerprint essentially contains iron and sulfur. Pyrite [FeS2] is another possibility, but the LIBS CORIOSITY analyzer is able to discriminate between these two minerals since pyrite spectra contain less intense iron lines relative to sulfur lines by comparison to pyrrhotite. The bytownite [(Ca0.7–0.9,Na0.3–0.1){Al(Al,Si)Si2O8}] spectral fingerprint is recognizable by the significant amounts of silicon, aluminum, calcium, potassium, and sodium. The olivine group [{(Mg,Fe,Mn)2,Ca(Mg,Fe)}SiO4] spectral fingerprint is magnesium-rich and contains calcium, iron, and less aluminum than bytownite. The actinolite [Ca2(Mg,Fe)5Si8O22(OH)2] spectral fingerprint is characterized by the presence of magnesium, silicon, much more calcium than the olivine group, as well as iron and potassium. We note that by using models based on chemometry, such as neural networks [17], soft independent modeling by class analogy (SIMCA) [18], or discriminant partial least-squares analysis (PLS-DA) [19], it is possible to distinguish complex mineral phases whose chemical composition is similar by using their spectral fingerprints. In addition, the concentration of the various chemical elements on the surface of the sample can be obtained by considering the occupation area of each mineral on the surface and the proportion of the elements in the identified minerals. Figure 3a–c shows the mappings of seven (Si, Mg, Cu, Fe, Ni, Pd, and Pt), three (K, Ca, and Na) and two (S and Li) elements in the scanned area, respectively. These 12 elements are shown on different maps for better readability. The seven minerals inferred from PCA are identified in Figure 3a,b while the sulfide group (pentlandite, braggite, pyrrhotite, and chalcopyrite) is shown in Figure 3c. From Figure 3a it is clear that the two most abundant minerals are the olivine group (containing much Mg, in blue) and the bytownite (containing much Si, in gray). The bytownite hosts all the sulfide-based minerals. It is worth noting that the minerals hosting the PGE (pentlandite and braggite) are generally surrounded by pyrrhotite and chalcopyrite as can be seen in Figure 3a. Thus, the latter minerals could be considered as indirect PGE tracers in the type of deposit under consideration here.
The map of Figure 3b also shows the distribution of the olivine group and of bytownite since the olivine group appears in black (low amounts of K, Na, and Ca) while bytownite appears in green as a result of the mixing of the cyan (K) and yellow (Na) colors. Actinolite appears in magenta due to the significant amount of Ca compared to those of bytownite and of the olivine group. One notes that potassium alters the olivine group by filling fine cracks inside the mineral and at its interface with bytownite. This is an interesting feature from a geological point of view because it provides clues regarding the mineralogical formation (kinetics) of the deposit.
In Figure 3c, it can be seen that lithium surrounds the areas rich in sulfur. Such a piece of information could not be revealed at all by X-ray fluorescence (XRF) because this technique is not suitable to detect light elements such as lithium. To the best of our knowledge, this is the first study that reports the presence of lithium surrounding sulfide-based minerals.
To corroborate the attribution of the PCA mineralogical classes, single-element maps for the 12 chemical elements Si, Mg, Na, Ca, K, Al, Fe, Cu, Ni, Pd, Pt, and S were produced. They are shown in Figure 4. The intensity of the selected emission line for each element was normalized between 0 (dark blue) and 1 (red). Comparing Figure 4 with Figure 3a,b, it can be seen that bytownite is richer than the olivine group in Si, Na, Ca, K, and Al while the olivine group is particularly rich in Mg and contains more Fe than bytownite. It is also apparent that magnesium and calcium are particularly abundant in actinolite. Compared with Figure 3c, it can be seen that all the heavy metals Fe, Cu, Ni, Pd, and Pt are mostly contained in the sulfur-rich areas which are essentially hosted by bytownite.

4. Conclusions

The capability of performing ultrafast chemical elemental mapping onto the flat (unpolished) surface of a platinum/palladium drill core at a scanning speed of 1000 Hz is demonstrated for the first time. This was achieved using the LIBS CORIOSITY analyzer. The principal component analysis (PCA) of the nearly half-million spectra taken over the 30 mm × 40 mm scanned area allowed identification of seven mineral classes at the surface of the sample. These were then identified as braggite (dimorphs), pentlandite, chalcopyrite, pyrrhotite, bytownite, a group of olivine, and actinolite, whose generic formulas match well with the PCA mineral classes. The elemental mappings show in particular that, contrary to the light metals Al, Na, and K, the heavy metals Fe, Cu, Ni, Pt, and Pd are mostly contained in sulfide-based minerals which are all embedded in the silicon-rich bytownite. Of particular commercial importance are the Pt and Pd which were essentially found in the sulfide-based minerals braggite and pentlandite. In addition, it is reported for the first time, to the best to our knowledge, that lithium is present between silicon-rich and sulfur minerals, a piece of information that was not accessible using the XRF technique due to its lack of sensitivity for light elements.

Author Contributions

Conceptualization, K.R.; methodology, K.R. and L.-Ç.Ö.; validation, K.R.; formal analysis, K.R. and F.R.D.; resources, L.-Ç.Ö., K.R. and F.R.D.; writing—original draft preparation, K.R.; writing—review and editing, L.-Ç.Ö., F.R.D., K.R. and F.V.; supervision, F.V.; funding acquisition, L.-Ç.Ö. and F.R.D. All authors have read and agreed to the published version of the manuscript.

Funding

This research was funded by the Mitacs Accelerate program, grant number IT10564, Elemission Inc. and by the National Sciences and Engineering Research Council of Canada.

Conflicts of Interest

The authors declare no conflict of interest.

References

  1. Zientek, M.L.; Loferski, P.J.; Parks, H.L.; Schulte, R.F.; Seal, R.R., II. Platinum-Group Elements; Schulz, K.J., DeYoung, J.H., Eds.; Critical Mineral Resources of the United States—Economic and Environmental Geology and Prospects for Future Supply: U.S. Geological Survey Professional Paper; USGS Publications: Reston, VA, USA, 2017; pp. N1–N91. [CrossRef]
  2. Harmon, R.S.; Russo, R.E.; Hark, R.R. Applications of laser-induced breakdown spectroscopy for geochemical and environmental analysis: A comprehensive review. Spectrochim. Acta B 2013, 87, 11–26. [Google Scholar] [CrossRef]
  3. Ma, Q.L.; Motto-Ros, V.; Lei, W.Q.; Boueri, M.; Zheng, L.J.; Zeng, H.P.; Bar-Matthews, M.; Ayalon, A. Multi-elemental mapping of a speleothem using laser-induced breakdown spectroscopy. Spectrochim. Acta B 2010, 65, 707–714. [Google Scholar] [CrossRef]
  4. Cáceres, J.O.; Pelascini, F.; Motto-Ros, V.; Moncayo, S.; Trichard, F.; Panczer, G.; Marín Roldán, A.; Cruz, J.A.; Coronado, I.; Martín-Chivelet, J. Megapixel multi-elemental imaging by laser induced breakdown spectroscopy, a technology with considerable potential for paleoclimate studies. Sci. Rep. 2017, 7, 5080. [Google Scholar] [CrossRef] [PubMed] [Green Version]
  5. Haavisto, O.; Kauppinen, T.; Häkkänen, H. Laser-induced breakdown spectroscopy for rapid elemental analysis of drillcore. IFAC Proc. Vol. 2013, 46, 25–28. [Google Scholar] [CrossRef]
  6. Rifai, K.; Doucet, F.; Özcan, L.; Vidal, F. LIBS core imaging at kHz speed: Paving the way for real-time geochemical applications. Spectrochim. Acta B 2018, 150, 43–48. [Google Scholar] [CrossRef]
  7. Klus, J.; Pořízka, P.; Prochazka, D.; Mikysek, P.; Novotný, J.; Novotný, K.; Slobodník, M.; Kaiser, J. Application of self-organizing maps to the study of U-Zr-Ti-Nb distribution in sandstone-hosted uranium ores. Spectrochim. Acta B 2017, 131, 66–73. [Google Scholar] [CrossRef]
  8. Pagnotta, S.; Lezzerini, M.; Campanella, B.; Gallello, G.; Grifoni, E.; Legnaioli, S.; Lorenzetti, G.; Poggialini, F.; Raneri, S.; Safi, A.; et al. Fast quantitative elemental mapping of highly inhomogeneous materials by micro-Laser-Induced Breakdown Spectroscopy. Spectrochim. Acta 2018, 146, 9–15. [Google Scholar] [CrossRef] [Green Version]
  9. A Breakthrough Design for a Breakthrough Technology. Available online: http://www.elemission.ca/en/ (accessed on 25 February 2020).
  10. Özcan, L.C.; Doucet, F.R. Method and System for Analysis of Samples Using Laser Induced Breakdown Spectroscopy. U.S. Patent 62/213,431, 2 September 2015. [Google Scholar]
  11. Brereton, R.G. Chemometrics Data Analysis for the Laboratory and Chemical Plant; John Wiley & Sons: Chichester, UK, 2003; pp. 191–210. [Google Scholar]
  12. Moncayo, S.; Duponchel, L.; Mousavipak, N.; Panczer, G.; Trichard, F.; Bousquet, B.; Pelascini, F.; Motto-Ros, V. Exploration of megapixel hyperspectral LIBS images using principal component analysis. J. Anal. At. Spectrom. 2018, 33, 210–220. [Google Scholar] [CrossRef]
  13. Atomic Spectra Database. Available online: https://www.nist.gov/pml/atomic-spectra-database (accessed on 25 February 2020).
  14. Page, N.J.; Zientek, M.L.; Czamanske, G.K.; Foose, M.P. Sulfide mineralization in the Stillwater complex and underlaying rocks. Stillwater Complex Mont. Geol. Guide Mont. Bur. Mines Geol. Spec. Publ. 1985, 92, 93–96. [Google Scholar]
  15. Zientek, M.L.; Czamanske, G.K.; Irvine, T.N. Stratigraphy and nomenclature for the Stillwater complex. Stillwater Complex Mont. Geol. Guide Mont. Bur. Mines Geol. Spec. Publ. 1985, 92, 21–32. [Google Scholar]
  16. Gervais, F.; Rifai, K.; Plamondon, P.; Özcan, L.; Doucet, F.; Vidal, F. Compositional tomography of a gold-bearing sample by Laser-induced breakdown spectroscopy. Terra Nova 2019, 31, 479–484. [Google Scholar] [CrossRef]
  17. Singh, V.; Rao, M. Application of image processing and radial basis neural network techniques for ore sorting and ore classification. Miner. Eng. 2005, 18, 1412–1420. [Google Scholar] [CrossRef]
  18. Duca, D.; Mancini, M.; Rossini, G.; Mengarelli, C.; Pedretti, E.F.; Toscano, G.; Pizzi, A. Soft independent modelling of class analogy applied to infrared spectroscopy for rapid discrimination between hardwood and softwood. Energy 2016, 117, 251–258. [Google Scholar] [CrossRef]
  19. Makvandi, S.; Ghasemzadeh-Barvarz, M.; Beaudoin, G.; Grunsky, E.C.; McClenaghan, M.B.; Duchesne, C.; Boutroy, E. Partial least squares-discriminant analysis of trace element compositions of magnetite from various VMS deposit subtypes: Application to mineral exploration. Ore Geol. Rev. 2016, 78, 388–408. [Google Scholar] [CrossRef]
Figure 1. Optical image showing, outlined in red, the laser-induced breakdown spectroscopy (LIBS) scanned area of the analyzed drill core fragment. The ellipses locate sulfide-based minerals.
Minerals 10 00207 g001
Figure 2. Spectra of the seven mineral spectral fingerprints identified on the scanned area. (a) Spectra from 240 to 380 nm. (b) Spectra from 600 to 970 nm.
Minerals 10 00207 g002
Figure 3. Mineral and elemental mapping of an area of 40 mm × 30 mm, composed of 801 × 601 pixels, on the surface of the rock of Figure 1 (outlined in the red perimeter). The spatial resolution (laser spot size and step size) is 50 μm. (a) Spatial distribution of Si (gray), Mg (blue), Cu (orange), Fe (green), Ni (cyan), Pd (magenta), and Pt (yellow). (b) Spatial distribution of K (cyan), Ca (Magenta), and Na (yellow). (c) Spatial distribution of S (blue) and Li (green).
Minerals 10 00207 g003aMinerals 10 00207 g003b
Figure 4. Single element mapping for Si, Mg, Na, Ca, K, Al, Fe, Cu, Ni, Pd, Pt, and S. The intensity of the selected line for each element is scaled between 0 (dark blue) and 1 (red), as shown by the color bars.
Minerals 10 00207 g004