Article

High Temperature Pressure Oxidation of a Low-Grade Nickel Sulfide Concentrate with Control of the Residue Composition

CSIRO Mineral Resources, PO Box 7229, Karawara, WA 6152, Australia
*
Author to whom correspondence should be addressed.
Minerals 2020, 10(3), 249; https://doi.org/10.3390/min10030249
Submission received: 14 February 2020 / Revised: 28 February 2020 / Accepted: 1 March 2020 / Published: 9 March 2020
(This article belongs to the Special Issue Hydrometallurgical Processing of Base Metal Sulphides)

Abstract

:
High temperature pressure oxidation of a low-grade nickel concentrate was examined to demonstrate the potential benefits and shortcomings of this approach. The high iron sulfide content ensured that acid generation was much greater than for higher grade concentrates. This results in the formation of basic iron sulfate phases and a significant amount of sulfuric acid. Kinetic sampling during pressure oxidation tests also demonstrated the transformation of sulfide minerals, including the oxidative transformations of pentlandite to violarite and then to vaesite, the latter phase not previously noted in studies of this kind. Finally, addition of a divalent metal sulfate buffer, here magnesium sulfate, mitigates the formation of basic iron sulfates but with greater generation of sulfuric acid in the leach liquor. Under the conditions employed in this study, this acid could be employed to leach other nickel-containing materials such as nickel laterites.

Graphical Abstract

1. Introduction

The hydrometallurgical processing of nickel sulfide concentrates per se is not commonly practiced commercially though several processes for these feeds have been developed and tested at pilot scale [1,2]. Many nickel refineries (e.g., Nihama, Harjavalta, Kwinana) process nickel mattes [3], whereas only a few operations, such as those at Fort Saskatchewan, Kokkola and Talnakh, employ nickel concentrates [1,3]. The combined Ni–Co–Cu grade of concentrates, not including PGM-nickel concentrates, that are smelted typically falls in the range of around 8% to just above 20% [4], though lower grades around 6% have previously been noted [5]. Typically, a low-iron matte with iron content in the range 0.5–4% is targeted and this has meant that there has been a trend to eliminate as much of the iron sulfides as possible, through milling, during concentrate production [5].
Acid oxidative pressure leaching of nickel concentrates has been investigated since the 1950s and has been claimed to confer several benefits relative to pyrometallurgical treatment [1]:
  • The conversion of sulfide to elemental sulfur or sulfate rather than sulfur dioxide;
  • The ability to process feeds with significant impurities such as arsenic due to fixation as a stable ferric arsenate product;
  • The ability to treat low nickel-, high magnesium-containing feeds and;
  • Higher recoveries of cobalt.
The oxidation of sulfide minerals is exothermic and use of an appropriate pulp density and reaction temperature will enable autogenous leaching to occur [6]. The requirement for cooling can, however, lead to issues such as the scaling of heat exchangers at low temperatures with high pulp densities [1]. Other issues that must be considered, some of which are described by Berezowsky and Trytten [7], are as follows:
  • Further grinding of the concentrate may be required to ensure that suitable leaching kinetics can be achieved;
  • While enhancing leaching kinetics, the requirement for oxygen also increases with increasing temperature as the extent to which elemental sulfur is converted to sulfate increases;
  • Furthermore, the extent to which sulfuric acid is formed will be determined by the leachable contents of hydrolysable elements in the concentrate that include predominantly iron, and to lesser extents, aluminium and chromium;
  • As the amount of sulfuric acid generated increases, this will impact the nature of the iron-containing mineral phases generated and subsequent requirement for neutralizing reagents [8].
In the present study, a high iron, low nickel concentrate was treated by pressure oxidation at 250 °C, albeit a somewhat higher temperature than typically employed [7], to demonstrate some of the benefits and shortcomings of this approach. Alternative methods to mitigate some of the shortcomings are proposed.

2. Materials and Methods

Nickel concentrate (received dry) from Poseidon Nickel Limited (Subiaco, WA, Australia) was screened to −75 μm to generate the sulfidic feed material. Pressure oxidation was conducted at 250 °C using a 1 gallon titanium Parr autoclave with a dual pitched blade impeller driven at a speed of 750 rpm using either deionized water or site water from the Mt. Windarra nickel project. All tests employed the same pulp density and were started via the continuous injection of industrial grade oxygen to a set overpressure, into a head space previously purged with industrial grade nitrogen. Three tests are described in this study with the following experimental parameters: (1) 10% w/w pulp density in site water, 700 kPa O2, 90 min, (2) 10% w/w pulp density in site water, 100 kPa O2 with oxygen flow controlled to ~2.4 L/min., 90 min, (3) 10% w/w pulp density in deionized water, 100 kPa O2, 150 min, and (4) 10% w/w pulp density in 1 molal MgSO4 solution, 100 kPa O2, 150 min. Experiments (1) and (2) were conducted with fresh, as received concentrate, whereas experiments (3) and (4) were conducted 4.5 years later with the same material that had been stored in a sealed plastic container, hereafter referred to as “aged” concentrate.
For some tests, the rate of oxygen injection was maintained at a constant value using a Teledyne Hastings Instruments Mass Flow Controller (Hampton, VA, USA) from which mass flow, in addition to temperature and pressure, were logged via LABVIEW-based custom designed software (version 8.6, National Instruments, Austin, TX, USA).
Kinetic sampling during tests was undertaken via a dip tube located just above the base of the vessel, using an actuated valve, to a 75 mL water-cooled sample cylinder. The leached slurries were vacuum filtered through 0.45 m polysulfone membranes to collect the primary filtrates. The residue filter cakes were top-washed with deionized water, re-pulped, and further top-washed before drying overnight in an oven at 65 °C. As preparation for analysis, solid samples were fused with Sigma 12:22 lithium tetraborate:lithium metaborate flux and subsequently dissolved overnight in 15% nitric acid.
The process water, primary filtrates, feed materials and dried residues were analyzed by Inductively Coupled Plasma-Optical Emission Spectroscopy (ICP-OES) using a Varian Vista Pro instrument (Varian Inc., Palo Alto, CA, USA). Solution densities were measured using an Anton Paar DMA 35n density meter (Anton Paar, Graz, Austria). Free acidities were obtained by titration with standardized 0.05 M sodium hydroxide after addition of 20% excess (molar basis) CaEDTA solution to complex the hydrolysable metals and heating to 80 °C to ensure complete complexation of the aluminium, using Metrohm Tiamo software (Metrohm, Herisau, Switzerland) to determine the end point. Ferrous iron concentrations were determined manually by titration with standard 0.02 M dichromate solution using barium diphenyl-4-sulfonate as indicator.
Dried and ground sub-samples of feed materials and residues with added internal standard, ground in absolute ethanol using a McCrone micronizing mill (McCrone, Westmont, IL, USA) and subsequently dried in air, were analysed by X-Ray Diffraction (XRD) to identify the mineral phases. This was conducted using a PANalytical high-resolution multi-purpose powder diffractometer (Empyrean) (Malvern Panalytical, Malvern, UK) using cobalt-Kα radiation and operating at 40 kV and 40 mA. The diffractometer was fitted with a Bragg–Brentano high-definition incident monochromator and PIXcel3D photon counting X-ray detector were used to collect the data over an angular range of 5–130° 2θ in continuous scan mode over a period of 2 h.
Quantitative X-Ray Diffraction (QXRD) analysis using the Rietveld method was conducted using Bruker-AXS TOPAS software (version 5, Bruker, Billerica, MA, USA) and a set of published crystal structures obtained from either the American Mineralogist Crystal Structure Data Base (http://rruff.geo.arizona.edu/AMS/amcsd.php) or PANalytical HighScore software and linked crystallographic data bases PDF-2 [9] and ICSD [10]. This enabled quantification of mineral phases in the feed and selected residue samples.
Scanning Electron Microscopy with Energy-Dispersive X-ray Spectroscopy (SEM/EDS) analysis was conducted using a JEOL JSM-7001F Field Emission Scanning Electron Microscope (Jeol Ltd., Tokyo, Japan) fitted with a two detector Quantax Esprit 2.1.2 Energy Dispersive X-ray Spectroscopy System. The samples were mounted in Epofix™ resin block mounts and sequentially polished to a finish of 1 μm. The accelerating voltage of the electron beam was typically 20 kV. SEM/EDS analysis was used to image particles in the feed and residue samples and to estimate elemental compositions at selected points on the polished particle surface. EDS analysis was conducted on a standardless basis.

3. Results and Discussion

3.1. Feed Materials

The elemental compositions of the nickel concentrate feed materials used in test work are given in Table 1. The Mt Windarra site process water used had a composition (mg/L) of Mg (330), Na (3060), Ca (110), K (80), SO4 (890) and Cl (6200).
By Western Australian standards, typically 20% and even up to 25%, the nickel grade of the feed is low and hence the concentrate is referred to herein as low-grade.
The nickel concentrate (moist when received) was composed largely of sulfide minerals that when exposed to air were oxidized. The mineralogical compositions of the fresh concentrate, after heating in process water to 250 °C, and the “aged” concentrate are given in Table 2. Particularly for the “aged” concentrate, a significant amount of the pyrrhotite was oxidized to pyrite, sulfur and goethite, while trace amounts of identified sulfate minerals were also produced. Several equations given below can be used to describe the reactions that form these products. Equations (3) and (4) are specifically consistent with previous conclusions [11,12,13].
2 Fe7S8 + 4.5 O2 + 3 H2O → 8 FeS2 + 6 FeOOH
2 FeS2 + 1.5 O2 + H2O → 2 FeOOH + 4 S
2 Fe7S8 + 10.5 O2 + 7 H2O → 14 FeOOH + 16 S
2 FeS2 + 4 O2 + H2O → 2 FeSO4·H2O + 2 S
Nickel hexahydrite formation suggests oxidation of nickel sulfide minerals, and based upon its decrease in abundance, from violarite, which is also consistent with published data [14]. The following equation is representative only as iron(II) can be oxidized to iron(III) and either form a sulfate salt at low pH or hydrolyse to goethite at higher pH.
FeNi2S4 + 6 O2 + 13 H2O → FeSO4·H2O + 2 NiSO4·6H2O + S
It was notable that heating of the fresh concentrate in site water to 250 °C resulted in expansion of the pentlandite unit cell, which increased from 10.038 Å to 10.100 Å. A previous study described expansion of the unit cell after heating in vacuo and in argon [15] and an explanation for this behavior is provided by Rajamani and Prewitt [16]. The unit cell of violarite, on the other hand, did not expand after the hydrothermal treatment.

3.2. Nickel Concentrate Leaching

Pressure oxidation of 10% w/w fresh nickel concentrate at 250 °C with 700 kPa O2 overpressure was rapid and nickel extraction reached 95% after just five minutes, as shown in Figure 1. The free acidity rises only slowly after this time while the total iron concentration decreases slowly and stabilizes at a concentration of 4.7 g/L. Ferrous iron was barely detectable after 10 min though a trace amount of pyrite was still present in the residue taken at this time. Otherwise, the changes in mineralogy for the sulfide minerals are rapid and essentially complete within five minutes. The copper extraction curve is not shown as this is virtually identical to that for cobalt.
The initial iron hydrolysis products are hematite and hydronium jarosite, however, the attendant rapid increase in free acidity during the first five minutes and further iron hydrolysis thereafter results in significant formation of basic ferric sulfate, FeOHSO4, as shown in Figure 2. The data also suggest that the solids have neared equilibrium between 30 and 45 min. Here, the normalized mineral content represents the percentage of minerals in the sample relative to the amount of solid used for the experiment. This allows the absolute change in a mineral’s content to be identified.
The data described above, while indicating that rapid extraction of the nickel concentrate can be achieved, provide little insight into the chemical and mineralogical changes that accompany the process. For this reason, the reaction was slowed by regulation of the rate at which oxygen was transferred into the reactor. Nominally the value set using a mass flow controller was ~2.4 L/min maximum (subject to an oxygen overpressure of ~100 kPa) and this was consistent with the calculated rate at which oxygen was consumed during a second reaction conducted with 10% w/w fresh nickel concentrate in site water at 250 °C. The metal extraction, free acidity and ferrous iron concentration results are shown in Figure 3.
The data in Figure 3 confirm a slower rate of metals extraction, that nickel, cobalt and copper have different extraction profiles and suggest that the iron concentration has not achieved its equilibrium value by 90 min. The latter is, in part, a consequence of a significant residual ferrous iron concentration at the conclusion of the reaction though this also suggests that oxygen consumption by this time has slowed substantially. The changes in the mineralogy during this test are presented elsewhere [17].
The pressure oxidation of 9.2% w/w “aged” nickel concentrate at 250 °C as a function of time, with 100 kPa O2 overpressure and maximum oxygen flow rate of ~1.2 L/min., was investigated several years after the initial tests. These tests were conducted to examine the sulfide minerals transformations in greater detail and the impact of chemical additions upon the iron-containing phases formed. The extractions of nickel, cobalt, copper and iron, and iron(II) and free acid concentrations using deionized water are plotted in Figure 4. The attendant increases in Eh and decreases in pH values, as the dissolved iron(II) is oxidized and the iron(III) hydrolysed to generate sulfuric acid, are shown in Figure 5. Notably, the Eh increases rapidly and most of the ferrous iron is oxidized. Similar trends were noted for the pressure oxidation of 10% w/w fresh nickel concentrate in site water under the same conditions.
The metals extraction data indicate that nickel, cobalt and copper extractions are asynchronous. The nickel sulfide minerals are extracted preferentially while the copper sulfide minerals dissolved only after near complete nickel extraction. Copper extraction only became significant when the Eh increased above 350 mV (versus Ag/AgCl). This value compares with optimum potential range of 410 to 430 mV (versus Ag/AgCl) proposed for chalcopyrite dissolution in acidic sulfate medium [18].
Interestingly, cobalt extraction does not mirror that of nickel extraction and the extraction rate increases somewhat after around 60 min. This suggests that a significant amount of the cobalt is associated with minerals other than nickel sulfides, a conclusion also reached in a previous leaching-based study [19]. The mineralogy of the leach residues, discussed below, indicates the dominant sulfide mineral present by that time is pyrite which is the only such mineral detected by XRD analysis in residues taken from time 77 min onwards. Notably, the cobalt extraction was still increasing at the conclusion of the reaction as a trace amount of pyrite was still present. Based upon the amounts of pyrite present in these residues, it was estimated that the average cobalt content of the pyrite was 0.4–0.5%. Watmuff [20] noted that the cobalt content of pyrite from Mt. Windarra varied quite substantially, even within individual grains, and from the analyses obtained, averaged 1.02%. When referenced back to the pyrite content of the feed, somewhere between 50% and 60% of the cobalt is estimated to be hosted by this mineral. In comparison, the study of Lu et al. [19] was conducted using lower temperature conditions for which the dissolution of pyrite is expected to be slow. Based upon the composition provided for their nickel concentrate and extraction data for Ni, Co and Fe, the cobalt content of the pyrite can be estimated, ~0.8%, assuming the unleached Fe is associated with the pyrite.
Metal extractions can be readily understood from the mineralogical characterization of the leach residues. The curve for the extraction of nickel, shown in Figure 6, demonstrates that pentlandite (Fe4.5Ni4.5S8) is rapidly oxidized with the subsequent formation and consumption of violarite (FeNi2S4) and subsequently vaesite (NiS2) according to the following step-wise (Equations (6)–(8)) and overall (Equation (9)) reactions:
Fe4.5Ni4.5S8(s) + 1½ O2(aq.) + 3 H2SO4(aq.) → 2 FeNi2S4(s) + ½ NiSO4(aq.) + 2½ FeSO4(aq.) + 3 H2O
FeNi2S4(s) + ½ O2(aq.) + H2SO4(aq.) → 2 NiS2(s) + FeSO4(aq.) + H2O
NiS2(s) + 3½ O2(aq.) + H2O → NiSO4(aq.) + H2SO4(aq.)
Fe4.5Ni4.5S8(s) + 16½ O2(aq.) + H2SO4(aq.) → 4½ NiSO4(aq.) + 4½ FeSO4(aq.) + H2O
The required acid is generated by the oxidation and subsequent hydrolysis of ferrous sulfate (Equation (10)) primarily generated from leaching of the nickel sulfide minerals and, from leaching of the iron sulfide minerals as discussed below.
2FeSO4(aq.) + ½ O2(aq.) + 2 H2O → Fe2O3(s) + 2 H2SO4(aq.)
The transformation of pentlandite to violarite has been confirmed to also occur in the study of Tenailleau et al. [21] who employed mild hydrothermal conditions (80 or 120 °C) with buffering of the pH between 3 and 5. A dissolution-reprecipitation mechanism for the transformation was indicated and subsequently studied in greater detail by Xia et al. [22]. The data in Figure 6 indicate that conversion of pentlandite to violarite occurs during the heating period and prior to commencement of pressure oxidation. However, as the amount of sulfuric acid present during this period is low, the difference in pentlandite and violarite contents compared to the data given in Table 2 suggests instead that the “aged” concentrate sampled for the tests was no longer homogenous in relation to its mineralogy. Furthermore, the formation of hematite during the heating period (as discussed later) is expected to occur from the dehydration of goethite (not from the hydrolysis of ferric iron which would generate acid).
The hydrothermal transformation of pyrrhotite (Fe7S8) to pyrite (FeS2) or marcasite (FeS2) has been known for some time [23]. Several studies have indicated that the onset of marcasite formation occurs between pH 4 and 6 [24,25]. However, it was the study of Murowchick [26] that first proposed the preservation of crystallographic relationships between pyrrhotite and pyrite or marcasite implied a solid-state mechanism was involved, whereas the absence of such relationships suggested a dissolution–reprecipitation mechanism. Subsequent work by Qian et al. [27], who studied the transformations under both anaerobic and oxic conditions, confirmed that the iron disulfide phase formed depended both upon the pH and the degree of supersaturation relative to that phase. The study concluded that both marcasite and pyrite were formed from pyrrhotite by a dissolution-reprecipitation mechanism regardless of crystallographic relationship. More recently, the manner that pH influences the phase formed was investigated using ab initio calculations [28]. This modeling was able to predict rapid nucleation of marcasite below pH 4 and that crystal growth of the marcasite and pyrite phases requires a critical nucleus size to be achieved.
In the present study, marcasite was the primary transformation product, including during the heating period before oxygen injection commenced, though a small amount of pyrite appears to have formed once the reactions commenced, as shown in Figure 7. The mechanism for pyrrhotite replacement has been proposed to follow Equations (11) and (12) under anaerobic and oxic conditions, respectively [27]:
Fe7S8(s) + 3 H2SO4(aq.) → 4 FeS2(s) + 3 FeSO4(aq.) + 3 H2
Fe7S8(s) + 3 H2SO4(aq.) + 1½O2 → 4 FeS2(s) + 3 FeSO4(aq.) + 3 H2O
Notably, no marcasite was detected when fresh concentrate was heated up under anaerobic conditions. Although the liquor was acidic, pH ~2.5, the amount of sulfuric acid available would be insufficient to facilitate pyrrhotite replacement. In contrast, for the “aged” concentrate this does not appear to have been the case.
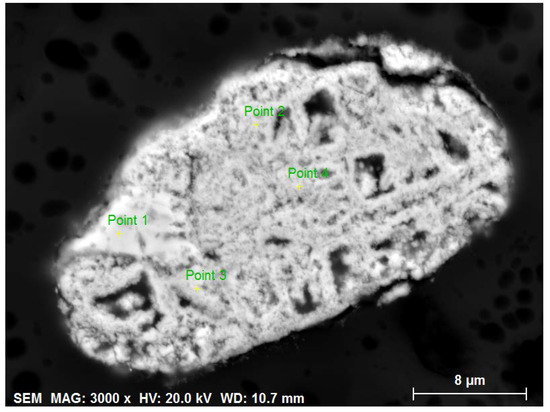
Once pressure oxidation commenced, the remaining pyrrhotite was almost exclusively transformed to marcasite within the first 15 min, while both marcasite and pyrite were mostly oxidized over a period of 77 min. The rapid oxidation of pyrite between 62 and 77 min, corresponds to a noticeable change in the extraction of cobalt, confirming this mineral as a significant host for cobalt, a point previously discussed. Additionally, the persistence of pyrite (given there are no other detectable sulfide minerals) in the residue after 77 min is consistent with the incomplete leaching of cobalt. Based upon SEM/EDS data provided below, pyrite present in the concentrate feed is expected to have a higher cobalt content than neoformed pyrite generated by the oxidation of pyrrhotite.
Examination of the mineralogy of the iron hydrolysis products indicates that hematite is the dominant phase up to 71 min (Figure 8). At this time, the amount of residue relative to the added initial solids is lowest, which is consistent with the fraction of dissolved iron being highest, as shown in Figure 4. Thereafter, the oxidation of ferrous to ferric iron with attendant hydrolysis results in the decrease in dissolved iron and increases in the amounts of hematite (Fe2O3) and basic ferric sulfate (FeOHSO4) present in the residue. The formation of basic ferric sulfate occurs as the free acidity exceeds the value referred to by Tozawa and Sasaki [29] as the breakpoint value. The data also indicate that some of the hematite formed is dissolved and the iron reprecipitated as basic ferric sulfate. This phase is environmentally unstable and will degrade to generate iron oxyhydroxide phases and sulfuric acid, which in addition to the free acidity of the liquor, will require neutralization. Calculations indicated that 30% of the sulfuric acid generated was locked up in the basic ferric sulfate.
The acidity in the reaction at high temperatures can be buffered in the presence of soluble metal sulfates [29], though few studies since have taken advantage of this behavior to mitigate the formation of basic ferric sulfate [30,31]. The addition of magnesium sulfate to buffer the acid during the pressure oxidation of the nickel concentrate has little impact upon the metal’s extraction behavior, as shown in Figure 9. The main impact was to increase the free acidity in the system and at the end of the experiment, this value increased from 54 g/L when conducted in deionized water (Figure 4) to 103 g/L in the presence of 1 molal (i.e. mole per kg solvent) magnesium sulfate solution (Figure 9). In comparison, Sasaki et al. [32] noted that the breakpoint acidity for iron hydrolysis in the presence of 27–33 g/L Mg, i.e., 1.0–1.2 molal, was ~105 g/L and this is consistent with the fact that no basic ferric sulfate was detected in the leach residue samples (Figure 10). As before, hematite was formed during the leaching of the sulfide minerals; the sharp increase in normalized hematite content corresponds with ferrous iron oxidation and this was followed by a slower increase as the system approaches an equilibrium state. It is also notable in Figure 10 that the normalized mineral content in the first two residue samples exceeds 100%. This was due to the presence of precipitated kieserite (MgSO4·H2O) in the samples that had been incompletely washed out during sample preparation.
Whether sulfuric acid generated is locked up in the residue and/or is present in the leach liquor, it can be employed to leach other minerals such as those present in nickel laterite ores. For a low-grade nickel concentrate, such as that used in this study, a significant fraction of the sulfide is associated with iron. Assuming each of nickel, cobalt and copper is associated with sulfide with ratio 1:1, which here is a good approximation given the identities the base metal sulfide minerals, ~87% of the sulfide was estimated to be associated with iron. The amount of acid that can be generated was calculated to be ~800 kg/t concentrate using the data given in Table 1; this value is also consistent with the experimental analyses assuming that all dissolved sulfate content at the conclusion of pressure oxidation, except that associated with base metal dissolution, derives from or is associated with sulfuric acid generation. This acid must either be neutralized in a commercial process or can potentially be used to leach further metal values, such as from a nickel laterite ore [33]. The latter is the topic of a subsequent study [34].

3.3. Metal Sulfate Buffering of “At Temperature” Acidity

The impact of temperature upon the solubility of divalent metal sulfates as a function of free acidity, and the salts formed when the metals precipitate, are well known [32,35,36]). These data are supported by more recent speciation studies, high temperature pH measurements and modeling using software packages such as OLI (www.olisystems.com) [37,38].
For the magnesium sulfate system, modeling studies suggest the formation of soluble magnesium bisulfate species in the presence of sulfuric acid at high temperatures [37]:
5MgSO4·H2O(s) + 3H+ + 3HSO4 → Mg5(HSO4)6(SO4)2 + 5H2O
As sulfuric acid at high temperatures exists primarily as H+ and HSO4, Equation (13) represents buffering of the acid in the presence of added magnesium sulfate. The associated decrease in “at temperature” pH [38] is the mechanism that enables the iron hydrolysis residue phases to be controlled.
The effectiveness of divalent metal sulfate addition, however, will be determined by its solubility which increases with increasing acid concentration, but decreases with increasing temperature. These trends are demonstrated for magnesium sulfate and compared with the analytical data for liquor samples in Figure 11.
The experimental data plotted in Figure 11 clearly show that the solubility limit was typically exceeded, more so during the early stages of the reaction when the acid concentration was low. It is therefore expected that kieserite, MgSO4·H2O, is formed, including as scale inside the vessel early during the reaction. The formation of scale is consistent with the sampled liquor concentration decreasing below the initial value of 1 molal; note here that any kieserite sampled from inside the autoclave will re-dissolve as the liquor cools. In addition to magnesium, other divalent metals (particularly Ni(II) and, prior to oxidation, Fe(II)) were present as their sulfates and therefore it is more relevant to plot their total concentrations for comparison (Figure 11). As the presence of other divalent metal sulfates reduces their solubility [38,39], due to the common ion effect, it is expected that other divalent metal sulfates precipitated during the test. In order to ensure that divalent metal sulfates do not precipitate, it is necessary to (1) decrease the reaction temperature to enhance metal sulfate solubility, although this would also increase the residence time required for nickel extraction; (2) increase the pulp density to enhance acid production provided this does not increase the free acidity above the breakpoint, or (3) add sulfuric acid up-front to increase solubility provided this does not result in the breakpoint acidity being exceeded. As noted in the previous section, utilization of the excess acid offers a more practical approach to the buffering of the “at temperature” acidity.

3.4. X-ray Diffraction

Typical XRD patterns for the feed and residue samples that enabled identification and quantification of the intermediate sulfide phases are shown in Figure 12. Peaks due to the monoclinic pyrrhotite 4C phase are only visible in the bottom scan while peaks due to pyrite are typically strong and persist in the patterns shown. As the peaks from pyrite may also overlap with those of hematite, these are not indicated in the figure. Chalcopyrite is slow to leach during the time period shown here, up to 64 min. The primary peak intensity at 34.24° 2θ gradually decreases and is replaced by covellite for which the peaks are clearly visible in the t64 residue scan. As leaching proceeds, the violarite peak intensities decrease and this phase is effectively leached after 46 min, as shown by disappearance of the peak at 44.45° 2θ. Marcasite, which forms from pyrrhotite, is most clearly seen in the t20 to t58 residue scans, particularly the peaks at 45.41° and 61.15° 2θ. Vaesite, nominally NiS2, was identified by the development of peaks at 36.73° and 52.92° 2θ while shoulders developed at the diffraction angles 41.25° and 63.00° 2θ. For the strongest (002) peak at 36.73° 2θ, its position is only marginally shifted from that of violarite. However, once the latter phase has leached completely, the resolution of this peak can only indicate that a new phase has formed. The calculated unit cell dimension for the vaesite phase from QXRD analysis was 5.678 Å and this compares well with the first published value of 5.668 Å [40] and subsequent values in the range 5.670–5.688 Å [10,41]. This phase has disappeared from the XRD pattern after 64 min.
While vaesite is scarce in nature, it has been noted to occur in conjunction with pyrite, violarite, and millerite, for example in the Black Swan deposit [42,43], in which millerite replaces the vaesite [44]. To the best of our knowledge, studies by the current researchers are the first to report the formation of vaesite as an intermediate in the hydrothermal oxidative dissolution of pentlandite and/or violarite. There was no evidence for the oxidation of vaesite to form millerite.

3.5. Scanning Electron Microscopy

Scanning Electron Microscope (SEM) backscatter images of feed and residue samples in resin block mounts were obtained to improve understanding of the XRD findings. EDS point, area and line scans were collected to obtain estimates for the compositions of selected sulfide mineral particles.

3.5.1. Nickel Sulfide Minerals

Figure 13 shows the SEM image of a pentlandite grain from fresh concentrate for which EDS data were obtained at the points indicated. The corresponding EDS data for the main elements (summed to 100%) are given in Table 3 along with the average composition and chemical formula (normalized to the sulfur content) obtained from EDS analysis for this, and several other, pentlandite grains. It is also notable that the SEM image shows etch lines and pits and, although the composition of these regions was not mapped, based on the reduced backscatter intensity, these are inferred to indicate transformation to violarite, i.e., lower metal to sulfur ratio. Not all pentlandite grains show this patterning while discrete violarite grains with a more porous appearance were noted.
The SEM image in Figure 14 is that of a violarite-rich grain from the t12 residue obtained from “aged” concentrate (during leaching in de-ionized water). The EDS data at the points shown in this image are given in Table 4. The table also includes an estimate for the average composition and chemical formula (normalized to the sulfur content) for violarite in the feed sample obtained using the EDS data for several particles.
SEM/EDS analysis of fresh concentrate indicates the pentlandite to be nickel-rich with approximate composition Ni5.0Co0.1Fe3.9S8 (see Table 3) while the violarite is, within experimental error, not enriched in nickel relative to iron and has approximate composition Ni1.6Fe1.4S4 (see Table 4). In comparison, Nickel et al. [45] reported that alteration of pyrrhotite–pentlandite ore at Kambalda, Western Australia resulted in replacement of pentlandite with composition Ni4.9Fe4.1S8 by violarite that is marginally more enriched in nickel, Ni1.9Fe1.3S4.
Particle integrity was noted to be preserved in SEM images of the residue taken at t = 43 min (“aged” concentrate leaching in deionized water). In Figure 15, two images of vaesite-containing particles indicate significant porosity except for a small dense region near Point 1 in the image of Particle 1 for which the EDS analysis data are consistent with the presence of remnant pentlandite. The EDS data for various points of the two particles are given in Table 5. The table also includes an estimate for the chemical composition from the EDS data for the two particles (normalized to the sulfur content).
SEM/EDS analysis indicated the average composition of the vaesite (ignoring the remnant pentlandite) to be 37.6% nickel, 12.8% iron and 49.6% sulfur which corresponds to a molecular Ni0.8Fe0.3S2 (see Table 5). Typically, however, vaesite occurs in nature with much lower iron content, as shown in Table 6. In the present study, QXRD analysis consistently gave a refined unit cell length of 5.677 Å in comparison to published values [10] that lie in the range of 5.670 to 5.6873 Å, the latter being the value for pure vaesite, i.e., NiS2 [46]. In contrast, the iron content of samples in the pyrite–vaesite series has a significant impact on the unit cell parameter, e.g., a sample with composition of Ni0.58Fe0.42S2 has a unit cell dimension of 5.567 Å [47]. It was therefore hypothesized that the residual iron indicated from SEM/EDS analysis is due to remnant, less oxidized nickel sulfide(s). Based upon the average compositions given in Table 3 and Table 4, the co-presence of violarite is consistent with the average composition indicated in Table 5.
The formation of vaesite within preserved grain structures is consistent with a dissolution–precipitation mechanism occurring. Similarly, the transformation of pentlandite to violarite has also been confirmed to occur by this mechanism [21]. Finally, the present finding confirms that vaesite is thermodynamically favored under mildly oxidizing conditions and in a mild to strongly acidic environment. These conclusions are consistent with the thermodynamic predictions of Warner [48].

3.5.2. Iron Sulfide Minerals

Images of the iron sulfide minerals were obtained for a sample of “aged” concentrate. SEM/EDS analysis indicated that internal composition was well maintained but that surface oxidation products had formed. Figure 16 shows a typical pyrrhotite particle, also noting what appears to be mechanically induced (by grinding and polishing of the resin block) cracking and pitting of the particle. The composition is within experimental error identical to the nominal composition for pyrrhotite 4C, Fe7S8, while the amounts of hosted nickel and cobalt are minor.
The composition of pyrite particles was found to vary considerably, with particles noted that contained 1.9% and 2.7% Ni but were essentially barren in Co, ≤0.2%. Other pyrite particles contained essentially no nickel, ≤0.2%, but had amounts of cobalt that varied between 0.6% and 2.4%, while yet others were barren in both Ni and Co, ≤0.2%. Watmuff et al. [20] noted cobalt contents in pyrite that varied between 0.05% and 2.37% and that the pyrite associated with the violarite-pyrite zone of the ore body could also contain amounts of nickel, up to 5.4%. The finding of high cobalt content in pyrite particles is consistent with the slower leaching of this element during pressure oxidation given that pyrite is the last sulfide mineral to be completely leached (Figure 3). That nickel leaching does not follow the same pattern confirms that the fraction of nickel contained in pyrite is substantially less even though some pyrite particles have significant nickel contents.
The image in Figure 17 shows a pyrite particle for which a loosely adherent surface layer of oxidation products was identified. The SEM/EDS analysis of this layer, most noticeable on the top and right, is consistent with a mixture of pyrite, goethite, melanterite (FeSO4·7H2O) and sulfur that form as per Equations (2) and (4).
The spatial variation of Co in the pyrite was investigated with elemental mapping by SEM/EDS analysis. At the resolution available to SEM/EDS (133 eV at Mn Kα), the Co Kα peak is overlapped by the Fe Kβ peak. At the low concentration of Co in these samples, it is not possible to deconvolute the Co Kα peak from the Fe Kβ peak without impractical acquisition times. Consequently, elemental maps were acquired for Co using the less intense Co Kβ peak. The Co Kβ peak is overlapped by the Ni Kα peak so this approach is not valid in the presence of higher Ni content. To undertake mapping, the beam current was adjusted to give 6 kcps input to each detector (set to a maximum of 30 kcps throughput). The area mapped was 50 μm × 39 μm with pixel resolution of 125 nm and acquisition time of 277 min. The result is shown in Figure 18 which illustrates the intergrowth of other sulfide minerals, here chalcopyrite, within the pyrite grain. Spot analysis on a different pyrite grain gave the following normalized values (and standard deviations), both as %: Fe 52.7 (0.6), S 46.4 (0.6), Co 0.84 (0.07) and Ni 0.11 (0.04). The multi-colored image in Figure 18B indicates a curved band enriched in nickel between the left and right outermost points of the image; enrichment of cobalt below this band relative to above the band was also indicated. EDS spectra for points 2 and 4 are consistent with a nickel-enrichment band, while the spectrum for point 1 suggests cobalt-enrichment. The EDS spectrum at point 3 corresponds to a chalcopyrite inclusion which can also be identified in the back-scattered electron image and elemental maps for Fe and S. The presence of oxidized material rich in iron at the surface of the pyrite grain is also clearly seen.
Obtaining the data presented for the pyrite grains challenged the limits of the SEM/EDS technique as the instrument EDS detectors on the JEOL JSM-7001F model SEM instrument have a resolution of 133 eV. This broadens the emission peaks both decreasing the peak to background count ratio and reducing the ability to resolve neighboring lines. This is shown in Figure 19, which indicates the strong overlap between the Co Kα1,2 and Fe Kβ emission peaks and, between the Ni Kα1,2 and Co Kβ emission peaks. Clearly the best results from a full series fit will be obtained when the nickel content is low and enough counts for the Co Kβ emission peaks are acquired (Figure 19B). In comparison, Electron Probe Microanalysis (EPMA) will be a more informative technique than SEM/EDS as the WDS detector energy resolution using a LiF crystal is ~15 eV for the Co Kα emission peaks. Not only does this increase peak to background count ratio, the number of peak overlaps is reduced (e.g., Co Kα1,2 and Fe Kβ X-ray emission peaks can be resolved) including the resolution of low energy L emission peaks. The latter means that a lower accelerating voltage can be used, and this allows spatial resolutions down to around 100 nm to be obtained. Each detector is tuned to an emission line of a single element which in combination with the selected spatial resolution and mapped area can significantly impact the time (and cost) of obtaining the set of required elemental maps. The use of EPMA therefore needs to be carefully assessed but will yield higher quality data than using SEM/EDS; Rinaldi and Llovet [52] historically review this technique and discuss its advantages and disadvantages.

4. Conclusions

Low-grade nickel sulfide concentrates, potentially with high iron content and/or penalty elements that render the concentrate not suitable for smelting, can be generated. Furthermore, the generation of such concentrates may enable significantly higher recoveries of the metal values. The current study examined the leaching behavior of a low-grade, high iron content nickel concentrate allowing the following conclusions to be made:
  • The extraction of base metals from such nickel sulfide concentrates is rapid, under 20 min, using conditions selected for this study (250 °C, 10% w/w pulp density and 700 kPa O2);
  • The controlled oxidation of feed sulfide minerals using low oxygen partial pressure, ~100 kPa, demonstrated that the hydrothermal oxidation of pentlandite occurs via violarite and subsequently, vaesite. Under the conditions employed, the oxidation of pyrrhotite generates both pyrite and marcasite as intermediates while chalcopyrite was noted to oxidize via a covellite intermediate;
  • Controlled oxidation also demonstrated that the oxidation of nickel sulfides, iron sulfides and copper sulfides, occurs at different rates. This was also compatible with the deportment of base metals in these minerals where, for example, the delays in achieving rapid extraction of copper and high extraction of cobalt were consistent with chalcopyrite and pyrite being the last two sulfide minerals to leach;
  • Low-grade nickel concentrates that have a high iron content may have significant ability to generate sulfuric acid when hydrothermally oxidized. For the concentrate used in this study, the in situ sulfuric acid generation capacity was estimated to be ~800 kg/t concentrate;
  • For a pulp density of 10% w/w nickel concentrate, enough acid is generated to promote the formation of basic ferric sulfate which is not desirable for leach residue disposal/impoundment;
  • The addition of a suitable buffer, here magnesium sulfate, can mitigate the formation basic ferric sulfate and promote the preferred precipitation of hematite. The concentration of buffer added, however, should not exceed its solubility limit in the leach system to minimize scaling inside the reaction vessel;
  • SEM/EDS analysis of particles in feed and residue samples was able to readily identify the sulfide minerals present including the secondary oxidation products of pentlandite, violarite and vaesite. Although EDS analysis can be used to provide estimates of the nickel and cobalt contents in, for example, pyrite, (high resolution) mapping and accurate quantification of these impurities requires the use of a technique such as EPMA.
Leach liquor generated from the nickel concentrate contains around 9 g/L nickel, 5 g/L iron and 65 g/L free acid. In order to recover the nickel either as a sulfide or a hydroxide product, significant neutralization is required, and this represents a major operating cost. Rather, it makes sense to use the excess acid to leach further metal values such as the nickel/cobalt present in nickel laterite ores. This is the subject of a subsequent study.

Author Contributions

Conceptualization, data curation, methodology, investigation, formal analysis, validation, writing—original draft preparation, R.G.M.; Data curation, investigation, formal analysis, writing—reviewing and editing, J.L.; Investigation, data curation, formal analysis, validation, P.J.A. All authors have read and agreed to the published version of the manuscript.

Funding

Part of this research was funded by the Goldfields Esperance Development Commission through the Western Australian Government Royalties for Regions Regional Grants Scheme.

Acknowledgments

Members of the CSIRO analytical team, Milan Chovancek, Tuyen Pham, Bruno Latella, and Sophia Surin are each thanked for their contributions to providing analytical, SEM and XRD data. Karl Bunney and Phillip Fawell are also thanked for reviewing this manuscript.

Conflicts of Interest

The authors declare no conflict of interest. The funders had no role in the design of the study; in the collection, analyses, or interpretation of data; in the writing of the manuscript, or in the decision to publish the results.

References

  1. Berezowsky, R.M. The pressure acid leaching of nickel sulphide concentrates. In TMS 2000, Proceedings of the 129th TMS Annual Meeting and Exhibition, Nashville, TN, USA, 12–16 March 2000; The Minerals, Metals and Materials Society: Warrendale, PA, USA, 2000; p. 31. [Google Scholar]
  2. Nel, G.J.; van den Berg, D.A. Novel design aspects of the Tati Activox® Project ammonia recovery circuit. In Base Metals Conference 2009, Symposium Series S56, Proceedings of the 5th Southern African Base Metals Conference, Kasane, Botswana, 27–31 July 2009; South African Institute of Mining and Metallurgy: Johannesburg, South Africa, 2009; pp. 201–214. [Google Scholar]
  3. Moskalyk, R.R.; Alfantazi, A.M. Nickel sulphide smelting and electrorefining practice: A review. Miner. Proc. Extr. Metall. Rev. 2002, 23, 141–180. [Google Scholar] [CrossRef]
  4. Warner, A.E.M.; Diaz, C.M.; Dalvi, A.D.; Mackey, P.J.; Tarasov, A.V.; Jones, R.T. JOM world nonferrous smelter survey Part IV: Nickel: Sulfide. JOM 2007, 59, 58–72. [Google Scholar] [CrossRef]
  5. Diaz, C.M.; Landolt, C.A.; Vahed, A.; Warner, A.E.M.; Taylor, J.C. Extractive Metallurgy of Nickel and Cobalt; Tyroler, G.P., Landolt, C.A., Eds.; The Metallurgical Society: Warrendale, PA, USA, 1988; pp. 211–239. [Google Scholar]
  6. Papangelakis, V.G.; Demopoulos, G.P. On the attainment of stable autothermal operation in continuous pressure leaching reactors. Hydrometallurgy 1992, 29, 297–318. [Google Scholar] [CrossRef]
  7. Berezowsky, R.; Trytten, L. Commercialization of the acid pressure leaching of chalcopyrite. In ALTA 2002 Copper 7 Proceedings; ALTA Metallurgical Services: Melbourne, Australia, 2002; p. 40. [Google Scholar]
  8. Fleming, C.A. Basic iron sulfate—A potential killer in the processing of refractory gold concentrates by pressure oxidation. Min. Metall. Explor. 2010, 27, 81–88. [Google Scholar] [CrossRef]
  9. ICDD—International Centre for Diffraction Data. PDF-2 Database. 2000. Available online: http://www.icdd.com/pdf-2/ (accessed on 6 March 2020).
  10. FIZ Karlsruhe—Leibniz Institute for Information Infrastructure. Inorganic Crystal Structure Database (ICSD). 2011. Available online: http://icsd.fiz-karlsruhe.de/icsd/ (accessed on 6 March 2020).
  11. Kalinkin, A.M.; Forsling, W.; Makarov, D.V.; Makarov, V.N. Surface oxidation of synthetic pyrrhotite during wetting-drying treatment. Environ. Eng. Sci. 2000, 17, 329–335. [Google Scholar] [CrossRef]
  12. Bonnissel-Gissinger, P.; Alnot, M.; Ehrhardt, J.J.; Behra, P. Surface oxidation of pyrite as a function of pH. Environ. Sci. Technol. 1998, 32, 2839–2845. [Google Scholar] [CrossRef]
  13. Nikiforov, A.G.; Onufrienok, V.V.; Sazonov, A.M.; Terehova, A.V. Weathering of pyrrhotite to szomolnokite, Proceedings of the 10th International Congress for Applied Mineralogy (ICAM), Trondheim, Norway, 1–5 August 2011; Broekmans, M.A.T.M., Ed.; Springer: Berlin, Germany, 2012; pp. 463–469. [Google Scholar]
  14. Richardson, S.; Vaughan, D.J. Surface alteration of pentlandite and spectroscopic evidence for secondary violarite formation. Mineral. Mag. 1989, 53, 213–222. [Google Scholar] [CrossRef] [Green Version]
  15. Knop, O.; Ibrahim, M.A. Sutarno chalcogenides of the transition elements. IV. Pentlandite, a natural π phase. Can. Mineral. 1965, 8, 291–316. [Google Scholar]
  16. Rajamani, V.; Prewitt, C.T. Thermal expansion of the pentlandite structure. Am. Mineral. 1975, 60, 39–48. [Google Scholar]
  17. McDonald, R.; Rodriguez, M.; Li, J.; Robinson, D.; Jackson, M.; Hosken, T. The co-processing of nickel sulphide and laterite materials using low oxygen pressures. In Pressure Hydrometallurgy 2012, Proceedings of the COM 2012, Niagara Falls, ON, Canada, 30 September–3 October 2012; Collins, M.J., Filippou, D., Harlamovs, J.R., Peek, E., Eds.; MetSoc: Montreal, QC, Canada, 2012; pp. 211–225. [Google Scholar]
  18. Jafari, M.; Karimi, G.; Ahmadi, R. Improvement of chalcopyrite atmospheric leaching using controlled slurry potential and additive treatments. Physicochem. Probl. Miner. 2017, 53, 1228–1240. [Google Scholar]
  19. Lu, Z.Y.; Jeffrey, M.I.; Zhu, Y.; Lawson, F. Studies of pentlandite leaching in mixed oxygenated acidic chloride-sulfate solutions. Hydrometallurgy 2000, 56, 63–74. [Google Scholar] [CrossRef]
  20. Watmuff, I.G. Supergene alteration of the Mt Windarra nickel sulphide ore deposit, Western Australia. Miner. Depos. 1974, 9, 199–221. [Google Scholar] [CrossRef]
  21. Tenailleau, C.; Pring, A.; Etschmann, B.; Brugger, J.; Grguric, B.; Putnis, A. Transformation of pentlandite to violarite under mild hydrothermal conditions. Am. Mineral. 2006, 91, 706–709. [Google Scholar] [CrossRef]
  22. Xia, F.; Brugger, J.; Chen, G.; Ngothai, Y.; O’Neill, B.; Putnis, A.; Pring, A. Mechanism and kinetics of pseudomorphic mineral replacement reactions: A case study of the replacement of pentlandite by violarite. Geochim. Cosmochim. Acta 2009, 73, 1945–1969. [Google Scholar] [CrossRef]
  23. Fleet, M.E. The pyrrhotite-marcasite transformation. Can. Mineral. 1978, 16, 31–35. [Google Scholar]
  24. Murowchick, J.B.; Barnes, H.L. Marcasite precipitation from hydrothermal solutions. Geochim. Cosmochim. Acta 1986, 50, 2615–2629. [Google Scholar] [CrossRef]
  25. Schoonen, M.A.A.; Barnes, H.L. Reactions forming pyrite and marcasite from solution: I. Nucleation of FeS2 below 100 C. Geochim. Cosmochim. Acta 1991, 55, 1495–1504. [Google Scholar] [CrossRef]
  26. Murowchick, J.B. Marcasite inversion and the petrographic determination of pyrite ancestry. Econ. Geol. 1992, 87, 1141–1152. [Google Scholar] [CrossRef]
  27. Qian, G.; Xia, F.; Brugger, J.; Skinner, W.M.; Bei, J.; Chen, G.; Pring, A. Replacement of pyrrhotite by pyrite and marcasite under hydrothermal conditions up to 220 °C: An experimental study of reaction textures and mechanisms. Am. Mineral. 2011, 96, 1878–1893. [Google Scholar] [CrossRef]
  28. Kitchaev, D.A.; Ceder, G. Evaluating structure selection in the hydrothermal growth of FeS2 pyrite and marcasite. Nat. Commun. 2016, 7, 13799. [Google Scholar] [CrossRef] [Green Version]
  29. Tozawa, K.; Sasaki, K. Effect of coexisting sulphates on precipitation of ferric oxide from ferric sulphate solutions at elevated temperatures. In Iron Control in Hydrometallurgy; Dutrizac, J.E., Monhemius, A.J., Eds.; Ellis Horwood: Chichester, UK, 1986; pp. 454–476. [Google Scholar]
  30. Cheng, T.C.; Demopoulos, G.P. Hydrolysis of ferric sulfate in the presence of zinc sulfate at 200 °C: Precipitation kinetics and product characterization. Ind. Chem. Eng. Res. 2004, 43, 6299–6308. [Google Scholar] [CrossRef]
  31. Fleuriault, C.M.; Anderson, C.G.; Shuey, S. Iron phase control during pressure oxidation at elevated temperature. Miner. Eng. 2016, 98, 161–168. [Google Scholar] [CrossRef]
  32. Sasaki, K.; Ootsuka, K.; Tozawa, K. The effect of addition of magnesium sulphate on hydrolysis of ferric sulphate solutions at elevated temperatures—Hydrometallurgical studies on hydrolysis of ferric sulfate solutions at elevated temperatures (3rd report). Shigen-to-Sozai 1994, 110, 643–652. (In Japanese) [Google Scholar] [CrossRef] [Green Version]
  33. Whittington, B.I.; Muir, D. Pressure acid leaching of nickel laterites: A review. Miner. Proc. Extr. Metall. Rev. 2000, 21, 527–599. [Google Scholar] [CrossRef]
  34. McDonald, R.G.; Li, J. The high temperature co-processing of nickel sulfide and nickel laterite sources. Minerals 2020, in press. [Google Scholar]
  35. Linke, W.F.; Seidell, A. Solubilities. Inorganic and Metal-Organic Compounds; American Chemical Society: Washington, DC, USA, 1958; Volumes I and II. [Google Scholar]
  36. Marshall, W.L.; Slusher, R. Aqueous systems at high temperature. XV. Solubility and hydrolytic instability of magnesium sulfate in sulfuric acid-water and deuterosulfuric acid-deuterium oxide solutions, 200 °C to 350 °C. J. Chem. Eng. Data 1965, 10, 353–358. [Google Scholar] [CrossRef]
  37. Rubisov, D.H.; Papangelakis, V.G. Sulphuric acid pressure leaching of laterites-speciation and prediction of metal solubilities "at temperature". Hydrometallurgy 2000, 58, 13–26. [Google Scholar] [CrossRef]
  38. Jankovic, Z.; Papangelakis, V.G.; Lvov, S.N. Effect of nickel sulphate and magnesium sulphate on pH of sulfuric acid at elevated temperatures. J. Appl. Electrochem. 2009, 39, 751–759. [Google Scholar] [CrossRef]
  39. Hasegawa, F.; Tozawa, K.; Nishimura, T. Solubility of ferrous sulfate in aqueous solutions at high temperatures. Shigen-to-Sozai 1996, 112, 879–884. (In Japanese) [Google Scholar] [CrossRef] [Green Version]
  40. Kerr, P.F. Cattierite and vaesite: New Co-Ni minerals from the Belgian Congo. Am. Mineral. 1945, 30, 483–497. [Google Scholar]
  41. American Mineralogist Crystallographic Database. Available online: http://rruff.geo.arizona.edu/AMS/minerals/Vaesite (accessed on 21 October 2019).
  42. Hudson, D.R.; Groves, D.I. The composition of violarite coexisting with vaesite, pyrite, and millerite. Econ. Geol. 1974, 69, 1335–1340. [Google Scholar] [CrossRef]
  43. Barnes, S.J.; Wells, M.A.; Verrall, M.R. Effects of magmatic processes, serpentinization, and talc-carbonate alteration on sulfide mineralogy and ore textures in the Black Swan disseminated nickel sulfide deposit, Yilgarn Craton. Econ. Geol. 2009, 104, 539–562. [Google Scholar] [CrossRef]
  44. Barnes, S.J.; Hill, R.E.T. Metamorphism of komatiite-hosted nickel sulfide deposits. In Metamorphosed and Metamorphogenic Ore Deposits; Society of Economic Geologists: Littleton, CO, USA, 2000; Volume 11, pp. 203–215. [Google Scholar]
  45. Nickel, E.H.; Ross, J.R.; Thornber, M.R. The supergene alteration of pyrrhotite-pentlandite ore at Kambalda, Western Australia. Econ. Geol. 1974, 69, 93–107. [Google Scholar] [CrossRef]
  46. Furuseth, S.; Kjekshus, A.; Andressen, A.F. On the magnetic properties of CoSe2, NiS2, and NiSe2. Acta Chem. Scand. 1969, 23, 2325–2334. [Google Scholar] [CrossRef]
  47. Bayliss, P. Crystal chemistry and crystallography of some minerals within the pyrite group. Am. Mineral. 1989, 74, 1168–1176. [Google Scholar]
  48. Warner, T.E.; Rice, N.M.; Taylor, N. Thermodynamic stability of pentlandite and violarite and new Eh-pH diagrams for the iron-nickel sulphur aqueous system. Hydrometallurgy 1996, 41, 107–118. [Google Scholar] [CrossRef]
  49. Ostwald, J. Notes on a Co-Ni disulphide and a Co–Ni–Fe thiospinel from the Kalgoorlie district, Western Australia. Mineral. Mag. 1980, 43, 950–951. [Google Scholar] [CrossRef]
  50. Han, S.; Hu, K.; Cao, J.; Pan, J.; Liu, Y.; Bian, L.; Shi, C. Mineralogy of early Cambrian Ni-Mo polymetallic black shale at the Sancha Deposit, South China: Implications for ore genesis. Resour. Geol. 2015, 65, 1–12. [Google Scholar] [CrossRef] [Green Version]
  51. Gadd, M.G.; Peter, J.M.; Goodfellow, W.; Jackson, S.E.; Yang, Z. Geology, Geochemistry and Mineralogy of Hyper-Enriched Black Shale Deposits, Yukon, Proceedings of Exploration 17, 6th Decennial International Conference on Mineral Exploration, Toronto, ON, Canada, 21–25 October 2017; Tschirhart, V., Thomas, M.D., Eds.; Prospectors & Developers Association of Canada: Toronto, ON, Canada, 2017; pp. 841–845. [Google Scholar]
  52. Rinaldi, R.; Llovet, X. Electron probe microanalysis: A review of the past, present, and future. Microsc. Microanal. 2015, 21, 1053–1069. [Google Scholar] [CrossRef]
Figure 1. Metal extractions, Fe(II) concentration and free acidity for samples taken during the pressure oxidation of 10% w/w nickel concentrate in deionized water at 250 °C with 700 kPa oxygen overpressure.
Minerals 10 00249 g001
Figure 2. Changes in the normalized composition of iron hydrolysis products in the leach residue for samples taken during the pressure oxidation of 10% w/w nickel concentrate in deionized water at 250 °C with 700 kPa oxygen overpressure. BFS = basic ferric sulfate.
Minerals 10 00249 g002
Figure 3. Metal extractions, Fe(II) concentration and free acidity for samples taken during the pressure oxidation of 10% w/w nickel concentrate in site water at 250 °C with oxygen flow controlled to ~2.4 L/min.
Minerals 10 00249 g003
Figure 4. Metal extractions, Fe(II) concentration and free acidity for samples taken during the pressure oxidation of 9.2% w/w “aged” nickel concentrate in deionized water at 250 °C with 100 kPa oxygen overpressure.
Minerals 10 00249 g004
Figure 5. Variation in pH and Eh for samples taken during the pressure oxidation of 9.2% w/w “aged” nickel concentrate in deionized water at 250 °C with 100 kPa oxygen overpressure.
Minerals 10 00249 g005
Figure 6. Changes in the composition of nickel sulfide minerals in the leach residue with corresponding nickel extraction for samples taken during the pressure oxidation of 9.2% w/w “aged” nickel concentrate in deionized water at 250 °C with 100 kPa oxygen overpressure.
Minerals 10 00249 g006
Figure 7. Changes in the composition of iron sulfide minerals in the leach residue with corresponding cobalt extraction for samples taken during the pressure oxidation of 9.2% w/w “aged” nickel concentrate in deionized water at 250 °C with 100 kPa oxygen overpressure.
Minerals 10 00249 g007
Figure 8. Changes in the composition of iron hydrolysis products in the leach residue for samples taken during the pressure oxidation of 9.2% w/w “aged” nickel concentrate in deionized water at 250 °C with 100 kPa oxygen overpressure.
Minerals 10 00249 g008
Figure 9. Metal extractions, Fe(II) concentration and free acidity for samples taken during the pressure oxidation of 9.2% w/w “aged” nickel concentrate in 1 molal magnesium sulfate solution at 250 °C with 100 kPa oxygen overpressure.
Minerals 10 00249 g009
Figure 10. Changes in the composition of iron hydrolysis products in the leach residue for samples taken during the pressure oxidation of 9.2% w/w “aged” nickel concentrate in 1 molal magnesium sulfate at 250 °C with 100 kPa oxygen overpressure.
Minerals 10 00249 g010
Figure 11. Comparison of reported solubility data [32,36] for magnesium sulfate as a function of temperature with the MgSO4 and M(II)SO4 (M(II) = Ni(II) + Co(II) + Cu(II) + Fe(II) + Mg(II) + Zn(II)) concentrations in liquor samples taken during the pressure oxidation of 9.2% w/w “aged” nickel concentrate in 1 molal magnesium sulfate solution at 250 °C with 100 kPa oxygen overpressure.
Minerals 10 00249 g011
Figure 12. XRD patterns for the following samples from bottom to top including feed, and residue samples taken during the pressure oxidation of 9.2% w/w “aged” nickel concentrate in deionized water at 250 °C with 100 kPa oxygen overpressure at time/minutes as follows: t20, t35, t41, t46, t52, t58, t64. Dotted lines are included to indicate the positions of peaks (° 2θ) for the following phases: chalcopyrite (34.24); covellite (37.13, 56.40), marcasite (45.41, 61.15, 62.66, 64.49), violarite (36.55, 44.45, 58.86, 64.67) and vaesite (36.73, 41.25, 52.92, 63.00). Peaks due to pyrrhotite 4C occur at 34.95, 39.51, 39.77, 51.45, 51.71 and 62.65 in the feed.
Minerals 10 00249 g012
Figure 13. SEM backscatter image of a pentlandite grain indicating points at which SEM/EDS data were obtained.
Minerals 10 00249 g013
Figure 14. SEM backscatter image of a violarite grain present in the t = 12 min. sample indicating points at which SEM/EDS data were obtained.
Minerals 10 00249 g014
Figure 15. SEM backscatter images of leached pentlandite particles present in the t = 43 min. sample indicating points at which SEM/EDS data were obtained.
Minerals 10 00249 g015
Figure 16. SEM backscatter image of a pyrrhotite grain in “aged” nickel concentrate. SEM/EDS area analysis indicates the composition as 59.5% Fe, 40.0% S, 0.3% Ni and 0.2% Co.
Minerals 10 00249 g016
Figure 17. SEM backscatter image of a pyrite grain in “aged” nickel concentrate. SEM/EDS area analysis indicates the composition as 44.5% Fe, 53.5% S, 0.4% Ni and 1.2% Co.
Minerals 10 00249 g017
Figure 18. Images, elemental maps and EDS spectra obtained from a pyrite grain: (A) Back-scattered electron (BSE) image showing region employed for elemental mapping, (B) Composite of the BSE image with Co (K), Ni, Cu and O maps for which EDS spectra were taken at points 1 to 4.
Minerals 10 00249 g018
Figure 19. EDS spectra fitted to the Ni and Co, Kα and Kβ emission lines for point analyses of a pyrite grain showing: (A) nickel-rich, and (B) cobalt-rich interaction volumes. The fitted peaks are shown by the red traces while the fits to the peaks for Fe and Cu have been omitted for clarity.
Minerals 10 00249 g019
Table 1. Elemental compositions of the nickel concentrate feeds employed in this study (% w/w).
FeedNiCoCuMgMnFeAlCrCaNaSiS
Concentrate8.110.1381.280.6510.03745.00.3180.1750.4210.0822.4830.3
“Aged” Concentrate6.770.1361.210.5830.03042.60.3190.1180.3240.0912.4633.8
Table 2. Mineral compositions of (hydrothermally heated) fresh and “aged” nickel concentrate feeds employed for the current test work.
Sulfides% (w/w)Gangue Minerals% (w/w)Oxidation Products% (w/w)
FreshAgedFreshAgedFreshAged
Pyrrhotite 4C3932Quartz43GoethiteND10
Pyrite1319Actinolite24Hematite4ND
Pentlandite810Clinochlore31Hydronium jarosite51
Violarite96Talc41SulfurND5
Chalcopyrite33 Nickel hexahydrite1.81.7
SzomolnokiteND0.5
ND = not detected.
Table 3. SEM/EDS data for the particle shown in Figure 13 with average composition and chemical formula from point analyses of several particles.
ElementNiCoFeS
% w/w
Point 137.80.6229.731.9
Point 240.40.6528.830.2
Point 338.90.5829.031.5
Point 438.70.6128.032.7
Average composition38.60.5229.232.0
Average formula (normalized)4.980.073.968
Table 4. SEM/EDS data for the particle shown in Figure 14 with average composition and chemical formula from point analyses for several violarite particles in the feed.
ElementNiCoFeS
% w/w
Point 130.6BDL27.941.5
Point 230.8BDL28.340.9
Point average30.7BDL28.141.2
Average composition33.00.6028.038.5
Average formula (normalized)1.570.031.404
BDL = below detection limit.
Table 5. SEM/EDS data for the particles shown in Figure 15 with average composition data and chemical formula obtained using all analysis data except for point 1 of particle 1.
ElementNiFeS
% w/w
Particle 1
Point 141.223.735.1
Point 238.311.849.9
Point 338.212.249.6
Point 436.313.050.7
Particle 2
Point 138.712.548.8
Point 236.713.350.0
Point 337.414.048.6
Average composition37.612.849.6
Average formula (normalized)0.740.262
Table 6. Published mineral compositions for naturally occurring vaesite obtained by Electron Probe Microanalysis (EPMA).
ReferenceNiCoFeS
[47]43.91.60.951.8
44.81.40.951.6
[49]47.91.12.648.4
[50]*45.20.010.2750.1
[51]#44.8 ± 1.3-<0.1–0.2650.1 ± 0.6
* Also contains 0.06% Cu, 0.89% Se, 0.13% Te, 0.15% As and 0.70% Mo; # Also contains <0.1–0.26% Cu, 1.5 ± 0.6% Se, <0.1–0.95% As.

