Article

Nano-Scale Pore Structure and Its Multi-Fractal Characteristics of Tight Sandstone by N2 Adsorption/Desorption Analyses: A Case Study of Shihezi Formation from the Sulige Gas Filed, Ordos Basin, China

School of Earth and Space Sciences, Peking University, Beijing 100871, China
*
Author to whom correspondence should be addressed.
Minerals 2020, 10(4), 377; https://doi.org/10.3390/min10040377
Submission received: 16 March 2020 / Revised: 15 April 2020 / Accepted: 20 April 2020 / Published: 22 April 2020
(This article belongs to the Special Issue Mineralogy of Shale Gas and Other Low Permeability Reservoirs)

Abstract

:
Fractal dimension is a critical parameter to evaluate the heterogeneity of complex pore structure in tight sandstone gas and other low permeability reservoirs. To quantify the fractal dimension of tight sandstone at various pore size classes and evaluate their implications on mineral composition and nano pore structure parameters, we conducted an integrated approach of N2 adsorption/desorption experiment (N2-GA), X-ray diffraction (X-RD), and field emission scanning electron microscopy (FE-SEM) on Sulige tight sandstone reservoirs. By comparing the nine types of fractal dimensions calculated from N2 adsorption data, we put forward the concept of “concentrated” fractal dimensions and “scattered” fractal dimensions (DN2, DN3, DN5, DN7 and DN8) for the first time according to its concentration extent of distribute in different samples. Result shows that mineral composition has a significant influence of a different level on specific surface area (SSA), pore volume (PV), and fractal dimensions (DN), respectively, where the “scattered” fractal dimension is more sensitive to certain specific property of the reservoir, including mineral content and the specific surface area contribution rate (Sr) of type II mesopores (Mesopore-II: 10~50nm). In addition, three type of hysteresis loops were distinguished corresponding to different pore shape combination of N2-GA isotherm curve, which reveals that pore structure heterogeneity is mainly controlled by inkbottle-shaped pores and the volume contribution rate (Vr) of mesopores in this study area. These findings could contribute to a better understanding of the controlling effect of pore heterogeneity on natural gas storage and adsorption.

1. Introduction

Energy sources around the world have been changing from solid (firewood and coals) and liquid (petroleum) states to gas state (natural gas) [1], where tight sandstone reservoirs have been playing an important role and exploited industrially in many countries as an effective storage of natural gas, which is a complicated porous material with a highly heterogeneous nanopore structure [2,3,4,5,6,7,8]. Owing to the complexity of the its pore-throat system, pore structure and its fractal characteristics analysis become the core work of reservoir quality evaluation, which includes the research content of specific surface area (SSA), pore volume (PV), pore size distribution (PSD), pore morphology, and anisotropy [9,10,11].
Due to the complicated 3D characteristics of a tight sandstone pore-throat system, it is difficult for traditional Euclidean geometry to describe the pore morphological characteristics precisely. Fractal theory is an effective approach to evaluating the surfaces roughness and complexity of irregular pores, which was first proposed by Benoit B. Mandelbrot in 1983 [12,13,14,15,16,17], where fractal dimension is an essential feature parameter. It can quantitatively characterize nanoscale pore heterogeneity and make a better understanding of the pore microstructures complexity comprehensively, with a value usually distributed between two and three. In general, fractal dimension value often reflects the heterogeneity of the pore-throat system including connectivity, coordination, and the complexity of pore shape, where a higher value indicates a more complex pore-throat system [18,19]. In addition, fractal theory also reveals that the rock surface displays a property of “self-similar regularity” at molecular scales and exhibits a similar structure regularity over 3-4 orders of magnitude resolution scales in length between 1 nm and 100 μm [20,21].
In recent years, with the development of pore structure characterization technology, there are four established methods to calculate fractal dimensions based on experimental data: fluid injection technique, gas adsorption [22,23], image analysis [18,19], and no-destructive methods through CT scanning [24,25], where fluid injection technique includes low-field nuclear magnetic resonance (NMR) [21,26,27,28] and mercury intrusion porosimetry (MIP) [29,30,31]. In terms of N2 absorption/desorption data, numerous studies have applied Frenkel–Halsey–Hill (FHH) model to study the fractal characteristics of nanopore structure in different reservoir, including coal-bearing organic shale in different facies [20,21,32,33,34,35,36,37,38], coal [23,39,40,41,42], or tight sandstone [29,30], which is proven to be an efficient method to capture fractal dimensions aim at nanoscale pores (2–400 nm) [43]. Previous research usually obtained fractal dimensions by the unsegmented method, or capture two fractal dimensions D1 (P/P0: 0–0.5) and D2 (P/P0: 0.5–1) represents the fractals generated by volume irregularity and pore structures, respectively [18]. Moreover, many of them have already made a comparative study between N2 adsorption with NMR or MIP [30,37,44], whereas the scientificity and validity of different fractal dimensions obtained from nitrogen adsorption data have not been distinguished, and its influence factors are still not explicit.
Therefore, in this paper, N2 adsorption/desorption experiment (N2-GA) was utilized to accurately characterize the nanoscale pore heterogeneity, morphology and structure parameters of 11 different ranks of tight sandstone from the Sulige gas field. Fractal characteristics of pore throats with different sizes were specified according to the FHH model. Furthermore, field emission scanning electron microscopy (FE-SEM) was used to help make more explicit the pore morphology features, petrographic characteristic and the relationship between them. In addition, we used X-ray diffraction (X-RD) to characterize the mineral composition of all samples accurately. First, pore morphological characteristics and mineral composition were identified by FE-SEM and X-RD. Then, based on N2-GA data of all 11 samples, we effectively captured the PSD, SSA, and PV, and nine types of fractal dimensions were calculated to understand the complexity of pore microstructures comprehensively, which can clarify the effect of mineral composition and pore structure on different types of fractal dimensions, respectively. Hence, the major aims of this study were to (1) quantitatively characterize the nanoscale pore heterogeneity of tight sandstone in He 8 Member at different size classes and (2) clarify the effect factor of different types of fractal dimensions, respectively.

2. Samples and Methods

2.1. Samples and Geological Setting

The tight sandstone gas field in the Sulige area is located in the northwest of Yishan slope in the Ordos Basin, which is a typical example of tight gas in China. The Ordos Basin is the second largest sedimentary basin in China (Figure 1a), which is located in the western part of North China Craton, and is a large multi-cycle superimposed basin with overall uplift and simple geotectonics [45,46]. According to previous studies, the eighth member of the Middle Permian Lower Shihezi Formation (He 8 Member) is generally considered as a set of deposits of braided river-shallow delta facies, with a larger variation range of hydrodynamic conditions. Under a wide and gentle geotectonic background, the channel changes and overlaps in various periods, forming a complex pattern structure [47].
Based on core observation, 11 tight sandstone samples with different physical characteristics were collected from the He 8 Member in the Ordos Basin, which is a main gas production layer of the Sulige large gas province (Figure 1b). In order to determine the heterogeneity of nanoscale pore structure, we collected core samples from one appraisal well where the burial depth varies from 3326 m to 3358 m. Figure 2 shows the generalized stratigraphic columns of the Shihezi Formation and sampling depth and its corresponding logging profile and gamma (GR) curve.

2.2. Experimental Methods

All 11 samples were analyzed using X-RD analysis, FE-SEM observation, and N2-GA. First, pore morphological characteristics and mineral composition were identified by XRD and FE-SEM. Then built on N2 adsorption data of all 11 samples, whicheffectively captured PSD, SSA, and PV. Three types hysteresis loop were distinguished, and nine types of fractal dimensions were calculated to understand the complexity of pore microstructures comprehensively.
N2 adsorption/desorption isotherms were obtained using a Quantachrome QUADRAS-ORB SI Surface Area and Pore Size Analyzer (Quantachrome, Boynton Beach, FL, USA) –196.15 °C, with a pore size test range of 0.35–400 nm. Experimental process was conducted with a mixture of block sample and 60–80 mesh powder samples for the purpose of eliminating the experimental error caused by sample size in accordance with the Chinese government standard GB/T 19587-2017.
X-RD was employed as a supporting test for analyzing mineral composition, using powder samples that were crushed to less than 200 mesh size. The X-ray diffractometer was operated at 25 °C and 10% humidity with a step of 0.01°(2 θ ) performed using a PANalytical X’Pert3 Powder (PANalytical, Almelo, The Netherlands), with the procedure adhering to the Chinese Oil and Gas Industry Standard SY/T5163 (2018).
The FE-SEM analysis was completed using a FEI Quanta 650 high performance multipurpose field emission-scanning electron microscopy (FEI, Hillsboro, OR, USA). Prior to observation, tight sandstone samples were polishing by an Ar-ion milling system, and the samples were then sputter-coated with chromium for conductivity. The specifications for the high-resolution imaging and analysis of the conductive samples were acceleration voltage: 200 V–30 kV; resolution: 1.4 nm at 30 kV under environmental vacuum conditions (ESEM); and magnification: 80–6 × 1,000,000.

2.3. Fractal Model of N2 Adsorption

The FHH model has proven to be an effective model and has been widely used to obtain the fractal dimension based on N2 adsorption data [22,48,49,50], which can be expressed as the following double logarithm form:
l n ( V ) = k × l n [ l n ( P 0 / P ) ] + C
where V is the volume of N2 adsorption capacity at equilibrium pressure in cm3/g, P0 is the gas saturation pressure in MPa, P is the gas equilibrium pressure in MPa, C is constant, and k is the slope of ln(V) vs. ln(P0/P) linear fitting plots. On this foundation, fractal dimension (DN) based on N2 adsorption/desorption can be calculated by following equation:
D N = k + 3

3. Results

3.1. Minerals Composition

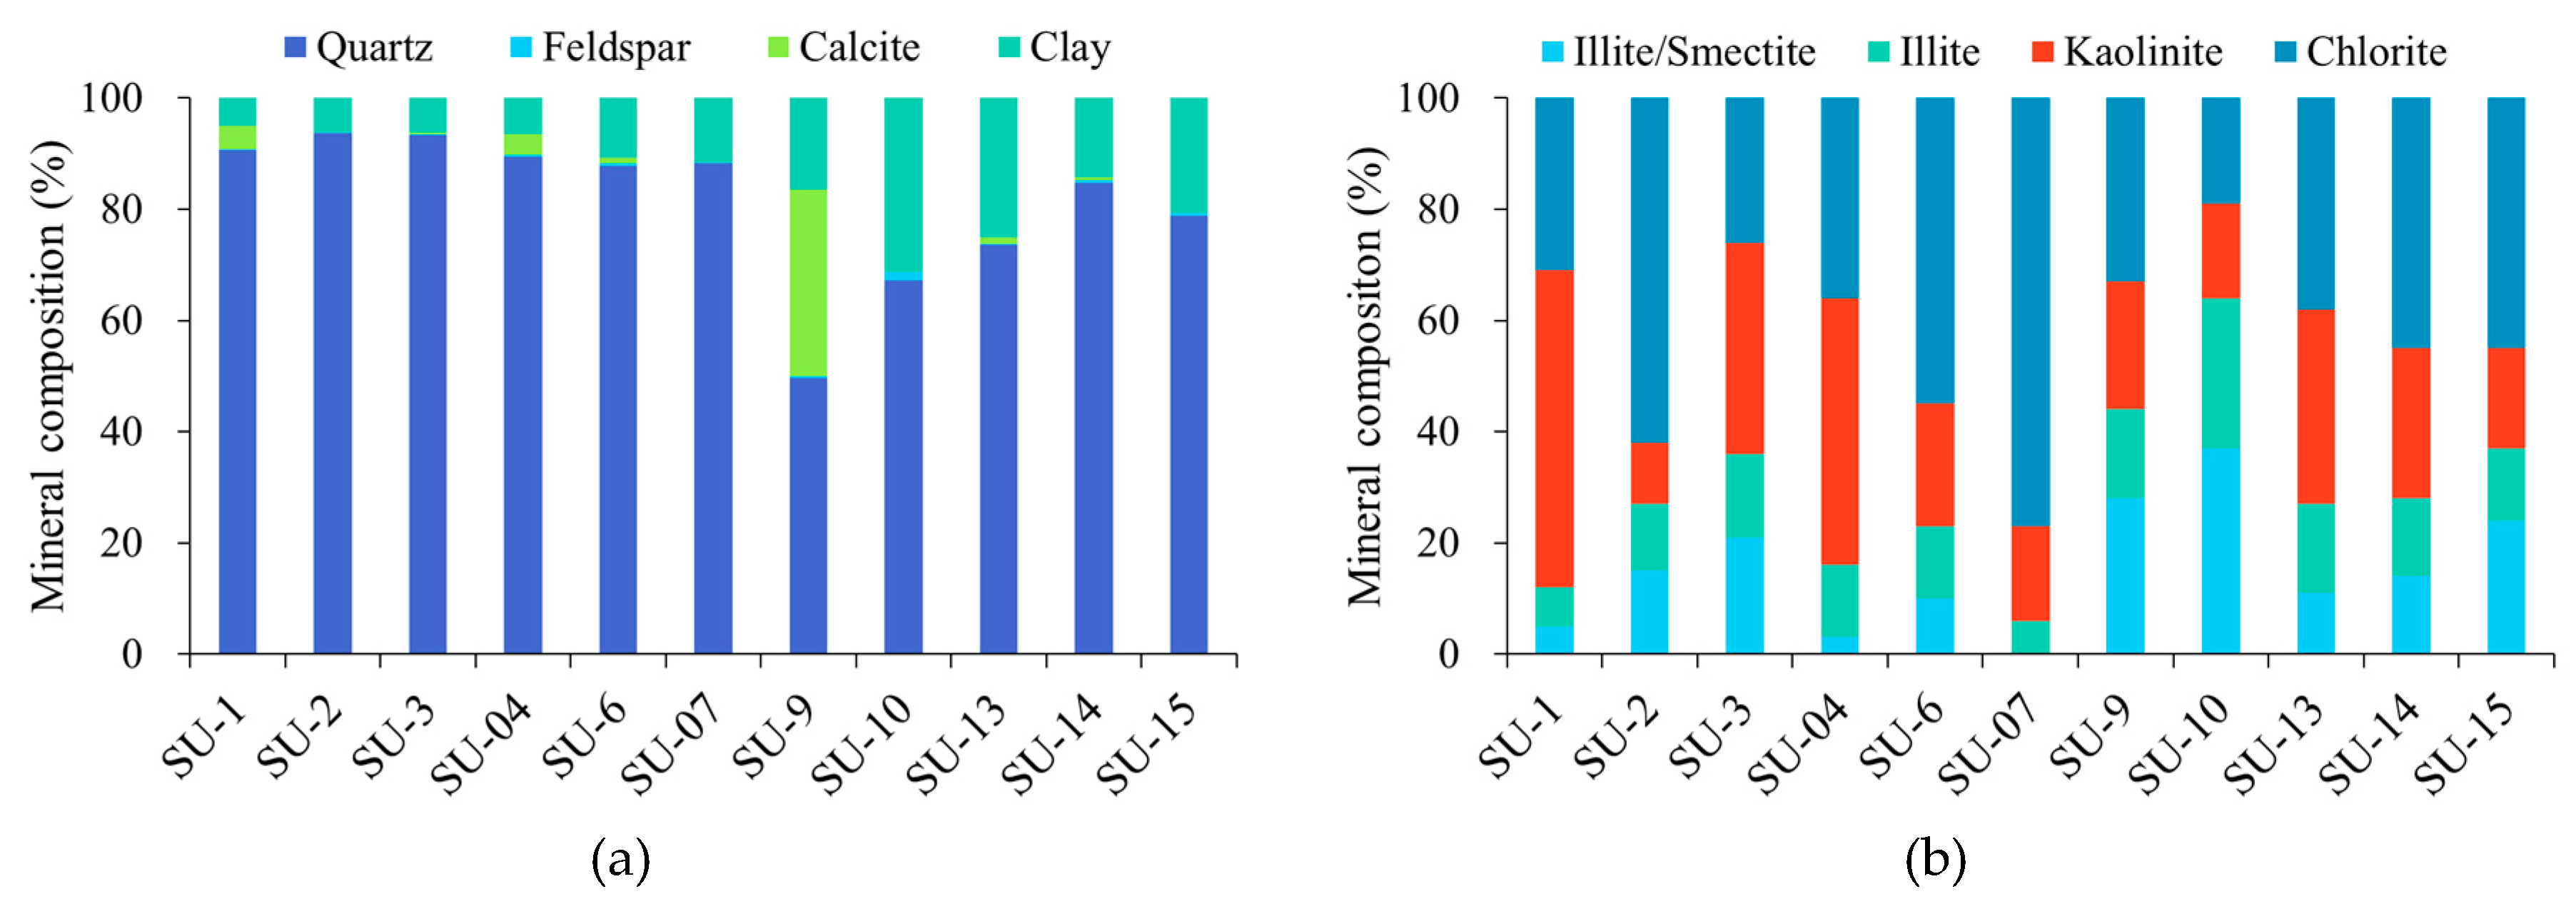
According to the X-RD result of investigated core samples, the mineral composition of the investigated samples shown in Table 1 and Figure 3, it can be seen that He 8 Member tight sandstone mainly consists of quartz, clay, calcite, and feldspar. Quartz abundance between 49.6% and 93.6% averages at 81.5%. Total clay content ranges from 3.0% to 31.3% with an average value of 14.0%, in which the content of chlorite is highest (from 19.0% to 77.0%, averages at 43.5%), followed by kaolinite (from 11.0% to 57.0%, averages at 28.5%), illite/smectite (from 3.0% to 37.0%, averages at 16.8%), and illite (from 6.0% to 27.0%, averages at 13.8%). These clustered intercrystalline micropores of clay minerals exist as a local enrichment form with poor connectivity, developed inside original intergranular pores wherefore the percolation capacity of the reservoir was impaired to a certain extent as well.

3.2. Nanoscale Pore Geometry from N2 Adsorption/Desorption Isotherms

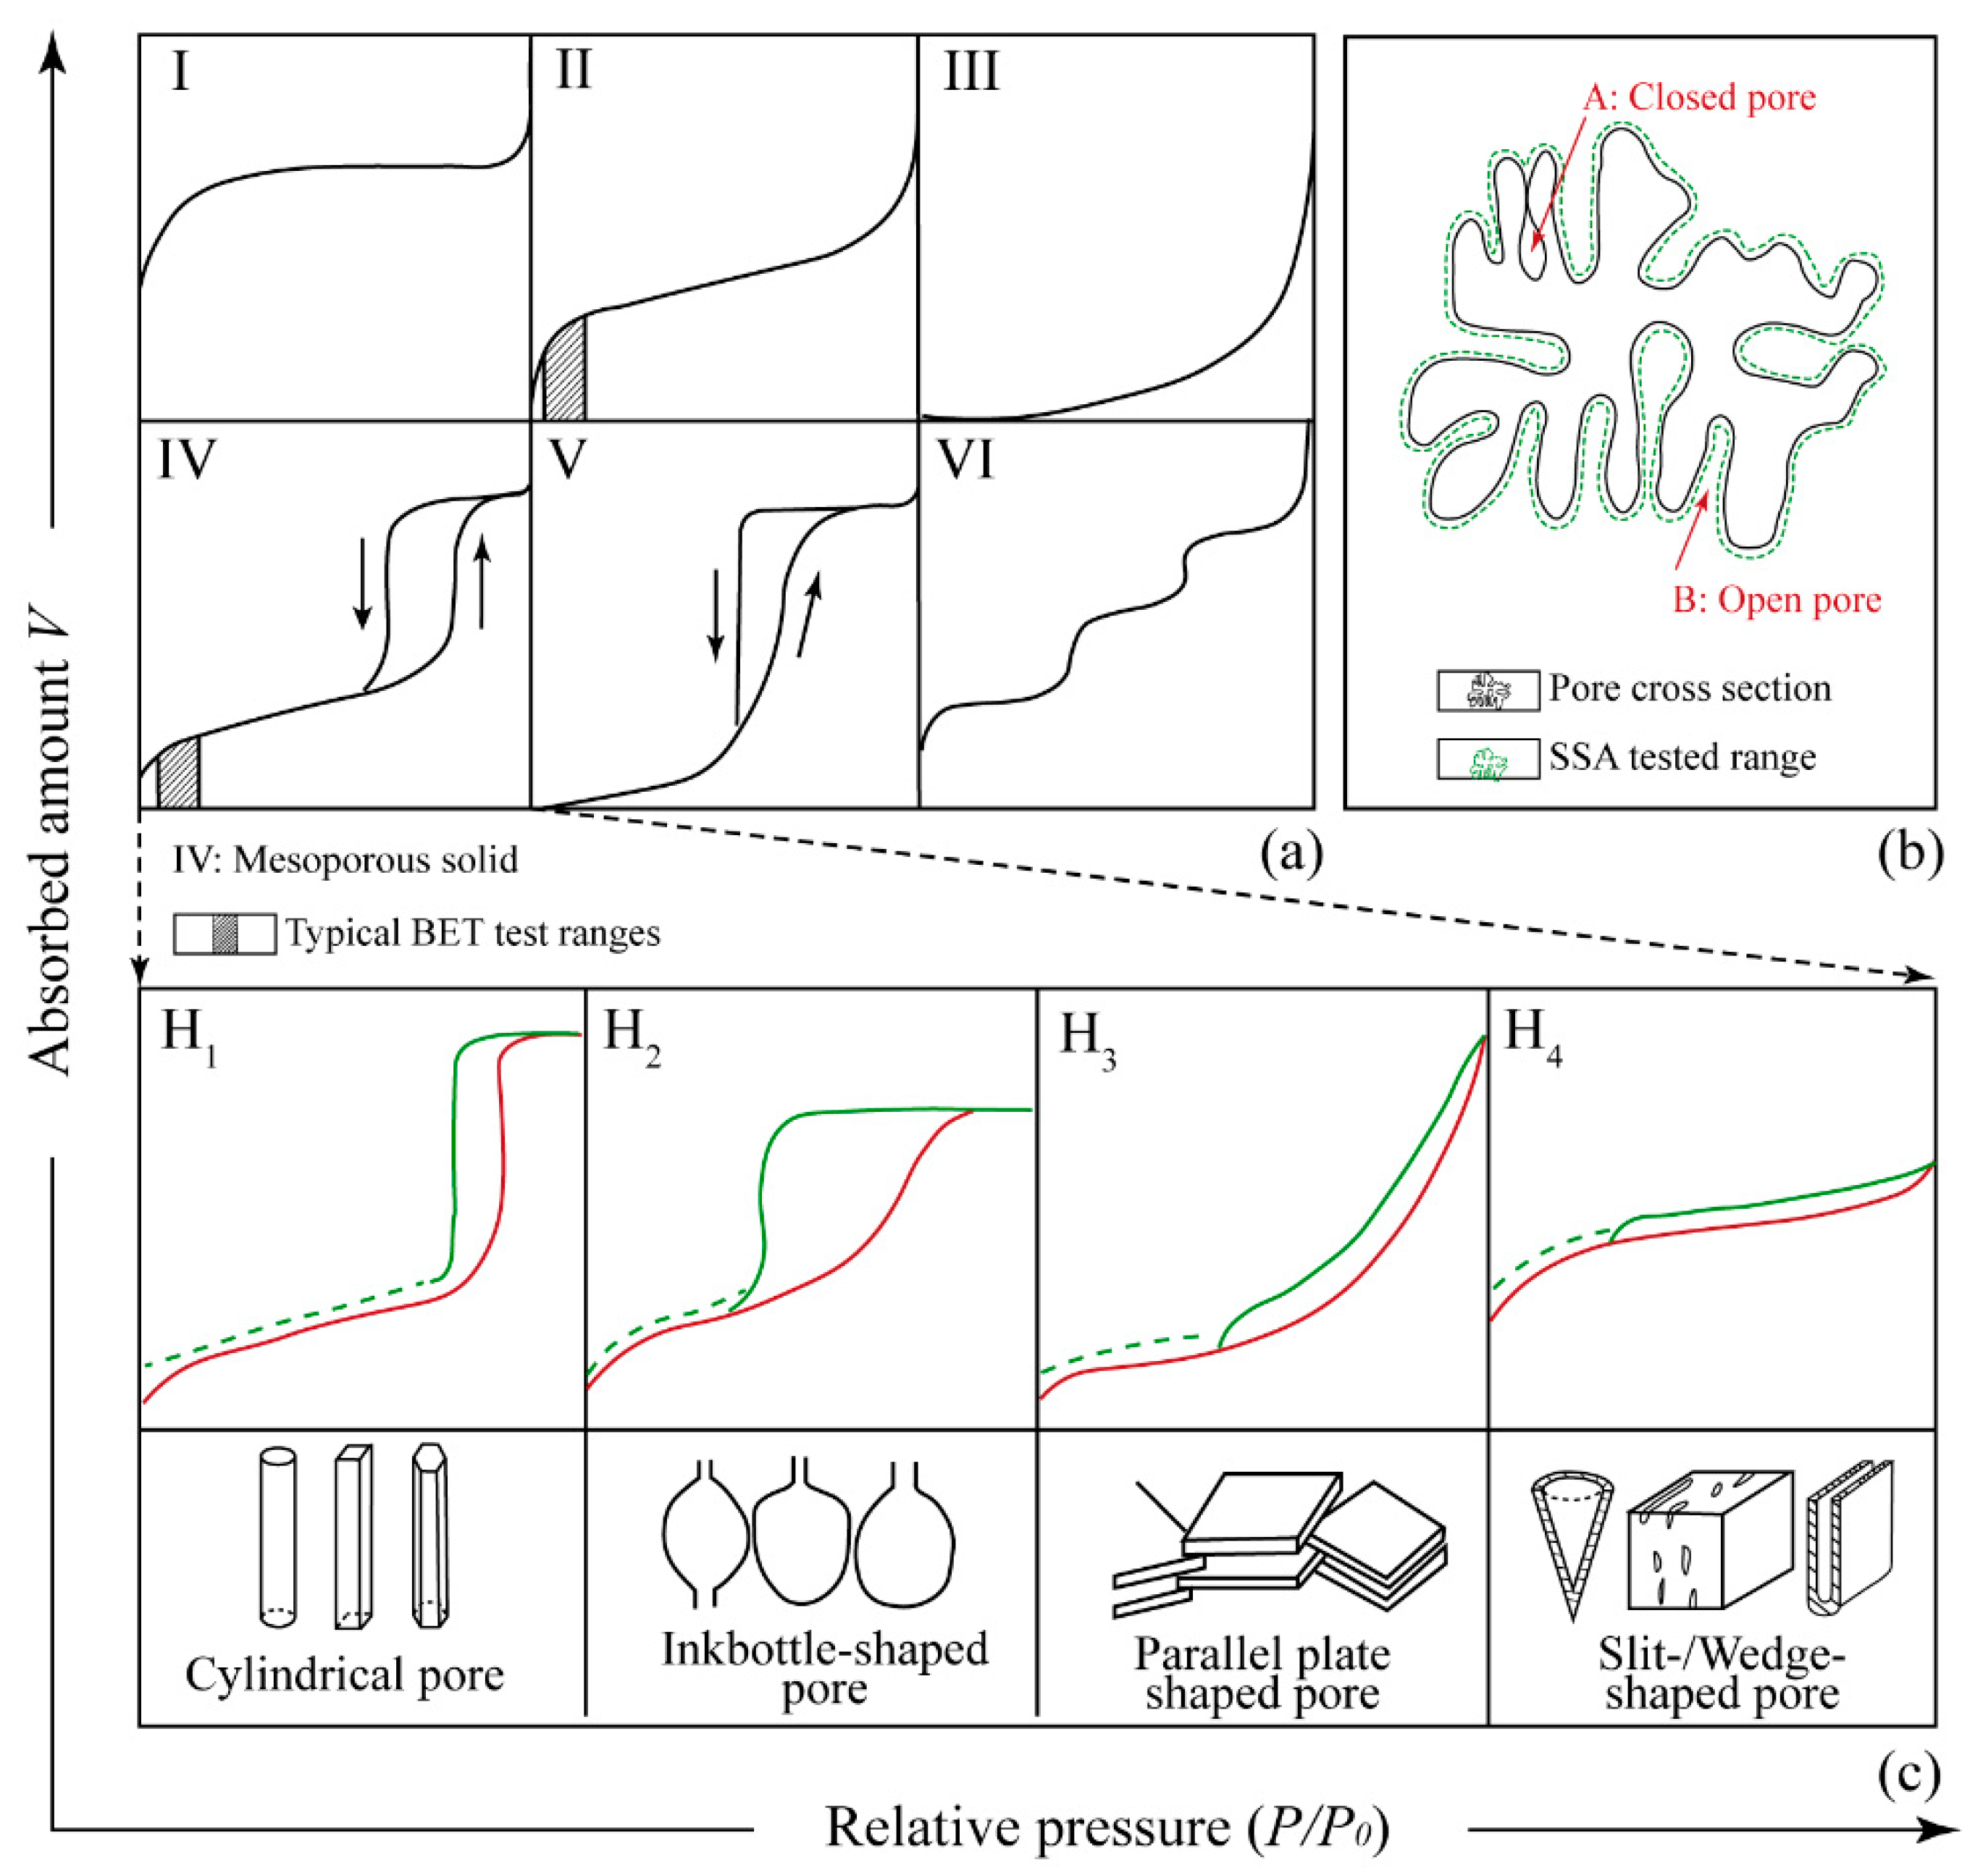
The N2 adsorption isotherms can be classified into six types according to the International Union of Pure and Applied Chemistry (IUPAC) (Figure 4a). Investigated tight sandstone samples belong to type IV with a hysteresis loop, which are anti “s” as a whole, and samples in this study area are mesoporous solid, where the hysteresis loop patterns are indicative of mixtures of mesopores and micropores in the samples. Furthermore, type IV N2 adsorption/desorption hysteresis loops can be divided into four main types, which correspond to cylindrical pores, inkbottle-shaped pores, parallel plate shaped pores, and wedge-/slit-shaped pores (Figure 4c) [18,40,51]. Based on the pattern of hysteresis loops, the 11 He 8 Member tight sandstone samples mainly exhibit three types—H1, H2, and H3.
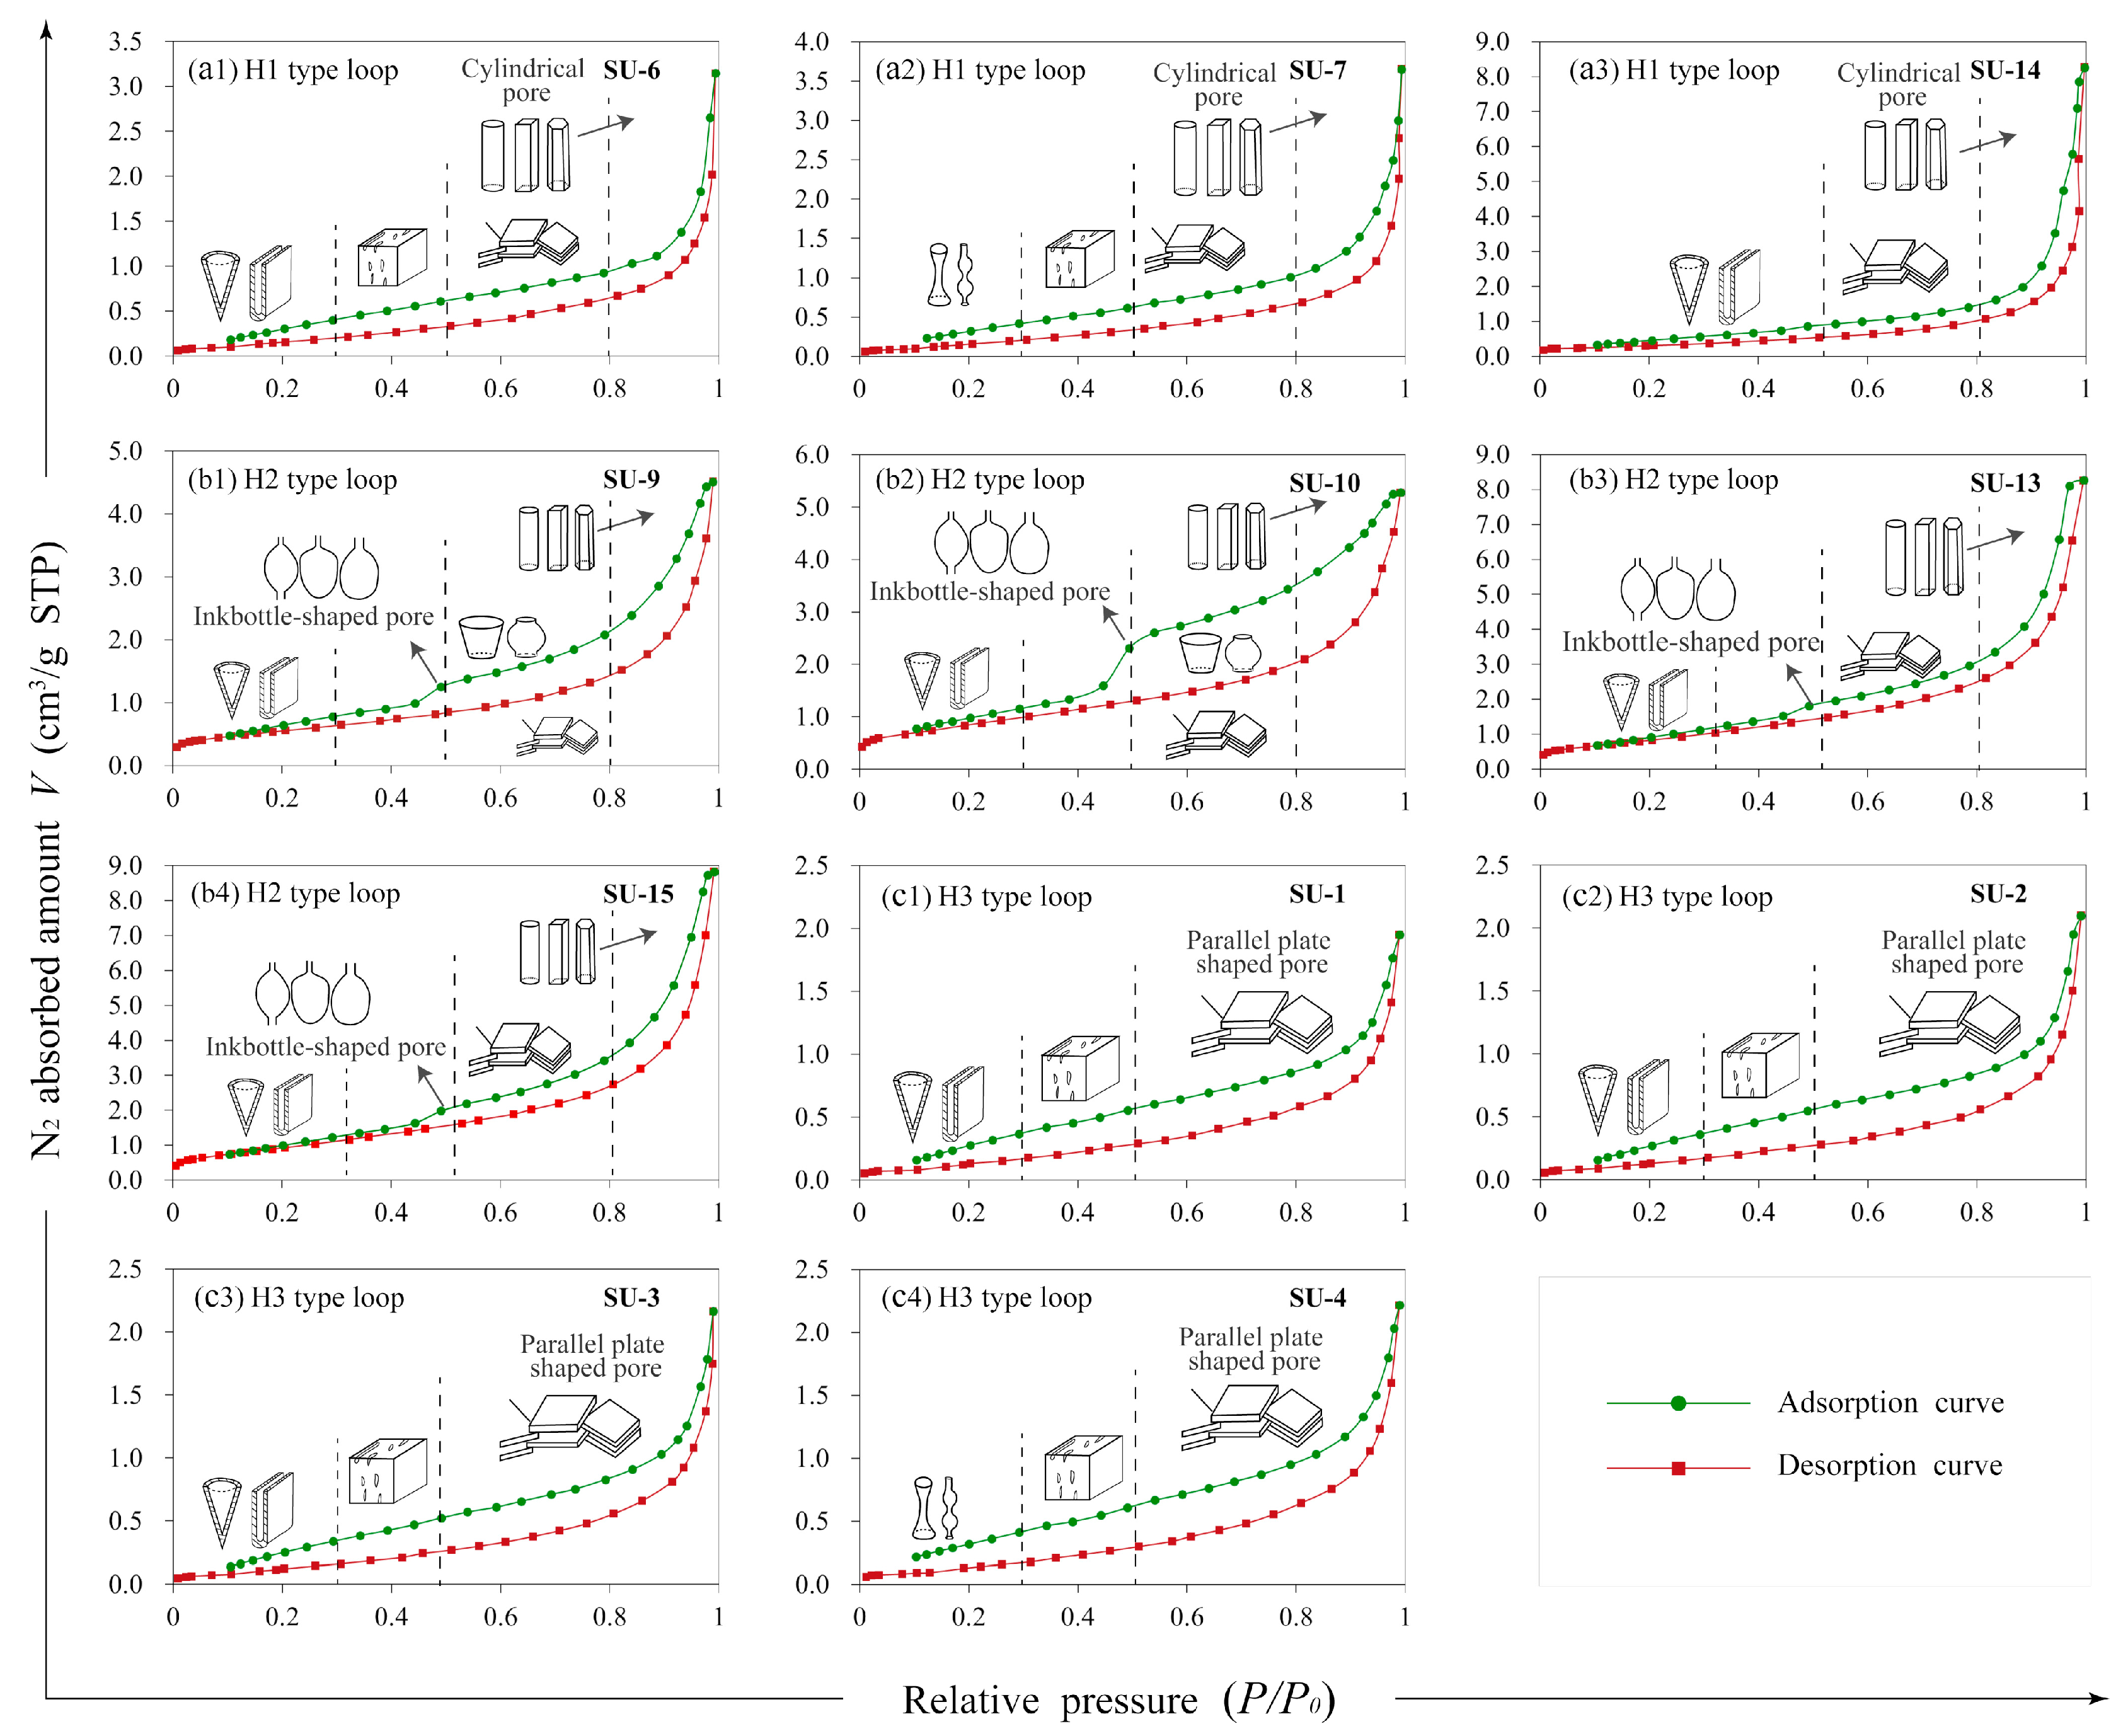
As the result shown in Figure 5 and Table 2, type H1 including SU-6, SU-7, and SU-14 always has a smaller amount N2 adsorption volume with narrow hysteresis loops, where their adsorption curves almost completely coincide with the desorption curves and increase rapidly and synchronously at a P/P0 = 0.9 approaching to 1.0. This type of loop usually corresponds to the combination of cylindrical pores and parallel plate shaped pores [40], the cylindrical pores often with the pore size distributed in 50–200 nm (macropores) and the parallel plate shaped pores usually with the pore size varies from 5–50 nm.
Analogously, the inflection point for the rapid increase of type H3 (SU-1, SU-2, SU-3, SU-4) appears around P/P0 = 0.8 with a slightly wider hysteresis loop, which is the main difference from H1 type loops. This type of loop is usually related to aggregates of slit-/wedge-shaped particles giving rise to parallel plate shaped pore with the pore size varies from 2–50 nm (slit-/wedge-shaped) and 50–100 nm (parallel plate shaped pore) [51].
For type H2 represented by SU-9, SU-10, SU-13, SU-15, the inflection point visible in the desorption curves appears around P/P0 = 0.5, which developed a wider hysteresis; this indicates the morphology of mesopore-I present a fine bottleneck with one side almost closed or double side open [18]. In addition, parallel plate–shaped pores and cylindrical pores usually appear in combination among these samples.

3.3. Specific Surface Area, Pore Volume, and Pore Size Distribution

The nanopore structure parameter in this study was calculated by the BET model (SSA) [52], BJH model (PV of mesopores) [53], and HK-SF model (PV of micropores) based on N2 adsorption data. It is noteworthy that the closed pores are not included in the BET test result (Figure 4b). The nanoscale pore quantitative analysis consequence of He 8 Member tight sandstone by N2 adsorption-desorption experiments can be seen in Table 2. The BET SSA (SBET) ranges from 0.530–3.162 m2/g (averages at 1.297 m2/g). The BJH adsorption cumulative SSA (SBJH) ranges from 0.925–3.858 m2/g (averages at 1.641 m2/g), where the average value is higher than SBET. The BJH adsorption cumulative volume (VBJH) ranges from 3.291–13.379 × 10⁻³ cm3/g (averages at 6.703 × 10⁻³ cm3/g) showed a good positive relationship with SBET (R2 = 0.569) (Figure 6a) and SBJH (R2 = 0.657) (Figure 6b). The SF micropore volume (VSF) ranges from 1.198 ~ 0.220 ×1 0–3cm3/g with an average of 0.518 × 10⁻³ cm3/g, which shows a better positive relationship with SBET (R 2= 0.988) (Figure 6c) and SBJH (R2 = 0.903) (Figure 6d), this result indicated that micropores has a higher contribution to SSA than mesopores and macropores.
The N2 maximum absorbed amount (AM) of 11 sample ranges from 1.950–8.266 cm3/g (averages at 4.155 cm3/g), which showing an excellent positive relationship with PV (VBJH: R2 = 0.997, VSF: R2 = 0.615) (Figure 6e,f). This result revealed that N2 maximum absorbed amount can represent the total PV of different samples, where the mesopores have a higher contribution. In consequence, we divided samples into three types depending on the maximum adsorption capacity, which can reflect the reservoir quality. Class A samples including SU-13, SU-14, SU-15, AM are within the range of 7.0–10.0 m2/g, with an average value of 8.453 m2/g among three samples. Class B samples including SU-6, SU-7, SU-9 SU-10, AM are within the range of 3.0~7.0 m2/g, with an average value of 4.148 m2/g. among four samples. Class C samples including SU-1, SU-2, SU-3, SU-4, AM are within the range of 0.1–3.0 m2/g, with an average value of 4.148 m2/g among four samples.
Among all three types samples, Class C samples only have a single form hysteresis loop type (H3 type loop). Whereas Class B developed H1 type loop (SU-6, SU-7) and H2 type loop (SU-9, SU-10) simultaneously. This phenomenon is related to the complex morphological features of mesopores in samples with H2 type loop as well as a smaller volume of the micropore (VSF) in samples with H1 type loop. Furthermore, as listed in Table 2, the total adsorption average pore width (WT) ranges from 10.329–45.9839 nm with an average of 24.036 nm, where samples with H1 type loop often have a larger total pore average width, while samples with H2 type loop always have a smaller one. Based on the corresponding pore shapes to H2 type loops, revealed a large amount of bowl-shaped pores in mesopores, which is the transitional form from an inkbottle-shaped pores to parallel plate shaped pores, such as SU-9 (Figure 5b1) and SU-10 (Figure 5b2).
A further discussion of the contribution rate (Vr) among five different size ranges pores to the total SBJH and total VBJH is conducted from the experimental result as showing in Figure 7. The average Vr of micropore (<2 nm), type I mesopores (mesopore-I: 2–10 nm), type II mesopores (mesopore-II: 10–50 nm), type I macropores (macropore-I: 50–100 nm) and type II macropores (macropore-I: >100 nm) to the total VBJH are 0.48%, 23.21%, 37.14%, 17.63% respectively (Figure 7a). The average contribution rate of micropore, mesopore-I, mesopore-II, macropore-I and macropore-II to the total SBJH (Sr) is 3.05%, 72.65%, 20.08%, 3.21%, and 1.00%, respectively (Figure 7b). To summarize, BJH volume mainly hinges on the number of mesopore-II (37.14%), followed by the mesopore-II (23.21%) and macropore-II (21.54%). The pore type with the largest contribution rate for the total SSA is also mesopores, with an average value of 92.73% (mesopore-I: 76.25%, mesopore-II: 20.08%).
As illustrated in Figure 8, the plot of PSD of different Hysteresis loop types tight sandstone is showing a different characteristic. H1 type loops are dominated by mesopore-II (averages at 30.11%) and mesopore-I (averages at 23.05%), with one major pore size peak range of 2~50nm (Figure 8a1,b1). The H2 type loop is mainly controlled by the macropore-II (averages at 52.11%) and mesopore-II (averages at 20.57%), with two main pore size peak range of 10~50nm and 100~200nm (Figure 8a2,b2). In addition, the predominant pore size range of H3 type is mesopore –II (averages at 41.32%), which varies from 10–50nm (Figure 8a3,b3).

3.4. The Fractal Characteristics of Nanoscale Pores

In this study, different piecewise linear fitting methods were used by selecting five different relative pressure (P/P0) cutoff value, the ln(V) vs. ln[ln(P0/P)] curves could be separated into two or three segments. The fractal fitting curves of three typical samples are illustrated in Figure 9, where the slope (k) was used to calculate fractal dimension value (DN) according to Equation (1) and Equation (2), using calculated root mean square error (R2) to show the fitting degree. As presented in Table 3, DN calculated by all four methods exhibit good fitting with R2 values that are mostly higher than 0.97, and the calculated results are shown in Table 4.
In the first method, the unsegmented method was utilized to calculate DN0, which can represent the heterogeneity of the whole nanoscale pores. The DN0 values range from 2.360 to 2.592, averages at 2.446, which showing an ideal fractal feature in the nanoscale pore structure of He 8 Member tight sandstone.
Trichotomy was used in the second method. Three distinct fitting liner segments are obtained at different relative pressure corresponds to different BJH pore width (W) range respectively. The DN1 ranges from 2.500 to 2.707 (averaging at 2.597), which is the value correspond to the pore microstructures complexity of pore size lager than 10 nm, while DN2 is the representative value of pore structure heterogeneous features with PW range from 2 nm~10 nm, which is varied from 2.168 to 2.539 (averaging at 2.314). Correspondingly, DN3 value represents the heterogeneity characteristic of micropores (W < 2 nm), ranges from 2.215 to 2.600 with an average of 2.382. The results show that the heterogeneity of macropores and micropores is generally stronger than that of mesopores.
The dichotomy was used to separate the ln(V) vs. ln[ln(P0/P)] plot into two segments with relative pressure point corresponds to the BJH W = 5 nm as the cutoff value, which can fit two straight line separately and obtained DN4 (Pore size: W > 5 nm) and DN5 (Pore size: W ≤ 5 nm) severally. DN4 values range from 2.481 to 2.660 with an average of 2.566. DN5 values range from 2.063 to 2.191, averaging at 2.259, which is smaller than DN4.
In the fourth method, selecting a cutoff value based on the inflection point of N2-GA isotherms curve, divided into three the following areas: Region 1: P/P0 > 0.8; Region 2: 0.5 < P/P0 ≤ 0.8; Region 3: P/P0 ≤ 0.5, where DN6 values ranges from 2.507 to 2.707, with an average of 2.602. DN7 values range from 2.300 to 2.598, averaging at 2.417, which is lower than DN6. DN8 values range from 2.058 to 2.494, averaging at 2.261, which is smaller than DN7.

4. Discussion

4.1. Effect of Mineral Composition on Fractal Dimensions

The heterogeneous distribution of mineral particles constitutes a diversiform pore-throat system. FE-SEM images show that pore types of all tight sandstone samples consist of different mineral edge can be classified into four types: original intergranular pore (Figure 10a), secondary dissolved intragranular pore (Figure 10b), intercrystalline micropores of clay minerals (Figure 10c–f), and microfissure (Figure 10a).
Quartz is the highest mineral composition in all tight sandstone samples according to the X-RD results (Table 1 and Figure 3) and FE-SEM images (Figure 10a). Therefore, it is extremely important to point out the relationship between quartz and DN. The result shows that quartz content is showing a good negative correlation with all types of fractal dimensions respectively, which DN0 and DN2 showing the best correlation with quartz content (Figure 11a,b), with correlation coefficients of 0.751 and 0.748. A higher quartz content indicates the pore-throat system tend to be simpler, which is contrary to the relationship between total clay mineral content and DN (Figure 11c,d), with a positive correlation coefficient of 0.865 (DN0) and 0.809 (DN7). This is associated with the extensive distribution of clay minerals and its complex composition, which provides a large amount of nano-scale storage space for the occurrence of tight gas and makes the pore-throat system more complex at the same time.
In addition, the intercrystalline micropores of chlorite and kaolinite has a smaller SSA than that is in illite/smectite and illite because it has a smoother edge. It also makes the illite and illite/smectite has good positive correlation with fractal dimensions DN7 (Figure 11e,f), where the phenomenon of mixed layer mineral is more obvious.

4.2. Effect of Pore Size Distribution on Fractal Dimensions

Pore-throat system is a crucial storage space of tight sandstone gas as well as significant flowing channel for natural gas during the entire development process. This means that mineral composition has a significant influence on SSA, PV, and DN, respectively. As shown in Figure 12a, all the tight sandstone samples are arranged in the order of the clay mineral content increasing; the total SBET also has an increasing trend identified. Furthermore, SBET has an excellent positive relationship with all types of fractal dimensions (P-value < 0.01, except of DN5 and DN8), where the correlation with DN7 (R2 = 0.783), DN4 (R2 = 0.794) and DN2 (R2 = 0.783) is more obvious. Similarly, as the increasing of clay mineral content, PV also has an increasing tendency (Figure 12b). Moreover, the relationship between DN and SF micropores volume is significant (P-value < 0.01, except of DN5, DN8, and DN3), with a positive correlation coefficient of 0.844 (DN7) and 0.794 (DN0), whereas it is not significant between the relationship of DN and VBJH, with a positive correlation coefficient of 0.416 (DN7) and 0.406 (DN0).
Moreover, the relationship between the SSA contribution rate (Sr) of different pore size range with fractal dimensions shows the different characters. Thereinto, the mesopore-II has an excellent positive relationship with DN8 (R 2= 0.746,P-vuale < 0.01) (Figure 13a), whereas macropore-II has a negative correlation with DN1 (R2 = 0.730,P-vuale < 0.01) (Figure 13b), this result shows that where there is a smaller Sr of mesopore-II and a lager Sr of macropore-II, there is a simpler pore-throat structure, such as SU-14.

4.3. Compective Study of Fractal Dimensions

As illustrated in Figure 9 and Figure 14, the unsegmented and segmented linear fitting methods both are effective way to obtain the fractal curves based on N2-GA isotherms curve, which can accurately represent the fractal characteristic of the different pore size range separately and indicate that the distribution of the pore throat in He 8 Member tight sandstone has multi-fractal characteristic. All types of fractal dimensions showing an increasing trend as the clay mineral content increasing, which indicate a good relationship between mineral composition with Dn. Thereinto, the value of DN0 is the closest to the average and the DN2 has the best relationship with the average value (R2 = 0.954).
Furthermore, as listed in Table 4, the fractal dimensions always appear the highest average value in tight sandstone sample with H2 type hysteresis loops no matter what methods were used, indicating that pore structure heterogeneity is mainly controlled by the inkbottle-shaped pores and the Vr of mesopore.
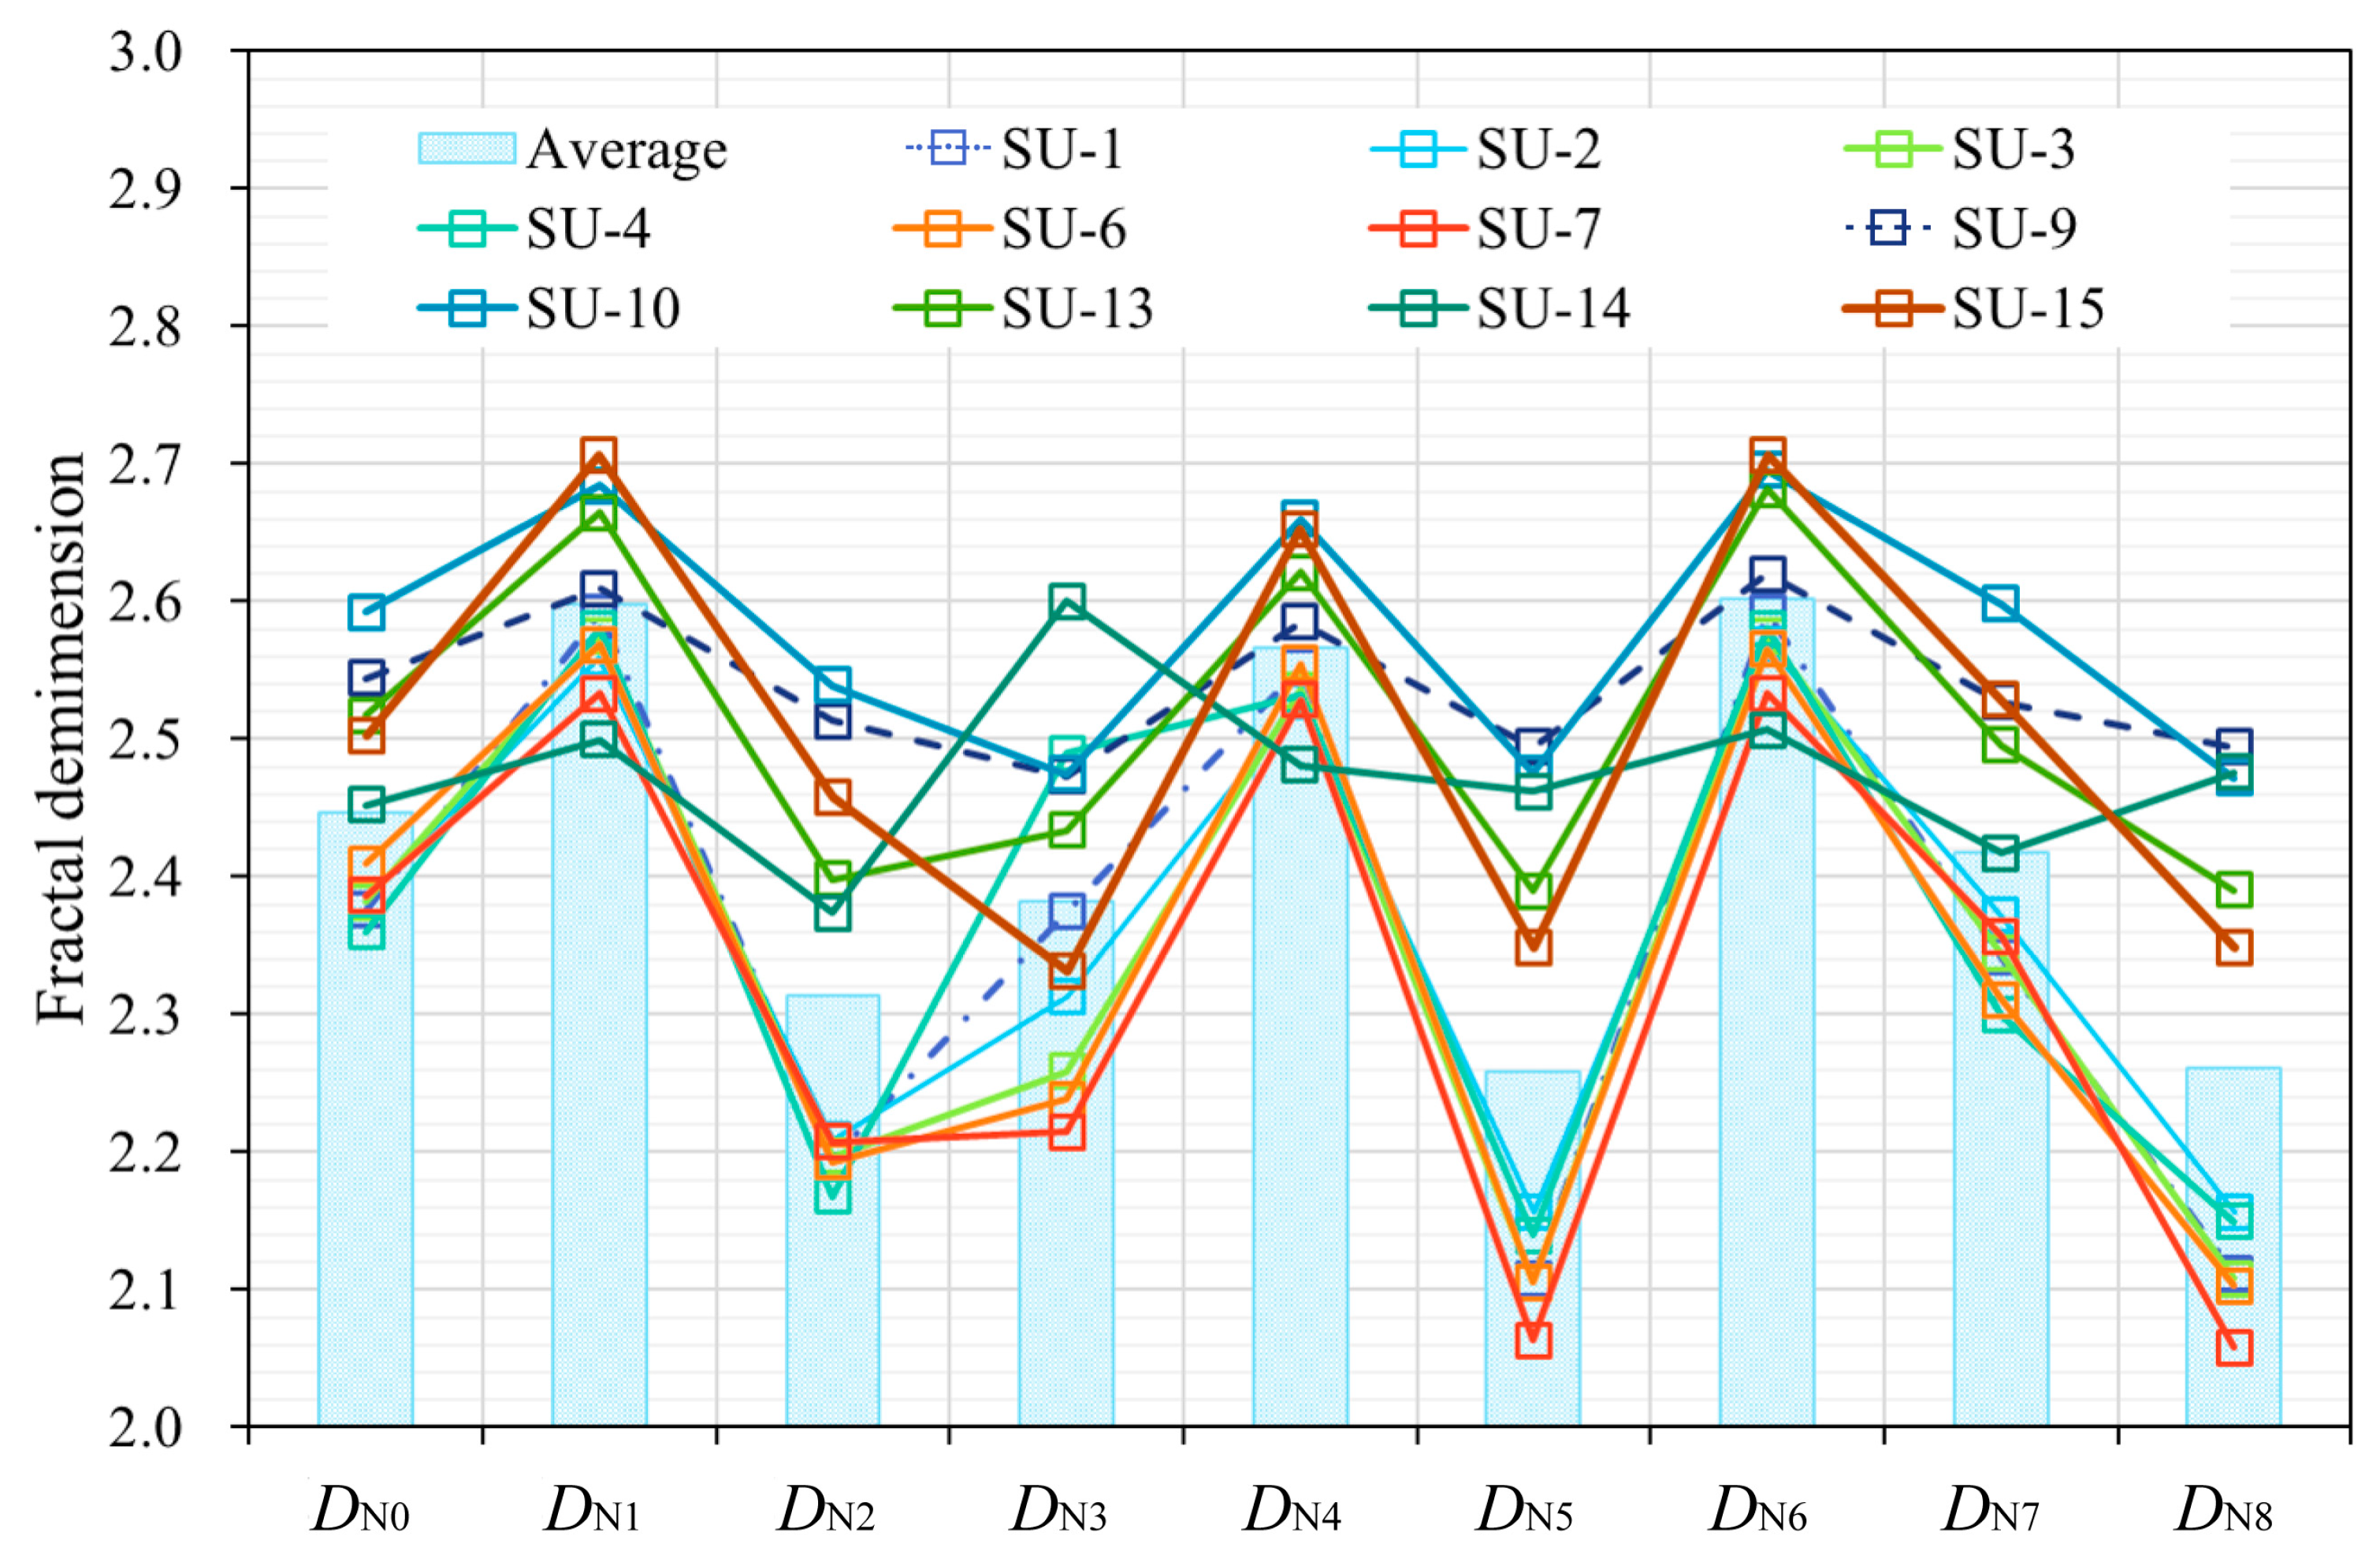
Among different types of fractal dimensions, the overall distribution of DN0, DN1, DN4, and DN6 is more concentrated, whereas the whole distribution of DN2, DN3, DN5, DN7 and DN8 is more scattered (Figure 15). This is relevant to the heterogeneity of pore structure and mineral composition, which expanded the range of fractal dimension values, in other words, this type of fractal dimensions is more sensitive to certain specific property. Correlation analysis results show that expect of DN3 showing a weak relationship with chlorite content (R2 = 0.252), which present the best correlation among all types of DN, all the “scattered” fractal dimensions is bound up with mineral content to some extent, while “concentrated” fractal dimensions is much weaker except of DN0. In addition, DN5 and DN8 merely present a good relationship with mineral content (especially in quartz content and illite/smectite content) (Figure 11 and Figure 14) and Sr of mesopore-II, which is optimum parameter to represent the complexity of mineral composition and its corresponding micropore shape.

5. Conclusions

In this paper, nine types fractal dimension were obtained using different piecewise linear fitting methods by selecting five different relative pressure (P/P0), and we put forward the concept of “concentrated” fractal dimensions and “scattered” fractal dimensions for the first time according to its concentration extent of distribute in different samples. Moreover, three types of hysteresis loops were distinguished that correspond to different pore shape combination and the impact of mineral composition and pore structure on different fractal dimensions were discussed in detail. These findings can provide new insights for quantitative evaluation the microscopic heterogeneity of tight sandstone reservoir at various pore size classes and further reveal the controlling effect of pore heterogeneity on natural gas storage and desorption, which is of great significance for improving the exploitation efficiency of tight sandstone gas. The main conclusions are summarized as follows:
(1) Among all types of fractal dimensions, DN0 represent the heterogeneity of whole nanoscale pore, with the ranges of 2.360 to 2.592, averaging at 2.446, which show an ideal fractal feature of the nanoscale pore structure of tight sandstone in He 8 Member. Meanwhile, the value of DN0 is the closest to the average while the DN2 has the best relationship with the average value (R2 = 0.954).
(2) The “scattered” fractal dimensions (DN2, DN3, DN5, DN7) are more sensitive to certain specific property of the reservoir, including mineral content (especially in quartz content and illite/smectite content) and the Sr of mesopore-II (10–50 nm), where DN5 and DN8 are optimum parameter to represent the complexity of mineral composition and its corresponding micropore shape.
(3) H1 type loop indicated the combination of cylindrical pores and parallel plate shaped pores; H2 type loop related to the combination of inkbottle-shaped pores and cylindrical pores, with bowl-shaped pores as a transitional form in the mesopores; H3 type loop is associated with the combination of slit-/wedge-shaped pores and parallel plate shaped pores. Furthermore, the heterogeneity of pore structure in this study area is predominantly controlled by inkbottle-shaped pores and the Vr of mesopores.
To sum it up, the analysis of fractal dimensions is a topic of actuality in geosciences in general and contributes to a better understanding of methane adsorption characteristics in tight sandstone gas resources. This work addressed the characteristics of volume fractal dimensions of tight sandstone at various size classes, but the surface fractal dimensions are not discussed in this paper, which could be a future research direction.

Author Contributions

Data curation, Z.W. and X.J.; Formal analysis, Z.W.; Investigation, Z.W.; Methodology, M.P. and Y.S.; Project administration, Y.S.; Resources, Y.S.; Supervision, M.P. and Y.S.; Visualization, Z.W.; Writing—original draft, Z.W.; Writing—review & editing, X.J. All authors have read and agreed to the published version of the manuscript.

Funding

This research was funded by the National Science and Technology Major Project of China, grant number 2017ZX05013005-009.

Acknowledgments

The authors greatly appreciate the Changqing Oilfield Branch Company of China National Petroleum Corporation for all the support during this work. The authors would like to thank all editors and reviewers for their constructive comments on this paper.

Conflicts of Interest

The authors declare no conflict of interest.

References

  1. Zou, C.; Yang, Z.; He, D.; Wei, Y.; Li, J.; Jia, A.; Chen, J.; Zhao, Q.; Li, Y.; Li, J.; et al. Theory, technology and prospects of conventional and unconventional natural gas. Pet. Explor. Dev. 2018, 45, 604–618. [Google Scholar] [CrossRef]
  2. Zou, C.; Zhai, G.; Zhang, G.; Wang, H.; Zhang, G.; Li, J.; Wang, Z.; Wen, Z.; Ma, F.; Liang, Y.; et al. Formation, distribution, potential and prediction of global conventional and unconventional hydrocarbon resources. Pet. Explor. Dev. 2015, 42, 14–28. [Google Scholar] [CrossRef]
  3. Sun, L.; Zou, C.; Jia, A.; Wei, Y.; Zhu, R.; Wu, S.; Guo, Z. Development characteristics and orientation of tight oil and gas in China. Pet. Explor. Dev. 2019, 46, 1073–1087. [Google Scholar] [CrossRef]
  4. Zhang, L.; Lu, S.; Xiao, D.; Li, B. Pore structure characteristics of tight sandstones in the northern Songliao Basin, China. Mar. Pet. Geol. 2017, 88, 170–180. [Google Scholar] [CrossRef]
  5. Lai, J.; Wang, G.; Cao, J.; Xiao, C.; Wang, S.; Pang, X.; Dai, Q.; He, Z.; Fan, X.; Yang, L.; et al. Investigation of pore structure and petrophysical property in tight sandstones. Mar. Pet. Geol. 2018, 91, 179–189. [Google Scholar] [CrossRef]
  6. Giacchetta, G.; Leporini, M.; Marchetti, B. Economic and environmental analysis of a Steam Assisted Gravity Drainage (SAGD) facility for oil recovery from Canadian oil sands. Appl. Energy 2015, 142, 1–9. [Google Scholar] [CrossRef]
  7. Du, S.; Zhao, Y.; Shi, Y. Characteristics and the formation mechanism of heterogeneous microfracture in the upper Triassic Yanchang formation tight oil sandstone of the Ordos Basin, China. J. Pet. Sci. Eng. 2020, 191, 107176. [Google Scholar] [CrossRef]
  8. Du, S.; Zhao, Y.; Yuan, Q. Prediction of permeability and its anisotropy of tight oil reservoir via precise pore-throat tortuosity characterization and “umbrella deconstruction” method. J. Pet. Sci. Eng. 2019, 178, 1018–1028. [Google Scholar] [CrossRef] [Green Version]
  9. Lai, J.; Wang, G.; Wang, Z.; Chen, J.; Pang, X.; Wang, S.; Zhou, Z.; He, Z.; Qin, Z.; Fan, X. A review on pore structure characterization in tight sandstones. Earth-Sci. Rev. 2018, 177, 436–457. [Google Scholar] [CrossRef]
  10. Liu, K.; Ostadhassan, M.; Zhou, J.; Gentzis, T.; Rezaee, R. Nanoscale pore structure characterization of the Bakken shale in the USA. Fuel 2017, 209, 567–578. [Google Scholar] [CrossRef]
  11. Clarkson, C.; Solano, N.; Bustin, R.; Bustin, A.; Chalmers, G.; He, L.; Melnichenko, Y.; Radlinski, A.; Blach, T. Pore structure characterization of North American shale gas reservoirs using USANS/SANS, gas adsorption, and mercury intrusion. Fuel 2013, 103, 606–616. [Google Scholar] [CrossRef]
  12. Mandelbrot, B.B. The Fractal Geometry of Nature; Freeman, W., Ed.; W.H. Freeman: San Francisco, CA, USA, 1983; Volume 173, p. 468. [Google Scholar]
  13. Macias-Garcia, A.; Diaz-Diez, M.; Cuerda-Correa, E.; Olivares, M.; Gañán-Gómez, J. Study of the pore size distribution and fractal dimension of HNO3-treated activated carbons. Appl. Surf. Sci. 2006, 252, 5972–5975. [Google Scholar] [CrossRef]
  14. Bernal, J.L.P.; López, M.A.B. The fractal dimension of stone pore surface as weathering descriptor. Appl. Surf. Sci. 2000, 161, 47–53. [Google Scholar] [CrossRef]
  15. Sing, K.S.W. Reporting physisorption data for gas/solid systems with special reference to the determination of surface area and porosity (Recommendations 1984). Pure Appl. Chem. 1985, 57, 603–619. [Google Scholar] [CrossRef]
  16. Avnir, D.; Farin, D.; Pfeifer, P. Molecular fractal surfaces. Nature 1984, 308, 261–263. [Google Scholar] [CrossRef]
  17. Mandelbrot, B.B.; Passoja, D.E.; Paullay, A.J. Fractal character of fracture surfaces of metals. Nature 1984, 308, 721–722. [Google Scholar] [CrossRef]
  18. Li, Z.; Liu, D.; Cai, Y.; Wang, Y.; Teng, J. Adsorption pore structure and its fractal characteristics of coals by N2 adsorption/desorption and FESEM image analyses. Fuel 2019, 257, 116031. [Google Scholar] [CrossRef]
  19. Pan, J.; Wang, K.; Hou, Q.; Niu, Q.; Wang, H.; Ji, Z. Micro-pores and fractures of coals analysed by field emission scanning electron microscopy and fractal theory. Fuel 2016, 164, 277–285. [Google Scholar] [CrossRef]
  20. Yu, K.; Ju, Y.; Qi, Y.; Qiao, P.; Huang, C.; Zhu, H.; Feng, H. Fractal characteristics and heterogeneity of the nanopore structure of marine shale in Southern North China. Minerals 2019, 9, 242. [Google Scholar] [CrossRef] [Green Version]
  21. Yuan, Y.; Rezaee, R. Fractal analysis of the pore structure for clay bound water and potential gas storage in shales based on NMR and N2 gas adsorption. J. Pet. Sci. Eng. 2019, 177, 756–765. [Google Scholar] [CrossRef]
  22. Pfeifer, P.; Cole, M.W.; Krim, J.; Wu, Y.J. Multilayer adsorption on a fractally rough surface. Phys. Rev. Lett. 1989, 62, 1997–2000. [Google Scholar] [CrossRef]
  23. Zhang, S.; Tang, S.; Tang, D.; Huang, W.; Pan, Z. Determining fractal dimensions of coal pores by FHH model: Problems and effects. J. Nat. Gas Sci. Eng. 2014, 21, 929–939. [Google Scholar] [CrossRef]
  24. Wang, J.; Qin, Q.; Guo, L.; Feng, Y. Multi-fractal characteristics of three-dimensional distribution of reconstructed soil pores at opencast coal-mine dump based on high-precision CT scanning. Soil Tillage Res. 2018, 182, 144–152. [Google Scholar] [CrossRef]
  25. Zhou, X.-P.; Zhao, Z. Digital evaluation of nanoscale-pore shale fractal dimension with microstructural insights into shale permeability. J. Nat. Gas Sci. Eng. 2020, 75, 103137. [Google Scholar] [CrossRef]
  26. Hongchao, X.; Guanhua, N.; Shang, L.; Qian, S.; Kai, D.; Jingna, X.; Gang, W.; Yixin, L. The influence of surfactant on pore fractal characteristics of composite acidized coal. Fuel 2019, 253, 741–753. [Google Scholar] [CrossRef]
  27. Fan, X.; Wang, G.; Li, Y.; Dai, Q.; Linghu, S.; Duan, C.; Zhang, C.; Zhang, F. Pore structure evaluation of tight reservoirs in the mixed siliciclastic-carbonate sediments using fractal analysis of NMR experiments and logs. Mar. Pet. Geol. 2019, 109, 484–493. [Google Scholar] [CrossRef]
  28. Zhang, Z.; Weller, A. Fractal dimension of pore-space geometry of an Eocene sandstone formation. Geophysics 2014, 79, D377–D387. [Google Scholar] [CrossRef]
  29. Wang, F.; Yang, K.; You, J.; Lei, X. Analysis of pore size distribution and fractal dimension in tight sandstone with mercury intrusion porosimetry. Results Phys. 2019, 13, 102283. [Google Scholar] [CrossRef]
  30. Guo, X.; Huang, Z.; Zhao, L.; Han, W.; Ding, C.; Sun, X.; Yan, R.; Zhang, T.; Yang, X.; Wang, R. Pore structure and multi-fractal analysis of tight sandstone using MIP, NMR and NMRC methods: A case study from the Kuqa depression, China. J. Pet. Sci. Eng. 2019, 178, 544–558. [Google Scholar] [CrossRef]
  31. Han, W.; Zhou, G.; Gao, D.; Zhang, Z.; Wei, Z.; Wang, H.; Yang, H. Experimental analysis of the pore structure and fractal characteristics of different metamorphic coal based on mercury intrusion-nitrogen adsorption porosimetry. Powder Technol. 2020, 362, 386–398. [Google Scholar] [CrossRef]
  32. Xu, L.; Zhang, J.C.; Ding, J.; Liu, T.; Shi, G.; Li, X.; Dang, W.; Cheng, Y.; Guo, R. Pore structure and fractal characteristics of different shale lithofacies in the Dalong formation in the Western Area of the lower Yangtze platform. Minerals 2020, 10, 72. [Google Scholar] [CrossRef] [Green Version]
  33. Xi, Z.; Tang, S.; Wang, J.; Yi, J.; Guo, Y.; Wang, K. Pore structure and fractal characteristics of niutitang shale from China. Minerals 2018, 8, 163. [Google Scholar] [CrossRef] [Green Version]
  34. Huang, C.; Ju, Y.; Zhu, H.; Qi, Y.; Yu, K.; Sun, Y.; Ju, L. Nano-scale pore structure and fractal dimension of Longmaxi shale in the Upper Yangtze region, South China: A case study of the Laifeng–Xianfeng block using HIM and N2 adsorption. Minerals 2019, 9, 356. [Google Scholar] [CrossRef] [Green Version]
  35. Liu, J.; Lu, D.; Li, P. Nano-scale dual-pore-shape structure and fractal characteristics of transitional facies shale matrix. J. Nat. Gas Sci. Eng. 2019, 68, 68. [Google Scholar] [CrossRef]
  36. Li, Z.; Liang, Z.; Jiang, Z.; Gao, F.; Zhang, Y.; Yu, H.; Xiao, L.; Yang, Y. The impacts of matrix compositions on nanopore structure and fractal characteristics of lacustrine shales from the Changling fault depression, Songliao Basin, China. Minerals 2019, 9, 127. [Google Scholar] [CrossRef] [Green Version]
  37. Wang, X.; Jiang, Z.; Jiang, S.; Chang, J.; Zhu, L.; Li, X.; Li, J. Full-scale pore structure and fractal dimension of the Longmaxi shale from the Southern Sichuan Basin: Investigations using FE-SEM, gas adsorption and mercury intrusion porosimetry. Minerals 2019, 9, 543. [Google Scholar] [CrossRef] [Green Version]
  38. Shan, C.; Zhao, W.; Wang, F.; Zhang, K.; Feng, Z.; Guo, L.; Ma, X.; Liao, T. Nanoscale pore structure heterogeneity and its quantitative characterization in Chang7 lacustrine shale of the southeastern Ordos Basin, China. J. Pet. Sci. Eng. 2020, 187, 106754. [Google Scholar] [CrossRef]
  39. He, X.; Cheng, Y.; Hu, B.; Wang, Z.; Wang, C.; Yi, M.; Wang, L. Effects of coal pore structure on methane-coal sorption hysteresis: An experimental investigation based on fractal analysis and hysteresis evaluation. Fuel 2020, 269, 117438. [Google Scholar] [CrossRef]
  40. Yu, S.; Bo, J.; FengLi, L.; Jiegang, L. Structure and fractal characteristic of micro- and meso-pores in low, middle-rank tectonic deformed coals by CO 2 and N 2 adsorption. Microporous Mesoporous Mater. 2017, 253, 191–202. [Google Scholar] [CrossRef]
  41. Zhu, J.-F.; Yang, W.; Yang, Y.-M.; Cheng, J.; Zhou, J.; Cen, K.-F. Fractal characteristics of pore structures in 13 coal specimens: Relationship among fractal dimension, pore structure parameter, and slurry ability of coal. Fuel Process. Technol. 2016, 149, 256–267. [Google Scholar] [CrossRef]
  42. Fu, H.; Tang, D.; Xu, T.; Xu, H.; Tao, S.; Li, S.; Yin, Z.; Chen, B.; Zhang, C.; Wang, L. Characteristics of pore structure and fractal dimension of low-rank coal: A case study of Lower Jurassic Xishanyao coal in the southern Junggar Basin, NW China. Fuel 2017, 193, 254–264. [Google Scholar] [CrossRef]
  43. Pan, J.; Peng, C.; Wan, X.; Zheng, D.; Lv, R.; Wang, K.; Deshun, Z. Pore structure characteristics of coal-bearing organic shale in Yuzhou coalfield, China using low pressure N 2 adsorption and FESEM methods. J. Pet. Sci. Eng. 2017, 153, 234–243. [Google Scholar] [CrossRef]
  44. Ma, X.; Guo, S.; Shi, D.; Zhou, Z.; Liu, G. Investigation of pore structure and fractal characteristics of marine-continental transitional shales from Longtan Formation using MICP, gas adsorption, and NMR (Guizhou, China). Mar. Pet. Geol. 2019, 107, 555–571. [Google Scholar] [CrossRef]
  45. Darby, B.J.; Ritts, B. Mesozoic contractional deformation in the middle of the Asian tectonic collage: The intraplate Western Ordos fold–thrust belt, China. Earth Planet. Sci. Lett. 2002, 205, 13–24. [Google Scholar] [CrossRef]
  46. Bai, D.; Yang, M.; Lei, Z.; Zhang, Y. Effect of tectonic evolution on hydrocarbon charging time: A case study from Lower Shihezi Formation (Guadalupian), the Hangjinqi area, northern Ordos, China. J. Pet. Sci. Eng. 2020, 184, 106465. [Google Scholar] [CrossRef]
  47. Xiao, H.; Liu, R.; Zhang, F.; Lin, C.; Zhang, M. Sedimentary model reconstruction and exploration significance of Permian He 8 Member in Ordos Basin, NW China. Pet. Explor. Dev. 2019, 46, 280–292. [Google Scholar] [CrossRef]
  48. Tatlıer, M.; Erdem-Şenatalar, A. Method to evaluate the fractal dimensions of solid adsorbents. J. Phys. Chem. B 1999, 103, 4360–4365. [Google Scholar] [CrossRef]
  49. Jaroniec, M. Evaluation of the fractal dimension from a single adsorption isotherm. Langmuir 1995, 11, 2316–2317. [Google Scholar] [CrossRef]
  50. Avnir, D.; Jaroniec, M. An isotherm equation for adsorption on fractal surfaces of heterogeneous porous materials. Langmuir 1989, 5, 1431–1433. [Google Scholar] [CrossRef]
  51. Shan, C.; Zhang, T.; Liang, X.; Zhang, Z.; Wang, M.; Zhang, K.; Zhu, H. On the fundamental difference of adsorption-pores systems between vitrinite- and inertinite-rich anthracite derived from the southern Sichuan basin, China. J. Nat. Gas Sci. Eng. 2018, 53, 32–44. [Google Scholar] [CrossRef]
  52. Brunauer, S.; Emmett, P.H.; Teller, E. Adsorption of gases in multi-molecular layers. J. Am. Chem. Soc. 1938, 60, 309–319. [Google Scholar] [CrossRef]
  53. Barrett, E.P.; Joyner, L.G.; Halenda, P.P. The determination of pore volume and area distributions in porous substances. I. Computations from nitrogen isotherms. J. Am. Chem. Soc. 1951, 73, 373–380. [Google Scholar] [CrossRef]
Figure 1. Location of the study area showing in the tectonic map of Ordos Basin. (a) Geographic location of the Ordos Basin; (b) geographic location of the study area.
Minerals 10 00377 g001
Figure 2. Schematic diagram of sampling location. (a) Generalized stratigraphic columns of the Shihezi Formation (modified from reference [47]); (b) sampling depth and its corresponding logging profile and gamma (GR ) curve.
Minerals 10 00377 g002
Figure 3. Mineral composition bar chart of He 8 Member tight sandstone. (a) Total rock mineral composition bar charts; (b) clay mineral composition bar charts.
Minerals 10 00377 g003
Figure 4. Type of adsorption isotherms and its corresponding pore types: (a) Type of adsorption isotherms; (b) specific surface area (SSA) tested range by Brunauer-Emmett-Teller (BET) test; (c) hysteresis loops and its corresponding pore shapes.
Minerals 10 00377 g004
Figure 5. N2 adsorption/desorption isotherms and the corresponding pore shapes of He 8 Member tight sandstone samples. (a1)–(a3) Samples with H1 type hysteresis loop; (b1)-(b4) samples with H2 type hysteresis loop; (c1)–(c4) samples with H3 type hysteresis loop.
Minerals 10 00377 g005
Figure 6. Univariate linear regression analysis of pore structure parameters: (a) Relationship between VBJH and SBET; (b) relationship between VBJH and SBJH; (c) relationship between VSF and SBET; (d) relationship between VSF and SBJH; (e) relationship between VBJH and AM; (f) relationship between VSF, and AM.
Minerals 10 00377 g006
Figure 7. The contribution rate of VBJH and SBJH in five different size ranges pores. (a) Pore volume (PV) contribution rate of five different size classes pores; (b) specific surface area (SSA) contribution rate of five different size classes pores.
Minerals 10 00377 g007
Figure 8. Representative pore size of different hysteresis loop types tight sandstone: (a1)–(a3) dV/dW vs. PW, (b1)–(b3) Incremental VBJH vs. PW.
Minerals 10 00377 g008
Figure 9. Representative plots of ln(V) vs. ln[ln(P0/P)] reconstructed from the N2 adsorption analysis of different class tight sandstone samples.
Minerals 10 00377 g009
Figure 10. Field emission scanning electron microscopy (FE-SEM) images of different pore types. (a) Intergranular pores; (b) intragranular pores; (c) intercrystalline micropores of chlorite; (d) intercrystalline micropores of kaolinite; (e) intercrystalline micropores of illite; (f) intercrystalline micropores of illite/smectite.
Minerals 10 00377 g010
Figure 11. The effect of mineral content on fractal dimensions. (a) The relationship between quartz content and DN0; (b) the relationship between quartz content and DN2; (c) the relationship between total clay content and DN0; (d) the relationship between total clay content and DN7; (e) the relationship between illite/smectite and illite with DN7; (f) the relationship between chlorite and kaolinite with DN7.
Minerals 10 00377 g011
Figure 12. The relationship between pore structure parameter and Fractal dimensions in the order of clay mineral content increasing. (a) The relationship between SBET and fractal dimensions; (b) the relationship between PV and fractal dimensions.
Minerals 10 00377 g012
Figure 13. The relationship between Sr and DN. (a) The relationship between Sr of mesopore-II and DN8; (b) the relationship between Sr of macropore-II and DN1.
Minerals 10 00377 g013
Figure 14. The trends of fractal dimension among different tight sandstone samples.
Minerals 10 00377 g014
Figure 15. Different types of fractal dimension numerical distribution range in different tight sandstone.
Minerals 10 00377 g015
Table 1. Mineral composition based on X-ray diffraction (X-RD) analysis of the eighth member of the Middle Permian Lower Shihezi Formation (He 8 Member) tight sandstone.
Sample IDMineral Composition (%)Clay Composition (%)
QFCClayI/SIKC
SU-190.60.24.25575731
SU-293.60.2 6.215121162
SU-393.30.20.46.121153826
SU-489.50.23.86.53134836
SU-687.80.4110.810132255
SU-788.20.2 11.6 61777
SU-949.60.433.516.528162333
SU-1067.21.5 31.337271719
SU-1373.60.21.125.111163538
SU-1484.70.50.614.214142745
SU-1578.80.6 20.624131845
Average81.50.46.414.016.813.828.542.5
Note: Q—quartz; F—feldspar; Ca—calcite; I/S—Illite/Smectite; I—Illite; K—kaolinite; C—chlorite.
Table 2. Results of pores surface area, volume and pore width by N2 adsorption/desorption experiment of He 8 Member tight sandstone.
Sample IDAM (cm3/g)Specific Surface Area (m2/g)Pore Volume
(×10–3 cm3/g)
Pore Width (nm)ClassficationHysteresis Loop Type
SBETSBJHVBJHVSFWTWBJH_aveWBJH_medWSF_med
SU-11.9500.5971.0143.2910.25020.21212.9832.0401.835CH3
SU-22.1000.5480.9443.5030.24723.72614.8402.0351.967CH3
SU-32.1660.5300.9253.5930.22025.27115.5473.5091.728CH3
SU-42.2170.5941.0443.7250.33423.10414.2712.8011.718CH3
SU-63.1480.6971.1245.1670.28827.93118.3792.8141.727BH1
SU-73.6520.6831.1885.9870.32633.09420.1512.0331.728BH1
SU-94.5122.0121.9327.0430.74613.87714.5833.9761.108BH2
SU-105.2793.1622.8628.1471.19810.32911.3872.0991.067BH2
SU-138.2613.0383.85813.3791.05516.82313.8722.8191.071AH2
SU-148.2661.1121.51913.1980.51845.98934.7622.0621.728AH1
SU-158.8313.7724.36813.4041.27213.68612.2752.4981.104AH2
Note: AM–N2 Maximal absorbed amount; SBET—BET SSA; SBJH—BJH Adsorption cumulative SSA; VBJH—BJH Adsorption cumulative PV; VSF—SF Micropore PV; WT—Total adsorption average pore width; WBJH_ave—BJH Adsorption average pore width; WBJH_med—BJH Adsorption median pore width; WSF_med—SF Median pore width; A—Class A; B—Class B; C—Class C.
Table 3. Slop (k) and root mean square error (R2) obtained from the plot of ln(V) vs. ln[(P0/P)].
Sample IDRegion: 0.01 < P/P0 ≤ 0.99Pore size:
W > 10nm
Pore size:
2 nm < W ≤ 10 nm
Pore size:
W < 2nm
Pore size:
W > 5nm
Pore size:
W ≤ 5nm
Region 1:
P/P0 > 0.8
Region 2: 0.5 < P/P0 ≤ 0.8Region 3: P/P0 ≤ 0.5
k0R02k1R12k2R22k3R32k4R42k5R52k6R62k7R72k8R82
SU-1–0.6240.959–0.4080.999–0.8050.989–0.6250.928–0.4480.992–0.8930.982–0.4080.999–0.6580.994–0.8880.978
SU-2–0.6160.971–0.4410.996–0.7910.992–0.6870.979–0.4730.993–0.8440.992–0.4320.996–0.6280.992–0.8440.990
SU-3–0.6180.965–0.4250.990–0.8030.991–0.7410.969–0.4640.991–0.8950.993–0.4250.990–0.6560.998–0.8920.991
SU-4–0.6400.965–0.4200.999–0.8320.993–0.5110.972–0.4690.990–0.8600.980–0.4200.999–0.7000.996–0.8510.975
SU-6–0.5910.962–0.4310.994–0.8070.994–0.7620.971–0.4450.995–0.8950.994–0.4350.993–0.6890.997–0.8970.993
SU-8–0.6140.965–0.4670.985–0.7930.990–0.7860.962–0.4720.993–0.9370.991–0.4670.985–0.6430.996–0.9420.989
SU-9–0.4560.995–0.3910.991–0.4871.000–0.5271.000–0.4150.993–0.5060.998–0.3800.991–0.4730.999–0.5060.997
SU-10–0.4080.982–0.3160.978–0.4610.995–0.5250.973–0.3400.986–0.5250.996–0.3050.974–0.4021.000–0.5280.996
SU-13–0.4830.972–0.3350.985–0.6020.993–0.5660.992–0.3790.958–0.6110.997–0.3180.929–0.5050.999–0.6100.996
SU-14–0.5480.994–0.5000.977–0.6270.999–0.4000.949–0.5190.987–0.5380.980–0.4930.972–0.5831.000–0.5240.978
SU-15–0.4980.963–0.2930.931–0.5420.994–0.6690.970–0.3470.959–0.6510.993–0.2930.931–0.4711.000–0.6510.993
Minimum–0.6400.959–0.5000.931–0.8320.989–0.7860.928–0.5190.958–0.9370.980–0.4930.929–0.7000.992–0.9420.975
Maximum–0.4080.995–0.2930.999–0.4611.000–0.4001.000–0.3400.995–0.5060.998–0.2930.999–0.4021.000–0.5060.997
Average–0.5540.972–0.4030.984–0.6860.994–0.6180.970–0.4340.985–0.7410.990–0.3980.978–0.5830.997–0.7390.989
Table 4. Fractal dimensions from N2 adsorption data of different class He 8 Member tight sandstone samples.
Sample IDHysteresis Loop TypesDN0DN1DN2DN3DN4DN5DN6DN7DN8
SU-1H32.3762.5922.1952.3752.5522.1072.5922.3422.112
SU-2H32.3842.5592.2092.3132.5272.1562.5682.3722.156
SU-3H32.3822.5752.1972.2592.5362.1052.5752.3442.108
SU-4H32.3602.5802.1682.4902.5312.1402.5802.3002.150
SU-6H12.4092.5692.1932.2382.5552.1052.5652.3112.103
SU-7H12.3862.5332.2072.2152.5282.0632.5332.3572.058
SU-14H12.4522.5002.3742.6002.4812.4622.5072.4172.476
SU-9H22.5442.6092.5132.4732.5852.4942.6202.5272.494
SU-10H22.5922.6852.5392.4752.6602.4752.6952.5982.472
SU-13H22.5172.6652.3982.4342.6212.3892.6822.4962.390
SU-15H22.5022.7072.4582.3312.6532.3492.7072.5292.349
Minimum2.3602.5002.1682.2152.4812.0632.5072.3002.058
Maximum2.5922.7072.5392.6002.6602.4942.7072.5982.494
Average2.4462.5972.3142.3822.5662.2592.6022.4172.261