Abstract
The red variety of corundum owes its color and strong fluorescence to the presence of Cr, as well as traces of Fe. The latter can reduce the fluorescence and thus impact the appearance of the final gem. Gem quality rubies are rarely available for scientific study and even less common in their rough form. Opaque inclusions in rubies are often removed during faceting and remain unidentified. This study aims to identify opaque inclusions in rubies from the two most common origins seen in the high end market today: Mogok, Myanmar and Montepuez, Mozambique. Using electron probe microanalaysis (EPMA) the inclusions were identified as sphalerite and pyrrhotite in Mogok rubies. The paragenesis of Myanmar, marble-related rubies is fairly well understood and no Fe-rich minerals apart from sulfides have been identified. Opaque inclusions in Mozambican rubies are a complex mix of Fe-Cu-Ni sulfides with exsolution textures. These inclusions are interpreted to be small amounts of sulfide melt trapped during corundum formation. The different sulfide phases crystallized from this entrapped melt and some phases experienced later exsolution during cooling. The formation of amphibole-related, Mozambican rubies is not well understood, but it is obvious that very different processes are at work compared to the marble-related Myanmar ruby deposits.
1. Introduction
Ruby has always been one of the most desired gemstones. Historically, the finest rubies were found in deposits throughout Central and South-East Asia [1]. In the last decades, many ruby deposits have been found in East Africa, introducing a slightly different type of ruby to the market that originated from geologically different deposits [2,3,4,5,6,7,8,9,10,11,12,13,14].
Marble-related rubies, such as the Myanmar stones, are famous for being extremely fluorescent and having very low Fe concentrations [15]. Amphibole-related rubies, like the Mozambican stones, show more variable fluorescence, ranging from almost none to intensities that nearly match marble-related stones [7]. The red gem variety of corundum owes its color and fluorescence to trace amounts of Cr. Some rubies from Mogok have a considerable V content that can modify the color to be more purple [16]. The presence of Fe lowers the fluorescence of the ruby.
Inclusion studies are a critical part of gemological research, because included crystals are easy to observe and describe in transparent minerals. The only required equipment to see them is a gemological microscope and adequate lighting tools. Gemologists rely heavily on inclusions to determine treatments and geographic origin of gem quality corundum [17,18,19]. However, in most cases their studies are limited to visual observation. Since most gemstones have a high value, destructive analysis is rarely an option. This means that the chemical analysis of inclusions is only possible when they reach the polished surface of the gem. Spectroscopic techniques such as FTIR and Raman spectroscopy offer a solution, with Raman spectroscopy being the most ideal candidate to identify crystal inclusions [20]. For most common inclusions in finished gemstones, this is sufficient. In many cases, these crystals are transparent/translucent carbonate, phosphate, oxide or silicate minerals [1,21].
In the case of rough rubies, an additional type of inclusion can be frequently seen. These are dark, opaque, inclusions with a metallic luster. These dark colored inclusions are rarely retained in the facetted gems, because their high contrast with the transparent red bodycolor creates eye visible distractions that lower the value significantly.
On top of that, they react poorly to heat treatment [2,17,18]. Heating rubies is a standard practice in the gem trade to improve the color or clarity of the gemstone. These metallic inclusions often expand during this process. Expansion fractures commonly surround the crystal, often filled with black opaque residue, making the inclusion even more visible and distracting. Thus, facetters aim to remove these inclusions before polishing the gem.
The goals of this study are to identify these opaque inclusions and assess how their presence may explain the differences in trace element chromophores and visual appearance between the Myanmar and Mozambique rubies. Given the affinity for S to bind with Fe and create sulfides, the presence of S during corundum formation may potentially be an important factor for the final fluorescence and appearance of the gem. The formation of amphibole related rubies is not fully understood. An analysis of the opaque sulfide inclusion could provide additional insight in the environment that allowed the formation of amphibole-related rubies.
2. Materials and Methods
2.1. Materials
For this study, rubies from Mogok, Myanmar and Montepuez, Mozambique were used (Table 1). These sources were chosen because they represent the majority of high-end rubies seen in the gem trade nowadays. Mogok, Myanmar is the most coveted ruby source in the world, due to its long history and the fabled gemstones that were sourced from its mines [1]. Montepuez Mozambique on the other hand is a very new source where rubies were only discovered in 2009, but its large volumes and high quality quickly made it the dominant supplier for the global ruby trade [2].

Table 1.
Samples used during this study.
All samples are part of GIA’s (Gemological Institute of America) Colored Stone Reference Collection (GIA CSRC) which consists of samples collected during GIA Field expeditions to gemstone mining locations around the world [22]. The selected samples were prepared and documented at GIA’s laboratory in Bangkok, Thailand.
Every ruby selected contained opaque, mineral inclusions with metallic luster. In one case, the opaque mineral is not present as an inclusion. This sample (A6), from the Baw Lon Gyi mining area in Mogok, Myanmar, has an opaque mineral in the matrix attached to the ruby, rather than as an inclusion.
2.2. Methods
2.2.1. Photomicrography
Photomicrographs of internal features were captured at different magnifications with Nikon SMZ 18 and Nikon SMZ 1500 systems (Nikon, Tokyo, Japan), using darkfield, brightfield, diffused, and oblique illumination, together with a fiber-optic light source when necessary. It should be noted that the microscope magnification power was taken into consideration when calculating the field of view (FOV) information in the captions.
2.2.2. Inclusion Analysis
Backscattered electron (BSE) images were obtained using a ZEISS 1550VP field emission SEM (ZEISS, Oberkochen, Germany) and a JEOL 8200 electron microprobe (JEOL, Tokyo, Japan) with AsB (angle selective backscatter) and solid-state BSE detectors, respectively. Quantitative elemental microanalyses were carried out using the JEOL 8200 electron microprobe, operated at 10 kV (for smaller interaction volume) and 5 nA in focused beam mode. Analyses were processed with the CITZAF correction procedure [23] using the Probe for electron probe microanalaysis (EPMA) software from Probe Software, Inc. (Eugene, OR, USA).
The EPMA analysis was set up to measure 8 selected elements: S, As, Cu, Fe, Ni, Zn, Pb and Co. Analysis was calibrated using the following standards (Table 2).
Table 2.
Details of the standards used during electron probe microanalaysis (EPMA) analysis.
EPMA and BSE analysis were performed at the Geological and Planetary Science Division Analytical Facility at Caltech in Pasadena, California.
3. Geological Setting
Corundum only forms in natural environments that are depleted in Si. At high concentrations of silicon, Al will preferentially be incorporated in other minerals such as micas or feldspars. Consequently, corundum is often associated with Si-free carbonates or silicate minerals, with a relatively high Al/Si ratio such as plagioclase, amphibole or pyroxene [24]. For the formation of the ruby, it is necessary to incorporate trace amounts of Cr to act as a chromophore, as well as the right thermobarometric conditions to allow the growth of large crystals.
3.1. Geologogical Setting and Formation of Mogok Rubies
The Mogok Stone Tract, the source of many fine gems, is located in the northern part of the Mogok Metamorphic Belt. This metamorphic belt crosses Myanmar from north to south and forms the western margin of the Shan-Thai block [25,26,27]. The Mogok area is dominated by amphibolite to granulite facies marbles and paragneisses, as well as a variety of intrusive rocks and derived orthogneisses [28,29]. Recent data show a spatial relation between the gem corundum formation and intrusions, although the exact timing and the impact of the intrusive rocks on gem formation are not yet fully understood. It is suggested that Jurassic intrusions and associated alterations of the host rock were affected by regional granulite facies metamorphism related to the Himalayan Orogeny, lasting from 68–21 Ma. During this metamorphism, rubies and sapphires were formed in the marbles and metaskarns [30].
The rubies formed in metamorphosed carbonate platforms that contained some contamination of clays, organic material and evaporites (e.g., anhydrite and salts). The clays provided the necessary elements to build ruby (Al and Cr), while the molten salts allow these usually immobile elements to migrate through the marble. The molten salts and fluids associated with ruby formation are derived from the protolith and are also enriched in carbonate, sulfur and Al [31,32].
This results in layers of fairly pure marble with large, well-crystallized calcite interlayered, with silicate layers often containing amphiboles and micas [33]. Ruby crystals occur disseminated in the marble and are associated with accessory phlogopite, muscovite, scapolite, spinel, titanite, pyrite and graphite [34].
Throughout Central and Southeast Asia, several marble related deposits are found that are related to the Cenozoic Indo-Asian collision and share a similar formation history [35]. This includes Luc Yen, Vietnam; Murghab, Tajikistan; Hunza, Pakistan; Mong Hsu, Myanmar; Jegdalek, Afghanistan; etc. [32].
The Myanmar rubies from the Mogok valley are mined from hard rock deposits in the marbles, or from secondary mines inside karst features or alluvial deposits.
3.2. Geological Setting and Formation of Mozambican Rubies
Mozambican rubies are found in the Southern part of the Neoproterozoic Mozambique belt, which is closely linked with the Pan African orogeny [6,7,8,36]. This suture zone represents the collision between east and West Gondwana [37,38].
The geology of Mozambican rubies is not well understood. The deposit was only discovered in 2009 and most of the rubies come from secondary deposits. The primary deposits in the area are so weathered that they are barely recognizable.
The ruby-bearing rocks are amphibolites hosted in the Montepuez nappe of the Cabo Delgado complex [39]. The Montepuez complex is made up of orthogneiss (granitic to amphibolitic composition) and paragneiss (quartzite, meta-arkose, biotite gneiss and amphibole gneiss,) [40].
There is some evidence of intrusions seen in the Montepuez area in the form of pegmatites and granitic intrusions [7,40].
The rubies are closely related to the bodies with an amphibolite-rich composition, although they are extremely weathered [8]. To date, there is only one study published that describes the petrography of Mozambican ruby host rocks. They contain significant amounts of plagioclase and calcic amphibole next to spinel and corundum, although the silicates are often weathered to clays and micas [41]. Whole-rock geochemical analysis shows that the rocks have a composition similar to picrobasalt in the TAS diagram [41,42]. While this classification is traditionally used for magmatic rocks, it is not yet proven that the protolith of the Mozambican ruby host rock is of magmatic origin. However, the geochemical analysis is at least suggestive that it is derived from a basaltic magma [41].
At the moment, the genesis of Mozambican ruby and amphibole-related ruby is not fully understood. The current model states that amphibole and corundum formed during peak metamorphism, which reacted to plagioclase and spinel during retrograde metamorphism. According to P-T calculation based on a combination of mineral isopleths, pseudosections and geothermometers, the rubies formed at temperatures around 550–600 °C and pressures around 10.5–11 kbar [41]. These conditions place ruby formation in the amphibolite facies at high pressure and lower temperature. Terrain observations and geological surveys have shown the presence of migmatites and other features that partial melting took place in the amphibolites and gneisses [40,41].
4. Inclusion Analysis
4.1. Literature Studies
The most commonly used reference works for gemological inclusion studies describe nearly all opaque inclusions in marble-related ruby as pyrrhotite and pyrite [21,43]. The first main study on Mozambican rubies identifies them as chalcopyrite [7]. Nowadays, they are often described based on appearance as pyrite or chalcopyrite, for Myanmar and Mozambique respectively. Inclusions in gemstones are usually well described in the gemological literature. Characteristics such as color, transparency and shape are easy to observe and often allow for preliminary identification. Raman spectroscopy is often used to further identify the crystal inclusions, but this is not always conclusive. More advanced techniques are rarely employed by gemologists. Most of the gemstone inclusion knowledge stems from the three volume Photo-Atlas series, which documents and describes the internal world of gemstones [21]. The following is a list of crystal inclusions documented in rubies from Mogok, Myanmar.
- Zircon, spinel, rutile prisms, mica, garnet, corundum [44]
- Sphene (titanite), calcite [45]
- Apatite, olivine, pargasite, sphalerite [46]
- Dolomite, pyrrhotite, pyrite [21]
- Sulfur [47]
- Scapolite, graphite [48]
- Vesuvianite [49]
The deposits around Montepuez, Mozambique were only recently discovered and there is not as much information is available [6,7]. In literature, the following inclusions have been described.
- 8.
- Amphibole and muscovite [7,39,50]
- 9.
- Chalcopyrite [2,7]
- 10.
- Orange, irregular masses identified as chromite [7]
However, based on the authors’ experience, several additional, less common inclusions like tourmaline, feldspar, zicorn and anhydrite also occur in rubies from this deposit.
This study focusses on the black opaque inclusions that are found in many rough rubies, which are typically described as pyrrhotite/pyrite and chalcopyrite, for Myanmar and Mozambique respectively.
4.2. Analytical Results
4.2.1. Imaging and Description
All studied inclusions are opaque and have a metallic luster. The apparent color of the inclusions varies from black to red, which are colors not typically associated with most common crystallized metallic minerals. This is because they are found as inclusions within a bright red ruby matrix, where the color of the host mineral obscures the color of the actual inclusion.
Most of the crystals in the Myanmar rubies have sharp angles and well-formed surfaces (A1, A2, A4, A5), while sample A2 shows a very clear step pattern on its surface (Figure 1). Sample A4 has a clear (pseudo?-) hexagonal outline. None of these samples are associated with fractures or show any evidence that they could be secondary.
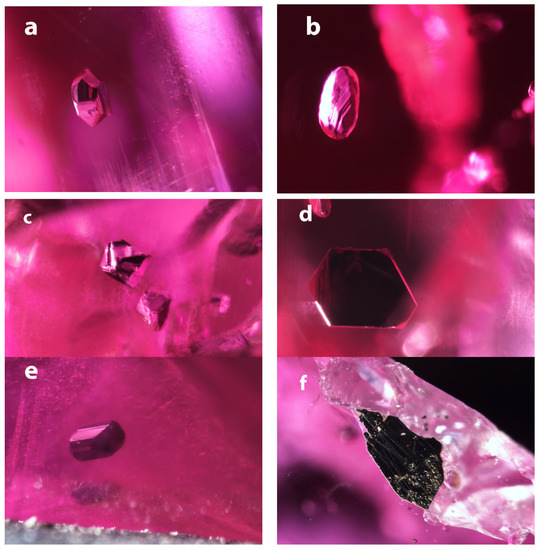
Figure 1.
Images of the inclusions in the Mogok rubies. (a) Opaque inclusion in A1, showing well-formed crystal faces. FOV: 1.2 mm; (b) Opaque inclusion in A2 has more rounded appearance due to the terraced angular features. FOV: 1.01 mm; (c) Opaque inclusions in A3 exhibit almost a bipyramidal shape reminiscent of a cubic crystal structure. FOV: 1.2 mm; (d) Opaque inclusion in A3 has a very flat, (pseudo?) hexagonal outline. FOV: 0.85 mm; (e) Opaque inclusion in A5 shows well developed crystal faces and a slightly elongated blocky crystal shape. FOV: 0.85 mm; (f) The opaque minerals associated with sample A6 are an irregular mass, attached to the ruby and surrounded by carbonates. FOV: 1.44 mm.
The inclusions in Mozambican rubies are very similar in color and luster to the Myanmar ones (Figure 2). Their outlines are more spherical but still exhibit flat crystal faces, indicating that all of these crystals are primary inclusions. Sample B1 is associated with a fracture, but this does not extend to the exterior of the stone.
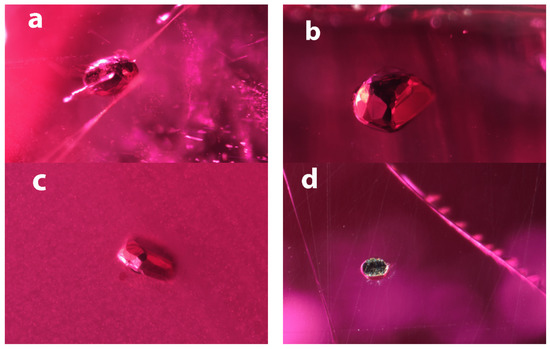
Figure 2.
Inclusions in Mozambican rubies. (a) The inclusion in sample B1 is more egg shaped, but shows many small flat crystal faces. It is surrounded by a fracture that is reminiscent of an expansion fracture, which might be an indication of a temperature increase during its geological history after the corundum formed. FOV: 1.50 mm;( b) The opaque inclusion in sample B2 show many larger crystal faces that do not seem regularly distributed. The overall appearance is rather spherical. FOV: 0.78 mm; (c) The inclusions in sample B3 are similar to B2 but appears flatter. FOV: 1.2 mm; (d) The inclusion in sample B4 was cut through during sample fabrication and shows the brassy color around the edges. FOV: 0.72 mm.
We also checked a number of samples from GIA’s CSRC, to see how abundant those inclusions are. In 54 rough samples from Mogok, we found 46 samples that contained at least one metallic opaque inclusion. In Mozambican rubies, metallic inclusions are much less common, with only 37 out of 109 Mozambican rubies showing this type of inclusion.
4.2.2. BSE Imaging
Back-scattered electron imaging shows that the inclusions in Mogok rubies are mainly single phases (Figure 3). Polish lines and pits were caused by the sample preparation process. Some samples show fractures that were already present, but might have been enlarged during polishing. In some cases, the inclusion is not entirely preserved and some parts were removed during the fabrication process. One sample (A4) shows some obvious zoning with a darker area, showing a herringbone texture. The sample with the sulfide located in the attached matrix (Figure 3f) shows a subtle transition between phases.
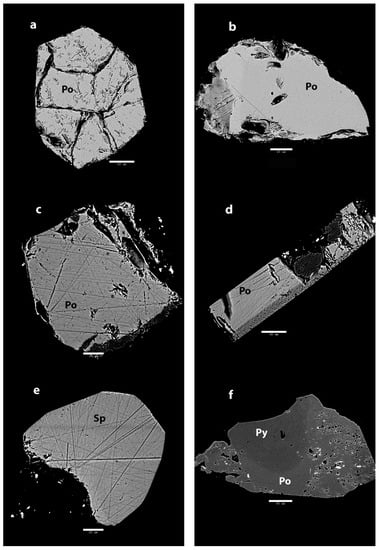
Figure 3.
BSE images of Mogok rubies. (a) Inside sample A1, the inclusion shows hexagonal outline and large internal cracks. Scale bar: 50 µm; (b) The inclusion in sample A2 shows an irregular outline with a homogenous interior. Scale bar: 60 µm; (c) The inclusion in sample A3 shows straight outline with numerous polish lines. Scale bar: 20 µm; (d) Sample A4 also shows a lot of polish lines, but most notable is the herringbone texture on the side. Scale bar: 30 µm; (e) The inclusion in sample A5 has a well-defined outline on the top right. The bottom left has been removed during polishing. Apart from polishing lines, this inclusion appears very homogenous. Scale bar: 20 µm; (f) The opaque minerals attached to sample A6 show many pits but most important is the subtle zoning in the central part. The ruby is attached to the lower part. Scale bar: 90 µm.
The Mozambican ruby inclusions show much more complex features (Figure 4). All samples have clearly separated phases. Sample B1 shows three clearly separated phases based on the intensity in BSE images. They are sometimes separated by fractures at the phase contact. In samples B1 and B2, the darkest phase also shows clear exsolution textures. The exsolution pattern in sample B2 is more expressed than it is in sample B1. The homogenous phases without exsolution patterns are also smaller and confined to the fringes of the inclusion. Samples B3 and B4 lack any obvious exsolution patterns, but still show very clear phase separations.
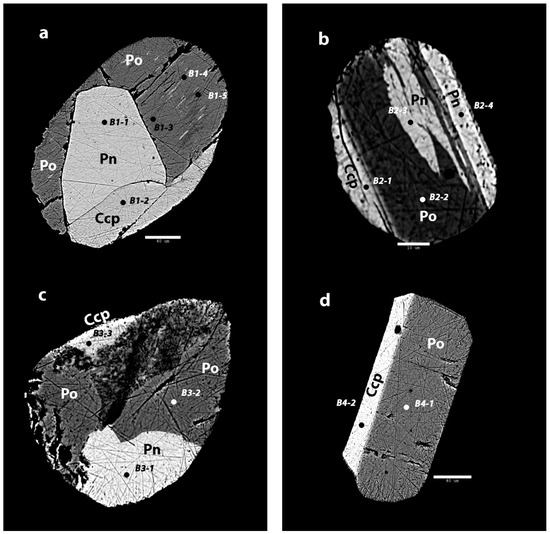
Figure 4.
Back scattered electron images of the sulfide inclusions in Mozambican ruby. (a) The inclusion in sample B1 shows three main phases, of which one has various exsolutions. Scale bar: 40 µm; (b) In sample B2, there are three phases with two phases that show exsolution patterns. Scale bar: 10 µm; (c) In sample B3, there are three distinct phases. The darker phase shows deeper polish lines and large pits, which might indicate a more unstable mineral. Scale bar: 20 µm; (d) B4 shows two clearly separated phases without any exsolution textures. Scale bar: 40 µm.
4.2.3. EPMA Analysis
During the EPMA analysis, eight selected elements were quantified (Table 3 and Table 4). All of the inclusions turned out to be sulfides, which is consistent with the previous work [7,21]. Most of the analyses resulted in an elemental total of 97–98% for the inclusions in Mogok rubies. The missing percentages are most likely explained by surface oxidation of the samples. However, it cannot be excluded that an element was not measured during our analysis, which was limited to eight elements. Notably, in sample A4, the elemental total measured in the section with the herringbone pattern was significantly lower.
Table 3.
EPMA results: Elemental percentages and the elemental totals.
Table 4.
Molar percentages normalized to sulfur.
In the case of the Mozambican ruby inclusions, there was a larger spread in elemental totals. The minerals that are dominated by Fe-Ni-S have elemental totals between 97% and 98%, which is comparable to the numbers seen for the Mogok rubies. Samples with significant Cu content have lower elemental totals (95–97%), which could be explained by a more intense alteration or a minor element that is missing.
From the eight elements that were quantified, only five were found to be major elements in the minerals. In every sample, the Co and Pb content is low enough to consider them trace elements. Arsenic was not detected in any of the samples.
The analysis shows the presence of pyrrhotite Fe(0.88)S and sphalerite (Zn0.8, Fe0.18)S in the Mogok rubies (Table 4). Additionally, in the matrix sample, pyrrhotite Fe(0.88)S and pyrite FeS2 are found together.
The inclusions in Mozambican samples are more complex. They show three main mineral components: chalcopyrite, pentlandite and pyrrhotite. These are well separated and do not show any mixing. The darker pyrrhotite phase often shows different flame-like exsolution patterns. The exsolved minerals consist of Fe-Ni sulfides and pyrrhotite, with slightly elevated Fe contents.
5. Discussion
Based on the EPMA analyses, it is clear that the inclusions in Mozambican rubies have not been correctly identified by previous methods. Originally described as pyrite and chalcopyrite in Mogok and Mozambican rubies respectively, they were now identified as pyrrhotite and Fe-Ni-Cu-sulfides.
Pyrrhotite has a very narrow stability field at surface conditions, but is the most stable iron-sulfide at higher temperatures (>743 °C). Fluid inclusion studies of marble-related ruby deposits in Central Asia and northern Vietnam provide formation temperatures between 620 and 670 °C, with pressures between 2.6 and 3.3 kbar [32].
Various studies have been done to determine P-T conditions of gneisses in the Mogok Metamorphic Belt, which stretches more than 1000km and has shown a range of temperatures from 625 to 950 °C [51,52]. For the Mogok deposit, there are no temperature estimates available for the marbles. However, various studies have determined the formation temperatures of the gneisses in the Mogok stone tract and these yielded significantly higher temperatures. Formation temperatures of quartz-dominated gneisses are reported to be 750–790°C [53]. However, it is important to note that the prevalent genetic model for marble-hosted rubies places the ruby formation in the retrograde path [32]. These temperatures are significantly higher than the formation conditions of other marble related deposits and most likely represent peak conditions of the host rock, which was reached before ruby formation. Under the higher peak conditions, pyrrhotite is stable, making it the most likely Fe-S mineral that would later be incorporated as a protogenetic inclusion in the ruby [32].
The presence of sphalerite has been previously documented, but it is described as a more transparent phase [46]. It is a common mineral and frequently encountered during low grade metamorphism of sedimentary rocks. The observed sphalerite inclusion most likely formed during metamorphism of the platform carbonates and their associated clay sediments, although it cannot be excluded that it formed from external hydrothermal fluids.
The EPMA analysis of the herringbone structure in sample A4 only totals 86.01%. The most likely explanation is that this patterned zone consists of a different mineral or an intergrowth of different minerals. Our analysis was set up to quantify eight elements that are commonly found in sulfides, but it is possible that this zone incorporates elements that we did not analyze. Although a different mineral is the most likely explanation, alteration due to the fabrication process cannot be excluded until this inclusion is further analyzed.
The paragenesis of Mogok rubies is pretty well understood and it is interesting to note that the only mineral that incorporates Fe, are these sulfides. Thus, the presence of sulfur might be an important factor for the formation of low-Fe, and thus, more fluorescent rubies. Marble-related ruby forming systems have a significant amount of evaporites, including sulfates. During increasing metamorphism, these sulfates will reduce, due to reactions with organic matter [54]. This reaction provides an ample supply of reduced, reactive sulfur to react with all Fe and form Fe-sulfides before corundum forms. The presence of S-rich fluid inclusions and native sulfur found in marble related ruby inclusions supports this model [31,55,56]. The same model could also explain the extreme fluorescence witnessed in red/pink spinel from marble related deposits. Gem spinel shares a very similar formation model with ruby in marbles, apart from the fact that it has a significant Mg component and most likely formed at slightly different P-T conditions [34,57,58]. A similar mechanism where sulfur is responsible for Fe removal during formation of high quality gemstones has been proposed for the Colombian emeralds [59]. It seems that, in both situations, the reaction of sulfates with organic matter provided sufficient reduced sulfur to trap much of the Fe present in the system in sulfide phases [59]. This results in Fe-poor, Cr-rich emeralds and rubies, creating a strong color and fluorescence. While this mechanism is similar between these deposits, the rest of the geological conditions are very different.
Although the inclusions in Mozambican amphibole-related rubies are visually very similar to the ones from Mogok’s marble-related rubies, they are chemically very different. This was expected, given that their geological history and host rocks are very different.
The composition of the inclusions in Mozambican rubies strongly resembles a sulfide melt trapped during formation. The texture of these inclusions is suggestive of phases crystallizing from a melt individually, rather than exsolving from one originally homogeneous inclusion [60]. For instance, certain crystallized phases in these inclusions do show very obvious exsolution textures (Figure 4a,b), which are distinctly different from the overall textural relationships observed between the main sulfide phases. Such sulfide melts can form at higher temperatures, precipitating multiple sulfide phases upon cooling [61,62]. The overall consistency of these inclusions between the different samples indicates that they formed as a separate and homogeneous phase, possibly a partial sulfide melt, and were later incorporated in the ruby. The rounded shape of the inclusions is also more suggestive of a molten phase. Conversely, in Mogok rubies, the more regular, almost euhedral, outlines suggest that these inclusions were trapped as solid crystals.
During cooling, the individual components in such a sulfide melt would have separated and crystallized into the different phases (chalcopyrite, pentlandite, pyrrhotite). The creation of sulfide melts through partial melting has been documented at temperatures as low as 300 °C, but this applies only to a limited amount of sulfide minerals, often with considerable amounts of As [62]. The most common Fe-Ni-Cu sulfide system in nature consists of chalcopyrite and monosulfide solid-solution (FeS-NiS). Early experimental work suggested that significant quantities of melt are produced only at around 850 °C [63]. However, some experiments have shown that first melting may initiate at about 760 °C in this system [64,65]. The mineralogy of sulfide crystallization in these references is consistent with that seen in the Mozambican ruby inclusions with chalcopyrite and Fe-Ni sulfides, that have completely separated from what could have been a single homogeneous partial melt at high temperature. The flame-like patterns observed also suggests exsolution of the Fe-Ni sulfide phase during cooling, that formed the patterns seen now. The main potential concern with this hypothesis is that the melting temperatures of this system are significantly higher than the 550–650 °C reported for the ruby host rock in previous studies [41,66]. However, these pressure-temperature calculations should be approached with some caution. These PT estimates are based on models that assume equilibrium between various phases found associated with corundum in the Mozambique deposit. However, the Mozambican ruby host rock is extensively weathered and in most cases completely reduced to clay and sedimentary detritus. It is often hard to say if the minerals that are seen in thin sections, and used in geothermobarometry, are actually related to the ruby formation. For instance, it is possible (if not likely) that the kyanite and Fe-carbonate used to determine a temperature of 650 °C and pressure of 9.5 kbar, are alteration products formed during retrograde metamorphism and/or interaction with fluids rich in Si and carbonates [66]. The same applies to the stability field used to estimate a temperature estimate of 550–600 °C, based on a plagioclase-garnet-diopside-pargasite-clinochlore-quartz-corundum assemblage [41], especially as clinochlore is a common alteration product when amphibole weathers. It would be highly unlikely that these minerals all formed together, especially quartz and corundum, which cannot coexist under ordinary geological conditions. The presence of an inclusion derived from partial sulfide melt rich in Ni-Cu-S, as we have proposed here, would suggest that reported formation temperatures of around 550–600 °C are underestimated.
Given that the data on Mozambican ruby is limited, the data on other amphibole related deposits in East-Africa can provide limited insight. The ruby deposit in Winza, Tanzania has reported P-T conditoons of 750–850 °C and 9.5–12 kbar [67]. Similar conditions are reported for Vohibory, Madagascar, although the temperature range is narrower at 750–800 °C, with pressure of 9–11.5kbar [68]. While these conditions are not directly related to the Mozambican ruby deposit, they can provide an indication for the formation of amphibole-related rubies in East Africa. These temperatures are more in line with the likely temperatures for the formation of a partial sulfide melt. The effect of various parameters, such as water content, oxygen fugacity, sulfur fugacity, the involvement of other minerals and the potential for lowering the initial melting temperature of a free sulfide melt by addition of other sulfide components, are not well understood and could potentially have a significant impact on formation conditions of these potential sulfide melt inclusions [62]. It has to be noted that these conditions are unknown in most ruby forming systems.
In Mogok, the presence of abundant sulfur allows for the formation of low-Fe ruby, because much of the Fe is locked in pyrrhotite. The sulfide inclusions in Mozambican rubies are more complex, as is their associated mineral assemblage. Although it is not well studied, many of the observed minerals contain a significant Fe component, which indicates that the Fe-balance in the amphibole-related ruby forming system has more controlling factors than those in marble-related systems. In the Mozambican rubies, with Fe-Cu-Ni sulfides, it is clear that simply an availability of abundant sulfur is not the controlling factor for the Fe concentration in rubies.
This is reflected in the wider variety of iron contents seen in rubies from Montepuez, which ranges from 414 to 4000 ppmw [2,6]. This variability in Fe concentrations obviously results in much more variable fluorescence in Mozambican rubies compared to Mogok rubies.
6. Conclusions
Opaque inclusions are common in many rubies forming in different geological environments. The identification of these crystals is usually based on their visual characteristics, which are sometimes misleading. Chemical analysis has shown that the inclusions in Mogok rubies are dominantly homogenous pyrrhotite and with one inclusion identified as sphalerite. Pyrite is found in the marble that hosts these rubies, but was not found as an inclusion. The presence of these sulfides and the presence of abundant sulfur in the marble could be an important geological indicator for strong fluorescent rubies. Fluorescence is deemed an important quality factor in ruby valuation and is quenched by the presence of Fe. In marble hosted ruby deposits, there is abundant sulfur present to trap all iron in sulfide minerals, allowing the formation of low-Fe rubies.
The opaque inclusions in Mozambican rubies from Montepuez look very similar to the ones found in Mogok in the microscope, but they are very different compositionally and mineralogically. Analysis of these stones shows a complex mix of Fe-Cu-Ni-sulfides with clearly separated phases, as well as exsolution patterns. Their compositions and textures are reminiscent of melt inclusions forming from a sulfide partial melt. To form such inclusions, the temperatures should be higher than the reported P-T conditions, meaning that the temperatures reported in literature might be too low. More studies are required to better understand the genesis of these inclusions and its ruby host.
Author Contributions
Conceptualization and methodology, W.V. and A.P.; writing—original draft preparation, W.V.; writing—review and editing, W.V. and A.P. All authors have read and agreed to the published version of the manuscript.
Funding
This research received no external funding.
Acknowledgments
The authors would like to thank Charuwan Khowpong, Sasithorn Engniwat and Suwasan Wongchacree for sample analysis and inclusion photography. We thank Mike Breeding (GIA) for helpful comments on the manuscript. We also thank two anonymous peer reviewers for their help in improving this manuscript. We would also like to thank Lin Sutherland and Khin Zaw for extending the invitation to submit a manuscript to this Special Issue on ruby geology and geochemistry, as well as their editorial input. Chi Ma, director of the GPS analytical facility at Caltech, Pasadena, CA was of great assistance during the setting up of the EPMA analysis.
Conflicts of Interest
The authors declare no conflict of interest.
References
- Hughes, R.W.; Manorotkul, W.; Hughes, E.B. Ruby and Sapphire: A Gemologist’s Guide; Lotus Publishing: Chichester, UK; London, UK, 2017. [Google Scholar]
- Vertriest, W.; Saeseaw, S. A decade of Ruby from Mozambique: A review. Gems Gemol. 2019, 55. [Google Scholar] [CrossRef]
- Pardieu, V. Update on Mozambique ruby mining and trading. Gems Gemol. 2017, 53, 3. [Google Scholar]
- Vertriest, W.; Pardieu, V. Update on gemstone mining in Northern Mozambique. Gems Gemol. 2016, 52, 4. [Google Scholar] [CrossRef]
- Hughes, R.W. Red Rain: Mozambique Ruby Pours into the Market. Available online: http://www.lotusgemology.com/index.php/library/articles/316-red-rain-mozambique-ruby-pours-into-the-market (accessed on 10 February 2020).
- Hsu, T.; Lucas, A.; Pardieu, V. Mozambique: A Ruby Discovery for the 21st Century; GIA: Carlsbad, CA, USA, 2014. [Google Scholar]
- Pardieu, V.; Sangsawong, S.; Muyal, J.; Chauviré, B.; Massi, L.; Sturman, N. Rubies from the Montepuez Area (Mozambique); GIA: Carlsbad, CA, USA, 2013. [Google Scholar]
- Pardieu, V.; Jacquat, S.; Bryl, L.P.; Senoble, J.B. Rubies from northern Mozambique. InColor 2009, 12, 32–36. [Google Scholar]
- Vincent, P.; Rakotosona, N. Ruby and Sapphire Rush Near Didy, Madagascar. Available online: http://www.giathai.net/pdf/Didy_Madagascar_US.pdf (accessed on 22 February 2020).
- Rakontondrazafy, A.F.M.; Giuliani, G.; Ohnenstetter, D.; Fallick, A.E.; Rakotosamizanay, S.; Andriamamonjy, A.; Ralantoarison, T.; Razanatseheno, M.; Offant, Y.; Garnier, V.; et al. Gem corundum deposits of Madagascar: A review. Ore Geol. Rev. 2008, 34, 135–154. [Google Scholar]
- Pardieu, V.; Wise, R.W. Ruby boom town. Colored Stone 2006, 19, 30–33. [Google Scholar]
- Hughes, R.W.; Pardieu, V.; Schorr, D. Sorcerers & Sapphires: A Vsit to Madagascar. Available online: https://lotusgemology.com/index.php/library/articles/161-sorcerers-sapphires-a-visit-to-madagascar (accessed on 22 February 2020).
- Schwarz, D.; Schmetzer, K. Rubies from the Vatomandry area, eastern Madagascar. J. Gemmol. 2001, 27, 409–416. [Google Scholar] [CrossRef]
- Abduriyim, A.; Kitawaki, H. New geological origin: Ruby from Winza of Tanzania. Gemmology 2008, 8, 4–7. [Google Scholar]
- Keller, P.C. The rubies of Burma: A review of the Mogok Stone Tract. Gems Gemol. 1983, 19, 209–219. [Google Scholar] [CrossRef]
- Zaw, K.; Sutherland, L.; Yui, T.-F.; Meffre, S.; Thu, K. Vanadium-rich ruby and sapphire within Mogok Gemfield, Myanmar: Implications for gem color and genesis. Miner. Depos. 2015, 50, 25–39. [Google Scholar] [CrossRef]
- Saeseaw, S.; Kongsomart, B.; Atikarnsakul, U.; Khowpong, C.; Vertriest, W.; Soonthorntantikul, W. Update on “Low-Temperature” Heat Treatment of Mozambican Ruby: A Focus on Inclusions and FTIR Spectroscopy; GIA: Carlsbad, CA, USA, 2018. [Google Scholar]
- Pardieu, V.; Saeseaw, S.; Detroyat, S.; Raynaud, V.; Sangsawong, S.; Bhurisom, T.; Engniwat, S.; Muyal, J. “Low Temperature” Heat Treatment of Mozambique Ruby; GIA: Carlsbad, CA, USA, 2015. [Google Scholar]
- Palke, A.C.; Saeseaw, S.; Renfro, N.D.; Sun, Z.; McClure, S.F. Geographic origin determination of ruby. Gems Gemol. 2019, 55, 580–613. [Google Scholar] [CrossRef]
- Kiefert, L.; Karampelas, S. Use of the Raman spectrometer in gemmological laboratories: Review. Spectrochim. Acta A 2011, 80, 119–124. [Google Scholar] [CrossRef] [PubMed]
- Gübelin, E.J.; Koivula, J.I. Photoatlas of Inclusions in Gemstones; ABC Edition: Zürich, Switzerland, 1986; p. 532. [Google Scholar]
- Vertriest, W.; Palke, A.C.; Renfro, N.D. Field gemology: Building a research collection and understanding the development of gem deposits. Gems Gemol. 2019, 55, 580. [Google Scholar] [CrossRef]
- Armstrong, J.T. CITZAF-A package of correction programs for the quantitative electron microbeam X-ray-analysis of thick polished materials, thin-films and particles. Microbeam Anal. 1995, 4, 177–200. [Google Scholar]
- Garnier, V.; Giuliani, G.; Ohnenstetter, D.; Schwarz, D. Les gisements de corindon: Classification et genèse. Règne Miner. 2004, 55, 7–47. [Google Scholar]
- Iyer, L.A.N. The geology and gem-stones of the Mogok stone tract, Burma. Geol. Surv. India-Mem. 1953, 82, 8–100. [Google Scholar]
- Themelis, T. Gems and Mines of Mogok; Self-published: Bangkok, Thailand, 2008. [Google Scholar]
- Chhibber, H.L. The Geology of Burma; MacMillan and Co.: London, UK, 1934; p. 538. [Google Scholar]
- Thu, Y.K.; Win, M.M.; Enami, M.; Tsuboi, M. Ti–rich biotite in spinel and quartz–bearing paragneiss and related rocks from the Mogok metamorphic belt, central Myanmar. J. Miner. Petrol. Sci. 2016, 111, 270–282. [Google Scholar]
- Thu, K. The Igneous Rocks of the Mogok Stone Tract: Their Distributions, Petrography, Petrochemistry, Sequence, Geochronology and Economic Geology; University of Yangon: Yangon, Myanmar, 2007. [Google Scholar]
- Searle, M.; Garber, J.; Hacker, B.; Htun, K.; Gardiner, N.; Waters, D.; Robb, L. Timing of syenite-charnockite magmatism and ruby and sapphire metamorphism in the mogok valley region, Myanmar. Tectonics 2020, 39, 39. [Google Scholar] [CrossRef]
- Giuliani, G.; Dubessy, J.; Ohnenstetter, D.; Banks, D.; Branquet, Y.; Feneyrol, J.; Fallick, A.E.; Martelat, J.-E. The role of evaporites in the formation of gems during metamorphism of carbonate platforms: A review. Miner. Depos. 2017, 53, 1–20. [Google Scholar] [CrossRef]
- Garnier, V.; Giuliani, G.; Ohnenstetter, D.; Fallick, A.E.; Dubessy, J.; Banks, D.; Hoang, V.Q.; Lhomme, T.; Maluski, H.; Pecher, A.; et al. Marble-hosted ruby deposits from Central and Southeast Asia: Towards a new genetic model. Ore Geol. Rev. 2008, 34, 169–191. [Google Scholar] [CrossRef]
- Kievlenko, E.Y. Geology of Gems; Ocean Pictures Ltd.: Littleton, CO, USA, 2003. [Google Scholar]
- Giuliani, G.; Ohnenstetter, D.; Fallick, A.; Groat, L.; Fagan, A.J. Chapter 2: The geology and genesis of gem corundum deposits. In Geology of Gem Deposits, 2nd ed.; Groat, L., Ed.; Mineralogical Association of Canada: Tucson, AZ, USA, 2014. [Google Scholar]
- Garnier, V.; Maluski, H.; Giuliani, G.; Ohnenstetter, D.; Schwarz, D. Ar-Ar and U-Pb ages of marble-hosted ruby deposits from central and southeast Asia. Can. J. Earth Sci. 2006, 43, 509–532. [Google Scholar] [CrossRef]
- Bingen, B.; Jacobs, J.; Viola, G.; Henderson, I.H.C.; Skar, O.; Boyd, R.; Thomas, R.J.; Solli, A.; Key, R.M.; Daudi, E.X.F. Geochronology of the Precambrian crust in the Mozambique Belt in NE Mozambique, and implications for Gondwana assembly. Precambrian Res. 2009, 170, 231–255. [Google Scholar] [CrossRef]
- Meert, J.G. A synopsis of events related to the assembly of eastern Gondwana. Tectonophysics 2003, 362, 1–40. [Google Scholar] [CrossRef]
- Muhongo, S. Anatomy of the Mozambique Belt of eastern and southern Africa: Evidence from Tanzania. Gondwana Res. 1999, 2, 369–375. [Google Scholar] [CrossRef]
- Pardieu, V.; Thanachakaphad, J.; Jacquat, S.; Senoble, J.B.; Bryl, L.P. Rubies from the Niassa and Cabo Delgado Regions of Northern Mozambique; GIA Laboratory: Carlsbad, CA, USA, 2009; pp. 5–16. [Google Scholar]
- Boyd, R.; Nordgulen, O.; Thomas, B.; Bingen, B.; Bjerkgård, T.; Grenne, T.; Henderson, I.; Melezhik, V.; Sandstad, J.; Solli, A.; et al. The geology and geochemistry of the East African orogen in northeastern Mozambique. S. Afr. J. Geol. 2010, 113, 87–129. [Google Scholar] [CrossRef]
- Fanka, A.; Sutthirat, C. Petrochemistry, mineral chemistry, and pressure–temperature model of corundum-bearing amphibolite from Montepuez, Mozambique. Arab. J. Sci. Eng. 2018, 43, 3751–3767. [Google Scholar] [CrossRef]
- Lebas, M.J.; Lemaitre, R.W.; Streckeisen, A.; Zanettin, B. A chemical classification of volcanic-rocks based on the total alkali silica diagram. J. Petrol. 1986, 27, 745–750. [Google Scholar]
- Gübelin, E.J. On the nature of mineral inclusions in gemstones—Parts 1 and 2. Gems Gemol. 1969, 13, 42–56. [Google Scholar]
- Gübelin, E.J. Inclusions as a Means of Gemstone Identification; GIA: Los Angeles, CA, USA, 1953; p. 220. [Google Scholar]
- Gübelin, E.J. On the nature of mineral inclusions in gemstones. J. Gemmol. 1969, 11, 149–192. [Google Scholar] [CrossRef]
- Gübelin, E.J. Internal World of Gemstones; reprinted 1983 ed.; ABC Verlag: Zürich, Switzerland, 1973; p. 234. [Google Scholar]
- Fritsch, E.; Rossman, G.R. New technologies of the 1980s: Their impact on gemology. Gems Gemol. 1990, 26, 64–75. [Google Scholar] [CrossRef]
- Kammerling, R.C.; Scarratt, K.; Bosshart, G.; Jobbins, E.A.; Kane, R.E.; Gubelin, E.J.; Levinson, A.A. Myanmar and its gems—An update. J. Gemmol. 1994, 24, 3–40. [Google Scholar] [CrossRef]
- Renfro, N.; Koivula, J. Vesuvianite in burmese ruby. Gems Gemol. 2017, 51, 469. [Google Scholar]
- Leelawathanasuk, T.; Pisutha-Arnond, V.; Atichat, W.; Sutthirat, C.; Wathanakul, P.; Sriprasert, B. Some characteristics of “Mozambique ruby”. In 31st International Gemmological Congress—Abstracts; IGC: Arusha, Tanzania, 2009; pp. 33–34. [Google Scholar]
- Searle, M.P.; Noble, S.R.; Cottle, J.M.; Waters, D.J.; Mitchell, A.H.G.; Hlaing, T.; Horstwood, M.S.A. Tectonic evolution of the Mogok metamorphic belt, Burma (Myanmar) constrained by U-Th-Pb dating of metamorphic and magmatic rocks. Tectonics 2007, 26, 26. [Google Scholar] [CrossRef]
- Yonemura, K.; Osanai, Y.; Nakano, N.; Adachi, T.; Charusiri, P.; Zaw, T. EPMA U-Th-Pb monazite dating of metamorphic rocks from the Mogok Metamorphic Belt, central Myanmar. J. Mineral. Petrol. Sci. 2013, 108, 184–188. [Google Scholar] [CrossRef]
- Myat Phyo, M.; Franz, L.; Capitani, C.; Balmer, W.; Krzemnicki, M.; Christian, C. Petrology and PT-conditions of quartz- and nepheline-bearing gneisses from Mogok Stone Tract, Myanmar. In Proceedings of the 15th Swiss Geoscience Meeting, Davos, Switzerland, 17–18 November 2017. [Google Scholar] [CrossRef]
- Goldstein, T.; Aizenshtat, Z. Thermochemical sulfate reduction a review. J. Therm. Anal. Calorim. 1994, 42, 241–290. [Google Scholar] [CrossRef]
- Giuliani, G.; Dubessy, J.; Banks, D.; Hoang, V.Q.; Lhomme, T.; Pironon, J.; Garnier, V.; Phan, T.T.; Pham, L.V.; Ohnenstetter, D.; et al. CO2-H2S-S8-AlO(OH)-bearing fluid inclusions in ruby from marble-hosted deposits in Luc Yen area, North Vietnam. Chem. Geol. 2003, 194, 167–185. [Google Scholar] [CrossRef]
- Hoang, V.Q.; Giuliani, G.; Phan, T.T.; Pham, L.V. Fluid inclusion on ruby from the Yen Bai Province. In Geo- and Material-Science on Gem Minerals of Vietnam; GIA: Carlsbad, CA, USA, 2003; pp. 136–144. [Google Scholar]
- Phyo, M.M.; Bieler, E.; Franz, L.; Balmer, W.; Krzemnicki, M.S. Spinel from mogok, myanmar—A detailed inclusion study by raman microspectroscopyand scanning electron microscopy. J. Gemmol. 2019, 36, 418–435. [Google Scholar] [CrossRef]
- Malsy, A.; Klemm, L. Distinction of gem spinels from the Himalayan mountain belt. Chimia 2010, 64, 741–746. [Google Scholar] [CrossRef]
- Ottaway, T.; Wicks, F.; Bryndzia, L.; Spooner, E. Formation of the Muzo hydrothermal emerald deposit in Colombia. Nature 1994, 369, 552–554. [Google Scholar] [CrossRef]
- Bard, J.P. Microtextures of Igneous and Metamorphic Rocks; Springer Netherlands: Dordrecht, The Netherlands, 1986. [Google Scholar]
- Tomkins, A.G.; Pattison, D.R.M.; Frost, B.R. On the initiation of metamorphic sulfide anatexis. J. Petrol. 2006, 48, 511–535. [Google Scholar] [CrossRef]
- Frost, B.; Mavrogenes, J.; Tomkins, A. Partial melting of sulfide ore deposits during medium- and high-grade metamorphism. Can. Mineral. 2002, 40, 1–18. [Google Scholar] [CrossRef]
- Craig, J.R.; Kullerud, G. The Cu-Fe-Ni-S system. Carnegie Inst. Wash. Yearb. 1968, 66, 413–417. [Google Scholar]
- Peregoedova, A.; Ohnenstetter, M. Collectors of Pt, Pd and Rh in a S-poor Fe-Ni-Cu sulfide system at 760 °C: Experimental data and application to ore deposits. Can. Mineral. 2002, 40, 527–561. [Google Scholar] [CrossRef]
- Sugaki, A.; Kitakaze, A. High form of pentlandite and its thermal stability. Am. Mineral. 1998, 83, 133–140. [Google Scholar] [CrossRef]
- Institute, S.S.G. New Rubies from Montepuez, Mozambique; GIA: Carlsbad, CA, USA, 2010; p. 17. [Google Scholar]
- Schwarz, D.; Pardieu, V.; Saul, J.M.; Schmetzer, K.; Laurs, B.M.; Giuliani, G.; Klemm, L.; Malsy, A.K.; Erel, E.; Hauzenberger, C.; et al. Rubies and sapphires from Winza, central Tanzania. Gems Gemol. 2008, 44, 322–347. [Google Scholar] [CrossRef]
- Nicollet, C. Saphirine et staurotide riche en magnésium et chrome dans les amphibolites et anorthosites à corindon du Vohibory Sud, Madagascar. Bull. Mineral. 1986, 109, 599–612. [Google Scholar] [CrossRef]


© 2020 by the authors. Licensee MDPI, Basel, Switzerland. This article is an open access article distributed under the terms and conditions of the Creative Commons Attribution (CC BY) license (http://creativecommons.org/licenses/by/4.0/).