Article

Neoproterozoic Nafun Group Sediments from Oman Affected by an Active Continental Margin

by
Liang Yue
1,2,3,* and
Veerle Vandeginste
3,4,*
1
School of Transportation Engineering, Jiangsu Vocational Institute of Architectural Technology, Xuzhou 221116, China
2
State Key Laboratory of Oil and Gas Reservoir Geology and Exploitation, Institute of Sedimentary Geology, Chengdu University of Technology, Chengdu 610059, China
3
School of Chemistry, University of Nottingham, University Park, Nottingham NG7 2RD, UK
4
GeoEnergy Research Centre, University of Nottingham, University Park, Nottingham NG7 2RD, UK
*
Authors to whom correspondence should be addressed.
Minerals 2020, 10(6), 511; https://doi.org/10.3390/min10060511
Submission received: 22 April 2020 / Revised: 28 May 2020 / Accepted: 29 May 2020 / Published: 31 May 2020
(This article belongs to the Section Mineral Geochemistry and Geochronology)

Abstract

:
The Neoproterozoic era is a time of major environmental change in Earth history. The Ediacaran period (635–541 Ma), the uppermost division of Precambrian time, is characterized by the remarkable Shuram excursion (largest C isotope negative excursion), a deep ocean water oxidation event, and Ediacaran biota. The Nafun Group of Oman provides a well-preserved and mostly continuous section of an Ediacaran succession. Based on geochemical data from the Nafun Group, the Shuram excursion (SE) and deep ocean oxidation hypotheses were proposed. Now, we sampled this section at high stratigraphic resolution, and present here the petrographical and geochemical analysis of the Khufai, Shuram and Buah Formations. The major and trace element analysis of shales from the Shuram Formation indicates that northern Oman was an active continental margin environment in Neoproterozoic times. The provenance of the Shuram Formation was primarily mafic and intermediate igneous rocks. With the unsteady tectonic setting, the development of the Nafun Group was influenced by hydrothermal supply and volcaniclastic input. Based on the V/Cr and U/Th ratio of the samples from the Nafun Group, our study reveals the transition of the ocean water redox environment, which is connected to the rise and fall of the Ediacaran biota. Our study constrains the tectonic setting of northern Oman and the petrography and geochemical data from the Nafun Group for the hydrothermal and volcaniclastic supply. Thus, our study acknowledges more factors for the explanation of the Ediacaran conundrums.

Graphical Abstract

1. Introduction

Marine carbon isotope changes provide direct information on the global carbon cycle. The Ediacaran Shuram Formation (Nafun Group in Oman) is well known for the Shuram Negative Excursion (SE), which represents the largest carbon isotope excursion in geological history [1,2,3,4], with carbonate carbon isotopes values down to −12‰ VDB. Although there is a consensus on the origin of the negative carbon isotope signature of interglacial cap carbonates, the origin of the SE is still debated, and various hypotheses have been put forward to explain this shift around the globe [2]. The SE may have been caused by the oxidation of marine dissolved organic carbon (DOC) [5,6,7,8], water column stratifications [9,10], burial diagenesis alteration [11], methane-derived 13C-depleted authigenic carbonate [4,5,12,13,14], and terrestrial organic carbon through weathering [15,16].
Based on the abundant terrestrial debris from the Fiq glaciation (underlying the Nafun Group) and the average deposit accumulation rate of the Nafun Group, southern Oman is interpreted as late-stage rifts or passive margin [17,18,19]. Grotzinger et al. [20] considered that an Andean margin developed in eastern Oman and that the Nafun Group is related to subsidence of the lithosphere caused by the subduction of oceanic lithosphere beneath the Arabian plate. However, by the lack of outcrops and an incomplete understanding of tectonic evolution of the Huqf Supergroup (including Abu Mahara, Nafun and Ara Group), the tectonic models of Oman are hampered [21].
Previous research has followed the SE with interest, and took carbon isotopes of the Shuram Formation of Oman as a model for the relationship of the same abnormal excursion globally. The SE provides an isochronous stratigraphic framework for the negative excursion among the Wonoka Formation in Australia [22], Johnnie Formation in the USA [15], Doushantuo Formation in China [14], and Bol’shoy Patom section in Siberia [23]. The ocean oxidation event in the Ediacaran period has also been discussed [6,23,24,25]. Using the Shuram Formation (or the Nafun Group) as a reference, the oxidation of the ocean could be divided into three stages [6,23,24]. Previous research focused on C, O, S, Sr isotope and TOC of the Shuram Formation [1,3,6], but no other geochemical data of the Nafun Group from Oman have been presented recently. However, other formations with identified SE have been subject to numerous detailed isotopic and elemental analyses, having led to regional correlation of 34S [8,14,26,27], 238U [4,23], major and trace elements [28,29,30], 15N [27] and Ca-Mg isotopes [31].
In this study, the first high-resolution whole-rock major and trace element data of the Nafun Group in Oman are reported. Moreover, combined with C and O isotope and petrography data, we discuss the tectonic setting of the Nafun Group and evaluate the role of hydrothermal fluids and volcaniclastic input in the SE. Furthermore, our data reveal the transition of the ocean water redox environment and determine the temporary oxidation of the deep water in the Shuram Formation. Our findings may contribute to a better understanding of the largest negative carbon isotope excursion and present a unique event of the carbon cycle through geological time.

2. Geological Setting

The Huqf Supergroup comprises the Abu Mahara Group, Nafun Group and Ara Group. Interpretations of the Abu Mahara Group suggest a record of the global glaciations (Sturtian and Marinoan) in Jabal Akhdar and stratigraphically equivalent to the felsic volcanics and volcaniclastics of the Halfayn Formation volcanism in the Huqf area [18,19,21,32].
The Nafun Group crops out in the Jabal Akhdar area (northern Oman), the Huqf area (east-central Oman), and the Mirbat area (southern Oman) (Figure 1A,B). The Nafun Group was subdivided into the Masirah Bay, Khufai, Shuram, Buah and Hadash Formations (Figure 1C) [18,19]. At the base of the Nafun Group, the Hadash Formation is directly overlying the Fiq glacial deposits or Halfayn Formation felsic volcanics and is considered to be the cap carbonate after the Marinoan glaciation (635 Ma) [18,19,33]. Moreover, the Hadash Formation is interpreted as the isochronous sedimentary strata for the cover of the north–south basement in Oman.
The four overlying formations contain two siliciclastic to carbonate sequences made of the Masirah Bay/Khufai and Shuram/Buah Formations, which represent transgression–regression cycles [18,33]. The shallow–deep marine sandstone, siltstone and shale of the Masirah Bay and Shuram Formations change gradationally upwards to the carbonate ramp of the Khufai and Buah Formations [34].
The Ara Group overlies the Buah Formation and is made of fine-grained sediments, carbonates, cherts and volcaniclastics in Jabal Akhdar. However, in the salt basins of central and eastern Oman, the Ara Group consists of carbonates and evaporates and forms a structural high referred to as Eastern Flank or Huqf High [35,36].

3. Materials and Methods

3.1. Materials

The Khufai, Shuram and Buah Formations in Jabal Akhdar were systematically sampled at high stratigraphic resolution. Fresh samples were taken at about every 15 m through the section (Figure 1C), and a total of 76 samples were collected for petrographic and major and trace element analysis (see Supplementary Materials). Among them, five limestones from the Khufai Formation, three limestones from the Shuram Formation and four limestones and three dolostones from the Buah Formation were collected (Table 1).

3.2. Analytical Methods

The micrographs of the thin sections were taken by a Zeiss Axioscope A1 light microscope. Additionally, the thin section halves were stained with Alizarin Red S to distinguish calcite from dolomite, after the procedure described by [37].
All samples were analyzed with an X-ray fluorescence spectrometer to determine major and trace element concentrations. For this purpose, the hand specimens were cut and polished, and then the polished sample surface was analyzed using a hand-held Tracer IV-SD spectrometer, equipped with rhodium target and Silicon Drift Detector, and a Bruker 3V Vacuum pump. The analyses were collected using both the Trace MudRock (TMR) and Major MudRock (MMR) modes which operate at 40 kV and 15 kV, respectively. The vacuum conditions at which the analyses were run help prevent the absorption of low energy radiation by air within the tube known to hinder the detection of light elements [38].
The samples for stable carbon and oxygen isotope were obtained using a dental drill and analyzed by a Kiel IV automated carbonate device attached to a MAT 253 mass spectrometer in the Qatar Stable Isotope lab of Imperial College London. The powder samples of between 90 and 150 µg were reacted with orthophosphoric acid at 70 °C in individual vials. The resulting CO2 was then trapped in a cold finger and cleaned before being automatically transferred to the mass spectrometer. Results were corrected for instrumental drift using values for NBS 19 and an internal standard (ICCM, Imperial College Carara Marble), and expressed in per mil relative to Vienna Peedee Belemnite (VPDB). Reproducibility of the standards was 0.03‰ for δ13C and 0.09‰ for δ18O (one standard deviation). The oxygen isotopic composition of samples with dolomite was corrected for acid fractionation using the fractionation factors given by [39,40].

4. Results

4.1. Petrography

4.1.1. Khufai Formation

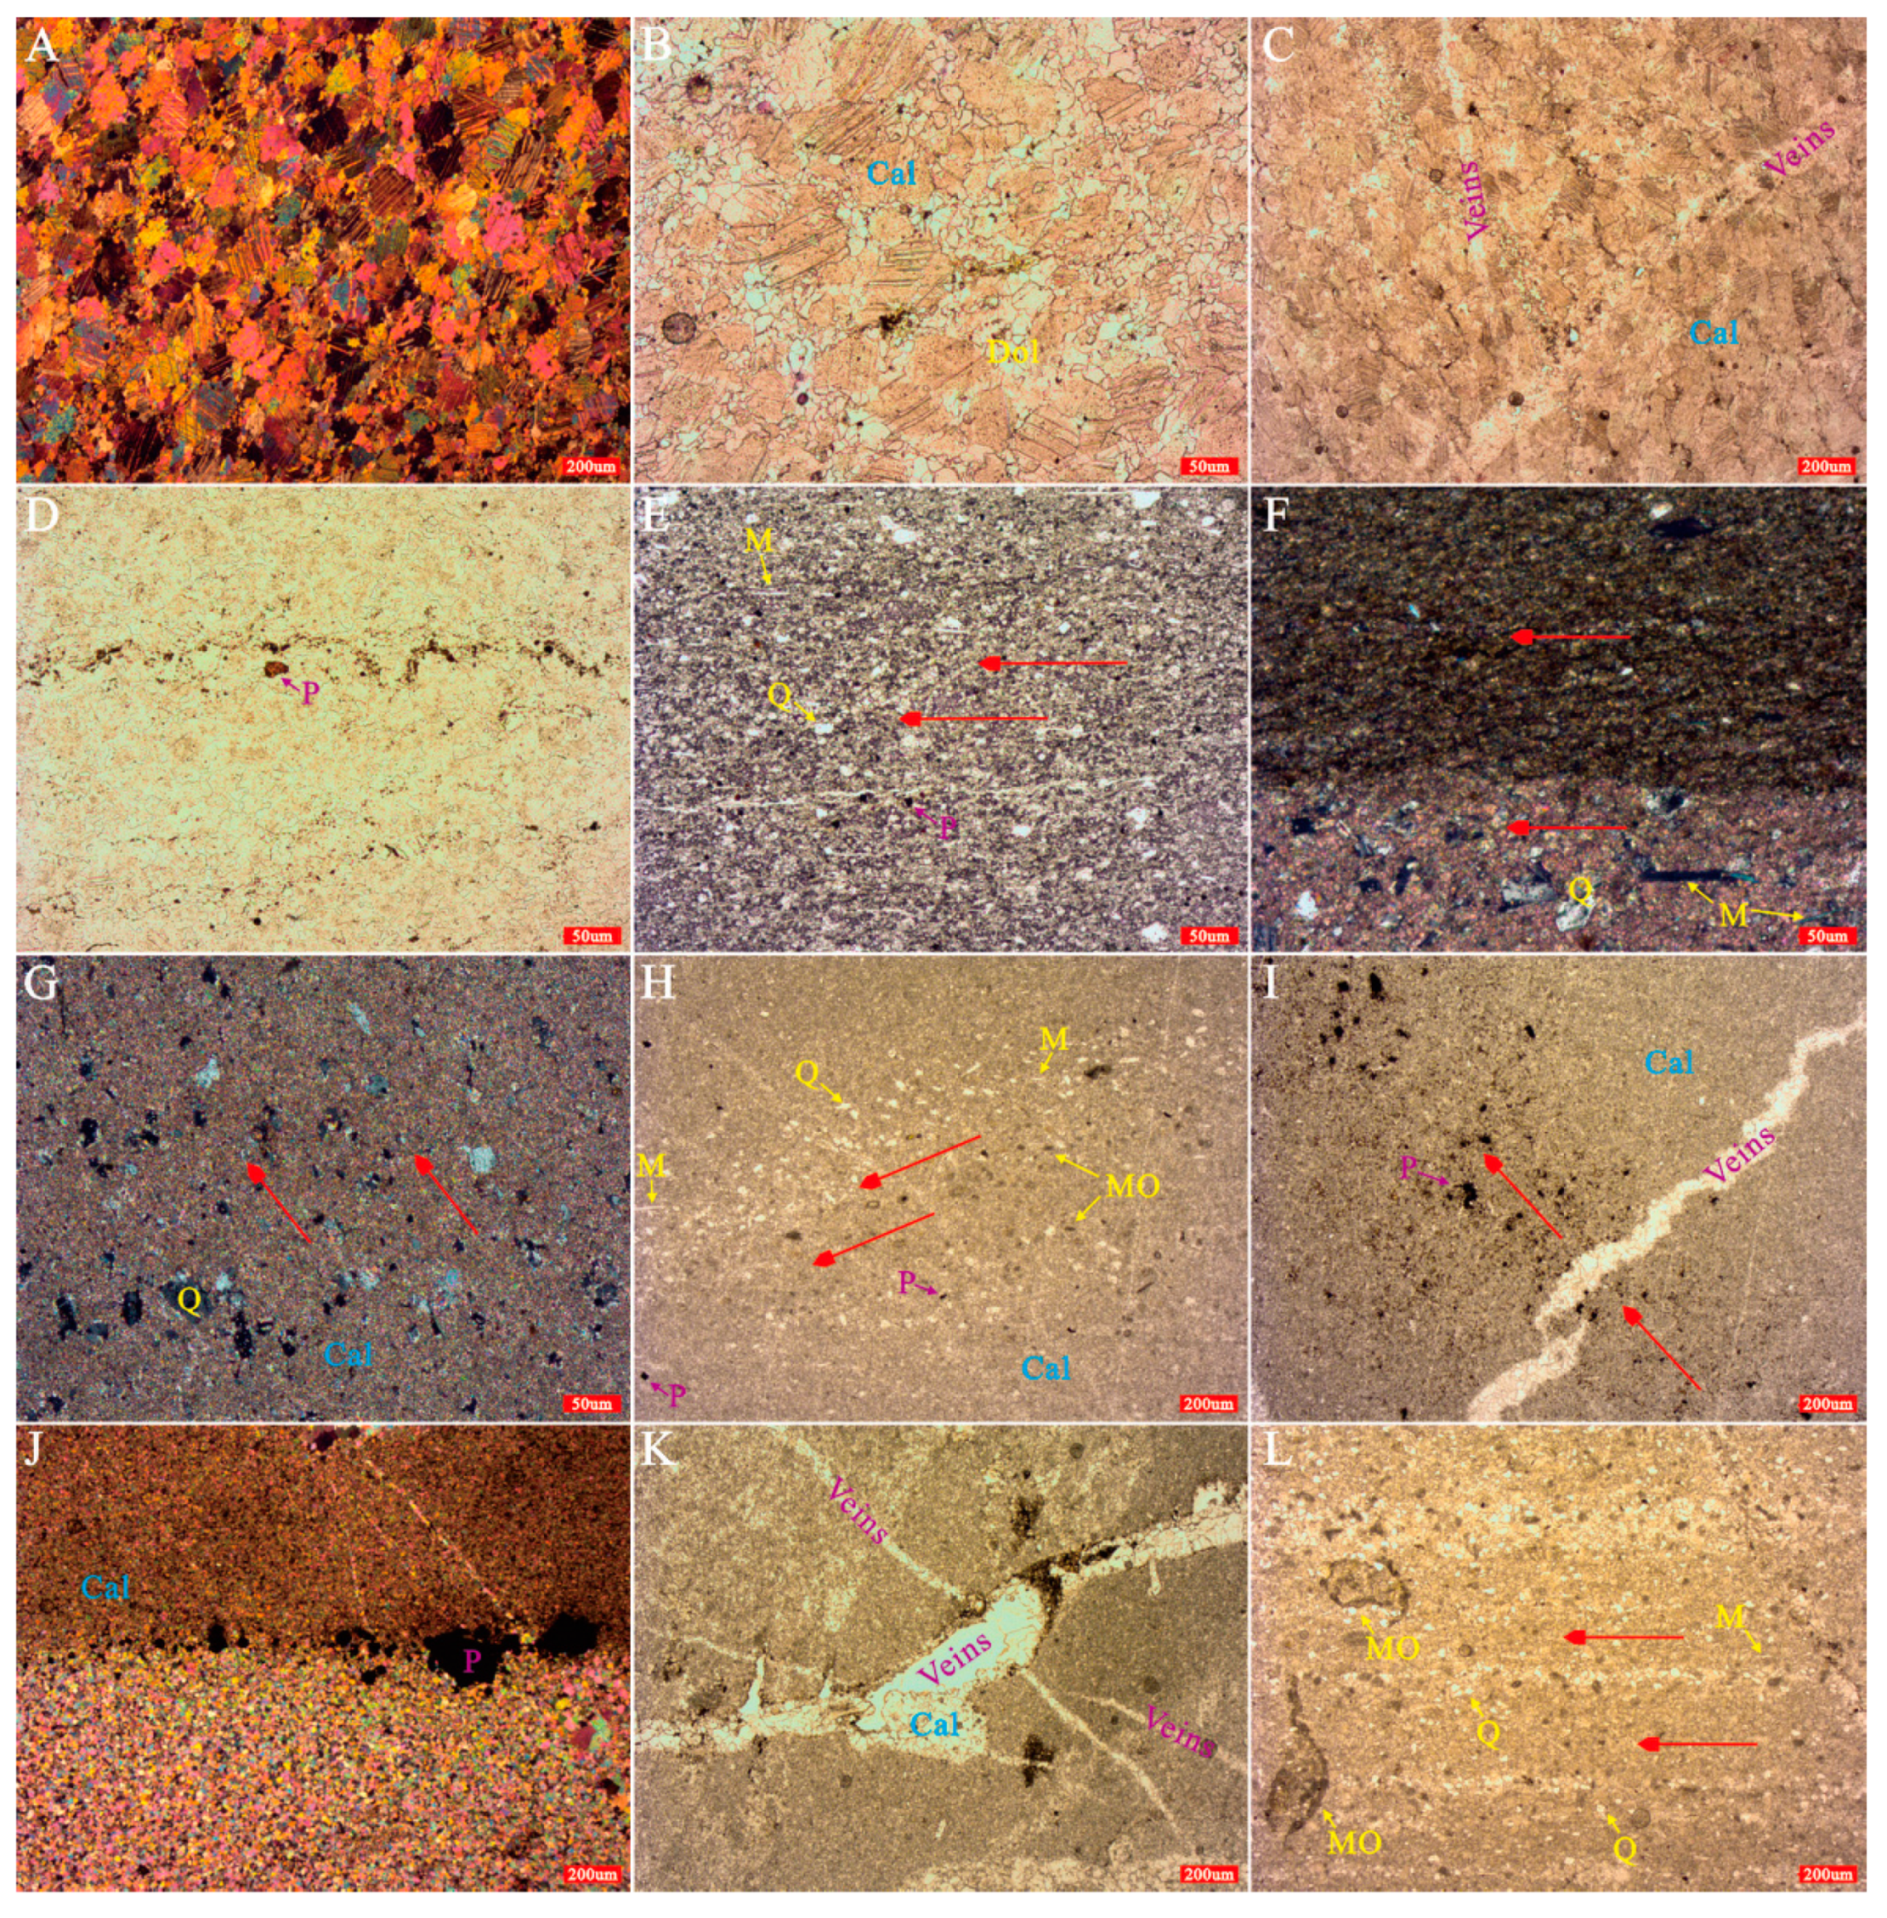
In Jabal Akhdar, the Khufai Formation mainly consists of fetid limestones, lime-mudstones, siltstones, grainstones and dolomitic limestones (Figure 2A,B), and can be divided into three units. The lower unit consists of lime-mudstones and siltstones which represent a deepwater environment. The middle and upper unit are grainstones, fetid limestones and dolomitic limestones. The veins and cement calcite occur widely in the carbonates of the Khufai Formation (Figure 2C). There is also abundant organic matter in the rocks (Figure 2D).
The stratigraphic patterns indicate deposition in a deep outer-ramp environment [34,41]. The sections suggest that carbonate production replaces the siliciclastic influx because of sea-level rise or decreased rates of uplift and/or erosion. The Masirah Bay/Khufai Formation sedimentary cycle was interpreted as HST (highstand system tract) deposits after the Marinoan glaciation [18,41].
The dolomitic limestone at the top of the Khufai Formation is typically coarsely crystalline calcite and finely crystalline dolomite (Figure 2B) and may be influenced by the hydrothermal fluid [42,43]. The carbonate veins in the upper unit and the remaining bitumens in the veins could be interpreted as a past hydrocarbon migration process by the post-depositional fluids [44].

4.1.2. Shuram Formation

From bottom to top, the Shuram Formation consists of coarse conglomeratic sandstones, sandstones interbedded with siltstones, siltstones interbedded with sandy limestones, organic-rich shales, limestones and sandy limestones (Figure 2E–I). Based on thin section analysis, abundant extrusive quartz, sedimentary pyrite, white mica and relicts of microorganisms are present in the Shuram Formation limestones (Figure 2G–I). The minerals and microorganisms show the same crystallographic orientation. In addition, Shuram Formation shales are rich in organic matter (Figure 2F,H), and some veins in the carbonate rocks are filled with remaining bitumens and hydrothermal coarse calcites (Figure 2I).
The Shuram Formation developed in a shallow-deepwater environment, and the facies deepened from the Huqf area to the Jabal Akhdar area [18]. In the rocks sampled from Jabal Akhdar, there is abundant sedimentary pyrite (mostly 5 to 35 µm). The precipitation of pyrite is linked to sulfate, methane, microorganisms and hydrogen sulfide [45,46,47], and was most likely developed by activity of microorganisms.
Quartz, calcite, pyrite and white mica show preferred orientation, revealing fluid flow in the deepwater. Based on the abundant hyalophane-quartz and white mica, which indicates volcanic activity, the development of the Shuram Formation is probably influenced by submarine volcanism. The volcaniclastics were introduced in the formation by hydrothermal fluid flow [48].

4.1.3. Buah Formation

The Buah Formation is composed of limestones, dolostones, stromatolites and ooid carbonates, mudstones and sandy carbonates (Figure 2J–L). In Jabal Akhdar, there are limestones in the lower part of the formation and dolostones in the upper part (Figure 1C). There are abundant quartz grains at the top of the Buah Formation, and the quartzes show preferred orientation (Figure 2J,L). The abundant veins filled by calcite crystals usually cut the layers and some veins in the carbonate rocks are filled with remaining bitumens (Figure 2K). There are more relicts of microorganisms in comparison with the underlying formations, and they are distributed along the layers (Figure 2L).
The Buah Formation carbonates are interpreted to have been deposited in a carbonate ramp, and record a sedimentary facies transformation from deep to shallow water [34,49]. The abundant veins are interpreted to have resulted from the post-depositional fluids. Furthermore, the largest δ13C negative values (Shuram Excursion) change gradually back to the positive values in the Buah Formation [1].

4.2. Major and Trace Elements

The composition of terrigenous sedimentary rocks provides a powerful tool to identify the tectonic setting [50,51]. For effective geochemical analysis, we plotted the Shuram Formation siliciclastic rocks into the Herron diagram (Figure 3A) [52], and subsequently, selected suitable samples (30 shales and 2 calcareous siltstones samples in Supplementary Materials) for the tectonic setting discrimination diagrams.
For distinguishing the provenance of sediments, a discriminant function diagram was proposed [53]. In Figure 3B, most shales plot along the boundary between the P1 and P2 fields and indicate a provenance from primary mafic and intermediate igneous rock sources. Roser and Korsch [51] have demonstrated that SiO2/Al2O3 and K2O/Na2O ratios are good indicators for tectonic setting discrimination, also providing a specific diagram for discriminating between four main depositional environments. The samples from our study plot along the boundary between the active continental margin and the evolved arc setting fields. Although authors usually discriminate tectonic backgrounds by analyzing the major elements, there is risk and uncertainty in the discriminant diagrams for tectonic settings [54].
In contrast to major elements, a comparison of trace element concentrations could be more effective for inferring the tectonic settings, because they have a larger range of elements [55]. Bhatia and Crook [50] created a tectonic discrimination diagram using Th-Co-Zr/10 to set an additional basis for distinguishing between sediments deposited in a passive margin (PM), active continental margin (ACM), continental island arc (CIA) and ocean island arc (OIA). Most of the samples plot close to the OIA, CIA and ACM fields (Figure 3C). Basing their study on late Proterozoic clastic rocks, Winchester and Max [55] considered positive Rb, Th, Nb, Sr and Y anomalies as common features for ACM or CIA. In Table 1, these elements have obviously anomalous values. Furthermore, the large ion lithophile elements (LILE) concentration of the Shuram shales is higher than in Proterozoic shales [56], which suggests that the Shuram Formation developed in an ACM or CIA environment [55]. In addition, a comparison between three different elemental profiles [57] and those of our samples suggests that the Shuram Formation is in closest similarity to rocks deposited within an active continental margin environment.
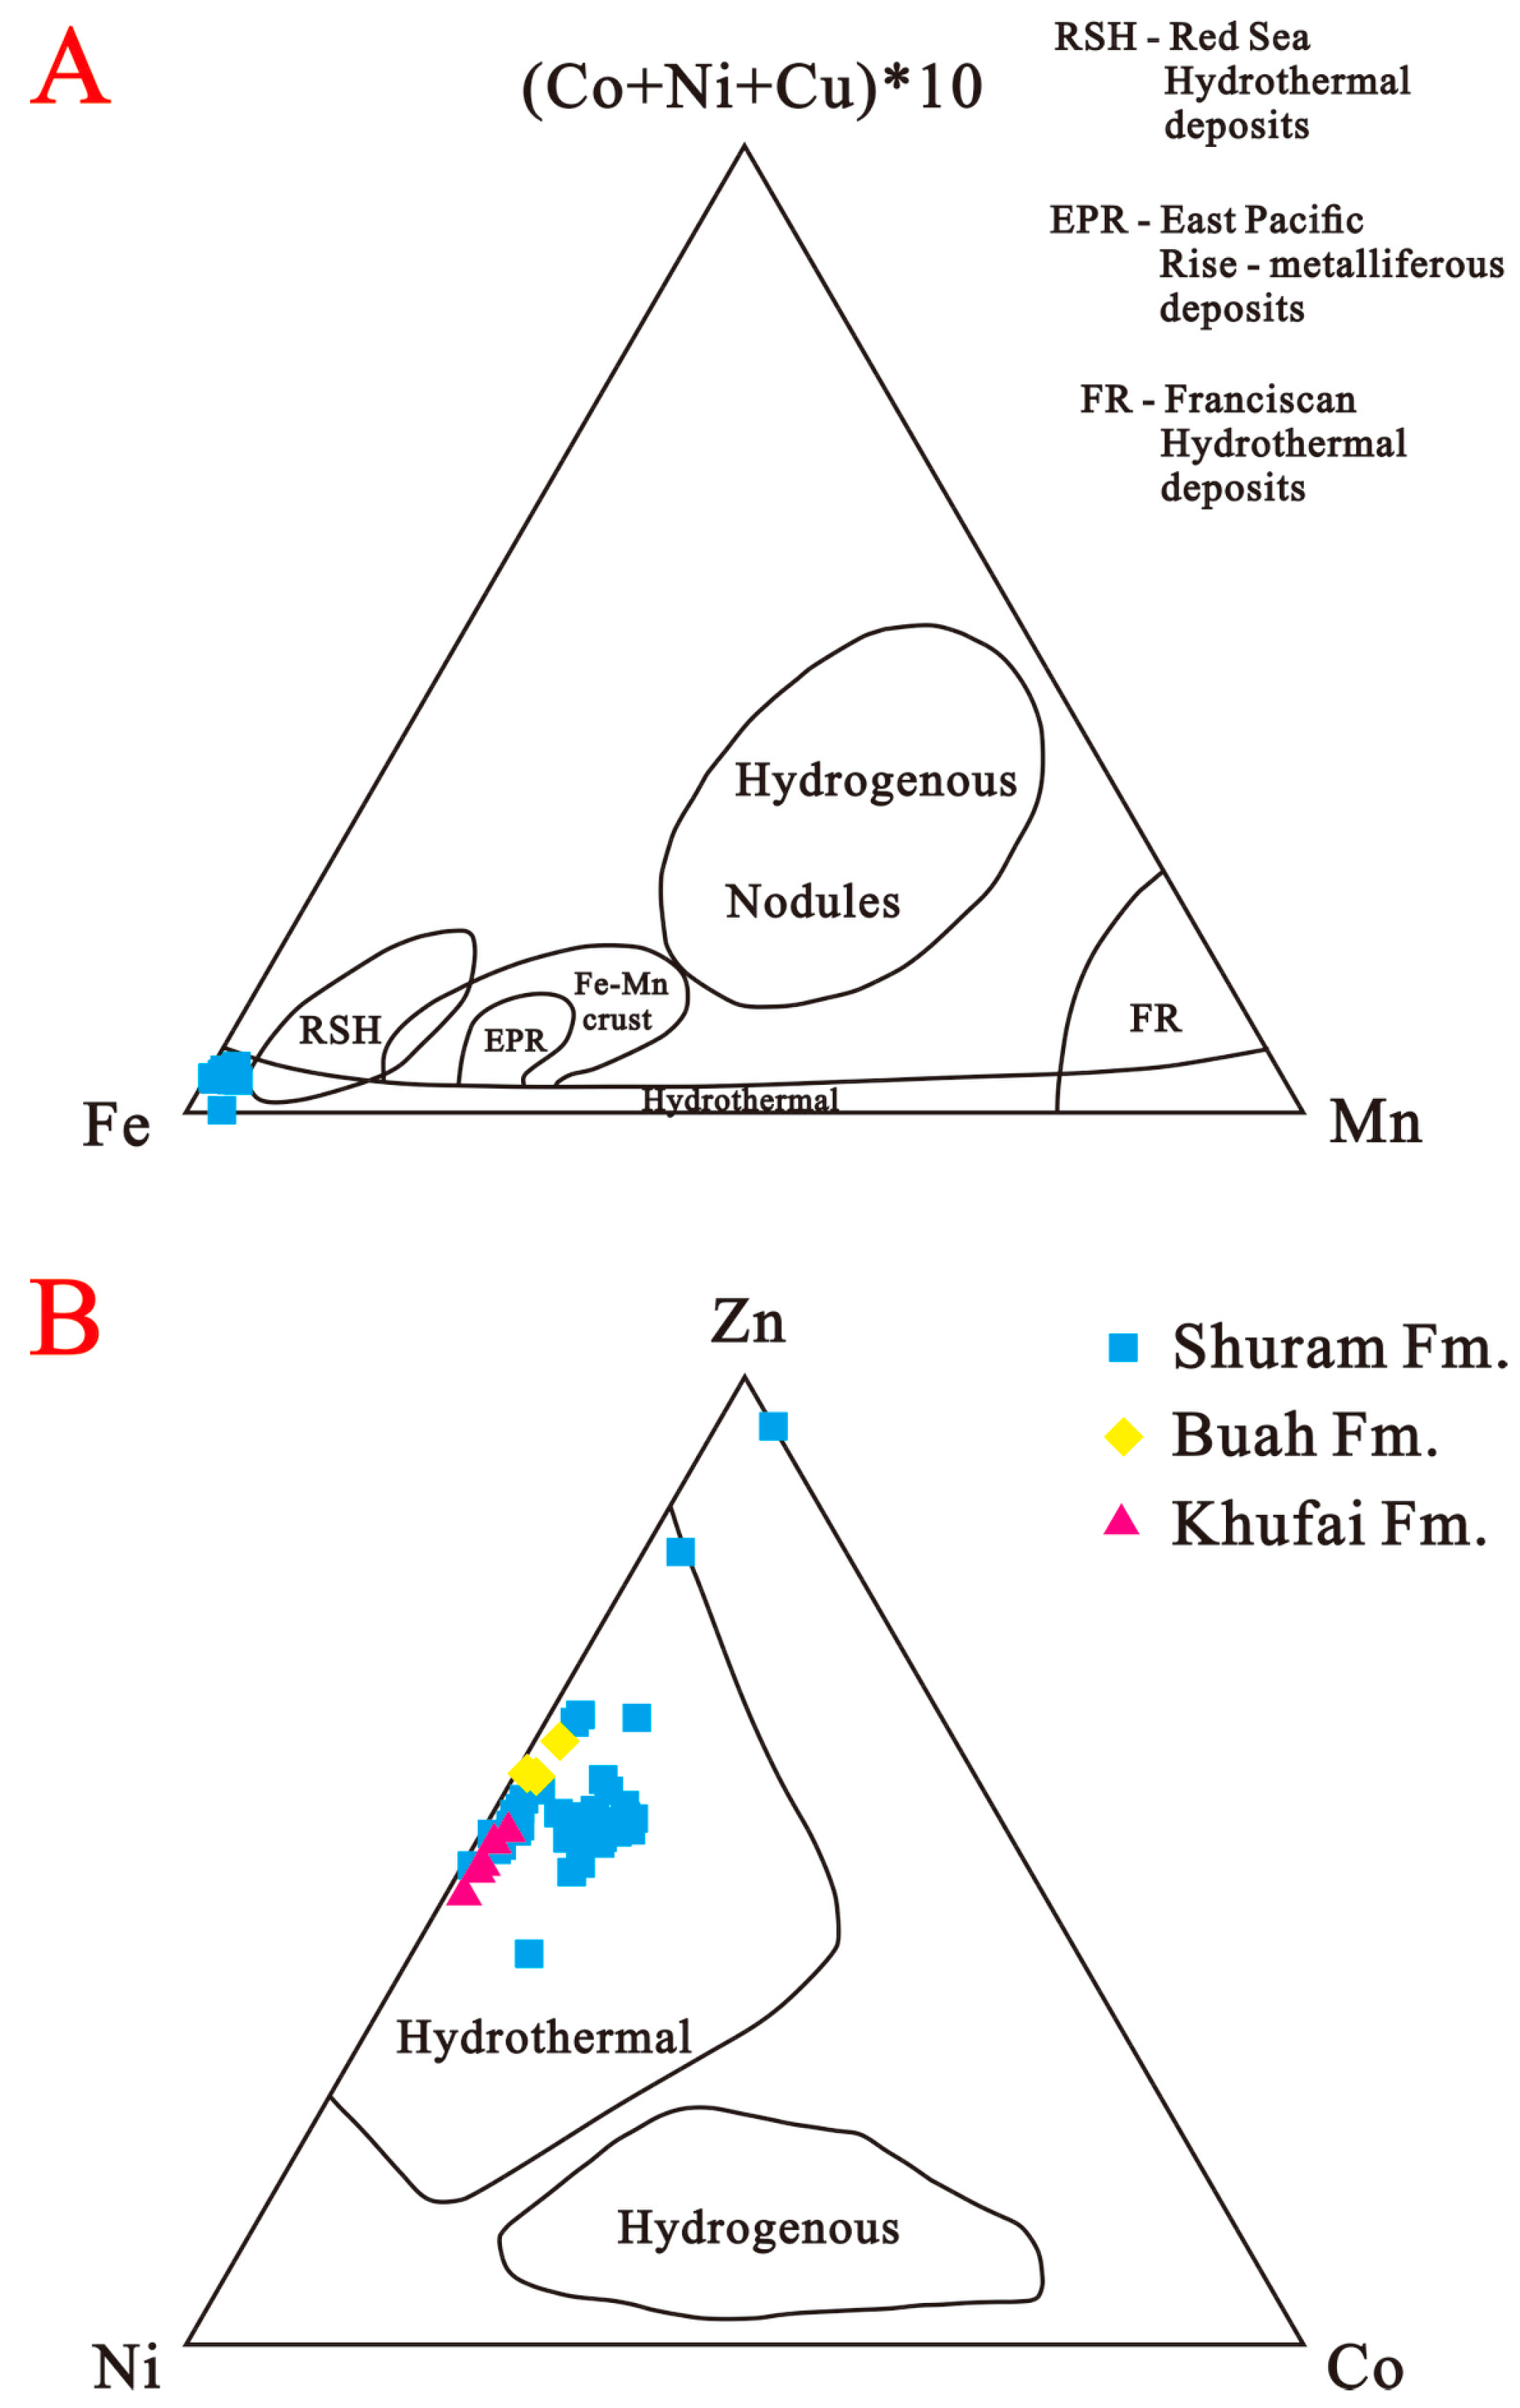
Major and trace elements also respond to paleoenvironmental evolving conditions. Several types of discriminant diagrams have been proposed to reveal the hydrothermal origin of the sediments, e.g., (Co + Ni + Cu) × 10 − Fe − Mn [59,60,61], Zn-Ni-Co [62] and Al/(Al + Fe + Mn) [63]. These ratios can be regarded as a sensitive indicator for hydrothermal authigenic origin and their use has been effectively demonstrated in several studies [64,65]. In Figure 4, the samples of the Khufai, Shuram and Buah Formation are located in the area indicative of hydrothermal deposits.

4.3. Carbon and Oxygen Isotopes

The δ13C values in the Khufai Formation are positive, +4.4‰ to +7.8‰ (Table 2). Because of the lack of much carbonate in the Shuram Formation, only three samples were obtained, and they are all strongly negative, reaching a minimum of −10.4‰ at the top of the Shuram Formation. The δ13C values start to increase and return to positive towards the top dolostone of the Buah Formation. The δ18O values in the Khufai, Shuram and bottom of the Buah Formation are negative, reaching a minimum of −14.7‰ in the bottom of the Shuram Formation. The δ18O increases to positive values towards the top of the Buah Formation, co-varying with δ13C (Table 2).
The Mn/Sr ratio of carbonate rocks is widely used as a proxy for diagenetic alteration. It is proposed that carbonate rocks with low Mn/Sr ratio (<2) can be regarded as unaltered [66], whereas some consider that the ratio should be <2 in conjunction with δ18O > −10‰ [67,68]. In Table 1, except for the top three samples from the Buah Formation, which may indicate possible diagenetic alteration, the other samples would be interpreted to have preserved their original isotopic compositions. The Sr concentrations in the Shuram Formation are high [11], in two cases >1400 ppm and one case >850 ppm. Another important observation is that Sr concentrations in the Khufai and Buah Formations are >2000 ppm and such high Sr could preclude the interpretation of C isotope values [11].

5. Discussion

5.1. Tectonic Setting

In the late Neoproterozoic-Cambrian transition, the Arabia plate, as part of East Gondwana, was involved in the collision of East and West Gondwana [19,69]. The geological history of Oman, which belonged to the Arabia plate, is expected to reveal the final amalgamation of greater Gondwana. However, different tectonic interpretations have been proposed to explain the evolutionary history of the Nafun and Ara Groups in Oman. With the restricted accumulation of the Abu Mahara and average deposit accumulation rate of the Nafun Group, the sedimentary setting of northern Oman is interpreted as late-stage rifts or passive margin [17,18,19,21]. However, for the regional subsidence in the Ediacaran period, Grotzinger et al. [20] and Hisham and John [70] considered that an Andean margin developed in eastern Oman and that the Nafun Group was related to subsidence of the lithosphere caused by the subduction of oceanic lithosphere beneath the Arabian plate. A similar view is that the subsidence was caused by the tectonic loading and development of a foreland basin [21]. Alessio et al. [71] studied the igneous samples from Jebel Ja’alan (North eastern Oman) and concluded that they were formed in an arc environment during the Tonian.
The Arabian plate was one of the terranes of the eastern Arabian-Nubian Shield, and southern Oman was under its influence [19]. The study of the U-Pb geochronology of the Shuram Formation shows that a large number of detrital zircons have ages between 600 and 900 Ma [18,19,21]. To explain the sources of 600–640 Ma zircons in the Nanfun Group, Allen [19] considered a provenance from the Arabian-Nubian Shield. Based on the tectonic setting discrimination diagrams (Figure 3B,C) and Table 1, the sedimentary rocks from the Shuram Formation were primarily sourced from mafic igneous and intermediate igneous rocks, and their geochemical composition indicates that the tectonic setting of northern and eastern Oman during the Neoproterozoic was an active continental margin or continental island arc. Additionally, Bowring et al. [21] suggested that the increase in volcanic and volcaniclastic rocks in the Ara Group is unlikely due to simple passive margin subsidence. Hence, the evidence above indicates that the tectonic setting was an unsteady continental margin, as opposed to not previous models that proposed a passive margin setting.
From Neoproterozoic to Cambrian times, the basins of Oman show a clear N-S trend, including the sedimentary basins of the Abu Mahara Group [72], the development of the Fiq Formation rift basins [33], and the continuous salt basin of the Ara Group [19]. Such a geometry is compatible with major tectonic structures (e.g., plate boundaries) trending similarly. Based on our geochemical analysis, we propose that eastern Oman was located in the upper plate to a subduction zone, towards the mainland flank of a marginal, arc-related sedimentary basin (Figure 5). This basin would be affected by a Neoproterozoic volcanic belt [72], as well as multiple phases of volcanic activity in Mirbat [73] and basaltic to rhyolitic dykes in Al Hallaniyah Islands [74]. However, there is still uncertainty about the full geodynamic setting and interrelationship between eastern Oman and the rest of adjacent tectonic plates, such as the Iran plate [75] or India plate [71,76,77].

5.2. Hydrothermal Activity

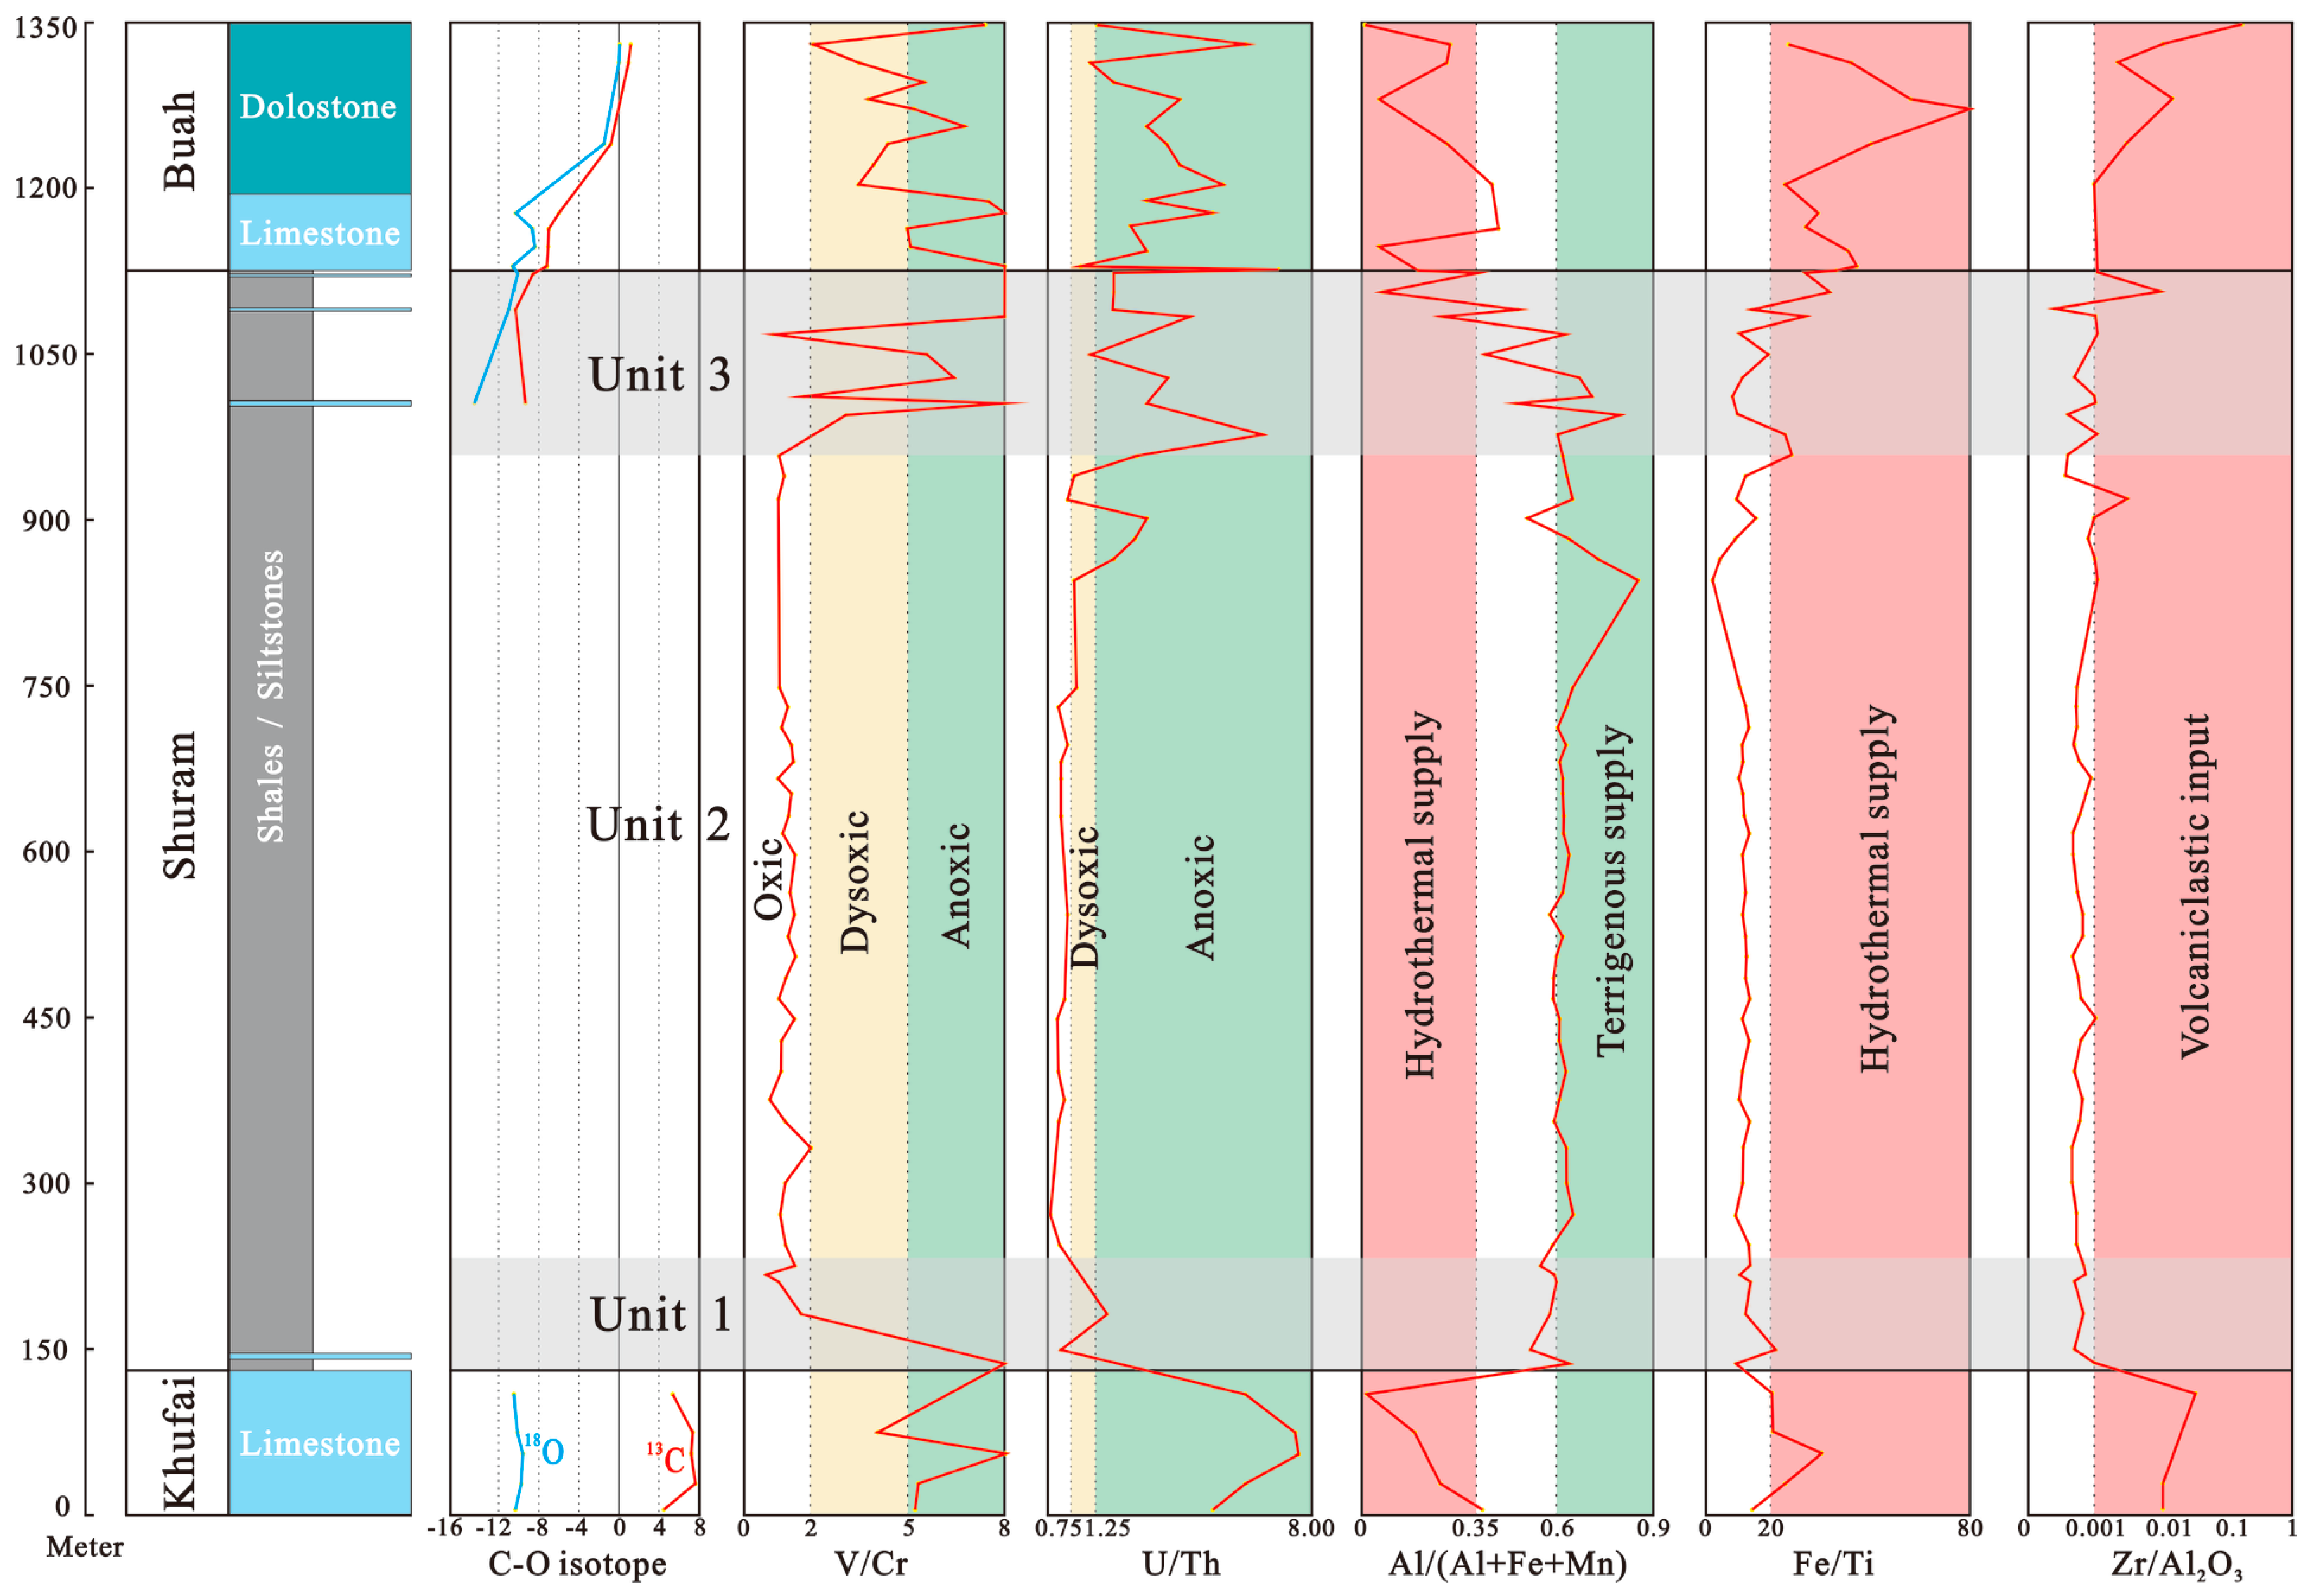
Based on the petrographical characteristics and geological background of the active continental margin, we applied additional geochemical methods to reveal more earthbound environmental factors. The hydrothermal deposits have Al/(Al + Fe + Mn) < 3.5 and Fe/Ti > 20, and these ratios are an indicator of hydrothermal supply [64,78]. High Zr/Al2O3 or TiO2/Al2O3 ratios of black shales are signs of active continental volcanism, reflecting active tectonics [79,80,81]. A Zr/Al2O3 ratio ≥0.001 indicates a higher contribution from volcaniclastics [78,82].
It is well known that the typical SE occurred in Unit 1 of the Shuram Formation [6,7,18,83,84]. In our study, the isotopic anomaly occurs in unit 3, at the top of the Shuram Formation. In Figure 6, the Al/(Al + Fe + Mn), Fe/Ti and Zr/Al2O3 profiles of unit 1 and 3 of the Shuram Formation show a significant change in the supply and input. It seems clear that there are links between the isotopic anomaly, the hydrothermal supply and the volcaniclastic input. Although unit 2 of the Shuram Formation does not present much evidence of volcaniclastic input, the Zr/Al2O3 ratio is close to the boundary line of the volcanic signals in Figure 6, so there could be a potential contribution of volcaniclastic input and related hydrothermal fluids.
Just like the unsteady continental margin environment, the volcaniclastic layer overlying the Nafun Group reflects active volcanism [21,33,84], which could have caused the abundant hydrothermal fluid activity. This process affected the primary depositional features in the Mid-Late Neoproterozoic-Early Cambrian period. Although the orientation of abundant quartz and white mica (Figure 2C,D,F) might be explained by tractive current deposits, the phenomenon could indicate deep water fluid flow.
The high Sr content of carbonates of the Nafun Group (Table 2) is affected not only by its original mineralogy, diagenetic process and seawater Sr concentration, but also by the terrigenous clastic flux and submarine hydrothermal flux. There is large evidence on major hydrothermal events during parts of the Neoproterozoic period [66], and the hydrothermal event could result in the flux of Sr to seawater, to be incorporated into later carbonate formations. Furthermore, the ocean geochemical system significantly changed from the Proterozoic to the Paleozoic. The late Neoproterozoic period must have been an important transition period, and the Nafun Group is still an ideal target for further study.

5.3. Shuram Excursion

Chemical proxies like redox-sensitive trace element compositions (Cu, Cr, V, Cd, Mo, U, Y, Zn and REEs) in shales are effective methods to deduce the redox conditions of paleo-seawater [85]. The V/Cr and U/Th ratios are accepted as evidence of a certain redox regime, where 0 < V/Cr < 2 or 0 < U/Th < 0.75, 2 < V/Cr < 5 or 0.75 < U/Th < 1.25, and V/Cr > 5 or U/Th > 1.25 represent oxic, dysoxic and anoxic conditions, respectively [86,87,88].
The Neoproterozoic ocean oxidation event was proposed by the indirect proxy of the SE [6] and was driven by the strong tectonic movements during the amalgamation of Gondwana supercontinent [25,69]. One proposed mechanism for the SE is the oxidation of the deep-ocean pool of the dissolved organic carbon (DOC) [5,6,89]. However, the extent and interval of widespread ocean oxygenation are poorly constrained [23,25,90]. Based on the V/Cr and U/Th data, we propose that the Khufai, Shuram and Buah formations recorded the redox transitions from anoxic to oxic to anoxic conditions. It is noted that the data from unit 2 of the Shuram Formation suggest oxic or dysoxic ocean environment, which would reveal that the onset of the Neoproterozoic deepwater oxidation event is at the bottom of the Shuram Formation, and that the decline of that is at the top of the Shuram Formation. Similar to our results, Zhang et al. [23] examined U isotope variations in the sections from South China, Siberia and USA, and concluded that the ocean evolved from an anoxic state to a near-modern oxygen level during SE. Tahata et al. [24] considered that the O2 content in the atmosphere increased after the Marinoan glaciation (635 Ma) and peaked in the SE to then decreased to its lowest point in the Buah period.
The C isotopes of the samples from unit 3 of the Shuram Formation show strongly negative excursion (Figure 6 and Figure 7). For the SE, the typical negative values occur at the bottom (unit 1 in our study) of the Shuram Formation [6,7,18,83,84] (Figure 7). With the Shuram isotope anomaly in both units 1 and 3, the hydrothermal supply and volcanic input show strong relationship with the C isotope transformation (Figure 6). Coinciding with the C isotope excursion, also sulfur isotopes show an anomaly [8,14,26,91], with 34S-depletion of sulfate interpreted to be caused by the weathering debris and oxidant event or massive volcanic/hydrothermal input [92].
The negative carbon isotope excursion has been interpreted as a primary signal by some researchers, linking it to oxidation of dissolved organic carbon (DOC), water column stratification [9,10], and terrestrial organic carbon through weathering [15,16]. In contrast to the interpretation of preservation of the primary signal, another hypothesis interprets the signature as being caused by diagenetic alteration [11] or incorporation of methane-derived 13C-depleted authigenic carbonate [4,5,12,13,14]. Disregarding whether the SE reflects a primary or diagenetic signature, the hydrothermal supply and volcaniclastic input, which is clear from our study of the geological setting, seem to have been overlooked so far. The volcaniclastic or hydrothermal components could have influenced the ocean water chemistry, the composition of sediments, oxidation of organic matter, and recrystallization of carbonate rocks. Furthermore, the hydrothermal and redox conditions are also responsible for the enrichment of organic matter (Figure 2) [93].
The Shuram negative C isotope excursion in the Ediacaran period occurred in at least another four parts of the globe (the Wonoka Formation in Australia, Johnnie Formation in the USA, Doushantuo Formation in China and Bol’shoy Patom section in Siberia). The study of the Shuram excursion was strengthened in recent decades [2], and we aimed to provide a consideration factor (hydrothermal activity) for modelling the SE or carbon cycle.

6. Conclusions

Based on the petrography and geochemical record of the Nafun Group in Jabal Akhdar (northern Oman), we propose that northern Oman was an active continental margin or continental island arc environment during the late Neoproterozoic, and the provenance for the sediments that were deposited in that region was primarily mafic and intermediate igneous rocks. Within the unsteady tectonic setting, the Nafun Group shows a remarkable hydrothermal supply and volcaniclastic input, and the sedimentary succession shows evidence of a change from anoxic to dysoxic-oxic to anoxic conditions in ocean water.
Compared with the δ13C and δ18O profiles, the hydrothermal flux and ocean redox conditions are strongly related to the Shuram carbon isotope transformation. Disregarding whether the largest isotope anomalies in Neoproterozoic strata resulted from a primary or diagenetic process, the regional (active) tectonic setting and ocean geochemical system probably played important roles.

Supplementary Materials

The following are available online at https://www.mdpi.com/2075-163X/10/6/511/s1. Table S1: Major and trace elements.

Author Contributions

Writing—review and editing, L.Y.; supervision, V.V. All authors have read and agreed to the published version of the manuscript.

Funding

This research was funded by the National Key Research and Development Program of China (2018YFC0604201, 2016YFC0601001), the Open Fund of State Key Laboratory of Oil and Gas Reservoir Geology and Exploitation (Chengdu University of Technology) (PLC201901013). Samples used in this study were collected and geochemically analyzed in the Qatar Carbonates and Carbon Storage Centre research project funded by Qatar Petroleum, Shell and the Qatar Science and Technology Park.

Conflicts of Interest

The authors declare no conflict of interest.

References

  1. Le Guerroué, E.; Allen, P.A.; Cozzi, A. Chemostratigraphic and sedimentological framework of the largest negative carbon isotopic excursion in Earth history: The Neoproterozoic Shuram Formation (Nafun Group, Oman). Precambrian Res. 2006, 146, 68–92. [Google Scholar] [CrossRef]
  2. Grotzinger, J.P.; Fike, D.A.; Fischer, W.W. Enigmatic origin of the largest-known carbon isotope excursion in Earth’s history. Nat. Geosci. 2011, 4, 285–292. [Google Scholar] [CrossRef]
  3. Lee, C.; Fike, D.A.; Love, G.D.; Sessions, A.L.; Grotzinger, J.P.; Summons, R.E.; Fischer, W.W. Carbon isotopes and lipid biomarkers from organic-rich facies of the Shuram Formation, Sultanate of Oman. Geobiology 2013, 11, 406–419. [Google Scholar] [CrossRef] [PubMed] [Green Version]
  4. Jiang, L.; Planavsky, N.; Zhao, M.; Liu, W.; Wang, X. Authigenic origin for a massive negative carbon isotope excursion. Geology 2019, 47, 115–118. [Google Scholar] [CrossRef]
  5. Rothman, D.H.; Hayes, J.M.; Summons, R.E. Dynamics of the Neoproterozoic carbon cycle. Proc. Natl. Acad. Sci. USA 2003, 100, 8124–8129. [Google Scholar] [CrossRef] [PubMed] [Green Version]
  6. Fike, D.A.; Grotzinger, J.P.; Pratt, L.M.; Summons, R.E. Oxidation of the Ediacaran Ocean. Nature 2006, 444, 744. [Google Scholar] [CrossRef]
  7. Lee, C.; Love, G.D.; Fischer, W.W.; Grotzinger, J.P.; Halverson, G.P. Marine organic matter cycling during the Ediacaran Shuram excursion. Geology 2015, 43, 1103–1106. [Google Scholar] [CrossRef] [Green Version]
  8. Shi, W.; Li, C.; Luo, G.; Huang, J.; Algeo, T.J.; Jin, C.; Zhang, Z.; Cheng, M. Sulfur isotope evidence for transient marine-shelf oxidation during the Ediacaran Shuram Excursion. Geology 2018, 46, 267–270. [Google Scholar] [CrossRef]
  9. Ader, M.; Macouin, M.; Trindade, R.I.F.; Hadrien, M.-H.; Yang, Z.; Sun, Z.; Besse, J. A multilayered water column in the Ediacaran Yangtze platform? Insights from carbonate and organic matter paired δ13C. Earth Planet. Sci. Lett. 2009, 288, 213–227. [Google Scholar] [CrossRef]
  10. Wang, X.; Jiang, G.; Shi, X.; Xiao, S. Paired carbonate and organic carbon isotope variations of the Ediacaran Doushantuo Formation from an upper slope section at Siduping, South China. Precambrian Res. 2016, 273, 53–66. [Google Scholar] [CrossRef]
  11. Derry, L.A. A burial diagenesis origin for the Ediacaran Shuram–Wonoka carbon isotope anomaly. Earth Planet. Sci. Lett. 2010, 294, 152–162. [Google Scholar] [CrossRef]
  12. Macdonald, F.A.; Strauss, J.V.; Sperling, E.A.; Halverson, G.P.; Narbonne, G.M.; Johnston, D.T.; Kunzmann, M.; Schrag, D.P.; Higgins, J.A. The stratigraphic relationship between the Shuram carbon isotope excursion, the oxygenation of Neoproterozoic oceans, and the first appearance of the Ediacara biota and bilaterian trace fossils in northwestern Canada. Chem. Geol. 2013, 362, 250–272. [Google Scholar] [CrossRef] [Green Version]
  13. Zhou, C.; Guan, C.; Cui, H.; Ouyang, Q.; Wang, W. Methane-derived authigenic carbonate from the lower Doushantuo Formation of South China: Implications for seawater sulfate concentration and global carbon cycle in the early Ediacaran ocean. Palaeogeogr. Palaeoclimatol. Palaeoecol. 2016, 461, 145–155. [Google Scholar] [CrossRef]
  14. Cui, H.; Kaufman, A.J.; Xiao, S.; Zhou, C.; Liu, X.-M. Was the Ediacaran Shuram Excursion a globally synchronized early diagenetic event? Insights from methane-derived authigenic carbonates in the uppermost Doushantuo Formation, South China. Chem. Geol. 2017, 450, 59–80. [Google Scholar] [CrossRef] [Green Version]
  15. Kaufman, A.J.; Corsetti, F.A.; Varni, M.A. The effect of rising atmospheric oxygen on carbon and sulfur isotope anomalies in the Neoproterozoic Johnnie Formation, Death Valley, USA. Chem. Geol. 2007, 237, 47–63. [Google Scholar] [CrossRef]
  16. Oehlert, A.M.; Swart, P.K. Interpreting carbonate and organic carbon isotope covariance in the sedimentary record. Nat. Commun. 2014, 5, 4672. [Google Scholar] [CrossRef] [PubMed] [Green Version]
  17. Allen, P.A.; Leather, J.; Brasier, M.D. The Neoproterozoic Fiq glaciation and its aftermath, Huqf supergroup of Oman. Basin Res. 2004, 16, 507–534. [Google Scholar] [CrossRef]
  18. Guerroué, E.L. Sedimentology and Chemostratigraphy of the Ediacaran Shuram Formation, Nafun Group, Oman. Ph.D. Thesis, Swiss Federal Institute of Technology Zurich, Zurich, Switzerland, 2006. [Google Scholar]
  19. Allen, P.A. The Huqf Supergroup of Oman: Basin development and context for Neoproterozoic glaciation. Earth-Sci. Rev. 2007, 84, 139–185. [Google Scholar] [CrossRef]
  20. Grotzinger, J.P.; Al-Siyabi, A.H.; Al-Hashimi, R.A.; Cozzi, A. New model for tectonic evolution of Neoproterozoic-Cambrian Huqf Supergroup basins, Oman. GeoArabia 2002, 7, 241. [Google Scholar]
  21. Bowring, S.A.; Grotzinger, J.P.; Condon, D.J.; Ramezani, J.; Newall, M.J.; Allen, P.A. Geochronologic constraints on the chronostratigraphic framework of the Neoproterozoic Huqf Supergroup, Sultanate of Oman. Am. J. Sci. 2007, 307, 1097–1145. [Google Scholar] [CrossRef] [Green Version]
  22. Minguez, D.; Kodama, K.P. Rock magnetic chronostratigraphy of the Shuram carbon isotope excursion: Wonoka Formation, Australia. Geology 2017, 45, 567–570. [Google Scholar] [CrossRef]
  23. Zhang, F.; Xiao, S.; Romaniello, S.J.; Hardisty, D.; Li, C.; Melezhik, V.; Pokrovsky, B.; Cheng, M.; Shi, W.; Lenton, T.M.; et al. Global marine redox changes drove the rise and fall of the Ediacara biota. Geobiology 2019, 17, 1–17. [Google Scholar] [CrossRef] [PubMed] [Green Version]
  24. Tahata, M.; Sawaki, Y.; Ueno, Y.; Nishizawa, M.; Yoshida, N.; Ebisuzaki, T.; Komiya, T.; Maruyama, S. Three-step modernization of the ocean: Modeling of carbon cycles and the revolution of ecological systems in the Ediacaran/Cambrian periods. Geosci. Front. 2015, 6, 121–136. [Google Scholar] [CrossRef] [Green Version]
  25. Williams, J.J.; Mills, B.J.W.; Lenton, T.M. A tectonically driven Ediacaran oxygenation event. Nat. Commun. 2019, 10, 2690. [Google Scholar] [CrossRef] [PubMed] [Green Version]
  26. Loyd, S.J.; Marenco, P.J.; Hagadorn, J.W.; Lyons, T.W.; Kaufman, A.J.; Sour-Tovar, F.; Corsetti, F.A. Local δ34S variability in 580Ma carbonates of northwestern Mexico and the Neoproterozoic marine sulfate reservoir. Precambrian Res. 2013, 224, 551–569. [Google Scholar] [CrossRef]
  27. Wang, W.; Guan, C.; Zhou, C.; Peng, Y.; Pratt, L.M.; Chen, X.; Chen, L.; Chen, Z.; Yuan, X.; Xiao, S. Integrated carbon, sulfur, and nitrogen isotope chemostratigraphy of the Ediacaran Lantian Formation in South China: Spatial gradient, ocean redox oscillation, and fossil distribution. Geobiology 2017, 15, 552–571. [Google Scholar] [CrossRef] [PubMed]
  28. Husson, J.M.; Maloof, A.C.; Schoene, B.; Chen, C.Y.; Higgins, J.A. Stratigraphic expression of Earth’s deepest δ13C excursion in the Wonoka Formation of South Australia. Am. J. Sci. 2015, 315, 1–45. [Google Scholar] [CrossRef]
  29. Zhao, Y.-Y.; Zhao, M.-Y.; Li, S.-Z. Evidences of hydrothermal fluids recorded in microfacies of the Ediacaran cap dolostone: Geochemical implications in South China. Precambrian Res. 2018, 306, 1–21. [Google Scholar] [CrossRef]
  30. Sui, Y.; Huang, C.; Zhang, R.; Wang, Z.; Ogg, J. Astronomical time scale for the middle-upper Doushantuo Formation of Ediacaran in South China: Implications for the duration of the Shuram/Wonoka negative δ13C excursion. Palaeogeogr. Palaeoclimatol. Palaeoecol. 2019, 532, 109273. [Google Scholar] [CrossRef]
  31. Husson, J.M.; Higgins, J.A.; Maloof, A.C.; Schoene, B. Ca and Mg isotope constraints on the origin of Earth’s deepest δ13C excursion. Geochim. Cosmochim. Acta 2015, 160, 243–266. [Google Scholar] [CrossRef]
  32. Leather, J.; Allen, P.A.; Brasier, M.D.; Cozzi, A. Neoproterozoic snowball Earth under scrutiny: Evidence from the Fiq glaciation of Oman. Geology 2002, 30, 891–894. [Google Scholar] [CrossRef]
  33. Leather, J.J. Sedimentology, Chemostratigraphy, and Geochronology of the Lower Huqf Supergroup, Oman. Ph.D. Thesis, Trinity College, Dublin, Ireland, 2002. [Google Scholar]
  34. McCarron, M.E.G. The sedimentology and chemostratigraphy of the Nafun Group, HuqfSupergroup, Oman. Ph.D. Thesis, University of Oxford, Oxford, UK, 1999. [Google Scholar]
  35. Amthor, J.E.; Ramseyer, K.; Faulkner, T.; Lucas, P. Stratigraphy and sedimentology of a chert reservoir at the Precambrian-Cambrian Boundary: The Al Shomou Silicilyte, South Oman Salt Basin. GeoArabia 2005, 10, 89–122. [Google Scholar]
  36. Kukla, P.A.; Reuning, L.; Becker, S.; Urai, J.L.; Schoenherr, J. Distribution and mechanisms of overpressure generation and deflation in the late Neoproterozoic to early Cambrian South Oman Salt Basin. Geofluids 2011, 11, 349–361. [Google Scholar] [CrossRef] [Green Version]
  37. Dickson, J.A.D. Carbonate identification and genesis as revealed by staining. J. Sediment. Res. 1966, 36, 491–505. [Google Scholar] [CrossRef]
  38. Quye-Sawyer, J.; Vandeginste, V.; Johnston, K.J. Application of handheld energy-dispersive X-ray fluorescence spectrometry to carbonate studies: Opportunities and challenges. J. Anal. At. Spectrom. 2015, 30, 1490–1499. [Google Scholar] [CrossRef]
  39. Rosenbaum, J.; Sheppard, S.M.F. An isotopic study of siderites, dolomites and ankerites at high temperatures. Geochim. Cosmochim. Acta 1986, 50, 1147–1150. [Google Scholar] [CrossRef]
  40. Kim, S.-T.; Mucci, A.; Taylor, B.E. Phosphoric acid fractionation factors for calcite and aragonite between 25 and 75 °C: Revisited. Chem. Geol. 2007, 246, 135–146. [Google Scholar] [CrossRef]
  41. Osburn, M.; Grotzinger, J.; Bergmann, K. Facies, stratigraphy, and evolution of a middle Ediacaran carbonate ramp: Khufai Formation, Sultanate of Oman. Aapg Bull. 2014, 98, 1631–1667. [Google Scholar] [CrossRef] [Green Version]
  42. Frimmel, H.E.; Lane, K. Geochemistry of carbonate beds in the Neoproterozoic Rosh Pinah Formation, Namibia: Implications on depositional setting and hydrothermal ore formation. S. Afr. J. Geol. 2005, 108, 5–18. [Google Scholar] [CrossRef]
  43. Vandeginste, V.; John, C.M.; van de Flierdt, T.; Cosgrove, J.W. Linking process, dimension, texture, and geochemistry in dolomite geobodies: A case study from Wadi Mistal (northern Oman). Bulletin 2013, 97, 1181–1207. [Google Scholar] [CrossRef] [Green Version]
  44. Suchý, V.; Dobeš, P.; Sýkorová, I.; Machovič, V.; Stejskal, M.; Kroufek, J.; Chudoba, J.; Matějovský, L.; Havelcová, M.; Matysová, P. Oil-bearing inclusions in vein quartz and calcite and, bitumens in veins: Testament to multiple phases of hydrocarbon migration in the Barrandian basin (lower Palaeozoic), Czech Republic. Mar. Pet. Geol. 2010, 27, 285–297. [Google Scholar] [CrossRef]
  45. Schoonen, M.A.A. Mechanisms of Sedimentary Pyrite Formation. In Sulfur Biogeochemistry—Past and Present; Geological Society of America: Boulder, CO, USA, 2004; pp. 117–134. ISBN 978-0-8137-2379-2. [Google Scholar]
  46. Li, C.; Love, G.D.; Lyons, T.W.; Fike, D.A.; Sessions, A.L.; Chu, X. A Stratified Redox Model for the Ediacaran Ocean. Science 2010, 328, 80–83. [Google Scholar] [CrossRef] [PubMed] [Green Version]
  47. Lin, Z.; Sun, X.; Peckmann, J.; Lu, Y.; Xu, L.; Strauss, H.; Zhou, H.; Gong, J.; Lu, H.; Teichert, B.M.A. How sulfate-driven anaerobic oxidation of methane affects the sulfur isotopic composition of pyrite: A SIMS study from the South China Sea. Chem. Geol. 2016, 440, 26–41. [Google Scholar] [CrossRef]
  48. Gao, P.; He, Z.; Li, S.; Lash, G.G.; Li, B.; Huang, B.; Yan, D. Volcanic and hydrothermal activities recorded in phosphate nodules from the Lower Cambrian Niutitang Formation black shales in South China. Palaeogeogr. Palaeoclimatol. Palaeoecol. 2018, 505, 381–397. [Google Scholar] [CrossRef]
  49. Guerroué, E.L.; Allen, P.A.; Cozzi, A.; Etienne, J.L.; Fanning, M. 50 Myr recovery from the largest negative δ13C excursion in the Ediacaran ocean. Terra Nova 2006, 18, 147–153. [Google Scholar] [CrossRef]
  50. Bhatia, M.R.; Crook, K.A.W. Trace element characteristics of graywackes and tectonic setting discrimination of sedimentary basins. Contrib. Mineral. Petrol. 1986, 92, 181–193. [Google Scholar] [CrossRef]
  51. Roser, B.P.; Korsch, R.J. Determination of tectonic setting of sandstone-mudstone suites using SiO2 content and K2O/Na2O ratio. J. Geol. 1986, 94, 635–650. [Google Scholar] [CrossRef]
  52. Herron, M.M. Geochemical classification of terrigenous sands and shales from core or log data. J. Sediment. Res. 1988, 58, 820–829. [Google Scholar] [CrossRef]
  53. Roser, B.P.; Korsch, R.J. Provenance signatures of sandstone-mudstone suites determined using discriminant function analysis of major-element data. Chem. Geol. 1988, 67, 119–139. [Google Scholar] [CrossRef]
  54. Armstrong-Altrin, J.S.; Verma, S.P. Critical evaluation of six tectonic setting discrimination diagrams using geochemical data of Neogene sediments from known tectonic settings. Sediment. Geol. 2005, 177, 115–129. [Google Scholar] [CrossRef]
  55. Winchester, J.A.; Max, M.D. Tectonic setting discrimination in clastic sequences: An example from the Late Proterozoic Erris Group, NW Ireland. Precambrian Res. 1989, 45, 191–201. [Google Scholar] [CrossRef]
  56. Condie, K.C. Chemical composition and evolution of the upper continental crust: Contrasting results from surface samples and shales. Chem. Geol. 1993, 104, 1–37. [Google Scholar] [CrossRef]
  57. Floyd, P.A.; Shail, R.; Leveridge, B.E.; Franke, W. Geochemistry and provenance of Rhenohercynian synorogenic sandstones: Implications for tectonic environment discrimination. Geol. Soc. Lond. Spec. Publ. 1991, 57, 173–188. [Google Scholar] [CrossRef]
  58. McLennan, S.M. Relationships between the trace element composition of sedimentary rocks and upper continental crust: Trace element composition and upper continental crust. Geochem. Geophys. Geosystems 2001, 2, 1–24. [Google Scholar] [CrossRef]
  59. Rona, P.A. Criteria for recognition of hydrothermal mineral deposits in oceanic crust. Econ. Geol. 1978, 73, 135–160. [Google Scholar] [CrossRef]
  60. Rona, P.A. Hydrothermal mineralization at seafloor spreading centers. Earth-Sci. Rev. 1984, 20, 1–104. [Google Scholar] [CrossRef]
  61. Crerar, D.A.; Namson, J.; Chyi, M.S.; Williams, L.; Feigenson, M.D. Manganiferous cherts of the Franciscan assemblage; I, General geology, ancient and modern analogues, and implications for hydrothermal convection at oceanic spreading centers. Econ. Geol. 1982, 77, 519–540. [Google Scholar] [CrossRef]
  62. Choi, J.H.; Hariya, Y. Geochemistry and depositional environment of Mn oxide deposits in the Tokoro Belt, northeastern Hokkaido, Japan. Econ. Geol. 1992, 87, 1265–1274. [Google Scholar] [CrossRef]
  63. Boström, K.; Peterson, M.N.A.; Joensuu, O.; Fisher, D.E. Aluminum-poor ferromanganoan sediments on active oceanic ridges. J. Geophys. Res. 1969, 74, 3261–3270. [Google Scholar] [CrossRef]
  64. Yang, B.; Hu, B.; Bao, Z.; Zhang, Z. REE geochemical characteristics and depositional environment of the black shale-hosted Baiguoyuan Ag-V deposit in Xingshan, Hubei Province, China. J. Rare Earths 2011, 29, 499–506. [Google Scholar] [CrossRef]
  65. Pelleter, E.; Fouquet, Y.; Etoubleau, J.; Cheron, S.; Labanieh, S.; Josso, P.; Bollinger, C.; Langlade, J. Ni-Cu-Co-rich hydrothermal manganese mineralization in the Wallis and Futuna back-arc environment (SW Pacific). Ore Geol. Rev. 2017, 87, 126–146. [Google Scholar] [CrossRef] [Green Version]
  66. Jacobsen, S.B.; Kaufman, A.J. The Sr, C and O isotopic evolution of Neoproterozoic seawater. Chem. Geol. 1999, 161, 37–57. [Google Scholar] [CrossRef]
  67. Derry, L.A.; Kaufman, A.J.; Jacobsen, S.B. Sedimentary cycling and environmental change in the Late Proterozoic: Evidence from stable and radiogenic isotopes. Geochim. Cosmochim. Acta 1992, 56, 1317–1329. [Google Scholar] [CrossRef]
  68. Frimmel, H.E. On the reliability of stable carbon isotopes for Neoproterozoic chemostratigraphic correlation. Precambrian Res. 2010, 182, 239–253. [Google Scholar] [CrossRef]
  69. Campbell, I.H.; Squire, R.J. The mountains that triggered the Late Neoproterozoic increase in oxygen: The Second Great Oxidation Event. Geochim. Cosmochim. Acta 2010, 74, 4187–4206. [Google Scholar] [CrossRef]
  70. Hisham, A.A.-S.; John, P.G. New Model for Tectonic Evolution of Neoproterozoic-Cambrian Huqf Supergroup Basins, Oman; AAPG Annual Meeting: Houston, TX, USA, 2002. [Google Scholar] [CrossRef]
  71. Alessio, B.L.; Blades, M.L.; Murray, G.; Thorpe, B.; Collins, A.S.; Kelsey, D.E.; Foden, J.; Payne, J.; Al-Khirbash, S.; Jourdan, F. Origin and tectonic evolution of the NE basement of Oman: A window into the Neoproterozoic accretionary growth of India? Geol. Mag. 2018, 155, 1150–1174. [Google Scholar] [CrossRef]
  72. Loosveld, R.J.H.; Bell, A.; Terken, J.J.M. The Tectonic Evolution of Interior Oman. GeoArabia 1996, 1, 28–51. [Google Scholar]
  73. Mercolli, I.; Briner, A.P.; Frei, R.; Schönberg, R.; Nägler, T.F.; Kramers, J.; Peters, T. Lithostratigraphy and geochronology of the Neoproterozoic crystalline basement of Salalah, Dhofar, Sultanate of Oman. Precambrian Res. 2006, 145, 182–206. [Google Scholar] [CrossRef]
  74. Worthing, M.A. Petrology and geochronology of a Neoproterozoic dyke swarm from Marbat, South Oman. J. Afr. Earth Sci. 2005, 41, 248–265. [Google Scholar] [CrossRef]
  75. Jiang, G.; Sohl, L.E.; Christie-Blick, N. Neoproterozoic stratigraphic comparison of the Lesser Himalaya (India) and Yangtze block (south China): Paleogeographic implications. Geology 2003, 31, 917–920. [Google Scholar] [CrossRef] [Green Version]
  76. Squire, R.J.; Campbell, I.H.; Allen, C.M.; Wilson, C.J.L. Did the Transgondwanan Supermountain trigger the explosive radiation of animals on Earth? Earth Planet. Sci. Lett. 2006, 250, 116–133. [Google Scholar] [CrossRef]
  77. Wang, W.; Cawood, P.A.; Pandit, M.K.; Zhao, J.-H.; Zheng, J.-P. No collision between Eastern and Western Gondwana at their northern extent. Geology 2019, 47, 308–312. [Google Scholar] [CrossRef]
  78. Racki, G.; Racka, M.; Matyja, H.; Devleeschouwer, X. The Frasnian/Famennian boundary interval in the South Polish–Moravian shelf basins: Integrated event-stratigraphical approach. Palaeogeogr. Palaeoclimatol. Palaeoecol. 2002, 181, 251–297. [Google Scholar] [CrossRef]
  79. Yamashita, M.; Ishida, K.; Ishiga, H. Late Early to early Middle Triassic bedded cherts in the Tanba Belt and black organic mudstones in the P/T boundary, Southwest Japan. Geol. Rep. Shimane Univ. 1992, 87–96. [Google Scholar]
  80. Yamashita, M.; Ishiga, H.; Dozen, K.; Ishida, K.; Musashino, M. Geochemical characteristics of organic black mudstones related to the Permian/Triassic boundary in pelagic sediments of Japan. Earth Sci. 1996, 50, 111–124. [Google Scholar] [CrossRef]
  81. Suzuki, N.; Ishida, K.; Shinomiya, Y.; Ishiga, H. High productivity in the earliest Triassic ocean: Black shales, Southwest Japan. Palaeogeogr. Palaeoclimatol. Palaeoecol. 1998, 141, 53–65. [Google Scholar] [CrossRef]
  82. Yudina, A.B.; Racki, G.; Savage, N.M.; Racka, M.; Małkowski, K. The Frasnian-Famennian events in a deep-shelf succession, Subpolar Urals: Biotic, depositional, and geochemical records. Acta Palaeontol. Pol. 2002, 47, 355–372. [Google Scholar]
  83. Burns, S.J.; Matter, A. Carbon isotopic record of the latest Proterozoic from Oman. Eclogae Geol. Helv. 1993, 86, 595–607. [Google Scholar] [CrossRef]
  84. Cozzi, A.; Al-Siyabi, H.A. Sedimentology and play potential of the late Neoproterozoic Buah Carbonates of Oman. GeoArabia 2004, 9, 11–36. [Google Scholar]
  85. Pufahl, P.K.; Hiatt, E.E. Oxygenation of the Earth’s atmosphere–ocean system: A review of physical and chemical sedimentologic responses. Mar. Pet. Geol. 2012, 32, 1–20. [Google Scholar] [CrossRef]
  86. Jones, B.; Manning, D.A.C. Comparison of geochemical indices used for the interpretation of palaeoredox conditions in ancient mudstones. Chem. Geol. 1994, 111, 111–129. [Google Scholar] [CrossRef]
  87. Hoffman, P.F.; Kaufman, A.J.; Halverson, G.P.; Schrag, D.P. A Neoproterozoic snowball earth. Science 1998, 281, 1342–1346. [Google Scholar] [CrossRef] [PubMed] [Green Version]
  88. Riquier, L.; Tribovillard, N.; Averbuch, O.; Devleeschouwer, X.; Riboulleau, A. The Late Frasnian Kellwasser horizons of the Harz Mountains (Germany): Two oxygen-deficient periods resulting from different mechanisms. Chem. Geol. 2006, 233, 137–155. [Google Scholar] [CrossRef]
  89. McFadden, K.A.; Huang, J.; Chu, X.; Jiang, G.; Kaufman, A.J.; Zhou, C.; Yuan, X.; Xiao, S. Pulsed oxidation and biological evolution in the Ediacaran Doushantuo Formation. Proc. Natl. Acad. Sci. USA 2008, 105, 3197–3202. [Google Scholar] [CrossRef] [PubMed] [Green Version]
  90. Bristow, T.F.; Kennedy, M.J. Carbon isotope excursions and the oxidant budget of the Ediacaran atmosphere and ocean. Geology 2008, 36, 863–866. [Google Scholar] [CrossRef]
  91. Wu, N.; Farquhar, J.; Fike, D.A. Ediacaran sulfur cycle: Insights from sulfur isotope measurements (Δ33S and δ34S) on paired sulfate–pyrite in the Huqf Supergroup of Oman. Geochim. Cosmochim. Acta 2015, 164, 352–364. [Google Scholar] [CrossRef] [Green Version]
  92. Osburn, M.R.; Owens, J.; Bergmann, K.D.; Lyons, T.W.; Grotzinger, J.P. Dynamic changes in sulfate sulfur isotopes preceding the Ediacaran Shuram Excursion. Geochim. Cosmochim. Acta 2015, 170, 204–224. [Google Scholar] [CrossRef]
  93. Awan, R.S.; Liu, C.; Gong, H.; Dun, C.; Tong, C.; Chamssidini, L.G. Paleo-sedimentary environment in relation to enrichment of organic matter of Early Cambrian black rocks of Niutitang Formation from Xiangxi area China. Mar. Pet. Geol. 2020, 112, 104057. [Google Scholar] [CrossRef]
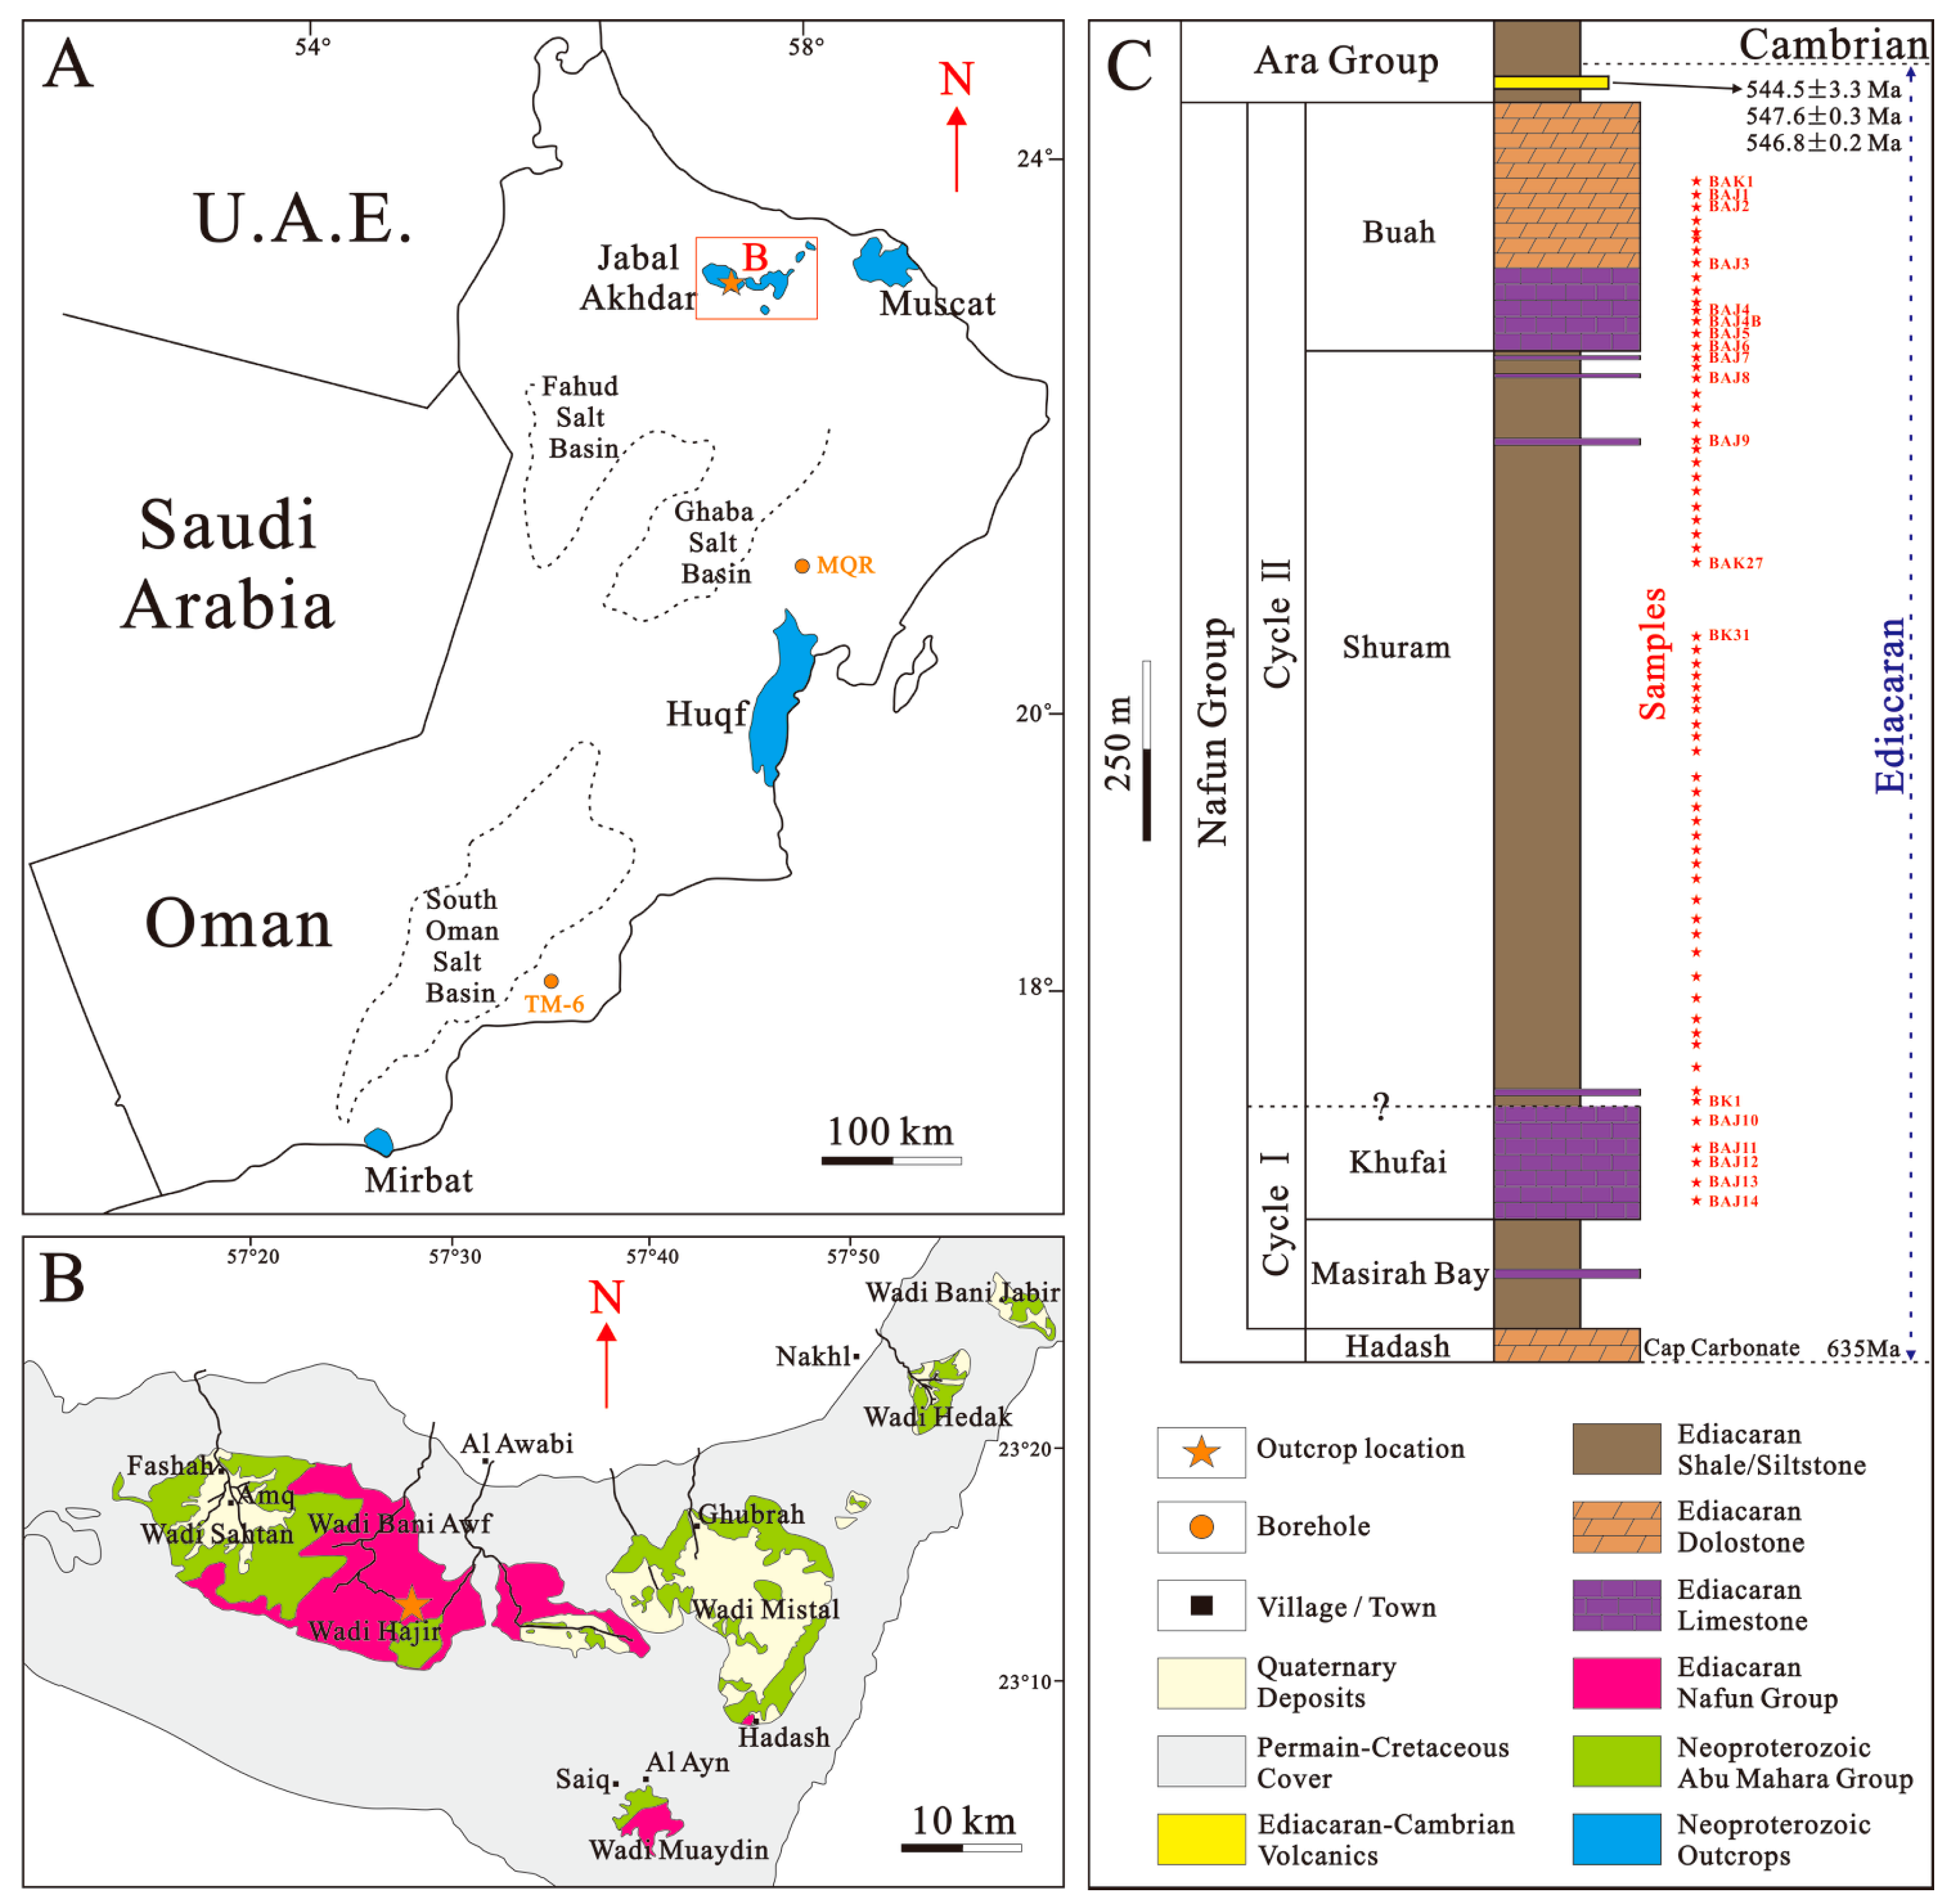
Figure 1. (A) Regional map of Oman with the Neoproterozoic outcrops and salt basins. (B) Schematic geologic map of Jabal Akhdar area. (C) Stratigraphic column of the Nafun Group. Modified after [1,33]; Age data source: [19,21].
Minerals 10 00511 g001
Figure 2. Photomicrograph of the Nafun Group. (A) Sparry limestone, medium-coarsely crystalline, sutured contact, Khufai Formation, orthogonal polarization; (B) Dolomitic limestone, medium crystalline mosaic calcite and finely crystalline dolomite, concave-convex contact, Khufai Formation, polarization; (C) Sparry limestone, medium-coarsely crystalline, abundant veins, residual organic matter, Khufai Formation, polarization; (D) Sparry limestone, wavy organic matter, maroon pyrite, Khufai Formation, polarization; (E) Siltstone, interbedded with same orientation minerals, narrow tabular muscovite, calcareous cementation, Shuram Formation, polarization; (F) Shale overlying sandy limestone, abundant organic matter in the shale, abundant quartz and narrow tabular muscovite crystals in the limestone, all minerals in the same orientation, Shuram Formation, orthogonal polarization; (G) Sandy limestone, very finely crystalline calcite matrix, interbedded with same orientation quartz crystals, Shuram Formation, orthogonal polarization; (H) Limestone, very finely crystalline calcite matrix, laminated quartz and muscovite crystals, pyrites and microorganisms, Shuram Formation, polarization; (I) Limestone, micrite calcite matrix, calcite veins, laminated pyrites, Shuram Formation, polarization; (J) Limestone, micrite calcite overlies finely crystalline calcite, laminated pyrites, Buah Formation, orthogonal polarization; (K) Limestone, finely crystalline calcite matrix, calcite veins, remaining bitumens in the veins, Buah Formation, polarization; (L) Limestone, finely crystalline calcite, laminated abundant quartz and muscovite crystals; microorganisms, sizes range mostly from 10 to 50 µm, occasionally from 200 to 800 µm; Buah Formation, polarization. Mineral abbreviations: Cal: Calcite; Dol: Dolomite; Q: Quartz; M: Muscovite; P: Pyrite; MO: Microorganism.
Minerals 10 00511 g002
Figure 3. (A) Geochemical classification of the sedimentary samples based on the Herron diagram [52]; (B,C) Tectonic setting discrimination diagrams for Shuram Formation shales: major elements [51,53] and trace elements [50]. P1 (mafic): first-cycle basaltic and lesser andesitic detritus; P2 (intermediate): dominantly andesitic detritus; P3 (felsic): acid plutonic and volcanic detritus; P4 (recycled): mature polycyclic quartzose detritus. A1: arc setting, basaltic and andesitic detritus; A2: evolved arc setting, felsitic-plutonic detritus.
Minerals 10 00511 g003
Figure 4. Discriminant diagrams of sediments with the hydrothermal origin. (A) Modified after [59,60,61]; (B) modified after [62].
Minerals 10 00511 g004
Figure 5. Schematic simplification of the tectonic setting of northeastern Oman. Fm. = Formation.
Minerals 10 00511 g005
Figure 6. Geochemical environmental proxies for the Nafun Group.
Minerals 10 00511 g006
Figure 7. Regional Carbon isotope excursion in Oman. Data sources: Huqf (a), [83]; Huqf (b), [34]; Miqrat-1 (MQR), [6,84]; Jabal Akhdar, [18,83]; Thamoud-6 (TM-6), [7]. MQR and TM-6 boreholes in Figure 1A.
Minerals 10 00511 g007
Table 1. Average trace element concentration of the Shuram Formation shales associated with different tectonic settings.
Shuram ShalesOIAACMPMProterozoic ShalesPAASNASC
Rb178306250165160125
Sr14436227472108200142
Ba1155370481255642650636
U40.82.03.23.43.12.7
Cu3929228
Pb12151511272020
Y32151724352735
Nb1459716.81813
Zn102887349
Zr18899146302196210200
Th141.98.58.114.314.612.3
U40.82.03.23.43.12.7
V11318810644100140130
Cr91495529115100127
Ti4852 60004200
Ni70223115526058
The average element concentrations of different settings are from [57]; Proterozoic shales, post-Archean Australian shale (PAAS) and north American average shale (NASC) are from [56,58]. Trace elements in ppm.
Table 2. Reference composite δ13C isotope, δ18O isotope, Mn and Sr data of the Huqf Group in Jabal Akhdar.
FormationCodeLithologyDepth
(m)
IsotopeMn
(ppm)
Sr
(ppm)
Mn/Sr
δ13Cδ18O
BuahBAJ1Dolostone13301.230.09251842.99
BuahBAJ2Dolostone13141.120.00292913.21
BuahBAJ3Dolostone1240−0.88−1.43228892.56
BuahBAJ4Limestone1175−6.11−8.2032217610.18
BuahBAJ4BLimestone1165−6.86−8.6946649570.09
BuahBAJ5Limestone1152−6.83−8.5834029720.11
BuahBAJ6Limestone1127−6.87−10.5446011420.40
ShuramBAJ7Limestone1124−8.46−10.1691614360.64
ShuramBAJ8Limestone1088−10.38−10.96163114481.13
ShuramBAJ9Limestone1001−9.54−14.6616768511.97
KhufaiBAJ10Limestone1055.45−10.5215810710.15
KhufaiBAJ11Limestone797.52−10.3518325710.07
KhufaiBAJ12Limestone537.46−9.7019727120.07
KhufaiBAJ13Limestone277.81−9.9423220190.11
KhufaiBAJ14Limestone54.44−10.2631922190.14