Abstract
The search for a reliable U.S. domestic source of rare earth elements (REE) is necessary to support the demand of advanced energy applications (e.g., catalysts, electronics, magnets). Sedimentary deposits may be sources for selectively recovering REE and critical metals—specifically the interbedded seat rock, or underclay, that underlies or forms the floor of a coal seam. This material is often a major component of coal waste fines and refuse and thus readily available. This study examines several Appalachian Basin underclays associated with actively mined coal seams as potential feedstocks for the REE. Multimodal microanalytical electron microscopy (SEM, FIB-SEM, EMPA) synchrotron-based µXRF, and image processing techniques are coupled with detailed elemental and mineral data to classify the 2D and 3D petrophysical properties of the materials. The REE contents of Appalachian Basin underclays were measured from 235–399 ppm and predominantly observed as discrete REE-bearing minerals such as monazite and xenotime on the order of 10–100 µm in size. These REE-bearing minerals typically accounted for less than 1% of the scanned areas and volumes under SEM and FIB-SEM analysis, with the exception of regions enriched in crandallite. Synchrotron-based µXRF elemental maps further identified several REE deposition environments in different underclays, including micro-scale (10–100 µm) light REEs co-localizing with Ca and P, micro-scale heavy REEs with Fe, and large-scale light REEs (>200 µm) co-localizing with Sr, Ba, Ca and P.
1. Introduction
With the increased use of the rare earth elements (REE) in modern technologies across numerous sectors including energy, automobile, and defense, the criticality of securing reliable sources has moved to the forefront of many nations’ economic outlooks [1,2]. The rare earth metals market was valued at $9 billion in 2019 and is expected to surpass $20 billion by 2024 [3]. A large driver for that market is the end-users of the REEs, namely electronics, magnets, lasers, etc., that are worth an estimated $7 trillion in a global economy worth $75 trillion [4]. The 14 naturally occurring lanthanide elements plus yttrium (Y) and scandium (Sc) that comprise the REE are relatively abundant in the Earth’s crust but generally not found in concentrations economical to mine. Presently, conventional mining efforts have been focused primarily on the ‘hard mineral’ occurrences of the REE, in the form of minerals such as bastnaesite, monazite, xenotime, and carbonatites (e.g., [1,5]). These mineral deposits often must be first subjected to significant processing of the ore to include crushing and grinding, calcining, roasting, flotation separation, and other beneficiation techniques [6]. Following beneficiation, the REE are extracted using strong inorganic acids such as sulfuric acid, H2SO4. Such a process is often heavily capital- and energy-intensive and poses additional handling considerations for waste management and environmental protections.
The weathering of REE-rich host rocks can lead to the accumulation of REE in adjacent aluminosilicate-rich clay deposits. During weathering, REE ions can potentially be re-mobilized and redeposited onto active surfaces of clay-rich soil or sediments. These clay-rich deposits can contain elevated concentrations of ion-adsorbed REE as well as REE bearing colloids (e.g., Fe, Mn-oxides) and crystalline minerals (e.g., REE-phosphates). In the geologic past, the weathering of REE-rich igneous rocks led to the formation of aluminosilicate-rich clays in soils and laterites. These clay-rich deposits can contain up to 80–90% of their REEs in various adsorbed states (exchangeable, colloid, mineral). China has the largest REE reserves of an estimated 44 million tons, and produced approximately 63% of the world total mine production of REE in 2019 [7]. As recently as 2008, alternative deposits located in southern China were found to contain a significant portion of ion-adsorbed REEs [8]. These weathered crust deposits are readily amenable to ion exchange reactions using salts such as ammonium sulfate, (NH4)2SO4, and exchanging REE ions from the surfaces of clay minerals [8]. While lower grades (0.05 to 0.2 wt%) than conventional hard mineral deposits (>7 wt% REE as oxides), ion-adsorbed clay deposits host a significant enrichment of heavier mass REE [5,9].
Easily recoverable ion-adsorbed REE were also noted for certain coal underclays and roof rock material in the U.S. [10]. Rozelle et al. (2016) demonstrated that, in some cases, >90% of the REE could be recovered from coal underclays and roof rock using (NH4)2SO4 as an ion exchange lixiviant [10]. Additional studies on REE occurrences in underclays, however, have identified significantly lower amounts (e.g., <10%) of ion-adsorbed REE [11,12]. The amount of ion-adsorbed REE present is likely to vary from sample to sample. However, the historical extent and large volume of reject waste from U.S. coal production presents a large source of easily accessible material with the potential to provide additional streams of domestic source of REEs and other critical elements. According to the Appalachian Region Independent Power Producers Association, the Pennsylvania Department of Environmental Protection states that there are 840 such coal refuse piles overlying nearly 10,000 acres of abandoned mine lands and scattered throughout PA’s anthracite and bituminous coalfields [13]. The amount of coal refuse in Pennsylvania is estimated to be 2 billion cubic yards [13]. The amount of REE present in these refuse piles and associated waste rock has been measured between 200 and 500 ppm (this work). Comparatively, world averages for coal and coal ash contain approximately 68 and 404 ppm of REE, respectively, with US averages at 62 and 517 ppm, respectively [4].
In this study, the composition of several underclays from the Appalachian Basin are analyzed from a microscopic workflow to visually document and characterize the modes of occurrence of REEs. Distributed occurrences of REE-bearing minerals (~100–200 µm), such as monazite and xenotime embedded in the clay matrix, are interpreted as representing the detrital loading of REE materials from the time of deposition. In addition, occurrences of REE-bearing minerals (presumedly rhabdophane and churchite) in altered material of pore-filling spaces is also documented. This textural relationship is interpreted to signify the formation of in situ authigenic minerals during diagenesis or later alterations or weathering and provides evidence for the mobility of the REEs, including potentially onto the abundant surfaces of the clay matrix. Such interpretations and observations are vital to designing an extraction process targeting REE phases and maximizing extraction efficiencies.
1.1. Appalachian Basin
The Appalachian Basin formed ~480 million years ago (Ma) at a time when the North American continent straddled the equator on a passive plate margin and the inland sea harbored warm, tropical waters. Initial basin formation at the onset of the Taconic Orogeny during the Middle Ordovician Period (458–470 Ma) was triggered when the Iapetus oceanic plate collided with and subducted under the North American plate [14]. Clastic deposition during this period was derived from a sediment supply from the eastern highlands [15]. Paleosols deposited during this time would serve as the underlying strata (i.e., underclays) to large peat mires deposited during the Pennsylvanian Period (360–300 Ma) that would later form the major coal beds of the Appalachian Basin in the present day.
1.2. Study Units
Study units were selected from four widely dispersed areas within the Appalachian basin focusing on target coals with known elevated REE values based on personal communication, previous work, and legacy coal chemistry data stored at the West Virginia Geological and Economic Survey (WVGES). Final selection of West Virginia samples was limited to cores available at the WVGES core facility. Scope was further limited to zones from areas suspected to have high REE concentrations and focused on paleo-laterite deposits, seat earths, and underclays where, based on modern production practices, the REE are known to accumulate. Samples from Pennsylvania obtained from the Pittsburgh and Brookville coal seams, were selected to include a regional survey of underclays in the Appalachian Basin (Table 1).

Table 1.
Sample designations, associated coal seams, and location.
Six coals horizons were selected to be sampled: the Pittsburgh, Lower Freeport, Middle Kittanning, Brooksville, No 5 Block coal and the lower split of the No. 5 Block. A total of 8 samples were collected from West Virginia and Pennsylvania. Six samples were collected from 3 cores stored at the West Virginia Geological and Economic Survey. Three samples were from south-western Ritchie County in western West Virginia targeting the Allegheny Formation Lower Freeport, Middle Kittanning, and Monongahela Formation Pittsburgh coal paleosols. Coal has never been mined in this portion of the state due in part to depth, accessibility issues and market considerations.
Two samples were from north central Kanawha County in southern West Virginia in the Allegheny Formation No. 5 Block and No. 5 Block Lower split underclays, while the sixth sample was located in Barbour County in north central West Virginia in seat earth below the Allegheny Lower Freeport horizon (Figure 1). Both areas are highly developed coal fields. The final two samples were collected in Pennsylvania from the Pittsburgh and Brookville coal seams.
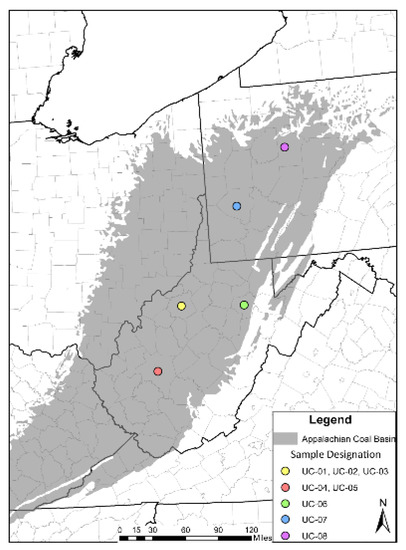
Figure 1.
Map of the Appalachian coal basin and the location of samples designated in Table 1.
2. Methods
2.1. Bulk Geochemical Composition
Samples from the 5 Block coal (UC-04, UC-05), Pittsburgh (in Pennsylvania, UC-07), and Brookville (UC-08) underclays were crushed and ground to pass through a 100-mesh sieve and subjected to a lithium metaborate fusion method. Major and minor elements, including the REEs, were analyzed via inductively coupled plasma—optical emission spectroscopy (ICP-OES) and inductively coupled plasma—mass spectroscopy (ICP-MS). Bulk REE values for the Lower Freeport (UC-01, UC-06), Middle Kittanning (UC-02) and Pittsburgh (in West Virginia, UC-03) underclays were reported in Montross et al., in review [16]. Accurate determination of Pr and Tb were impinged by the presence of Xe in the Ar plasma gas, causing polyatomic interferences on the masses of Pr and Tb. These two elements were omitted from the total REE content reported, with a subsequent added uncertainty of ±7% for the Pennsylvania Pittsburgh (UC-07) and Brookville (UC-08) samples and an added uncertainty of ±0.4% for UC-01 through UC-06.
Carbon and sulfur contents were analyzed on ground and powdered samples using a LECO CS744 Carbon and Sulfur Analyzer. Inorganic carbon was removed after treatment with acid vapors; ~0.5 g of powder were weighed into glass scintillation vials and placed into a desiccator with 12 M hydrochloric acid (HCl). The powders reacted with the vapor at room temperature for 72 h.
2.2. XRD
Bulk and oriented clay mineralogy of the 5 Block coal (UC-04, UC-05), Pittsburgh (in Pennsylvania, UC-07), and Brookville (UC-08) underclays were determined through X-ray diffraction (XRD) of both randomly oriented and oriented mounts. Each sample was ground and powdered using a McCrone micronizing mill to pass through a 400 mesh (38 µm) sieve. Oriented mounts for clay mineral identification were prepared through density separations of <2 µm size fraction following the procedures outlined in Poppe et al., 2001 [17]. Semi-quantitative bulk mineralogies of the samples were obtained on a Rigaku III Ultima diffractometer equipped with a Cu anode. The samples were scanned at 40 kV, 44 mA utilizing Cu radiation over a range of 4.0 to 70 degrees (2-theta) in step sizes of 0.02 degrees and scan times of 2.4 s/step. After confirming the diffraction patterns of all 8 received samples were identical to that of the supplied reference spectra, an additional sample was prepared with 10% by weight of corundum (α-Al2O3) for quantitative XRD analysis. Phase IDs, peak alignments, and mineral identifications were made using the RockJock computer program.
2.3. Microscopy and Microanalysis
All underclay samples were mounted in epoxy circles of ~1 inch in diameter and polished down to 1 µm using a diamond suspension. The mounted polished samples were then coated with ~10 nm of palladium using an evaporative coater. The samples were imaged using an FEI Inspect-F field emission scanning electron microscope (FE-SEM), equipped with an Oxford Instruments X-ray Microanalysis system with an Energy Dispersive X-ray spectrometer (EDS). The samples were scanned in a serpentine pattern across the entirety of the mounted sample. FE-SEM operating conditions were an accelerating voltage of 20 kV at a spot size of 5 µm. Wavelength dispersive spectroscopy (WDS) was performed using a JEOL 8530F Plus Hyper Probe electron probe microanalysis system (EPMA). Certified rare earth elements standards for phosphates (REEP25-15+FC, Astimex Standards Ltd.) and oxides (Standard block #489, Geller Microanalytical Laboratory) were utilized for Standard-based quantitative spectroscopy.
Mounted and polished samples were also sent to the CAMCOR imaging facilities at the University of Oregon for analysis by focused ion beam scanning electron microscopy (FIB-SEM) to reconstruct volumetric apportionments of different mineral and pore spaces. FIB-SEM analysis was performed using a FEI Helios 600i dual beam microscope over a ~20 µm × 20 µm area and slice thickness of ~15 nm (pixel size: 9.97 nm, voxel size: 1.49 µm3). A total of 15 sub-volumes were reconstructed across the 8 Central Appalachian Basin underclays.
Advanced image processing of images collected from FE-SEM and FIB-SEM analysis was conducted using the PerGeos 1.7.0 software from ThermoFisher. Mineral phases were segmented and assigned according to grayscale threshold values and correlated with EDS spot analyses and elemental maps collected on the FE-SEM. Both 2D montage images obtained on the FE-SEM and 3D image stacks from the FIB-SEM were segmented and processed. The 2D montage images were collected and collated using Oxford Instruments AZtec software. Images at 1000× magnification were stitched together over areal extents of ~30 µm2.
Selected underclay samples were prepared into doubly-polished thin-sections (30-µm thick, by Spectrum Petrographics, Inc.) for micro X-ray fluorescence (μ-XRF) elemental mapping at the Stanford Synchrotron Radiation Lightsource (SSRL). The thin sections were first mapped at beam line (BL) BL 10-2 with 50 µm diameter beam at an excitation energy of 18,200 eV and 50 ms dwell time for large-scale REE deposition environments. Selected regions of interests found in BL10-2 were then mapped at BL 2-3 with 5 µm diameter beam at excitation energy of 18,200 eV and 100 ms dwell time for micro-scale REE deposition environments. Both BL stations were equipped with Si(1,1,1) crystal and single-element Si Vortex detector, and operated in an air-atmosphere. The μ-XRF maps were processed using PyMCA fitting [18] and re-imaged utilizing Sam’s Microanalysis Toolkit (SMAK) [19] for elemental maps (e.g., Al, Si, P, S, K, Ca, Ti, Mn, Fe K lines and the Ba, La, Ce, Nd, Sm, Gd, and Lu L lines at excitation energy of 9500 eV, and Sr, Y and Zr K lines at excitation energy of 18,200 eV). Additional details on the analysis methodology can be found in Stuckman et al. (2018) [20].
3. Results
3.1. Carbon and Sulfur Geochemistry
The total carbon, organic carbon, inorganic carbon (by subtraction), and total sulfur contents are reported in Table 2.
Table 2.
Carbon and Sulfur Geochemistry of the Appalachian Basin underclays.
3.2. Bulk REE Geochemistry
The cumulative sum of the 14 naturally occurring lanthanide elements plus yttrium, denoted as REE, ranged from 235 ppm to 399 ppm in the investigated Appalachian Basin underclays (Table 3). Following conventions defined in Seredin and Dai (2012) [21], the light REE (LREE: La, Ce, Pr, Nd, Sm), middle REE (MREE: Eu, Gd, Tb, Dy, Y), and heavy REE (HREE: Ho, Er, Tm, Yb, Lu) are also reported. These values of REE are slightly elevated relative to typical concentrations of REEs (~169 ppm) found in the continental crust [22]. Full values for individual elements are reported in the Supplementary Information (Table S1). These underclay REE values may be compared to averages of REE concentrations in world coals of 68.5 ppm, and to the average REE concentration of US coals of 62.1 ppm [21]. Studies on the mineral associations of REE in coal have generally noted the major association of the REE with the inorganic (i.e., ash) portion of the coal measure [23].
Table 3.
Summary of REE content in Appalachian Basin underclays.
3.3. Semi-Quantitative XRD Results
An XRD analysis of powdered, randomly oriented Appalachian Basin underclays revealed the dominant crystalline components to be quartz, calcite, ilmenite, illite, smectite, and kaolinite (Table 4). Clay minerals comprised greater than 55% of the sample material.
Table 4.
Semi-quantitative XRD results: Major (Ma) (>50%)-Intermediate (In) (25–50%) Minor (Mn) (5–25%)-Trace (Tr) (<5%). Qtz = quartz, Kspar = potassium (K) feldspar, Plag = plagioclase (Ca/Na) feldspar.
3.4. REE Mineral Phases in Appalachian Basin Underclays
In the 5 Block coal (UC-04, UC-05), Pittsburgh (in Pennsylvania, UC-07), and Brookville (UC-08) underclays monazite ((Ce,La,Nd)PO4), xenotime (YPO4), and crandallite (REE-CaAl3(PO4)(PO3OH)(OH)6) were identified through FE-SEM/-EDS analyses as the primary discrete mineral occurrences of the REEs. These general phases agree with observations from the Lower Freeport (UC-01, UC-06), Middle Kittanning (UC-02) and Pittsburgh (in West Virginia, UC-03) underclays as reported in Montross et al. (in review) [16] and suggest a common mode of occurrence for the REEs in this limited regional extent of underclay samples in the Appalachian Basin. No REE were identified in zircon grains. In some occurrences, the monazite and xenotime grains are observed as 10–100 µm grains embedded in a matrix of clay, with the clay morphologies wrapping around the REE phosphate mineral (Figure 2). Crandallite, an altered aluminum phosphate mineral, was also noted (Figure 2C).

Figure 2.
REE-bearing minerals observed and identified in the Central Appalachian Basin underclays including monazite (A), xenotime (B), and crandallite (C).
In other cases, REEs were observed to be associated with mineral grains encapsulated in the pore spaces of the underclay material. These occurrences are inferred to have formed in-situ during diagenetic or other alteration processes such as fluid infiltration. Subsequently the mineral forms are presumed to be the hydrated forms of monazite and xenotime (rhabdophane (Ce,La)PO4*H2O), churchite (YPO4*2H2O), respectively). Delineation between the hydrated and non-hydrated forms of the REE-phases is difficult through SEM-EDS analyses alone and is further deduced using EPMA (Section 3.7).
Additional evidence for alteration in these underclay samples included observations of fracture-filling clays (Figure 3). These fracture-filling clays are distinctly different from the surrounding clay matrix, having well-defined laminations oriented orthogonally to the plane of view and often included crystallites of high-density minerals such as pyrite.

Figure 3.
Fracture-filling clay with pyrite crystallites (bounded approximately by the orange markers) in Central Appalachian Basin underclay.
3.5. 2D Areal Extent of Mineral Phases in Appalachian Basin Underclays
Areal estimations for the pore space and mineral phases in the Appalachian Basin underclays are reported in Table 5. Phase segmentations based on grayscale values using the PerGeos image processing software were classified into three groups: (1) pore spaces and organic matter; (2) matrix minerals to include clays, quartz, and feldspars; (3) high-density minerals to include Fe-oxides, pyrite, zircon, and any REE-bearing phases. As FE-SEM operating conditions were optimized towards imaging high atomic number phases, delineation between pore spaces and carbonaceous organic matter (i.e., coal) in grayscale values was difficult to achieve, subsequently these two phases were combined into a single classification during segmentation. Similarly, for the large-scale 2D mapping of the underclay samples, the REE-bearing minerals were grouped with other high-density minerals to simplify the distribution estimates due to the extended acquisition time required for EDS measurements over large areas. Areal extents of high-density minerals, to include REE-bearing minerals, was typically low for these Appalachian Basin underclays, usually less than 5% of the scanned area, except for the Lower Freeport (UC-06) sample where large occurrences of Fe-oxide and Ca-oxide account for nearly 17% of the scanned surface area (Table 4). Where identified and confirmed with EDS analyses, the average grain size of the REE-bearing minerals was typically <100 µm in characteristic length. An example compilation of a 2D montage and phase segmentation is shown in Figure 4.
Table 5.
Areal extents of phase classifications.

Figure 4.
2D montage over a 2 mm × 2 mm area in UC-03. False color image of segmented phases from processing in PerGeos: light blue—pore spaces and organic matter; dark blue—matrix material (e.g., clay and quartz); red—high-density minerals (e.g., pyrite, zircon); green—REE-bearing minerals. Insets show BSE (top) and false color (bottom) images of a magnified region containing a monazite crystal.
3.6. 3D Volumetric Reconstructions
As with the segmentation of the 2D areal scans of the Appalachian Basin underclays, segmentation of the 3D reconstructed volumes utilized the same three classifications (Table 6). Porosity/organic matter content was typically below 3% in the sub-volumes analyzed but ranged from 0.2 to 5.7%. Matrix phases (e.g., clay) comprised the majority of the sub-volumes scanned, accounting for >90% of the total volume. In cases where REE-bearing minerals were identified through EDS analyses, REE phases accounted for less than 1% of the scanned volume. The exception was the Middle Kittanning underclay (UC-02) where 20% of the scanned volume was attributed to the REE-bearing mineral crandallite. The volumes in the Middle Kittanning underclay (~20 µm by 20 µm areas) contained abundance of crandallite. This discrepancy is attributed to non-representative sampling and will be addressed briefly in the next section. An example reconstruction and segmentation of a 3D volume is shown in Figure 5.
Table 6.
Data generated from 3D volumetric reconstruction phase segmentation from individual 2D backscattered image slices. The averaged volumetric % come from multiple sub-volumes.
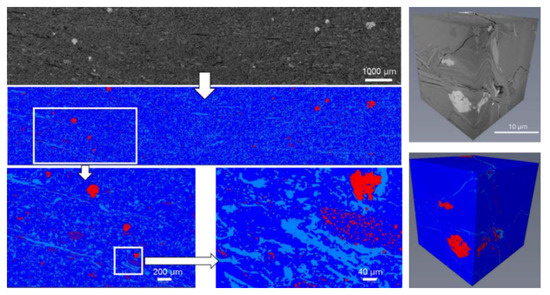
Figure 5.
2D and 3D backscattered montaged image compared to the segmented reconstruction of the Pittsburgh underclay (UC-07). Pores (light blue), matrix (dark blue), and high density and REE-bearing phases (red).
3.7. Electron Microprobe Results
Electron microprobe analysis (EPMA/WDS) was carried out on targeted regions identified as containing REE phases in the 2D analyses described above. WDS was utilized to identify the particular constituents of REE enrichment and the type of environment (e.g., specific mineral forms) they exist in. This data then can be used to help elucidate the most promising geologic formations for REE recovery. In the samples analyzed, the REE phases are generally observed as 5–50 µm size grains of apatite, monazite, and rhabdophane throughout the matrix. In the Pittsburgh coal seam underclay (UC-07), EPMA/WDS analyses also detected REE (Dy, Er, Tb) present in chalcopyrite (Figure 6).

Figure 6.
EPMA-WDS quantitative elemental mapping of Pittsburgh underclay (UC-07). Scale bar is 10 microns. Analysis conditions 20 keV, 45 nA, map dwell time = 250 ms.
3.8. Synchrotron Results
Synchrotron-based µXRF analysis conducted on the Lower Freeport (UC-01) and Middle Kittaning (UC-02) underclays identified unique large-scale (>200 µm) zones of light REE (e.g., Ce, La, Nd and Sm) co-localized with Sr and Ba (Figure 7). Further analysis with finer resolution (Figure 7C) detailed light REE co-localized with Ca, P, and Ba, whereas heavy REE (e.g., Sm, Yb, Gd and Lu) co-localized with Fe and occasionally S. This fractionation pattern of the REE was similar in both underclay samples examined. Additionally, µXRF on the Lower Freeport (UC-01) underclay identified Ce as occurring in the Ce(+4) oxidation state rather than the Ce(+3) observed previously in coal related material [20] (Figure 8). Additional analyses are ongoing to confirm initial results.

Figure 7.
(A) Photo of thin section of UC-01, Lower Freeport, highlighting Area B for µXRF mapping at BL10-2; (B) Tri-colored µXRF maps (Ce in red, Fe in green and Sr in blue) at BL10-2 with 50 µm step size, 50 ms dwell time at excitation energy of 18,100 eV. The scale bar is 2000 µm. Ce is co-localizing with Sr and Ba, demonstrated by the purple color on the tri-colored map. Highlighted box is mapping area C at BL2-3; (C) µXRF elemental maps at BL2-3 with 5 µm step size, 50 ms dwell time at excitation energy of 9500 eV. The scale bar is 100 µm. The color scale on each map from blue to yellow to red represents XRF signal intensity from low to high, as displayed in all other µXRF maps.

Figure 8.
Synchrotron µXRF maps of selected REEs and major elements in UC-02 at BL 2-3 3 with 5 µm step size, 50 ms dwell time at excitation energy at 9500 eV. The scale bar is 100 µm. Spots in empty circles are Ce hotspots 78_As1 as Ce(+3) in Ca-rich aluminosilicates and 78_As2 as Ce(+4) oxide, independent of glass phase, with µXANES collected. The color scale on each map from blue to yellow to red represents XRF signal intensity from low to high, as displayed in all other µXRF maps. Light REE spots (e.g., Ce, La, Nd and Sm) in empty circle are co-localizing with Ca, P and Ba, whereas heavy REE spots (e.g., Gd, Lu and Tb) in empty square are co-localizing with Fe and S.
In general, REE distributions found in µXRF analysis agreed with the microanalysis results indicating that the REE dominantly existed as in REE-bearing minerals 10–100 µm in size and imbedded in aluminosilicate clay matrix.
4. Discussion
4.1. Modes of Occurrence for the REE
The textural relationships described in Figure 2 of REE-bearing minerals embedded in a clay matrix suggest a clastic or detrital origin of these mineral grains deposited prior to the deposition of the coal-forming peat layers and subsequently preserved through coalification or lithification. From these detrital minerals, we infer a baseline signal of REEs relevant to the clastic input to the Appalachian Basin during the time of deposition and absent alteration through diagenetic or later hydrologic processes. In other instances, alteration products such as crandallite and fracture-filling clays (Figure 3) indicate an environment wherein the mobilization and redistribution of REEs is required, though the nature of the remobilization cannot be surmised through SEM imagind and textural relationships alone.
The additional evidence from µXRF analyses showing the existence of Ce in the +4 oxidation state supports the potential remobilization for REEs. Ce can be oxidized, often through microbial activity, to the +4 oxidation state, whereby the Ce(+4) species is relatively more particle reactive and often displays positive Ce anomalies in the solid state [24,25]. The presence of Ce(+4) in the underclay could signify an oxic and/or microbially active depositional environment. The co-localization of heavy REEs with Fe could also potentially point towards REEs sorbing to the surface of clay matrices or onto the crystal lattices of secondary minerals (e.g., phyllosilicates, Al-Fe-hydroxides) as described by Yu et al. (2017) [26].
In such an environment promoting the mobilization and redistribution of the REEs, dissolved REEs present in the fluid phase may have also sorbed to the surfaces of the clay minerals. Clays provide a ready surface for ion exchange and have been shown to be readily amenable to the uptake of metal species [27,28]. Whereas the light- and middle- REEs are more prone to being incorporated into authigenic minerals, the heavy-REEs are more likely to be stabilized as dissolved REE-complexes in solution and thus accumulate in the fluid phase [25,29]. The mechanism driving this difference in REE reactivities across the series is the lanthanide contraction of ionic radii with increasing atomic number [24]. This fractionation would leave a heavy REE-laden fluid phase that is then susceptible to ion-adsorption onto the surfaces of clay minerals. Such occurrences of ion-adsorbed REEs are observed in the real world in the weathered crusts of southern China [8]. While FE-SEM/EDS techniques have limited abilities to discern ion-adsorbed elements in trace concentrations, the circumstantial lines of evidence relating to in-situ authigenically-formed REE-minerals and the clay lithology of these Appalachian Basin underclays support the inference that at least a fraction of REEs that may be ion-adsorbed and thus easily-accessible.
More work is necessary to confirm and precisely characterize the potential for ion-adsorbed REEs but the significance of such an easily accessible fraction pertains to the ability to extract and process the REEs economically. Pilot studies, in fact, have demonstrated the ability to recover ion-adsorbed REEs from underclays associated with coal production in the U.S. using ion-exchange methods [10]. The lack of a significant fraction of ion-adsorbed REE in underclays, as shown in these Appalachian Basin underclays, would signal a need to re-evaluate potential extractions of REE from underclay resources. Any potential extraction schemes would likely need to target the hard mineral phases of REE as noted and described here.
4.2. Limitations and Utility to 2D and 3D Reconstructions
One consistent and valid critique to extending microanalytical techniques across large areas and volumes is the heterogeneity displayed in most geological samples, particularly exacerbated at the micro-scale. The scanned areas and volumes reported here are not necessarily representative of the underclay sample as a whole, nor are they purported to be. However, such exercises in estimating areal and volumetric extents are useful in illustrating the density of specific phases (i.e., REE-bearing minerals) as well as the general grain size of the identified phases. In the case of the Appalachian Basin underclays, the identified occurrences of monazite (rhabdophane) and xenotime (churchite) were generally observed at grain sizes of 10–100 µm and occupying less than 1% of the scanned areas and volumes. For the Middle Kittanning (UC-02) underclay, crandallite was similarly observed to be between 5–50 µm. Extrapolation of this information is useful from an extractive metallurgy standpoint: knowledge of the grain size of target minerals is useful to guiding grind sizes needed; knowledge of the matrix composition and approximate porosity is useful to evaluating hydrodynamic properties.
5. Conclusions
The Central Appalachian Basin underclays in this study had measured REE content ranging from 235–399 ppm. The clay mineral composition of these underclays were measured via XRD as comprising >55% of the bulk mineralogy and consisting of illite, halloysite, and kaolinite. REE phases were dominantly observed as discrete REE-bearing minerals in the 10–100 µm size range imbedded in the aluminosilicate clay matrix. FE-SEM analyses showed REE detected within carbonate and aluminum phosphate alteration minerals. Light REE were shown to be associated with Sr, Ba, Ca, and P, whereas heavy REE were associated with Fe and occasionally S from µXRF analyses. Though these microanalytical techniques are limited in scope, the relationships observed can inform interpretations for REE occurrences in the Central Appalachian Basin coal measures. While the majority of the REE content is attributable to original detrital signals in REE-bearing minerals (10–100 µm), evidence for weathering products and diagenetic alteration such as crandallite indicate a portion of REE that might also exist in association with authigenic minerals or adsorbed to the surface of clay.
Supplementary Materials
The following are available online at https://www.mdpi.com/2075-163X/10/6/546/s1, Table S1: Bulk REE content of Appalachian Basin underclays in study.
Author Contributions
Formal analysis, J.Y., S.M., M.S., C.L, C.V.; Investigation, J.Y., S.M., M.S., C.L., C.V.; Project administration, C.V.; Resources, J.B.; Writing, J.Y., S.M., J.B., M.S., C.V. All authors have read and agreed to the published version of the manuscript.
Funding
This report was prepared as an account of work sponsored by an agency of the United States Government. Neither the United States Government nor any agency thereof, nor any of their employees, makes any warranty, express or implied, or assumes any legal liability or responsibility for the accuracy, completeness, or usefulness of any information, apparatus, product, or process disclosed, or represents that its use would not infringe privately owned rights. Reference herein to any specific commercial product, process, or service by trade name, trademark, manufacturer, or otherwise does not necessarily constitute or imply its endorsement, recommendation, or favoring by the United States Government or any agency thereof. The views and opinions of authors expressed herein do not necessarily state or reflect those of the United States Government or any agency thereof.
Acknowledgments
This technical effort was performed in support of the National Energy Technology Laboratory’s ongoing research for the Department of Energy Rare Earth Elements Program. We thank Mary Anne Alvin (DOE Rare Earths Technology Manager), Thomas Tarka (REE FWP Technical Portfolio Lead), and Mark McKoy for their support. We would also like to thank Amy Plechacek, Henri Sanville, Morgan Olsen (NETL-Albany) for assistance with imaging. This research was supported in part by a postdoctoral appointment to JY to the National Energy Technology Laboratory Research Participation Program, sponsored by the U.S. Department of Energy and administered by the Oak Ridge Institute for Science and Education.
Conflicts of Interest
The authors declare no conflicts of interest.
References
- Bauer, D.; Diamond, D.; Li, J.; Sandalow, D.; Telleen, P.; Wanner, B. U.S. Department of Energy Critical Materials Strategy; USDOE: Washington, DC, USA, 2010. [CrossRef]
- Long, K.; Van Gosen, B.; Foley, N.; Cordier, D. The Principal Rare Earth Elements Deposits of the United States: A Summary of Domestic Deposits and a Global Perspective. In Non-Renewable Resource Issues; Springer: Berlin/Heidelberg, Germany, 2012; pp. 131–155. [Google Scholar] [CrossRef]
- Pulidindi, K.; Pandey, H. Rare Earth Metals Market Size By Metal (Cerium, Dysprosium, Erbium, Europium, Gadolinium, Holmium, Lanthanum, Lutetium, Neodymium, Praseodymium, Promethium, Samarium, Scandium, Terbium, Thulium, Ytterbium, Yttrium), By Applications (Magnets, Colorants, Alloys, Optical Instruments, Catalysts), Industry Analysis Report, Regional Outlook, Growth Potential, Price Trends, Competitive Market Share & Forecast, 2017–2024. Global Market Insights. 2017. Available online: https://www.gminsights.com/industry-analysis/rare-earth-metals-market?utm_source=globenewswire.com&utm_medium=referral&utm_campaign=Paid_Globnewswire (accessed on 11 March 2020).
- Ganguli, R.; Cook, D.R. Rare Earths: A Review of the Landscape. MRS Energy Sustain. 2018, 5. [Google Scholar] [CrossRef]
- Moldoveanu, G.; Papangelakis, V. Recovery of rare earth elements adsorbed on clay minerals: I. Desorption mechanism. Hydrometallurgy 2012, 117–118, 71–78. [Google Scholar] [CrossRef]
- Jordens, A.; Cheng, Y.P.; Waters, K.E. A review of the beneficiation of rare earth element bearing minerals. Miner. Eng. 2013, 41, 91–114. [Google Scholar] [CrossRef]
- U.S. Geological Survey (USGS). Rare Earths Mineral Commodity Summaries/Minerals Yearbook, Various Issues. 2020. Available online: http://minerals.usgs.gov/minerals/pubs/commodity/rare_earths/ (accessed on 11 March 2020).
- Bao, Z.; Zhao, Z. Geochemistry of mineralization with exchangeable REY in the weathering crusts of granitic rocks in South China. Ore Geol. Rev. 2008, 33, 519–535. [Google Scholar] [CrossRef]
- Krishnamurthy, N.; Gupta, C.K. Extractive Metallurgy of Rare Earths, 2nd ed.; CRC Press: Boca Raton, FL, USA, 2015; 839p, ISBN 9781466576346. [Google Scholar]
- Rozelle, P.; Khadikar, A.; Pulati, N.; Soundarrajan, N.; Klima, M.; Mosser, M.; Miller, C.; Pisupati, S. A Study on Removal of Rare Earth Elements from U.S. Coal Byproducts by Ion Exchange. Metall. Mater. Trans. E 2016, 3, 6–17. [Google Scholar] [CrossRef]
- Yang, X.; Werner, J.; Honaker, R. Leaching of rare earth elements from an Illinois basin coal source. J. Rare Earths 2019, 37, 312–321. [Google Scholar] [CrossRef]
- Finkelman, R.B.; Palmer, C.A.; Wang, P. Quantification of the modes of occurrence of 42 elements in coal. Int. J. Coal Geol. 2018, 185, 138–160. [Google Scholar] [CrossRef]
- Appalachian Region Independent Power Producers Association (ARIPPA). Coal Refuse Whitepaper. 2018. Available online: https://arippa.org/wp-content/uploads/2018/12/ARIPPA-Coal-Refuse-Whitepaper-with-Photos-10_05_15.pdf (accessed on 2 April 2019).
- Ettensohn, F.R. The Catskill delta complex and the Acadian orogeny: A model. In The Catskill delta: Geological Society of America Special Paper 201; GeoScienceWorld: McLean, VA, USA, 1985; Volume 201, pp. 39–50. [Google Scholar] [CrossRef]
- Cecil, C.B.; Stanton, R.W.; Neuzil, S.G.; Dulong, F.T.; Ruppert, L.F.; Pierce, B.S. Paleoclimate controls on late Paleozoic sedimentation and peat formation in the Central Appalachian Basin (U.S.A.). Int. J. Coal Geol. 1985, 5, 195–230. [Google Scholar] [CrossRef]
- Montross, S.N.; Yang., J.; Britton, J.; McKoy, M.; Verba, C.A. Leaching of ionically bound rare earth elements from Central Appalachian coal seam underclays. Manuscript in preparation.
- Poppe, L.J.; Paskevich, V.F.; Hathway, J.C.; Blackwood, D.S. A Laboratory Manual for X-Ray Powder Diffraction; USGS Open-File Report 2001-41; USGS: Reston, VA, USA, 2001. [CrossRef]
- Solé, V.A.; Papillon, E.; Cotte, M.; Walter, P.; Susini, J. A multiplatform code for the analysis of energy-dispersive X-ray fluorescence spectra. Spectrochim. Acta Part B Atomic Spectrosc. 2007, 62, 63–68. [Google Scholar] [CrossRef]
- Webb, S. SMAK: Sam’s MicroAnalysis Toolkit; Stanford Synchrotron Radiation Lightsource: Stanford, CA, USA, 2016. [Google Scholar]
- Stuckman, M.Y.; Lopano, C.L.; Granite, E.J. Distribution and speciation of rare earth elements in coal combustion by-products via synchrotron microscopy and spectroscopy. Int. J. Coal Geol. 2018, 195, 125–138. [Google Scholar] [CrossRef]
- Seredin, V.; Dai, S. Coal deposits as potential alternative sources for lanthanides and yttrium. Int. J. Coal Geol. 2012, 94, 67–93. [Google Scholar] [CrossRef]
- Rudnick, R.; Gao, S. Composition of the Continental Crust. Treatise Geochem. 2003, 3, 1–64. [Google Scholar] [CrossRef]
- Lin, R.; Bank, T.; Roth, E.; Granite, E.; Soong, Y. Organic and inorganic associations of rare earth elements in central Appalachian coal. Int. J. Coal Geol. 2017, 179, 295–301. [Google Scholar] [CrossRef]
- Byrne, R.; Sholkovitz, E. Chapter 158 Marine chemistry and geochemistry of the lanthanides. In Handbook on the Physics and Chemistry of Rare Earths; Gschneidner, K.A., Eyring, L., Eds.; Elsevier: Amsterdam, The Netherlands, 1996; Volume 23, pp. 497–593. [Google Scholar]
- Sholkovitz, E. Rare-earth elements in marine sediments and geochemical standards. Chem. Geol. 1990, 88, 333–347. [Google Scholar] [CrossRef]
- Yu, C.; Drake, H.; Mathurin, F.A.; Åström, M.E. Cerium sequestration and accumulation in fractured crystalline bedrock: The role of Mn-Fe (hydr-)oxides and clay minerals. Geochim. Cosmochim. Acta 2017, 199, 370–389. [Google Scholar] [CrossRef]
- Coppin, F.; Berger, G.; Bauer, A.; Castet, S.; Loubet, M. Sorption of lanthanides on smectite and kaolinite. Chem. Geol. 2002, 182, 57–68. [Google Scholar] [CrossRef]
- Tertre, E.; Berger, G.; Simoni, E.; Castet, S.; Giffaut, E.; Loubet, M.; Catalette, H. Europium retention onto clay minerals from 25 to 150 C: Experimental measurements, spectroscopic features and sorption modelling. Geochim. Cosmochim. Acta 2006, 70, 4563–4578. [Google Scholar] [CrossRef]
- Johannesson, K.; Lyons, W.; Yelken, M.; Gaudette, H.; Stetzenbach, K. Geochemistry of the rare-earth elements in hypersaline and dilute acidic natural terrestrial waters: Complexation behavior and rare-earth element enrichments. Chem. Geo. 1996, 133, 125–144. [Google Scholar] [CrossRef]
© 2020 by the authors. Licensee MDPI, Basel, Switzerland. This article is an open access article distributed under the terms and conditions of the Creative Commons Attribution (CC BY) license (http://creativecommons.org/licenses/by/4.0/).