Article

Formation of Natural Silicate Hydrates by the Interaction of Alkaline Seepage and Sediments Derived from Serpentinized Ultramafic Rocks at Narra, Palawan, the Philippines

1
Central Research Institute of Electric Power Industry, Chiba 270-1194, Japan
2
Division of Sustainable Resources Engineering, Graduate School of Engineering, Hokkaido University, Hokkaido 060-8628, Japan
3
Division of Sustainable Resources Engineering, Faculty of Engineering, Hokkaido University, Hokkaido 060-8628, Japan
4
Radioactive Waste Management Funding and Research Center, Tokyo 104-0052, Japan
*
Author to whom correspondence should be addressed.
Minerals 2020, 10(8), 719; https://doi.org/10.3390/min10080719
Submission received: 30 June 2020 / Revised: 8 August 2020 / Accepted: 12 August 2020 / Published: 17 August 2020
(This article belongs to the Special Issue Emerging Insights into Serpentinites)

Abstract

:
In radioactive waste disposal facilities, low-permeability engineered barrier materials are important for inhibiting radionuclide migration. However, dissolution–precipitation reactions under alkaline conditions change the permeability of engineered barriers. To understand long-term dissolution–precipitation reactions under alkaline conditions in chemically complex systems, trenches and drill holes were excavated at Narra in Palawan, where alkaline fluids (pH > 11) have been naturally produced, seeping into clastic sediments derived from serpentinized ultramafic rocks and gabbro of Palawan ophiolite. Interaction between the alkaline seepage and clastic sediments, which have been deposited since 15,000 radiocarbon years before present (14C yr BP), led to dissolution of minerals and the precipitation of Si-bearing phases which were divided into two main categories: Fe-Mg-Si infillings and Ca-Si infillings. The former category was composed of iron-magnesium-silicate-hydrate (F-M-S-H) and a nontronite-like mineral and was widely recognized in the clastic sediments. The nontronite-like mineral likely formed by interaction between silicates and alkaline seepage mixed with infiltrated seawater, whereas F-M-S-H formed by the reaction of silicates with alkaline seepage in the absence of seawater infiltration. Ca-Si infillings included 14 Å tobermorite and were precipitated from alkaline seepage combined with the Ca and Si supplied by the dissolution of calcite and silicates in the clastic sediments.

1. Introduction

In radioactive waste disposal facilities, low-permeability engineered barriers are placed around radioactive waste to inhibit radionuclide migration. These barriers often comprise bentonite and cementitious materials; however, alteration of cementitious materials can produce alkaline leachates [1]. Moreover, minerals in bentonite, such as montmorillonite, dissolve under alkaline conditions [2,3], which could increase the permeability of bentonite barriers. On the other hand, the formation of secondary phases may decrease the permeability through a reduction of porosity [4]. Therefore, it is important to analyze the dissolution of constituent minerals in bentonite, as well as the formation of secondary minerals, under alkaline conditions.
For the safety assessment of radioactive waste disposal, it is important to consider the long-term thermodynamics and/or kinetics of geochemical reactions in chemically complex systems. However, short-term laboratory experiments are typically conducted for relatively simple systems. For example, in order to determine a formula which describes the effects of pH on the dissolution kinetics of minerals, laboratory experiments should be conducted under different pH conditions using alkaline solutions such as NaOH or Ca(OH)2. The obtained formula can then be used to assess the lifetime of bentonite under alkaline disposal conditions. However, it is difficult to select a possible secondary mineral species because the composition of secondary mineral phases strongly depends on the experimental chemical system. Therefore, this study considers natural and long-term geochemical processes within a chemically complex system, particularly focused on the precipitation reactions under alkaline conditions.
Ultramafic rock-water interaction, which is known as present-day low-temperature serpentinization, can produce high-pH fluids (9–12) [5,6]. Zeolite, K-feldspar, goethite, and Fe- and Mg-rich smectite were formed by the interaction between bentonite and alkaline water at the Saile bentonite-zeolite mine, close to the Zambales ophiolite in Luzon, the Philippines [7]. Near the Troodos ophiolite in Cyprus, Fe-bearing palygorskite formation occurred through the interaction between bentonite and alkaline water over a time span of 105–106 years [8]. Furthermore, precipitation of aragonite and magnesium silicate hydrates (M-S-H), which can be considered as poorly crystalline chrysotile, has been reported from the alkaline surface environment of an ultramafic body in the Sorachi ophiolite, Japan [9]. Natural geochemical processes under alkaline conditions (pH 7–10) have also reported in an alkaline-saline lake [10,11]. Alkaline-saline lakes of the Pantanal wetland in Brazil led to the formation of Fe-illite, glauconite, and Si-rich amorphous materials [10]. In Searles Lake, California, where montmorillonite and illite are the principal detrital clay minerals, Fe-illite, Mg-smectite, K-feldspar, and zeolite were newly produced [11]. Various Fe- and/or Mg-rich silicates (or silicate hydrates) do form under natural alkaline conditions; therefore, it is possible they could also form under alkaline conditions generated by the alteration of cementitious materials in the radioactive waste disposal facilities. However, it is still difficult to describe formation conditions of these minerals. Understanding the spatial distribution of these minerals, under natural alkaline conditions, may be crucial for understanding the conditions under which these minerals form in the radioactive waste disposal facilities.
At Narra, Palawan, the Philippines, alkaline fluids with a pH of over 11 have been naturally produced [12]. A previous study has reported the formation of Fe, Mg, and Si-rich products as well as Ca and Si-rich products from the interaction between clastic sediments and alkaline fluids and discussed their potential formation mechanisms [12]. However, the number of analyzed samples was limited, and the spatial distribution of the minerals remain uncertain. This study investigates the spatial distribution of primary and secondary minerals, as well as their depositional ages and depositional environment. The aim of this study is to understand the long-term dissolution–precipitation interactions and the conditions, which form different mineral species under alkaline conditions in a chemically complex system.

2. Site Description and Samples

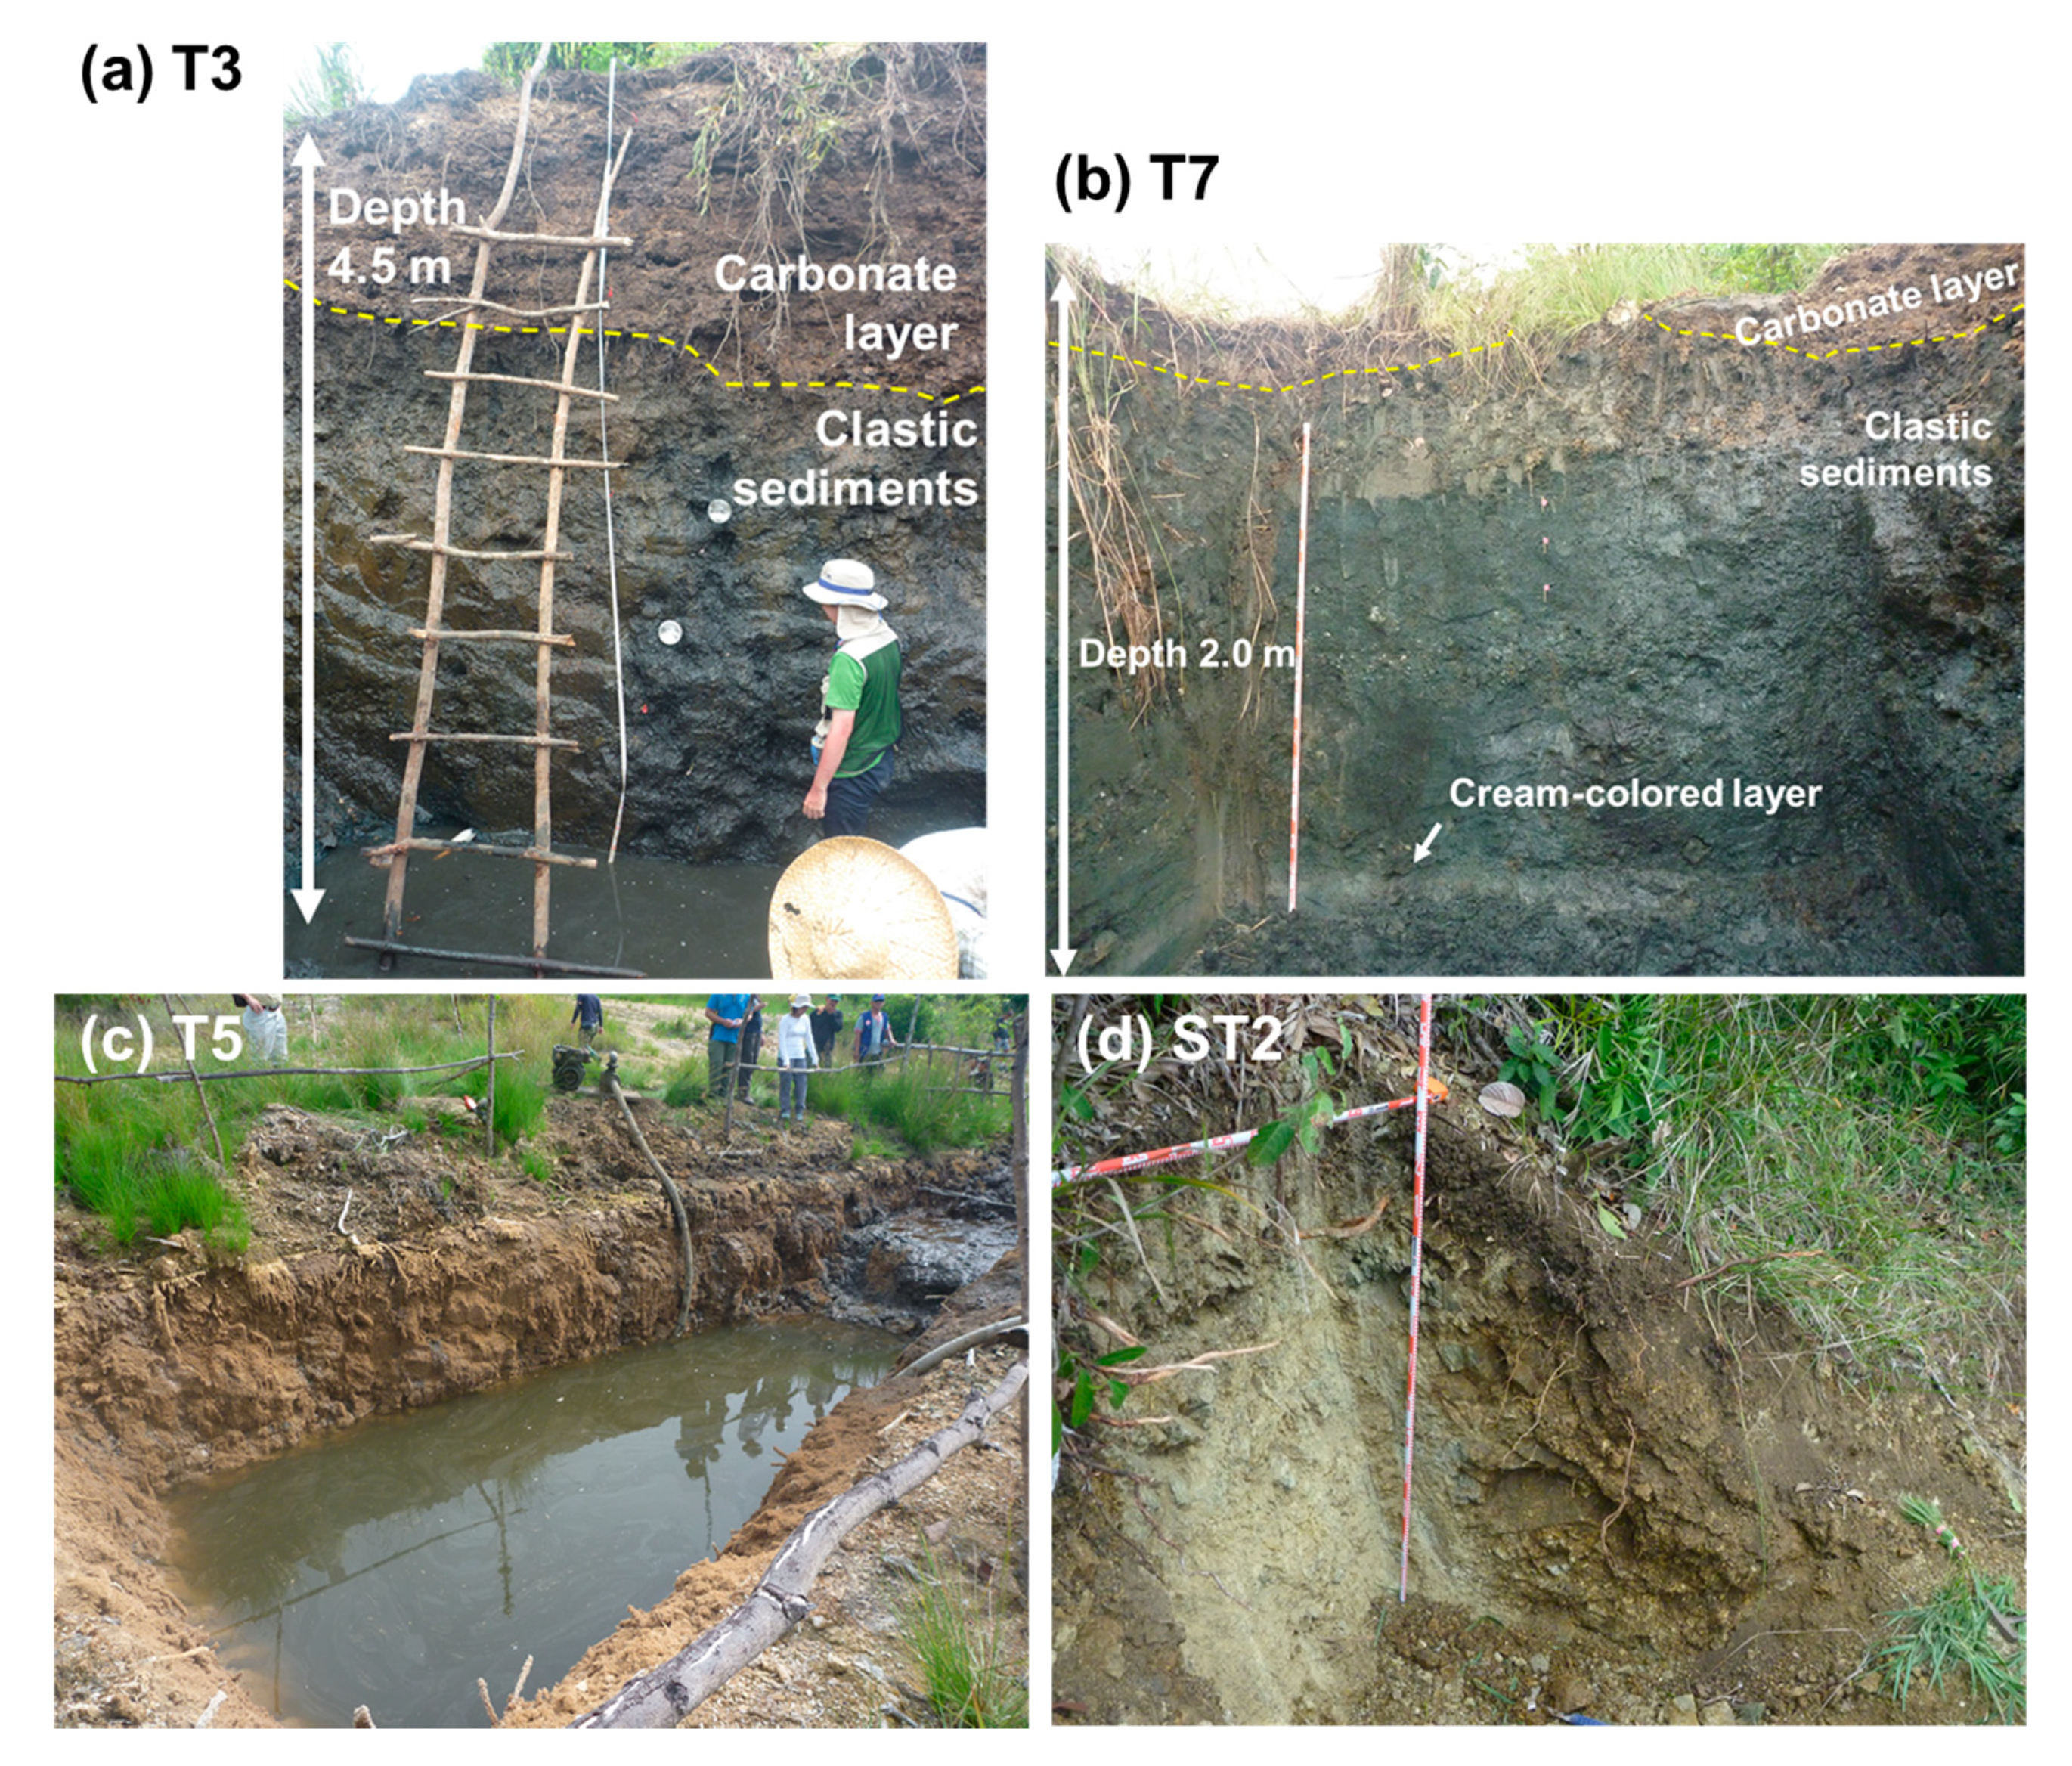
The geological setting of the site in central Palawan is dominated by the Palawan ophiolite, which is composed of the Beaufort Ultramafic Complex, Stavely Gabbro, and Espina Formation [13]. The Beaufort Ultramafic Complex comprises serpentinized peridotite and dunite, whereas Stavely Gabbro includes isotropic gabbro with minor layered gabbro [13]. The main sampling site (Narra3-2; located at 9°12′14′′ N, 118°16′51′′ E, ~70 m above sea level) is an alluvial fan channel spreading on a gentle slope of the Palawan ophiolite basement (Figure 1a,b). Eight trenches (T1–8) and four drill holes (DH1–4) were excavated at Narra3-2 (Figure 1b). The basement was found at a depth of 11.5 m in DH4, which was the deepest drill hole. Above the basement, clastic sediments and covered carbonate layers are present. The thickness of the carbonate layer decreases from the fan apex side (>2.2 m) to the fan toe (<0.2 m at T6 and T7) (Figure 1b and Figure 2a,b). Alkaline spring water emanates along fractures at Narra3-1, upstream of the alluvial fan, i.e., Narra3-2 (Figure 1b). At Narra3-2, alkaline water with similar chemical characteristics to the spring water of Narra3-1 seeps from the trench walls and drill holes after excavation, except at T8, which is located on the slope of a small hill. The alkaline seepage originates from the interaction of meteoric water with the ultramafic rocks [12]. As this interaction occurred upstream of Narra3-2, alkaline water may have been seeping into Narra3-2 on a geological time scale. The flow velocity of the alkaline seepage was measured via simplified pumping test using the excavated cavity of T5, and the volume of the stored alkaline seepage over 0.75 days was approximately 17 m3 (Figure 2c). Assuming that the stored alkaline water was seeping from an 18-m2 front into the trench facing upstream, the estimated flow velocity was approximately 1.26 m3/m2/day. Although this estimate may contain errors and does not consider changes in flow velocity due to seasonal changes in the amount of rainwater or changes in clastic sediment permeability, advection of alkaline seepage could account for major long-term mass transfer.
Solid samples were collected from each trench and drill hole at depths from 0–16 m and numbered in order from bottom to top, for example, the deepest samples collected from T1 were labeled “T1-1.” The results of T5, T2, T4, T3, DH4, and DH1 are summarized in section A-a, which is oriented perpendicular to the flow direction of the alkaline seepage, whereas the results of T1, DH3, T2, T6, and T7 are summarized in section B-b, which extends along the fan (Figure 1b). In the field, sections A-a and B-b intersect at right angles at T2; therefore, this trench occurs in both sections. T1 is located at the fan apex side, while the trenches and drill holes in section A-a and DH3 are located in the middle of the fan, and T6 and T7 are located at the fan toe. Solid samples were also collected from outcrops near Narra3-2 devoid of alkaline fluids (denoted as ST2), to compare their mineralogical composition to that of the sediments at Narra3-2 (Figure 1a and Figure 2d). Alkaline seepage was collected from T1–T7 and DH1–DH4 at a depth of 1–11 m at Narra3-2, and spring water was collected at Narra3-1. These waters generally have high Ca content (10.4–48.5 ppm), pH > 11, and temperatures of 27–36 °C [12,14,15,16]. Although their Ca contents are lower than the Ca abundance of the pore fluids from low-alkaline cements (300–1200 ppm) [17], the pH values of these waters are similar to those of pore fluids from low-alkaline cements (pH = 10–12) used in the radioactive waste disposal facilities.

3. Methods

The radioactive carbon (14C) age and the stable carbon isotope ratio (13C/12C) of humin, an alkaline-insoluble organic matter, in the clastic sediments were measured. The 14C content of humin decayed after the biological activity of original organic materials in humin ceased. Therefore, the differences of the 14C age of humin in the clastic sediments could be affected by the differences of their depositional ages. On the other hand, the stable carbon isotope ratio of humin is reported with the conventional δ notation (δ13C value) as the per mil (‰) deviation from the isotope ratio of the sample to that of the Pee Dee belemnite (PDB) carbonate standard. As a result that the mean δ13C value of organic matter in marine muds is −20‰ and for freshwater sediments is −25‰ [18], estimating the δ13C value of humin is a useful index for the determination of the depositional environments of the related sediments. Preprocessing procedures and measurements were conducted by Beta Analytic Inc. (Miami, FL, USA), and the humin was extracted from each sample using an acid-alkali-acid (AAA) pre-treatment (see www.radiocarbon.com). Measurements were conducted using accelerator mass spectrometry (AMS), and the isotopic distribution in sections A-a and B-b were illustrated as contour maps through Kriging interpolation within the convex hull for each data (Surfer 16, Golden Software (Golden, CO, USA)).
X-ray diffraction (XRD) analysis was conducted using pulverized and randomly oriented samples to determine their mineralogical compositions. The samples were examined using an X-ray diffractometer (SmartLab, Rigaku (Akishima-shi, Tokyo, Japan)) with CuKα radiation at 45 kV and 50 mA, at a scanning speed of 2 °/min and a scanning step of 0.02°. To estimate the mineral abundance of each sample, the intensity of the peaks assigned to each mineral were measured from the XRD profile after peak separation. Specifically, the intensity values of peaks with 7.3 Å d-spacing for serpentine, 8.4 Å d-spacing for amphibole, 3.0 Å d-spacing for calcite, and 14 Å d-spacing for tobermorite were measured. The peak intensity of orthopyroxene was the sum of the peak intensities for 3.2 Å and 2.9 Å. Moreover, the peak intensity of a broad peak with approximately 14 Å d-spacing was also measured after peak separation of tobermorite and chlorite due to the overlap of their peaks. Although it is difficult to accurately quantify mineral contents using this method, it is useful for determining the relative abundance of each mineral. The peak intensity data in sections A-a and B-b were then similarly converted into a contour map through Kriging interpolation within the convex hull for each data.
Thin sections of selected samples were observed, and microanalyses were acquired using a field emission scanning electron microscope with energy dispersive X-ray spectroscopy (FESEM-EDS; JSM-7001F, JEOL (Akishima-shi, Tokyo, Japan)). The medians of chemical compositions of intergranular infillings in each sample were calculated, and then the median values of each sample from sections A-a and B-b were similarly converted into a contour map through Kriging interpolation within convex hull for each data. Some of the data were taken from a previous report [19].
To obtain the <2-μm fraction from bulk samples, the samples were dispersed in distilled water and separated by centrifugation. Oriented samples were prepared from this <2-μm fraction with the suspension of 10 mg of dried material in distilled water and sedimentation onto a glass slide. XRD analysis of the oriented samples was conducted using an X-ray diffractometer (SmartLab, Rigaku (Akishima-shi, Tokyo, Japan)) with CuKα radiation at 45 kV and 30 mA, at a scanning speed of 5 °/min, and a scanning step of 0.01°. After analysis, the oriented samples were solvated with ethylene glycol (EG) vapor at 60 °C for more than 12 h. XRD analysis of the EG-solvated samples was conducted using the same conditions to identify the expandable features of mineral containing a broad peak with 14 Å d-spacing.
The randomly oriented samples of the <2-μm fraction were further measured by XRD analysis to observe the 060 reflection, which is routinely used to estimate the degree of occupancy in the octahedral sheet of clay minerals. XRD analysis was similarly conducted with CuKα radiation at 45 kV and 30 mA at a scanning speed of 0.3 °/min and a scanning step of 0.01°. XRD analysis of the randomly oriented samples for the <2-μm fraction during heating at 250 °C was performed to determine changes in the peak position in the dehydrated state. XRD patterns were collected after maintaining the temperature for 2 h. XRD analysis was conducted using the same instrument and conditions as above except a scanning speed of 5 °/min and a scanning step of 0.02°.
The Geochemist’s Workbench (GWB; Aqueous Solutions (Champaign, IL, USA)) software package was used for thermodynamic calculations. The calculations employed the thermodynamic database, “Thermoddem_V1.06d” (2009), provided by the Bureau de Recherches Géologiques et Minieres (BRGM). The saturation index of alkaline water with respect to each mineral was calculated. The chemical compositions of alkaline waters collected from Narra3-1, T1–T7, DH1, DH3, and DH4 were obtained from previous studies [12,14,15,16]. The charge in alkaline water was balanced by Cl ions, and dissolved ion concentrations below 0.01 ppm were assumed to be 0.01 ppm. Moreover, the calculation also assumed that the dissolved iron, which is the sum of the dissolved Fe2+ and Fe3+ ions, is ferrous and dissolved Fe2+ ions were used to calculate the saturation index with respect to Fe-bearing minerals. These assumptions may have led to slightly high calculated saturation indices with respect to each mineral. The geochemical changes induced by mixing seawater or freshwater with alkaline seepage helped to predict the changes of the fluid chemistry and minerals formation. Our calculations assumed that the minerals form instantaneously in equilibrium with the mixed solution. The chemical compositions of alkaline waters collected from Narra3-1 were considered representative of alkaline seepage in this study, and the charge in alkaline water was balanced by Cl ions. Finally, the chemical compositions of general seawater and freshwater were obtained from a previous study [20].

4. Results

4.1. Carbon Isotope Measurements

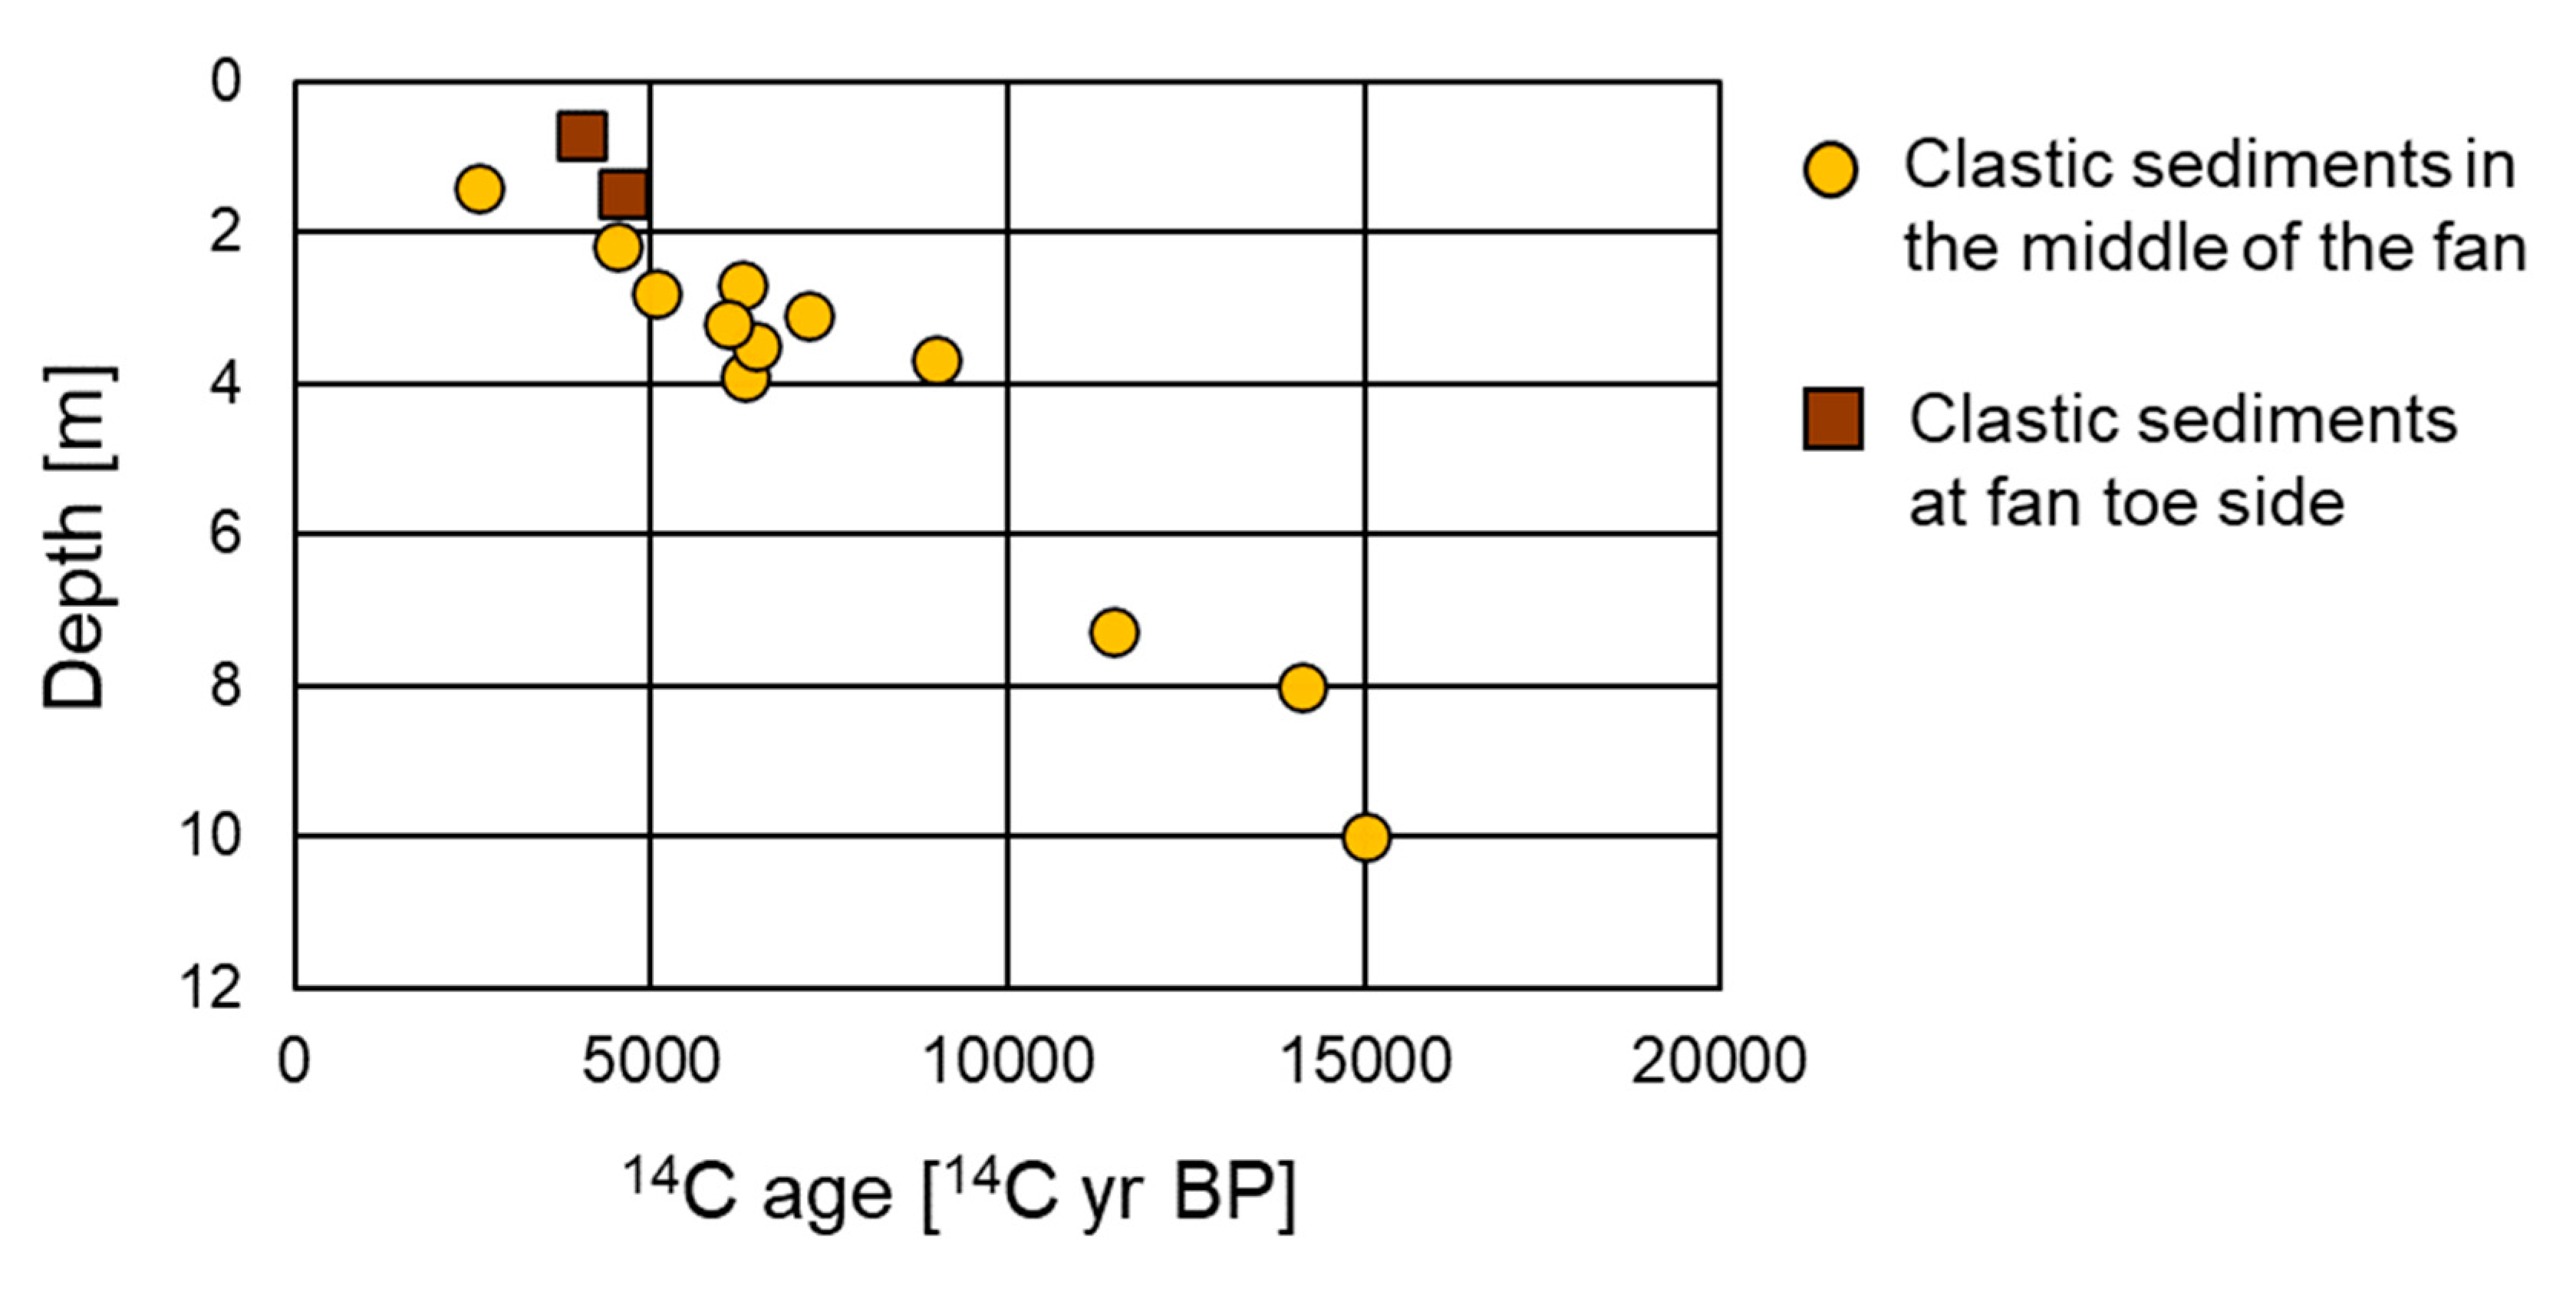
The distribution of 14C ages in humin throughout the clastic sediments was investigated and a range of 2560–15,000 14C yr BP was obtained. Figure 3 shows a linear positive correlation between the 14C ages and depth. At the middle of the fan and at the fan toe, clastic sediments at a depth of <2 m yielded 14C ages of <5 14C kyr BP whereas the oldest age of ca. 15 14C kyr BP is recorded at the deeper levels of ~10 m.
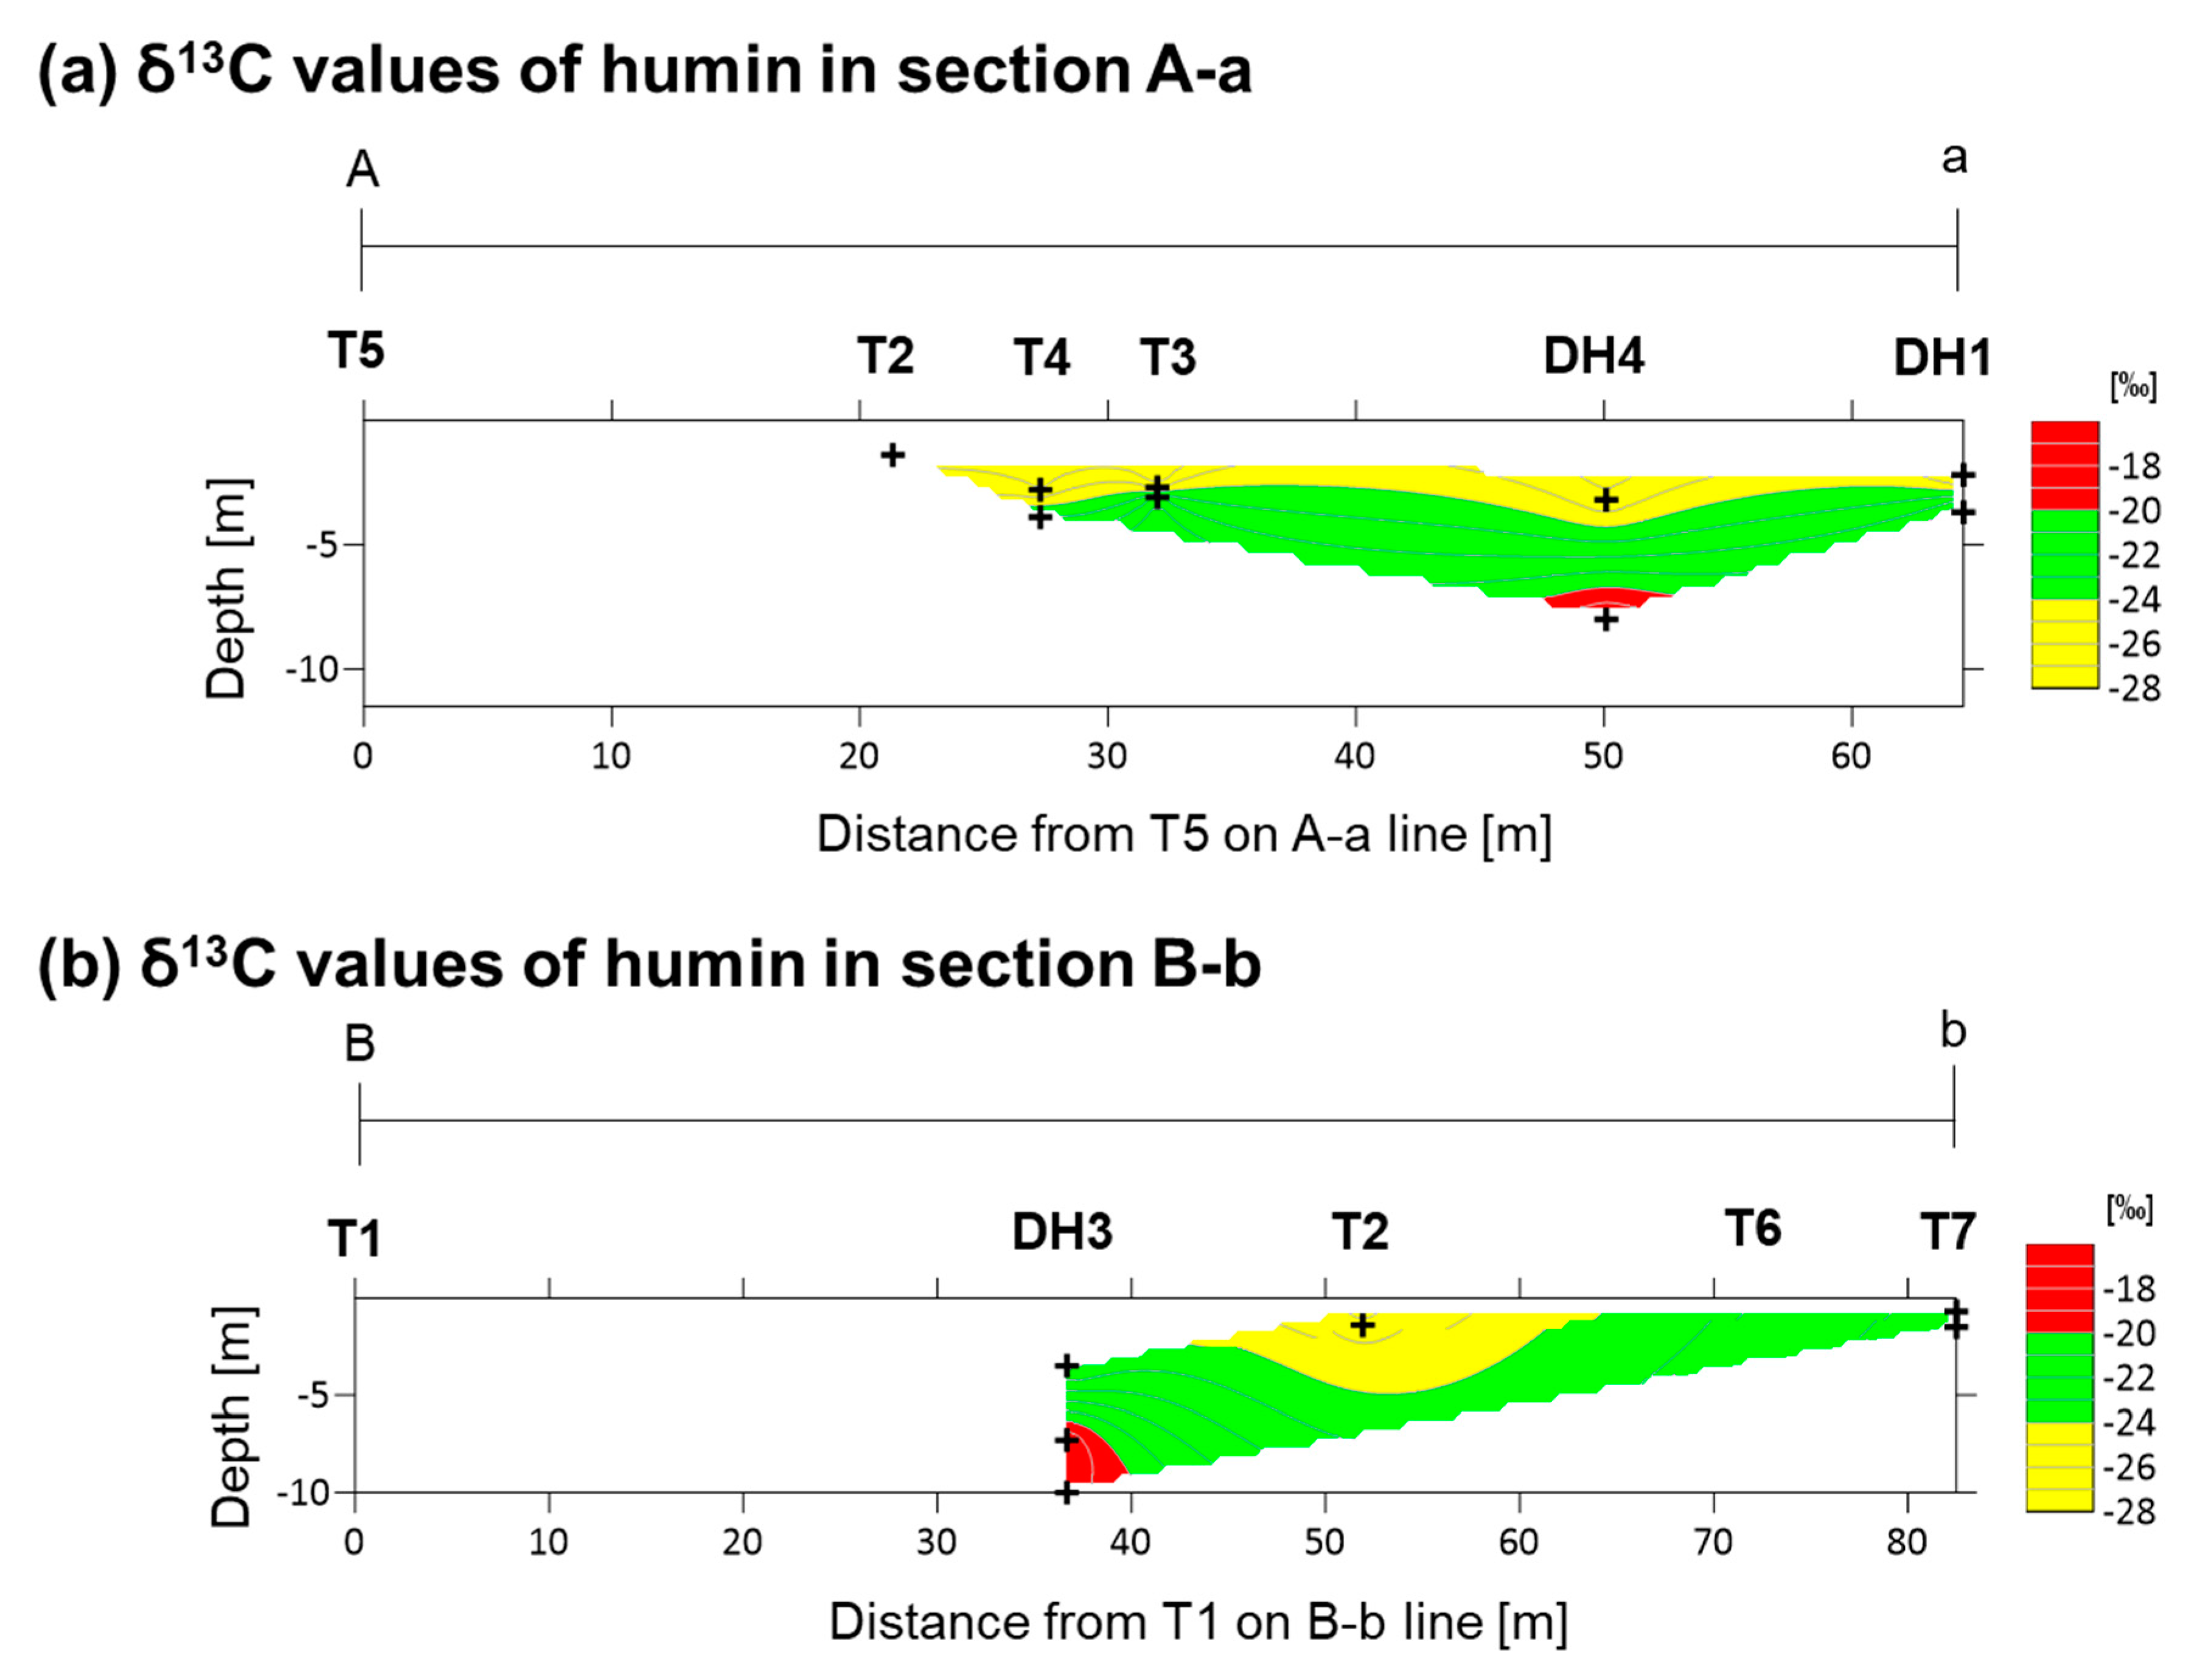
Figure 4 shows the distribution of δ13C values for humin in sections A-a and B-b, which range from −27.27‰ to −17.91‰. In section A-a, a gradual decrease in δ13C values was observed with decreasing depth (Figure 4a), with the δ13C values at deeper depths being similar to those of marine muds (−20‰), and reaching values similar to those of freshwater sediments (−25‰) [18] at shallower depths. Section B-b exhibits a similar trend as section A-a in the middle of the fan; however, the shallower sediments of the fan toe show higher δ13C values (from 22‰ to −24‰) than those in the freshwater sediments (Figure 4b).

4.2. XRD Analysis of Randomly Oriented Samples

XRD analysis of randomly oriented samples revealed that the clastic sediments collected from depths of <11.5 m, excluding T8, DH2, and T7-2, are predominantly composed of a mineral with a broad 14 Å d-spacing, orthopyroxene, amphibole, serpentine, talc, chlorite, and calcite (Appendix A, Figure A1a). In certain samples, 14 Å tobermorite (plombierite) was also detected as a major component (Figure A1b). The surface layer of the clastic sediments was composed only of calcite (Figure A1c). Most samples collected from T8 and DH2 were composed predominantly of a mineral with a broad 14 Å d-spacing, plagioclase, clinopyroxene, serpentine, and amphibole (Figure A1d). The T7-2 sample was collected from a cream-colored layer (Figure 2b), previously reported as volcanoclastic sediments [16] and was composed predominantly of a mineral with a broad 14 Å d-spacing, plagioclase, amphibole, and serpentine (Figure A1e). The basement, which occurs at a depth of 11.5 m, was rich in serpentine and a broad 14 Å d-spacing was not detected (Figure A1f). Brucite and some carbonate minerals were detected in certain samples from the basement. Samples collected from the ST2 included serpentine as the major component and their diffractograms display peaks of a mineral with a broad 14 Å d-spacing with variable intensities; they also contain small amounts of orthopyroxene, amphibole, or magnetite (Figure A1g). To understand the interaction between alkaline seepage and solid samples with similar initial clastic minerals in this study, samples collected from depths of <11.5 m in all trenches and drill holes except for T8, DH2, and T7-2 were used for further analysis.
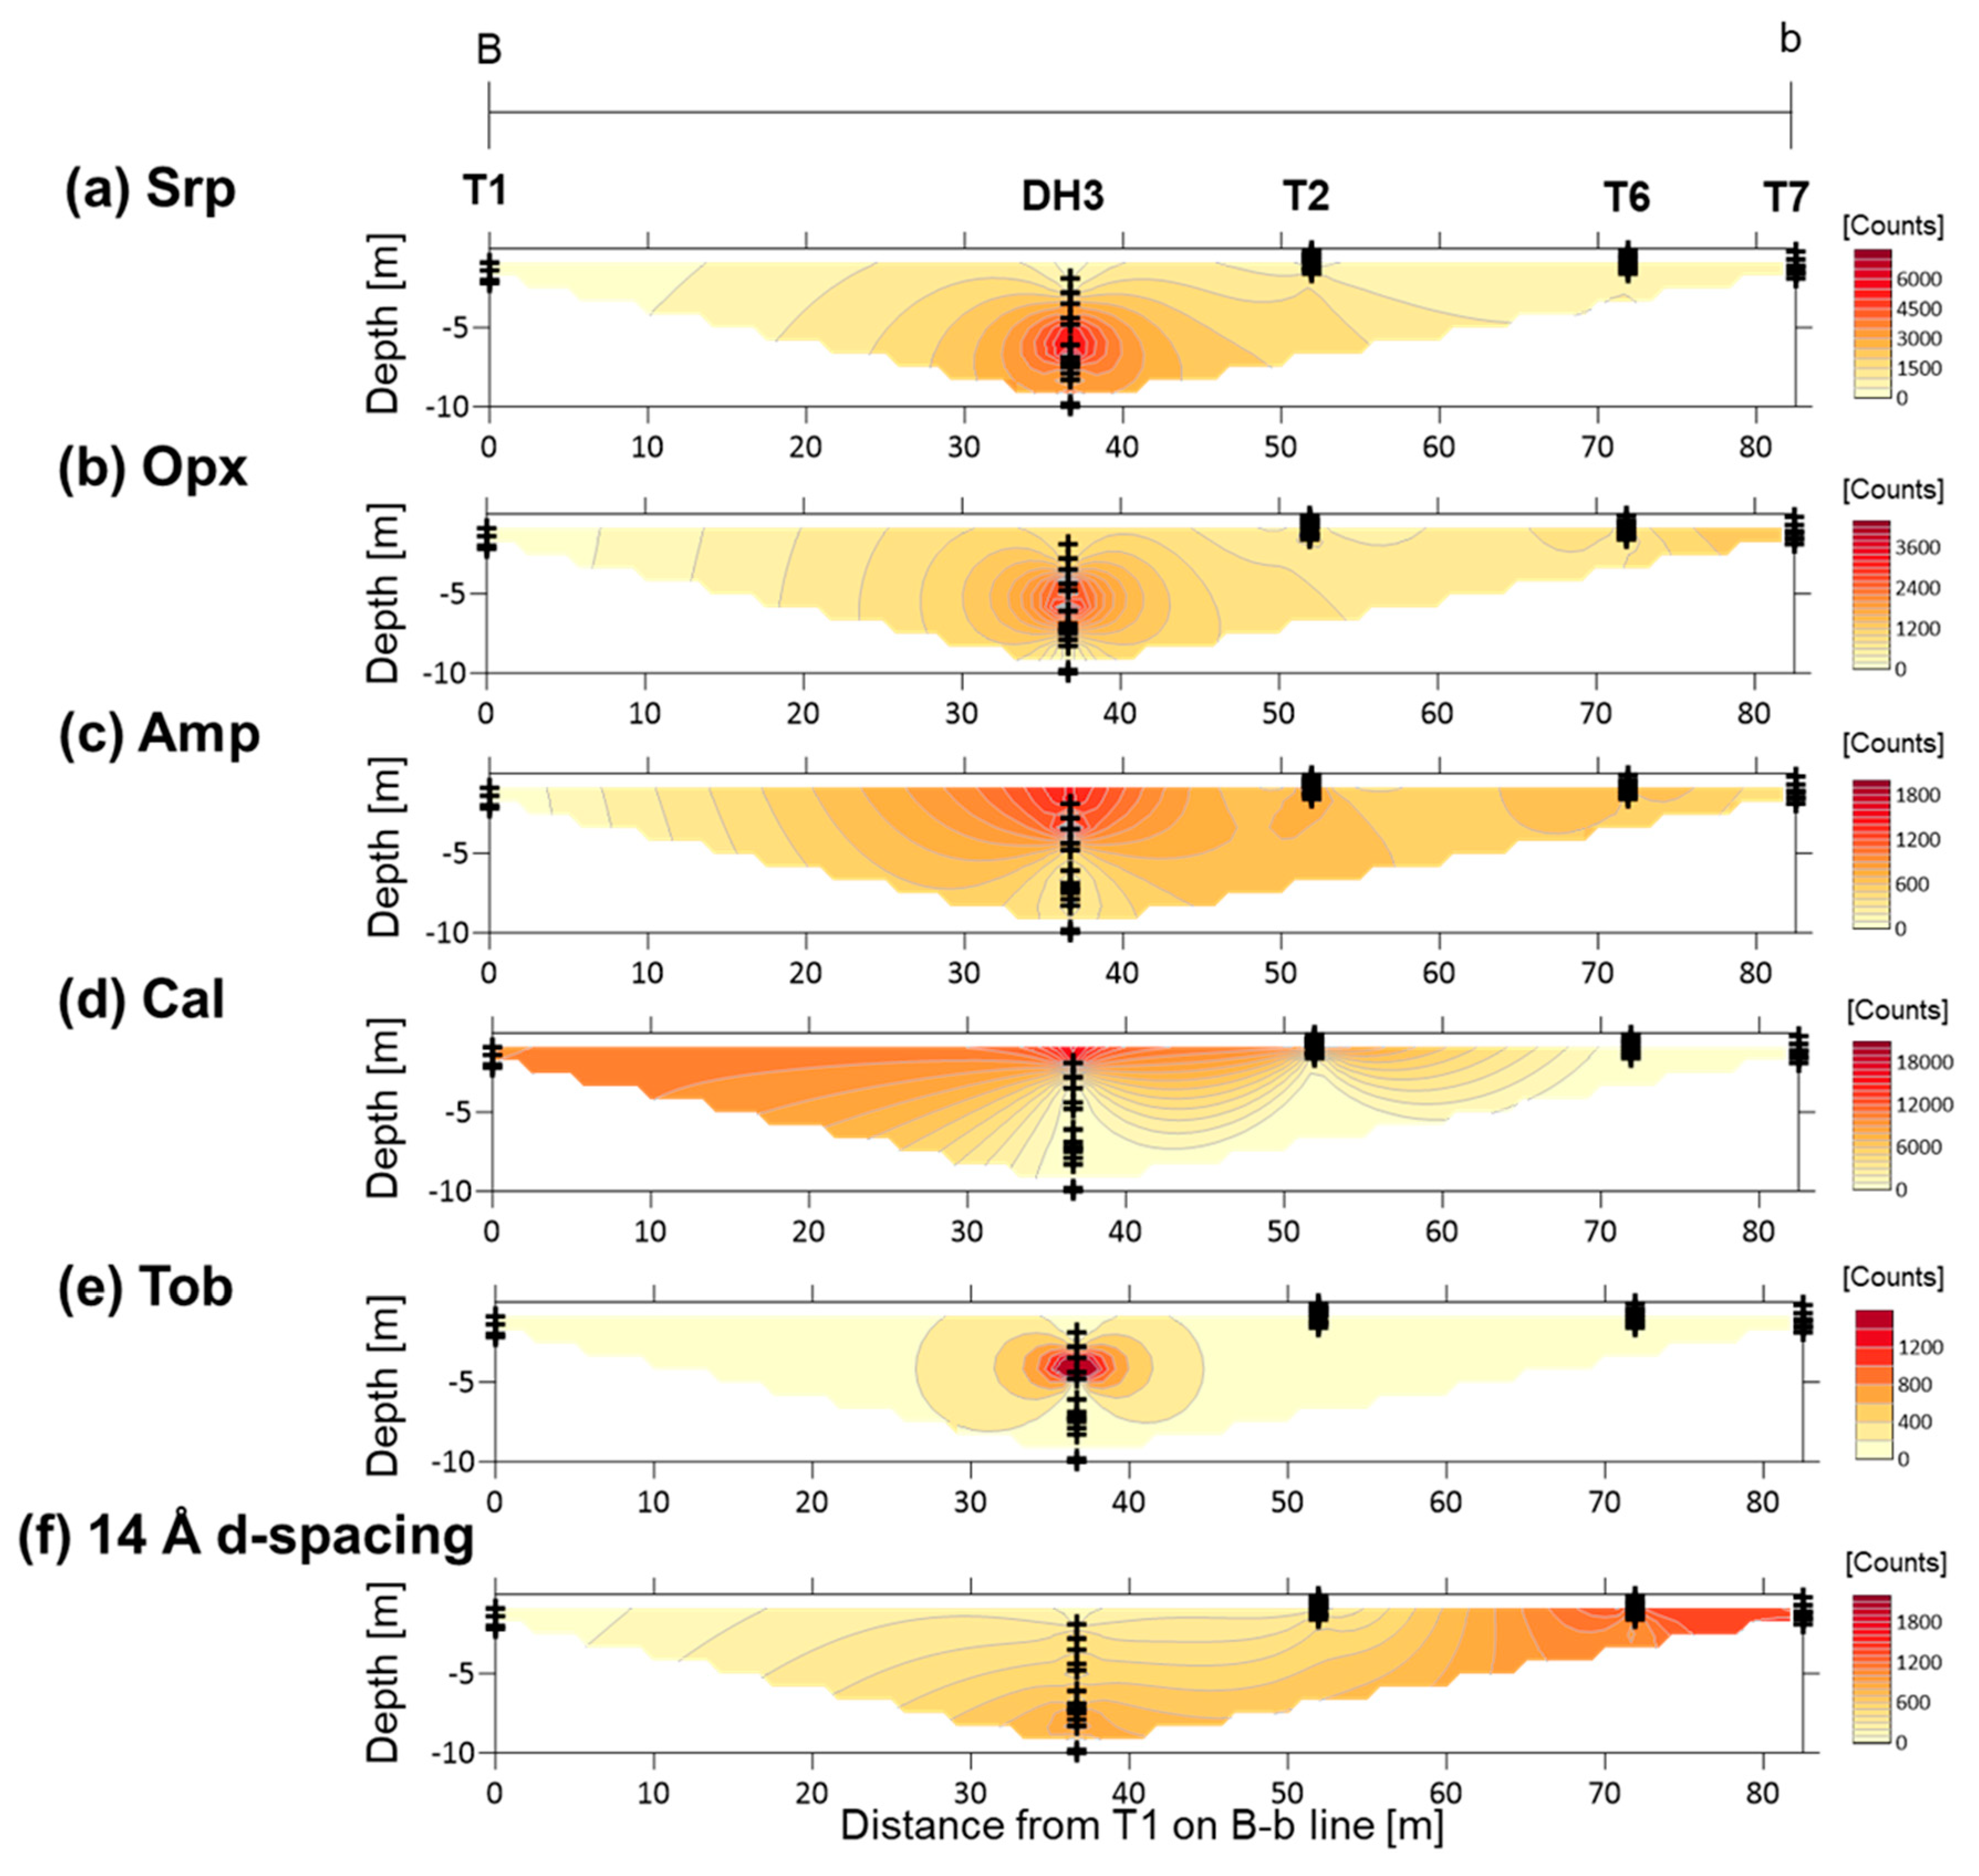
The distributions of the major assemblages obtained from semi-quantitative XRD analysis from sections A-a and B-b are shown in Figure 5 and Figure 6, respectively. In section A-a, the peak intensities of serpentine were high in samples collected from DH4 at depths of 8–10 m and DH1 at a depth of ~4 m, and the peak intensities of orthopyroxene were high in the samples from DH1 at this depth. The peak intensity of amphibole was high in samples from T2, T3, and DH4 at a depth of 2–3 m, and from DH1 at a depth of ~4 m. Calcite was dominant at the surface whereas tobermorite was identified at a depth of ~4 m, just below the calcite-rich surface. The peak intensities of the mineral with a broad 14 Å d-spacing was high in samples collected from T5, T4, and T3, and from DH4 at depths of 5–7 m (Figure 5). In section B-b, the peak intensities of serpentine and orthopyroxene were high in samples collected from DH3 at a depth of approximately 5–7 m, whereas the peak intensities of amphibole was high at a depth of ~2–4 m in the same drill hole. The calcite-rich surface layer diminishes from the fan apex to the fan toe, and the peak intensities of calcite were very low in samples collected from the surface (<2 m) at T6 and T7. Tobermorite was identified at a depth of ~4 m, just below the calcite-rich surface. The peak intensity of the mineral with broad 14 Å d-spacing was high in samples collected from T6 and T7 at a depth of <2 m (Figure 6).

4.3. FESEM-EDS Analysis

Selected samples from different trenches and drill holes at different depths (excluding T1, T5, and T6) were observed by FESEM-EDS. Samples from T1 exclusively contained calcite and samples from T5 and T6 were of poor quality and therefore were excluded from SEM analysis.
Most of the observed minerals dominated by orthopyroxene and amphiboles showed euhedral to subhedral shapes (Figure 7a–c). Serpentine and talc were also observed in coexistence with orthopyroxene (Figure 7d,e) and chlorite was observed along with amphibole (Figure 7f). Small amounts of plagioclase, chromite, and quartz were also observed (Figure 7c).
The intergranular infillings are divided into two categories: the first is a phase containing Si, Fe, and Mg with small amounts of Al and Ca, termed Fe-Mg-Si infillings in this study (Figure 8) and the second is a phase with predominant Si and Ca, termed Ca-Si infillings (Figure 8b). The dominant infilling in sample T3-4 was Fe-Mg-Si whereas Ca-Si was subordinate (Figure 8a). In sample T3-2, both the Fe-Mg-Si and Ca-Si infillings were observed (Figure 8b). In certain cases, the two phases were nearly indistinguishable under FESEM-EDS analysis and hence their Ca/Si (<0.2 in the Fe-Mg-Si infillings) and (Fe + Mg + Al)/Si (<0.1 in the Ca-Si infillings) ratios were used as discriminating factors (Figure A2).
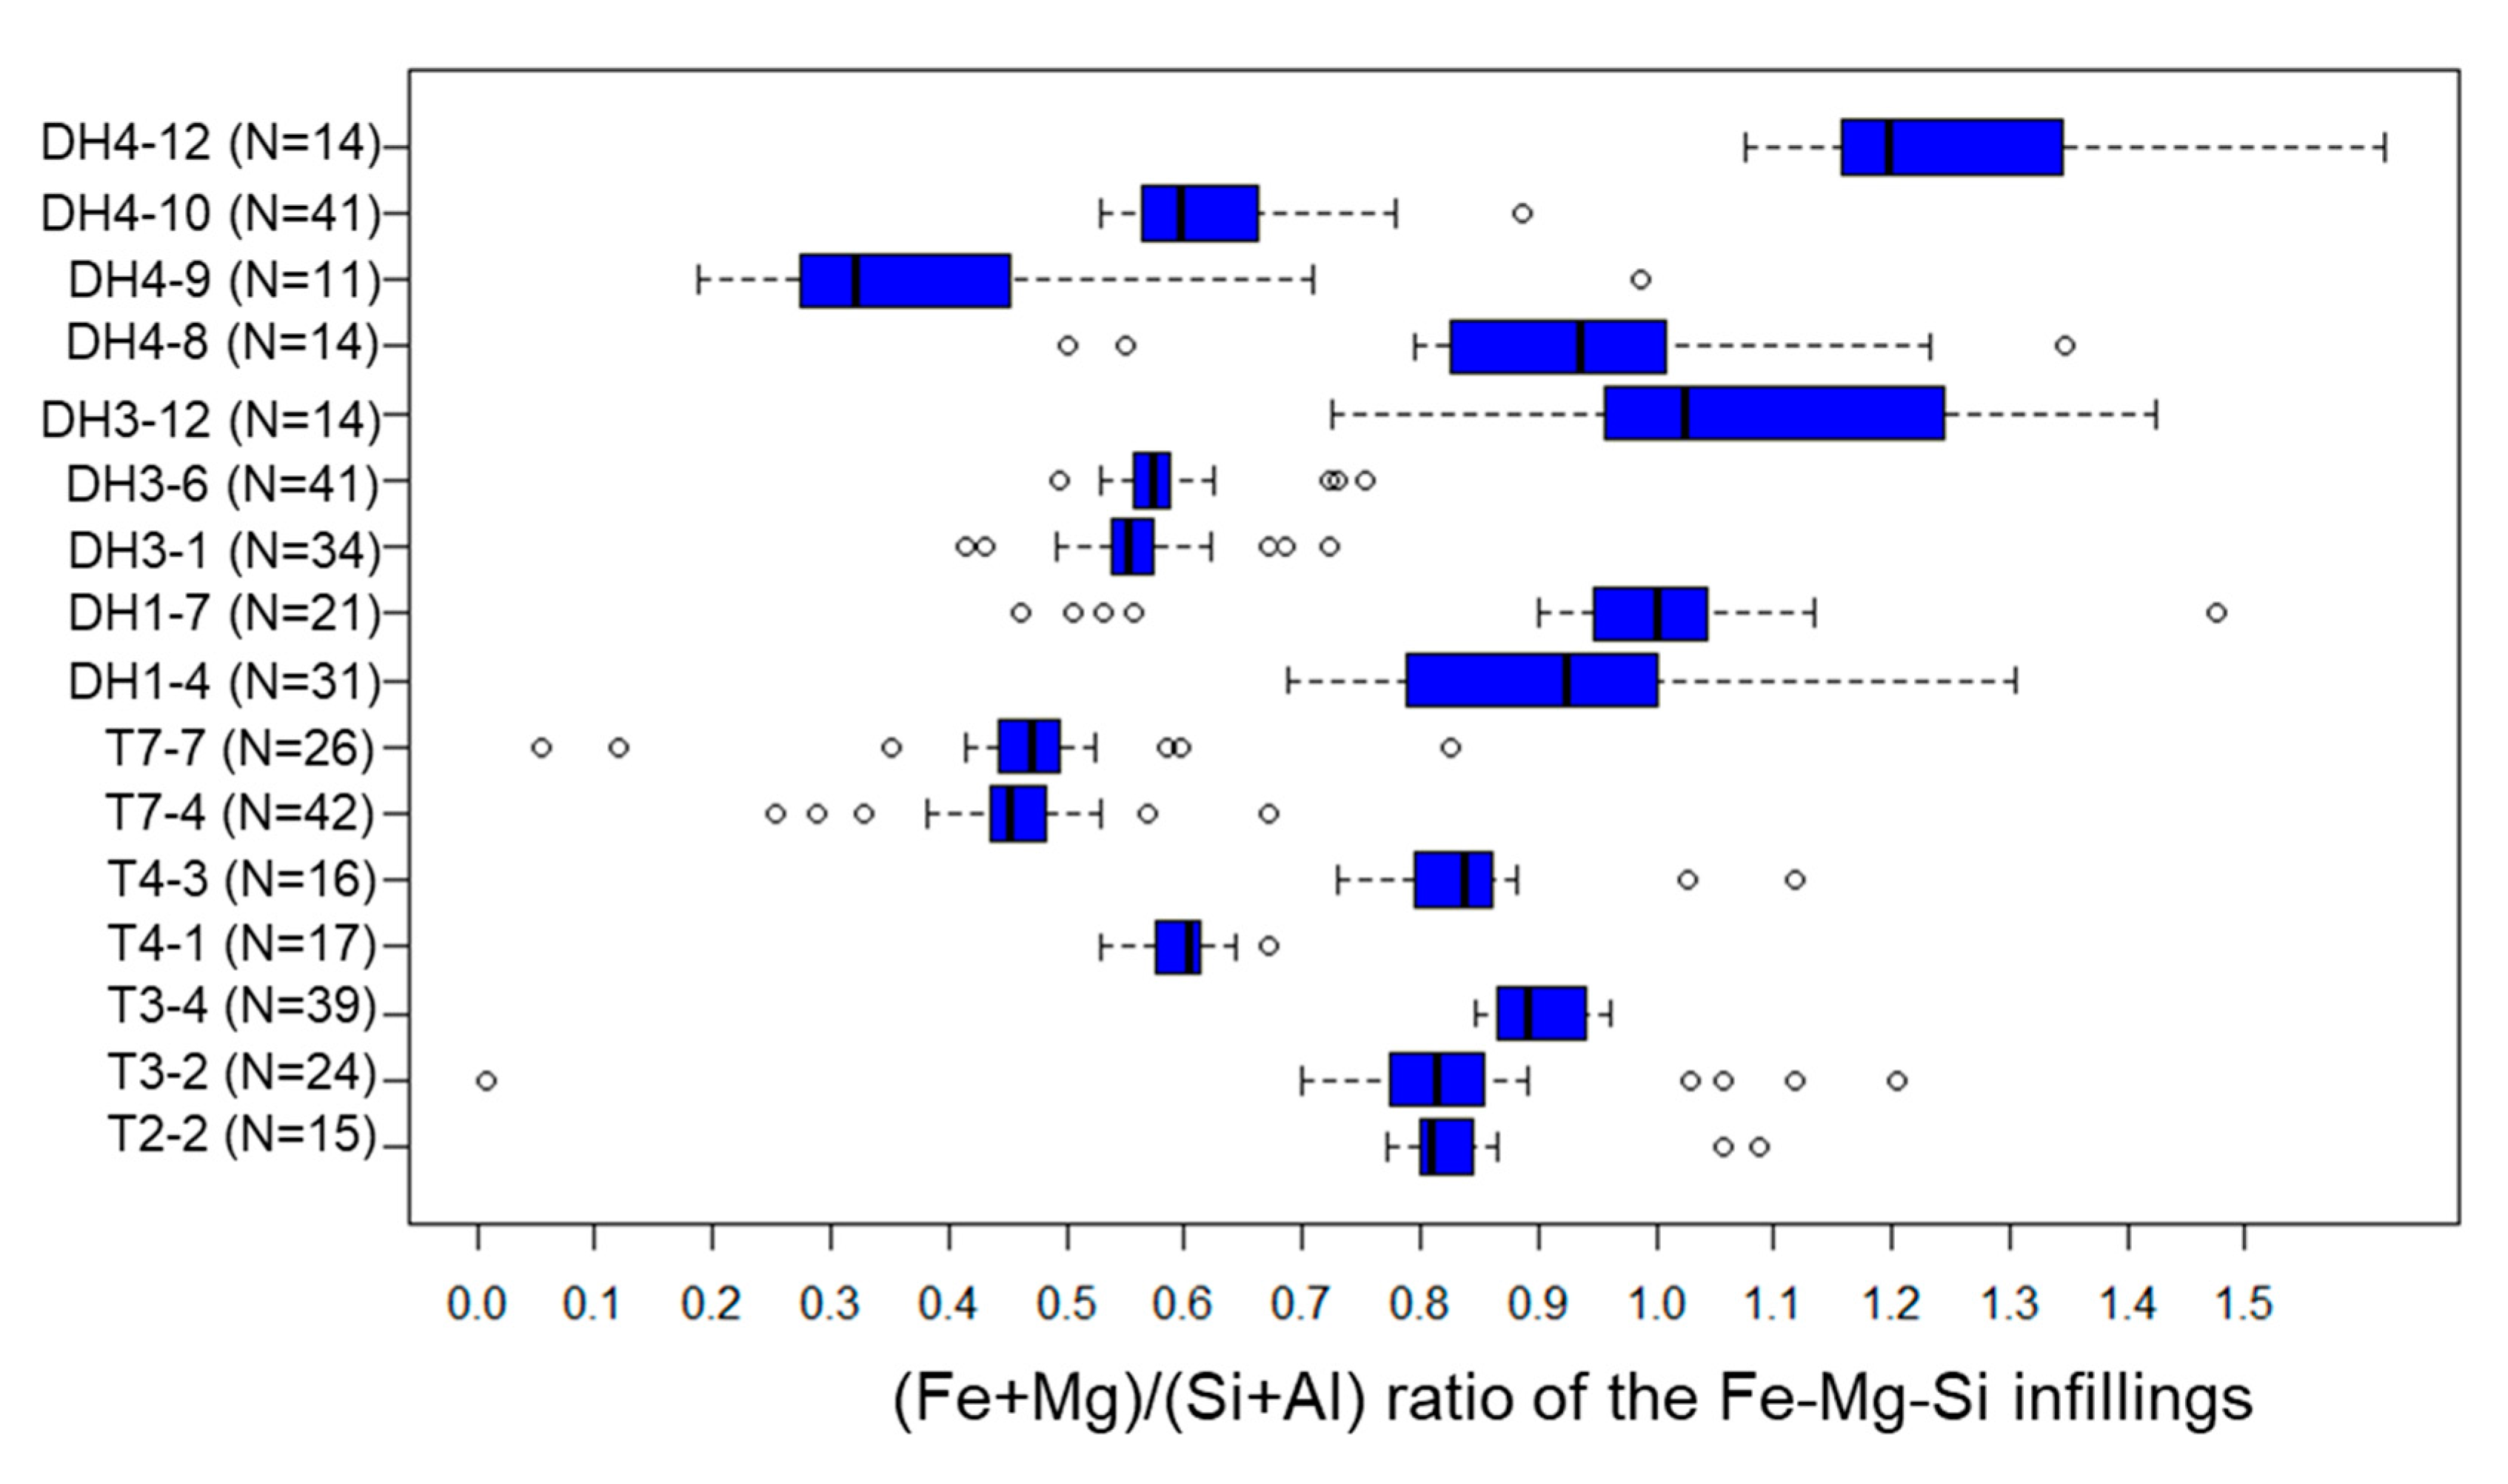
Fe-Mg-Si infillings were observed widely in the clastic sediments. Their (Fe + Mg + Al)/Si and (Fe + Mg)/(Si + Al) ratios range typically at 0.5–1.5 and 0.3–1.3, respectively (Figure A3 and Figure A4). Within section A-a, the (Fe + Mg + Al)/Si and (Fe + Mg)/(Si + Al) ratios of Fe-Mg-Si infillings decreased with depth (Figure 9a,b). A similar trend was observed at DH3 and T2 in section B-b; however, both ratios were low, even in the shallower parts at the fan toe (Figure 9c,d).
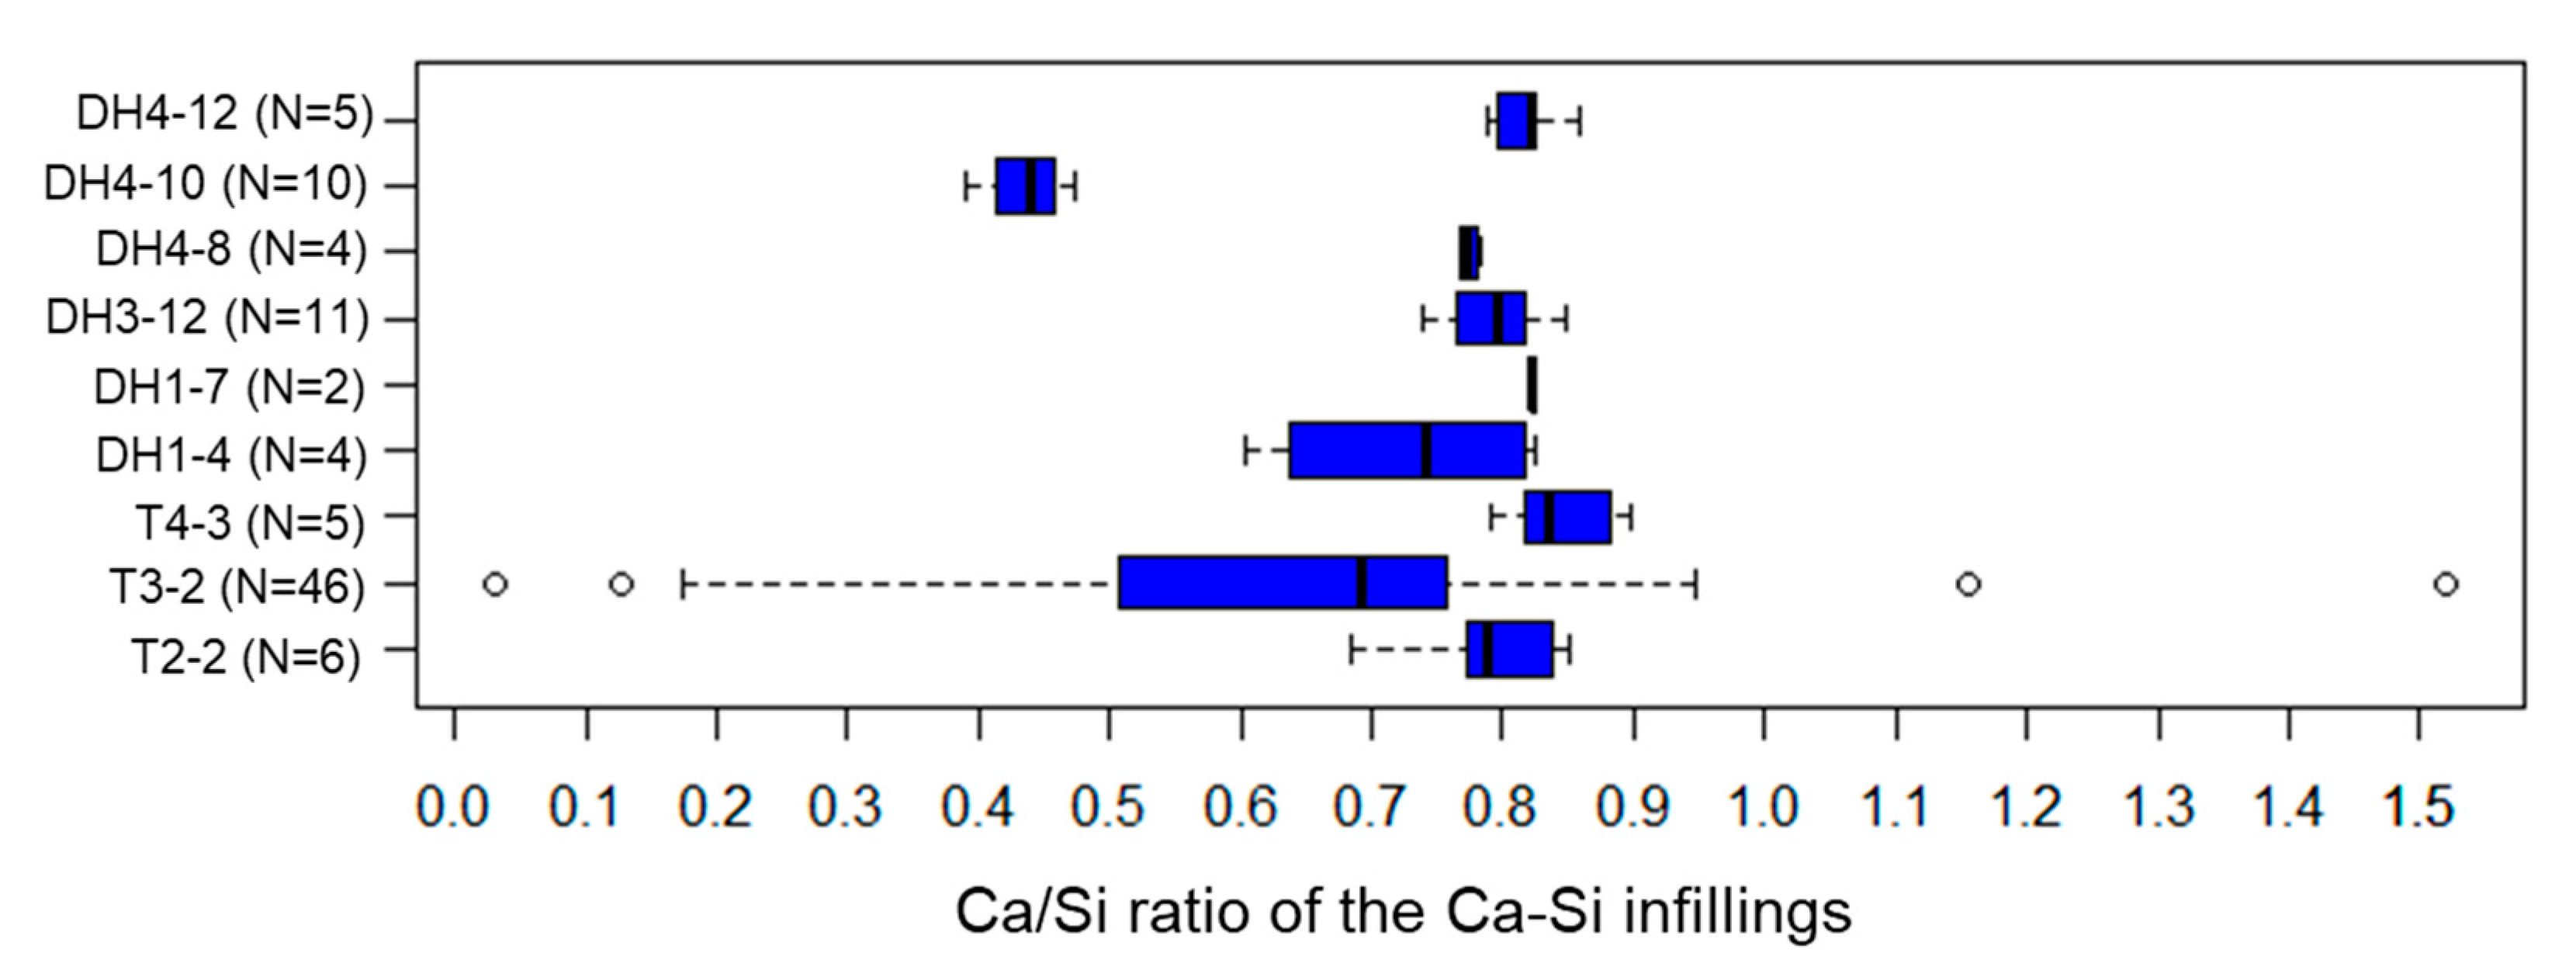
Ca-Si infillings precipitated among the minerals and Fe-Mg-Si infillings (Figure 8b). Calcite was sometimes observed inside the Ca-Si infillings (Figure 8b) and many Ca-Si infillings were observed in the 14 Å tobermorite-identified samples by XRD analysis. The Ca/Si ratios of all Ca-Si infillings except DH4–10 ranged between 0.5–0.9 (<0.5 for DH4–10) with the median of the Ca/Si ratio ranging from 0.69–0.84 in individual samples (Figure A5).

4.4. XRD Analysis of the <2-µm Fractions

Samples containing Fe-Mg-Si infillings with various (Fe + Mg + Al)/Si and (Fe + Mg)/(Si + Al) ratios (Figure 9) were selected to conduct a detailed XRD analysis in their <2-µm fractions. This fraction is composed predominantly of the mineral with a broad 14 Å d-spacing and traces of serpentine (Figure A6). As the peak with a broad 14 Å d-spacing shifted to lower angle after EG treatment, the overlap of peaks of tobermorite and chlorite was found to be small. In the middle of the fan, the peak intensity of the mineral with a broad 14 Å d-spacing increased with depth (Table 1, Figure A6). Moreover, the peak shift after EG treatment gradually increased with increasing depth (Table 1, Figure A6). The position of the peak after EG treatment was 15.4 Å in sample DH1-7 (2.2 m depth) and 17.0 Å in samples DH4-9 and DH3-1 (8–10 m depth), indicating an expandable behavior similar to ideal smectite. In contrast, the peak position after EG treatment was shifted to 17.0 Å even at the shallower parts of the fan toe (0.7 m depth, Table 1).
The 060 reflection of the mineral with a broad 14 Å d-spacing differed within the samples of the shallower and deeper parts, in the middle of the fan (Table 1, Figure A7). The shallower samples DH1-7, T4-3, and DH1-4 (depth: 2.2–3.7 m), showed d-spacings of the 060 reflection at 1.53–1.54 Å, indicating that this mineral has trioctahedral sheets (Table 1). In the deeper samples DH4-9 and DH3-1 (depth: 8–10 m), d-spacings of the 060 reflection at 1.51–1.52 Å indicate that this phase has dioctahedral sheets (Table 1). In sample T4-1 (depth: 3.9 m), a mixture of both minerals with trioctahedral and dioctahedral sheets was observed (Figure A7d). In the shallower depth of the fan toe, the position of the 060 reflection indicates that the mineral with a broad 14 Å d-spacing has dioctahedral sheets (Table 1).
The peak position in the dehydrated state also differed with depth in the samples from the middle of the fan (Table 1, Figure A8). The peak position during heating at 250 °C shifted at 14.6 Å in sample DH1-7 (depth: 2.2 m). Below this depth, a peak with 10 Å d-spacing, which is at a dehydration state similar to smectite, was observed, as well as a peak with 14–15 Å d-spacing (Table 1). The peak positions during heating at 250 °C shifted to 14.6 Å and 10.1 Å in the shallower sample T7-7 of the fan toe (Table 1).

4.5. Thermodynamic Calculation

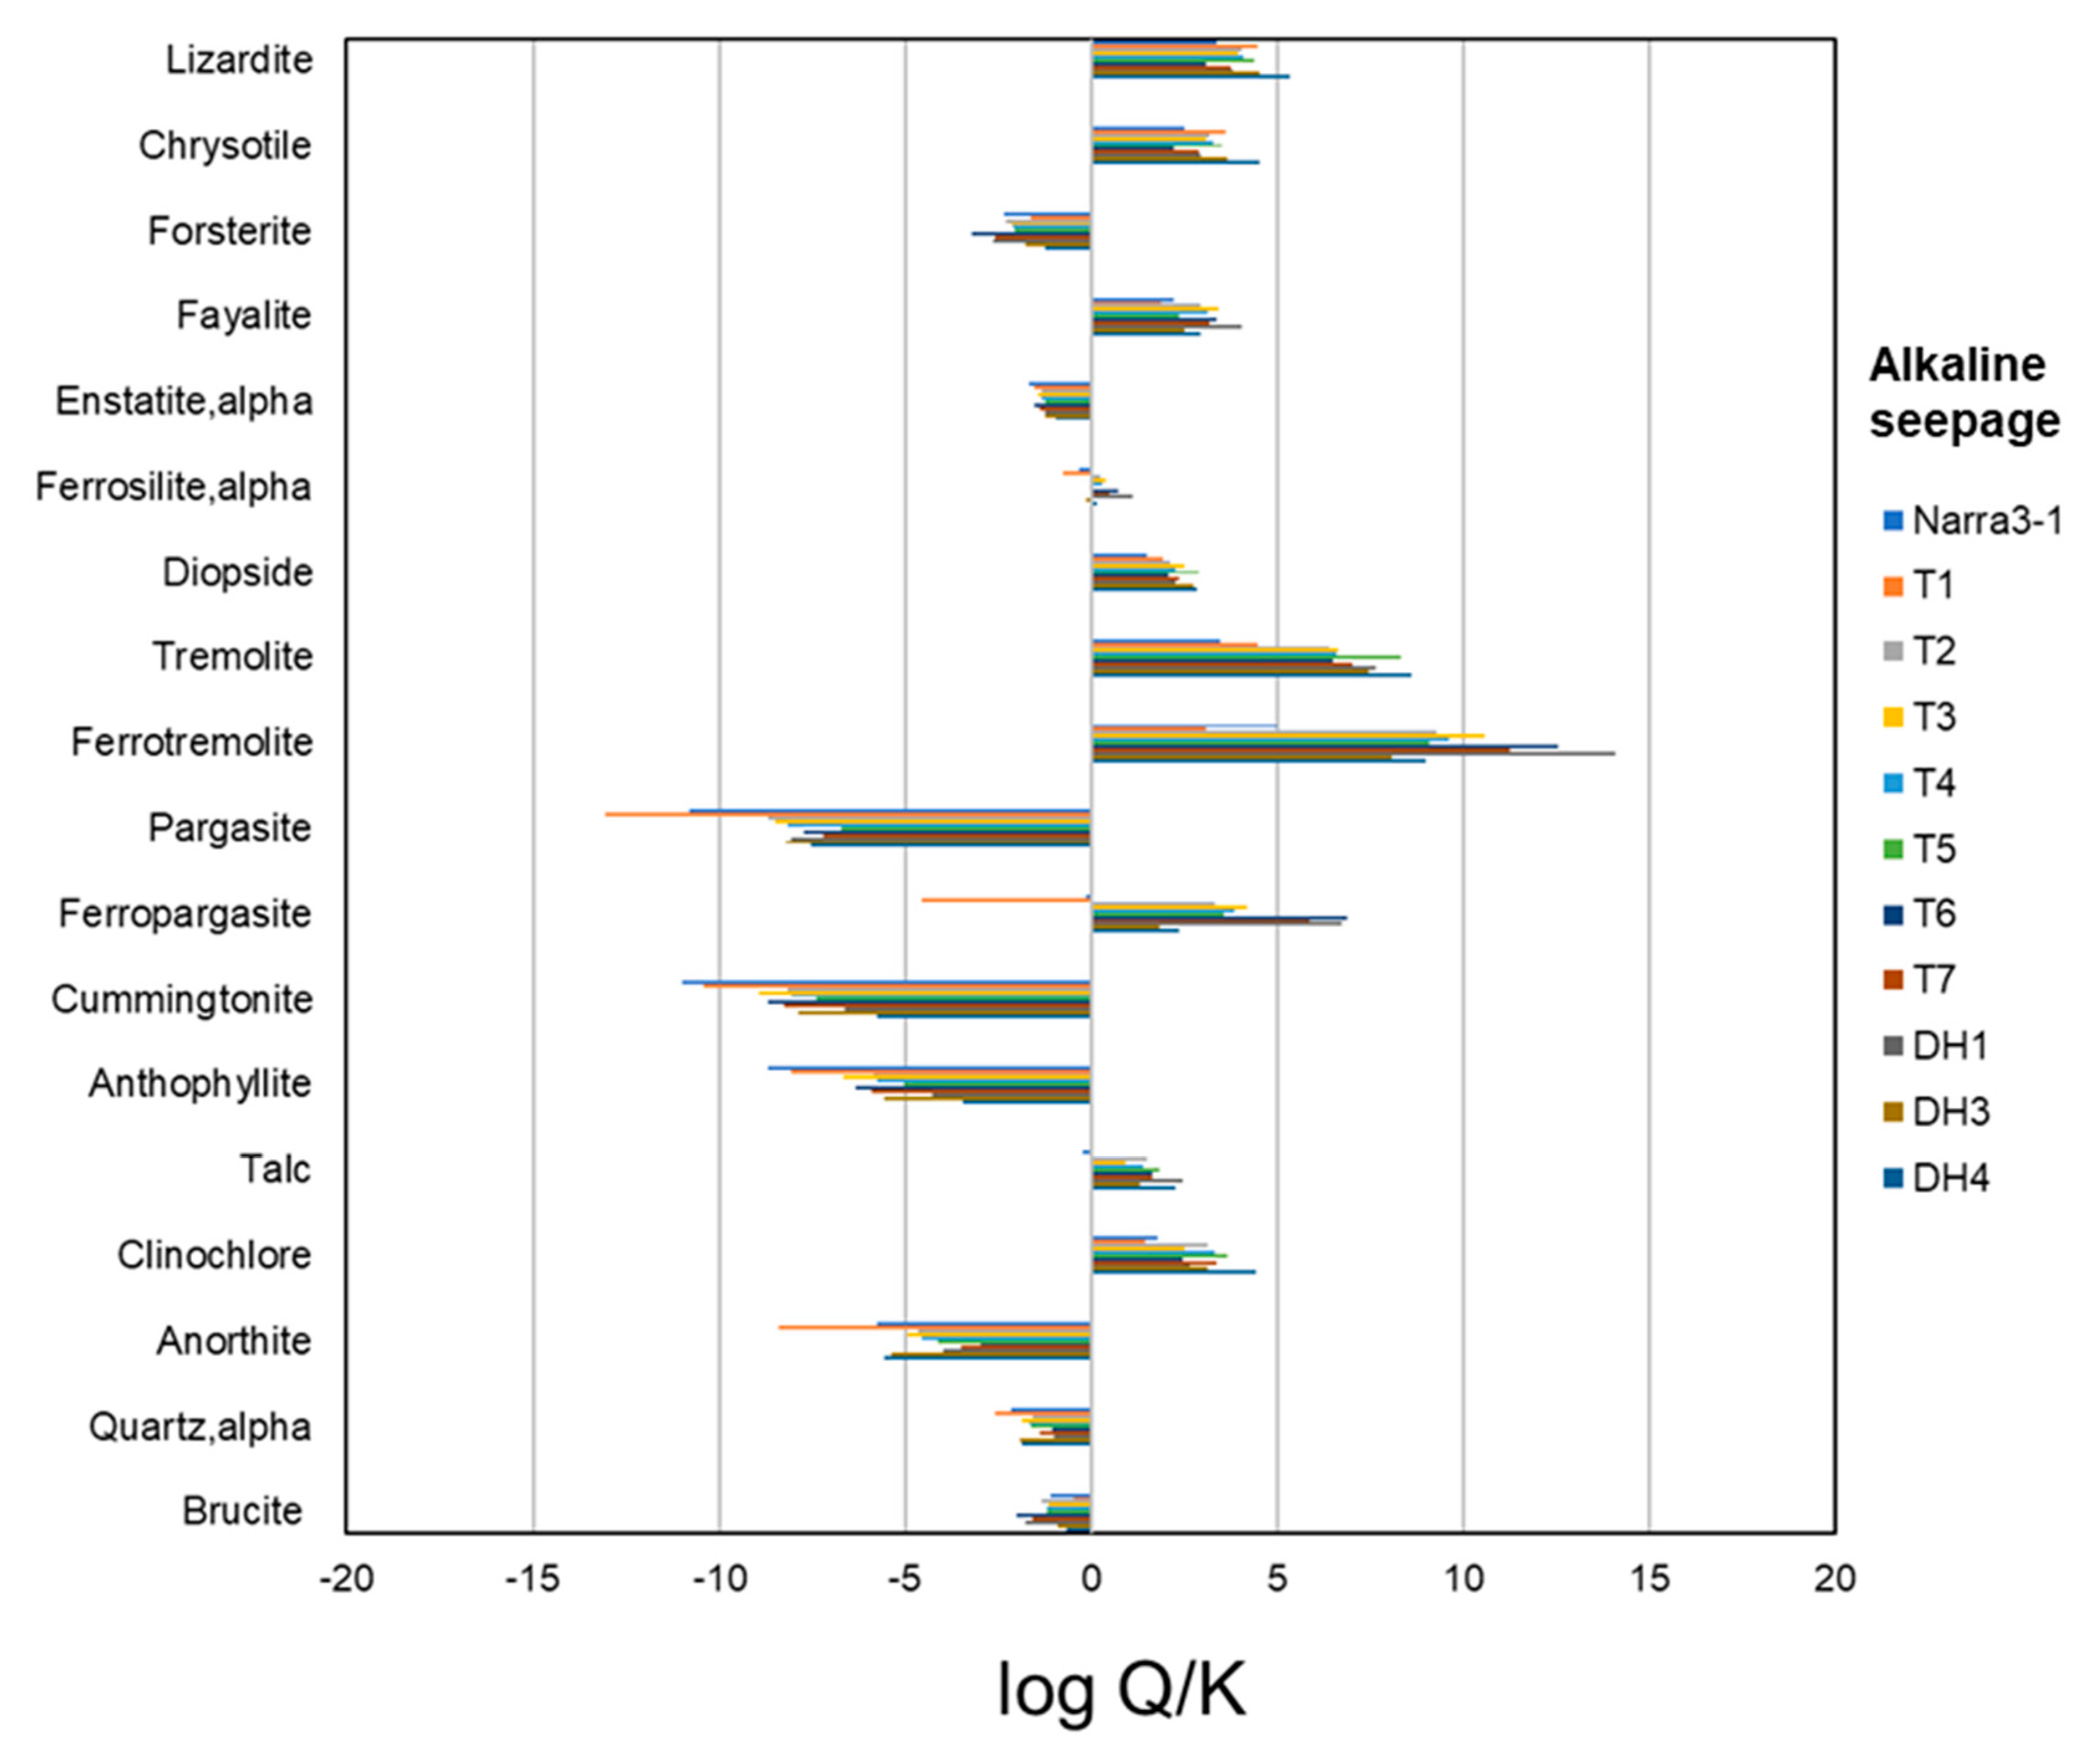
The saturation index of alkaline seepage with respect to possible primary minerals in the initial clastic sediments, namely serpentine, olivine, orthopyroxene, clinopyroxene, amphibole, talc, chlorite, plagioclase, and quartz (see discussion section), was calculated. Table A1 lists the minerals, which were considered for the calculation of the saturation index. Alkaline seepage was oversaturated with respect to serpentine, clinopyroxene, talc, and chlorite, whereas it was undersaturated with respect to plagioclase and quartz (Figure A9). The saturation index with respect to olivine, orthopyroxene, and amphibole depended on their respective chemical compositions; alkaline seepage tended to be oversaturated with respect to Fe-rich olivine, Fe-rich orthopyroxene, Fe-rich amphibole (i.e., ferrotremolite and ferropargasite), and Mg- and Ca-rich amphibole (i.e., tremolite), whereas it tended to remain undersaturated with respect to Mg-rich olivine, Mg-rich orthopyroxene, and Mg- and/or Ca and Al-rich amphibole (i.e., pargasite, cummingtonite, and anthophyllite). The calculated saturation index of alkaline seepage suggests that it may be undersaturated with respect to brucite (Figure A9).
Geochemical changes during the mixing of seawater or freshwater with the alkaline seepage were calculated to help predict the mixed fluid chemistry (Figure 10a). By mixing fluids, the pH of the fluid reduced variably when seawater or freshwater was considered (Figure 10a). The precipitates were initially brucite followed by magnesite when seawater was considered, whereas calcite was the dominant phase that precipitated when freshwater was considered (Figure 10b). The drastic decrease of pH at the initial stages (<0.05) of mixing with seawater (Figure 10a) can be explained with the precipitation of brucite (Figure 10b).

5. Discussion

5.1. Depositional Age and Environment

The different 14C ages of humin may imply differences in the depositional ages of the clastic sediments, although it is necessary to also consider the effect of deposition of old humin. The 14C age increased with increasing depth and the shallowest clastic sediment samples showed ages of 2560 14C yr BP (Figure 3), indicating that the overestimation of depositional age due to deposition of old humin was likely less than a few thousand years. Therefore, the measured 14C ages of humin can be considered as the depositional ages of the sediments with an error of a few thousand years.
The δ13C values of humin within the clastic sediments indicate different depositional environments, described as follows. In the middle of the fan and with decreasing depth, the δ13C values that were similar to marine sediments gradually changed to δ13C values analogous of freshwater sediments (Figure 4). This gradual change could be due either to a gradual increase of the influence of land-derived organic detritus, or the increase of the effect of light freshwater bicarbonate [18]. Therefore, the depositional environment likely changed from seawater to brackish water and then to freshwater. In contrast, the δ13C values in the shallower parts of the fan toe were between those of marine and freshwater sediments, thus indicating deposition within brackish waters (Figure 4b). This is consistent with the occurrence of shells, such as Faunas ater and Melanoides turbercula, whose habitats are brackish to freshwater, in the shallower parts of the clastic sediments [15].

5.2. Primary Minerals in the Clastic Sediments

It is important to understand the mineralogical compositions of the initial clastic sediments to understand the dissolution–precipitation geochemical reactions at the site. However, the mineralogical compositions of the collected samples were also influenced by long-term interactions, with some initial minerals already having been dissolved. Samples collected from ST2 were composed primarily of serpentine (Figure A1g), indicating a highly serpentinized peridotite or dunite source. The euhedral to subhedral minerals and the existence of orthopyroxene, serpentine, talc, and chlorite in Narra3-2 samples would be consistent with their transportation from a source proximal to Narra3-2 of highly serpentinized rocks, similar to those observed at ST2. However, the clastic sediments also contained a certain amount of orthopyroxene and amphibole. Moreover, plagioclase and quartz were observed. Gabbro was also recognized locally as intrusive rock near the site as well as serpentinized rocks [16]. These findings indicate that the initial clastic sediments originated from a combination of serpentinized rocks and gabbro. Therefore, the possible primary minerals in the initial clastic sediments would include serpentine, olivine, orthopyroxene, clinopyroxene, amphibole, talc, chlorite, plagioclase, and quartz.
The dissolution of primary minerals in the initial clastic sediments can be described by the saturation index of alkaline seepage with respect to each mineral. Samples containing olivine, clinopyroxene, plagioclase, and quartz were rare, regardless of depth. The alkaline seepage was undersaturated with respect to Mg-rich olivine, plagioclase, and quartz (Figure A9), indicating that some of these minerals were dissolved by the interaction with alkaline seepage. The fact that alkaline seepage was oversaturated with respect to Fe-rich olivine and clinopyroxene (Figure A9) explains the small amounts of these minerals in the initial clastic sediments. Conversely, the extensive occurrence of serpentine, talc, and chlorite in the samples of the study area is explained by the fact that the alkaline seepage was oversaturated with respect to these phases (Figure A9), suggesting that they remained stable during the interaction with the alkaline fluids. Variation in the abundance of serpentine in different samples could be due to its variable initial amount and/or, variations of other mineral contents due to dissolution–precipitation reactions. The alkaline seepage was undersaturated with respect to Mg-rich orthopyroxene, and Mg- and/or Ca and Al-rich amphibole (Figure A9), phases which were abundant in Narra3-2. Relatively large initial amounts and slow dissolution rates may explain the fact of their abundance in the present-day clastic sediments. The observed variations of the relative abundance of orthopyroxene and amphibole in different locations (Figure 5 and Figure 6) are likely related to differences in their initial amount, as well as partly to differences in their dissolution rates at different localities and the variable relative abundances of the rest of the phases caused by dissolution–precipitation reactions.

5.3. Fe-Mg-Si Infillings

The mineral with a broad 14 Å d-spacing in the <2-μm fraction was categorized into three types based on detailed XRD measurements. Type-I includes samples DH1-7, where the XRD pattern of this mineral exhibited low intensity and low expandability after EG treatment, indicating a trioctahedral sheet, and a peak at 14.6 Å in the dehydration state (Table 1). Type-II includes samples T4-3 and DH1-4, where the XRD pattern of this mineral showed moderate intensity and expandability after EG treatment, suggesting its trioctahedral sheet, and peaks at ~14–15 Å and 10 Å in the dehydration state (Table 1). Type-III includes samples DH4-9, DH3-1, and T7-7, where the XRD pattern of this mineral depicted moderate to high intensity and high expandability after EG treatment, indicating its dioctahedral sheet and peaks at ~14–15 Å and 10 Å in the dehydration state (Table 1). Sample T4-1 was classified as a mixture of Type-II and Type-III. In summary, in the middle of the fan, the mineral with a broad 14 Å d-spacing which occurred at the shallower depth belongs to Type-I or Type-II, whereas this same mineral from the deeper depth is Type-III. This mineral is Type-III in shallower parts of the fan toe.
The Fe-Mg-Si infillings in the clastic sediments showed variable chemical compositions in the different localities (Figure 9) coupled with the variations of the nature of the mineral with a broad 14 Å d-spacing. This fact implies that the Fe-Mg-Si infillings comprise the mineral with a broad 14 Å d-spacing. The Si content of the Fe-Mg-Si infillings tended to be higher in Type-III compared to Type-I and Type-II. The nature of the Type-III Fe-Mg-Si infillings is similar to smectite, in terms of their expandability after EG treatment and dehydration state; however, the 14–15 Å peak in the dehydration state implies the presence of other phases, as well. According to the d-spacings of the 060 reflection, Type-III Fe-Mg-Si infillings is a nontronite (dioctahedral smectite)-like mineral. In contrast, the Type-I Fe-Mg-Si infillings exhibit expandability lower than that of smectite after EG treatment but no dehydration behavior, similar to chlorite. Thus, the Type-I infillings show distinct differences from both smectite and chlorite. The Type-II Fe-Mg-Si infillings exhibit a nature intermediate between Type-I Fe-Mg-Si infillings and trioctahedral smectite. The uncertainty of their complete characterizations of the Types-I and II Fe-Mg-Si infillings led us to call them as iron-magnesium-silicate-hydrate (F-M-S-H). The detailed mineralogical and structural characterization of F-M-S-H will be reported in a future paper. In this study, the distribution of mineralogy throughout the site was revealed for the first time. In the middle of the fan, the nature of the Fe-Mg-Si infillings differs with depth, in that the dominant Fe-Mg-Si infillings comprise F-M-S-H in the shallower parts and the nontronite-like mineral in the deeper parts. The Fe-Mg-Si infillings of the shallower parts of the fan toe are rich in the nontronite-like mineral.
Shimbashi et al. [12] reported that poorly crystalline components such as M-S-H and iron-silicate-hydrate (F-S-H) occurring at the shallower depth may transform to smectite in deeper parts. However, this transformation mechanism is still uncertain, as it is newly revealed by the occurrence of the nontronite-like mineral at the shallower parts of the fan toe. Deposition of the sediments in seawater and brackish water environments have occurred in the deeper parts of the middle of the fan and the shallower parts of the fan toe (Figure 4). This location corresponds to the distribution of the nontronite-like mineral, suggesting the possibility that a depositional environment in seawater and brackish water could have affected the geochemical processes determining the species of Fe-Mg-Si infillings (i.e., F-M-S-H or nontronite-like mineral). As a result that the advection of alkaline seepage accounts for major mass transfer, the nontronite-like mineral could have been formed by the interaction between clastic sediments and alkaline seepage in the presence of seawater or brackish water infiltration. In contrast, F-M-S-H could have formed by a similar interaction without the involvement of seawater.
In the geochemical reaction model, changes in the fluid chemistry caused by seawater infiltration were calculated to understand the factors influencing the type of Fe-Mg-Si infilling formed (Figure 10). As a result that advection of alkaline seepage accounts for major mass transfer, the mixing ratio of seawater or freshwater to alkaline seepage was predicted to be small. Our calculations showed that pH decreased drastically at low ratios of seawater to alkaline seepage (Figure 10a). This change of pH, as well as a change of dissolved ion concentration, may be determinant factors for the type of Fe-Mg-Si infilling (i.e., F-M-S-H or nontronite-like mineral).
The stable phases under alkaline conditions are different in the presence or absence of seawater infiltration. Although brucite can be formed by the mixing of alkaline seepage with a small amount of seawater (Figure 10b), this mineral was not commonly observed in the present-day clastic sediments. The alkaline seepage was undersaturated with respect to brucite (Figure A9); therefore, brucite may have already been dissolved after the seawater infiltration ended. The nontronite-like mineral was observed in the present-day clastic sediments, implying that it was stable under alkaline conditions even after the cessation of the seawater infiltration, although unfortunately the saturation index with respect to nontronite is unknown due to the lack of information regarding the valence of dissolved Fe ions. As a result that seawater infiltration was ended thousands of years ago in the middle of the fan (Figure 3 and Figure 4), the nontronite-like mineral has likely been stable under present-day alkaline conditions for thousands of years after the cessation of the seawater infiltration.

5.4. Ca-Si Infillings

The Ca-Si infillings occupy the intergranular voids of the mineral assemblage and the Fe-Mg-Si infillings (Figure 8b). Their occurrence was observed in the samples for which XRD analysis suggested the existence of the 14 Å tobermorite (plombierite). The Ca/Si ratio of the ideal 14 Å tobermorite is 0.83 [21], which is similar to or slightly higher than the Ca/Si ratios of the Ca-Si infillings (Figure A5). It is therefore inferred that the Ca-Si infillings comprise mostly 14 Å tobermorite, while the local lower Ca/Si ratios can be explained from the effect of mixing with other phases with lower Ca/Si ratios, such as calcium silicate hydrates (C-S-H). Shimbashi et al. [12] have reported the formation of tobermorite and C-S-H in the study area; however, this study documents that tobermorite was distributed at a depth of ~4 m, just below the calcite-rich surface (Figure 5 and Figure 6).
The supply of Ca and Si ions derived from dissolution of minerals likely played an important role in the precipitation of tobermorite. Calcite is occasionally observed inside these Ca-Si infillings (Figure 8b). The calcite-rich surface layer thins from the fan apex towards the fan toe (Figure 6d). As the alkaline seepage had a pH > 11 and high Ca content [12], calcite on the surface could precipitate by mixing of the alkaline seepage with surface water rich in HCO3 content or CO2 gas, and dissolved Ca ions in the alkaline seepage decreased with distance toward the fan toe. On the other hand, calcite could have become unstable if the supply of CO2 from the surface was sufficiently decreased by subsequent sedimentation. In this case, the dissolution of calcite may have triggered tobermorite precipitation at the immediately lower depth. Moreover, sufficient Si and/or Ca supply from the dissolution of silicates would be needed for the precipitation of tobermorite as well. The absence of tobermorite from certain samples (e.g., T4) at depths of 4 m, just under calcite-rich layer can be explained by the likely inadequate supply of Si and Ca due to limited dissolution of silicate minerals. Below the depth of 4m, the absence of tobermorite can be explained by the inadequate dissolution of silicates or by changes of the fluid chemistry within the different depositional environments (Figure 4). Amphibole and orthopyroxene are thought to have been dissolved by the interaction with alkaline seepage (Figure A9); therefore, these minerals represent good candidates which likely played an important role in the precipitation of tobermorite.

6. Conclusions

This study reveals the temporal-spatial distribution of primary and secondary minerals and their related depositional environments to understand long-term dissolution–precipitation reactions under alkaline conditions in a chemically complex system. The deposition of clastic sediments at Narra, derived from serpentinized ultramafic rocks and gabbro of the Palawan ophiolite, started 15,000 yr BP, as it has been documented by 14C dates. The depositional environment gradually changed from seawater to brackish water at the fan toe and finally to freshwater in the middle of the fan. The clastic sediments interacted with alkaline seepage with a pH of over 11, forming two main phases: (1) Fe-Mg-Si infillings, and (2) Ca-Si infillings. The Fe-Mg-Si infillings were observed widely in the clastic sediments and differed with increasing depth from F-M-S-H to a nontronite-like mineral in the middle of the fan. In contrast, the nontronite-like mineral formed even in the shallower parts of the fan toe. The distribution of the nontronite-like mineral suggests that infiltration of seawater during the interaction between clastic sediments and alkaline seepage could be responsible for its formation. Moreover, the nontronite-like mineral was stable under present-day alkaline conditions after the end of the seawater infiltration, for a period of thousands of years. Conversely, F-M-S-H was formed by the interaction between clastic sediments and alkaline seepage without the involvement of seawater. The Ca-Si infillings include 14 Å tobermorite, which formed at depths of 4 m just below the calcite-rich surface layer. The precipitation of tobermorite was related to the dissolution of calcite and/or silicates in the clastic sediments due to interaction with alkaline seepage. This study reveals long-term dissolution–precipitation interactions and the conditions that form different mineral species under alkaline conditions. This may help to select suitable mineral species precipitated under similar alkaline conditions which were generated by the alteration of low-alkaline cement within radioactive waste disposal facilities.

Author Contributions

M.S. was the principal author and conducted the field survey, sampling, and analyses, and wrote the paper. S.Y. and Y.W. provided advice throughout the analyses and writing of this paper. T.S. was the chief supervisor of M.S. in the doctoral course and designed the study. T.O. and R.K. were also supervisors and provided geochemical advice. M.Y. contributed to the study as a geologist and petrologist. N.F. was the principal overseer of the project. All authors have read and agreed to the published version of the manuscript.

Funding

This research was initiated within the “Advanced technology development for geological disposal of TRU waste” program commissioned by Agency for Natural Resources and Energy in Ministry of Economy, Trade and Industry of Japan. This work was also supported by JSPS KAKENHI Grant Number JP19H00878.

Acknowledgments

The authors thank Masanobu Nishimura and Yukinobu Kimura of the Obayashi Corporation, W. Russell Alexander of Bedrock Geosciences, and Carlo Arcilla at the University of the Philippines for assistance with the field survey.

Conflicts of Interest

The authors declare no conflict of interest.

Appendix A

Figure A1. XRD profile of randomly oriented samples: (a) T4-2; (b) T3-2; (c) T2-18; (d) T8-3; (e) T7-2; (f) DH4-3; (g) ST2-1; Srp—serpentine; Opx—orthopyroxene; Amp—amphibole; Tc—talc; Chl: chlorite; Cal—calcite; Tob—14 Å tobermorite; Plag—plagioclase; Cpx—clinopyroxene; Mag—magnetite.
Minerals 10 00719 g0a1
Figure A2. Chemical composition of the two types of infillings in sample T3-2.
Minerals 10 00719 g0a2
Figure A3. The (Fe + Mg + Al)/Si ratio of Fe-Mg-Si infillings in each sample. Results are expressed as box and whisker plots. The solid line in middle box represents the median value, while ends of the boxes show the locations of the first and third quartiles (Q1 and Q3). The ends of the whiskers extend to the lowest and highest observations inside the region defined by Q1 1.5(Q3 Q1) and Q3 + 1.5(Q3 Q1). Values that fall beyond the whiskers are plotted as individual points (empty circle).
Minerals 10 00719 g0a3
Figure A4. The (Fe + Mg)/(Si + Al) ratio of Fe-Mg-Si infillings in each sample. Results are expressed as box and whisker plots. Legends are the same as for Figure A3.
Minerals 10 00719 g0a4
Figure A5. The Ca/Si ratio of Ca-Si infillings in each sample. Results are expressed as box and whisker plots. Legends are the same as for Figure A3.
Minerals 10 00719 g0a5
Figure A6. XRD profile before and after EG treatment: (a) DH1-7; (b) T4-3; (c) DH1-4; (d) T4-1; (e) DH4-9; (f) DH3-1; (g) T7-7; Srp—serpentine.
Minerals 10 00719 g0a6
Figure A7. XRD profile of the 060 reflection of the <2-μm fraction: (a) DH1-7; (b) T4-3; (c) DH1-4; (d) T4-1; (e) DH4-9; (f) DH3-1; and (g) T7-7.
Minerals 10 00719 g0a7
Figure A8. XRD profile before and during heat treatment at 250 °C: (a) DH1-7; (b) T4-3; (c) DH1-4; (d) T4-1; (e) DH4-9; (f) DH3-1; (g) T7-7; Srp—serpentine.
Minerals 10 00719 g0a8
Table A1. Characteristics of minerals used to calculate saturation indexes.
MineralsMineral Species in DatabaseChemical Composition
SerpentineLizarditeMg3Si2O5(OH)4
ChrysotileMg3Si2O5(OH)4
OlivineForsteriteMg2SiO4
FayaliteFe2SiO4
OrthopyroxeneEnstatite, alphaMgSiO3
Ferrosilite, alphaFeSiO3
ClinopyroxeneDiopsideCaMg(SiO3)2
AmphiboleTremolite(Ca2Mg5)Si8O22(OH)2
Ferrotremolite(Ca2Fe5)Si8O22(OH)2
PargasiteNa(Ca2Mg4Al)(Al2Si6)O22(OH)2
FerropargasiteNa(Ca2Fe4Al)(Al2Si6)O22(OH)2
CummingtoniteMg7Si8O22(OH)2
AnthophylliteMg7Si8O22(OH)2
TalcTalcMg3Si4O10(OH)2
ChloriteClinochloreMg5Al(AlSi3)O10(OH)8
PlagioclaseAnorthiteCa(Al2Si2)O8
QuartzQuartz, alphaSiO2
BruciteBruciteMg(OH)2
Figure A9. Saturation index (log Q/K; Q—activity ion products; K—equilibrium constants) of alkaline water with respect to possible primary minerals in the initial clastic sediments and brucite.
Minerals 10 00719 g0a9

References

  1. Atkinson, A. The Time Dependence of pH within a Repository for Radioactive Waste Desposal; UKAEA: Harwell, UK, 1985.
  2. Nakayama, S.; Sakamoto, Y.; Yamaguchi, T.; Akai, M.; Tanaka, T.; Sato, T.; Iida, Y. Dissolution of montmorillonite in compacted bentonite by highly alkaline aqueous solutions and diffusivity of hydroxide ions. Appl. Clay Sci. 2004, 27, 53–65. [Google Scholar] [CrossRef]
  3. Rozalén, M.L.; Huertas, F.J.; Brady, P.V.; Cama, J.; García-Palma, S.; Linares, J. Experimental study of the effect of pH on the kinetics of montmorillonite dissolution at 25 °C. Geochim. Cosmochim. Acta 2008, 72, 4224–4253. [Google Scholar] [CrossRef]
  4. Taubald, H.; Bauer, A.; Schäfer, T.; Geckeis, H.; Satir, M.; Kim, J.I. Experimental investigation of the effect of high-pH solutions on the Opalinus Shale and the Hammerschmiede Smectite. Clay Miner. 2000, 35, 515–524. [Google Scholar] [CrossRef]
  5. Barnes, I.; O’Neil, J.R. Present day serpentinization in New Caledonia, Oman and Yugoslavia. Geochim. Cosmochim. Acta 1978, 42, 144–145. Available online: http://horizon.documentation.ird.fr/exl-doc/pleins_textes/pleins_textes_5/b_fdi_08-09/09131.pdf (accessed on 20 April 2020). [CrossRef]
  6. Bruni, J.; Canepa, M.; Chiodini, G.; Cioni, R.; Cipolli, F.; Longinelli, A.; Marini, L.; Ottonello, G.; Zuccolini, M.V. Irreversible water-rock mass transfer accompanying the generation of the neutral, Mg–HCO3 and high-pH, Ca–OH spring waters of the Genova province, Italy. Appl. Geochem. 2002, 17, 455–474. [Google Scholar] [CrossRef]
  7. Fujii, N.; Yamakawa, M.; Shikazono, N.; Sato, T. Geochemical and mineralogical characterizations of bentonite interacted with alkaline fluids generating in Zambales Ophiolite, Northwestern Luzons, Philippines. Geol. Soc. Jpn. 2014, 120, 361–375. [Google Scholar] [CrossRef] [Green Version]
  8. Milodowski, A.E.; Norris, S.; Alexander, W.R. Minimal alteration of montmorillonite following long-term interaction with natural alkaline groundwater: Implications for geological disposal of radioactive waste. Appl. Geochem. 2016, 66, 184–197. [Google Scholar] [CrossRef]
  9. Nishiki, Y.; Sato, T.; Katoh, T.; Otake, T.; Kikuchi, R. Precipitation of magnesium silicate hydrates in natural alkaline surface environments. Clay Sci. 2020, 24, 1–13. [Google Scholar] [CrossRef]
  10. Furquim, S.A.C.; Barbiéro, L.; Graham, R.C.; de Queiroz Neto, J.P.; Ferreira, R.P.D.; Furian, S. Neoformation of micas in soils surrounding an alkaline-saline lake of Pantanal wetland, Brazil. Geoderma 2010, 158, 331–342. [Google Scholar] [CrossRef]
  11. Hay, R.L.; Guldman, S.G.; Matthews, J.C.; Lander, R.H.; Duffin, M.E.; Kyser, T.K. Clay mineral diagenesis in core KM-3 of Searles Lake, California. Clays Clay Miner. 1991, 39, 84–96. [Google Scholar] [CrossRef]
  12. Shimbashi, M.; Sato, T.; Yamakawa, M.; Fujii, N.; Otake, T. Formation of Fe-and Mg-rich smectite under hyperalkaline conditions at narra in Palawan, the Philippines. Minerals 2018, 8, 155. [Google Scholar] [CrossRef] [Green Version]
  13. Aurelio, M.A.; Forbes, M.T.; Taguibao, K.J.L.; Savella, R.B.; Bacud, J.A.; Franke, D.; Pubellier, M.; Savva, D.; Meresse, F.; Steuer, S.; et al. Middle to Late Cenozoic tectonic events in south and central Palawan (Philippines) and their implications to the evolution of the south-eastern margin of South China Sea: Evidence from onshore structural and offshore seismic data. Mar. Pet. Geol. 2014, 58, 658–673. [Google Scholar] [CrossRef]
  14. RWMC. Advancement of Processing and Disposal Technique for the Geological Disposal of TRU Waste (FY2015). 2016. Available online: https://www.enecho.meti.go.jp/category/electricity_and_gas/nuclear/rw/library/library06.html (accessed on 20 April 2020).
  15. RWMC. Advancement of Processing and Disposal Technique for the Geological Disposal of TRU Waste (FY2016). 2017. Available online: https://www.enecho.meti.go.jp/category/electricity_and_gas/nuclear/rw/library/library06.html (accessed on 20 April 2020).
  16. RWMC. Advancement of Processing and Disposal Technique for the Geological Disposal of TRU Waste (FY2017). 2018. Available online: https://www.enecho.meti.go.jp/category/electricity_and_gas/nuclear/rw/library/library06.html (accessed on 20 April 2020).
  17. García Calvo, J.L.; Hidalgo, A.; Alonso, C.; Fernández Luco, L. Development of low-pH cementitious materials for HLRW repositories: Resistance against ground waters aggression. Cem. Concr. Res. 2010, 40, 1290–1297. [Google Scholar] [CrossRef]
  18. Degens, E.T. Biogeochemistry of Stable Carbon Isotopes. In Organic Geochemistry; Springer: Berlin/Heidelberg, Germany, 1969. [Google Scholar]
  19. Shimbashi, M.; Yokoyama, S.; Watanabe, Y.; Fujii, N.; Yamakawa, M.; Sato, T. Mineralogical evolution of Fe-Mg-Si phases under low-temperature, alkaline conditions at Narra in Palawan, Philippines. In Proceedings of the NAWG 16th Workshop, Yamagata, Japan, 15 October 2019. [Google Scholar]
  20. Appelo, C.A.J. Cation and proton exchange, pH variations, and carbonate reactions in a freshening aquifer. Water Resour. Res. 1994, 30, 2793–2805. [Google Scholar] [CrossRef]
  21. Bonaccorsi, E.; Merlino, S.; Kampf, A.R. The crystal structure of tobermorite 14 Å (plombierite), a C-S-H phase. J. Am. Ceram. Soc. 2005, 88, 505–512. [Google Scholar] [CrossRef]
Figure 1. (a) Map of the study area (Google Earth 2020); and (b) conceptual diagram of Narra3-1 and Narra3-2 showing sections A-a and B-b and location of sampling sites.
Minerals 10 00719 g001
Figure 2. Photographs of sampling sites: (a) cross-section of T3; (b) cross-section of T7; (c) cavity of T5 after simplified pumping test for measurement of flow velocity; and (d) cross-section of ST2.
Minerals 10 00719 g002
Figure 3. Relationship between depth and 14C ages of humin extracted from the clastic sediments in the middle of the fan (T2, T3, T4, DH1, DH3, and DH4) and at the fan toe (T7).
Minerals 10 00719 g003
Figure 4. Contour maps of δ13C values of humin: (a) section A-a; and (b) section B-b. Plus signs show the locations of analyzed samples.
Minerals 10 00719 g004
Figure 5. Contour maps of the XRD peak intensities of minerals in section A-a: (a) Srp—serpentine; (b) Opx—orthopyroxene; (c) Amp—amphibole; (d) Cal—calcite; (e) Tob—14 Å tobermorite; (f) 14 Å d-spacing—mineral with a broad 14 Å d-spacing. Plus signs show the locations of the analyzed samples.
Minerals 10 00719 g005
Figure 6. Contour maps of the XRD peak intensities of minerals in section B-b: (a) Srp—serpentine; (b) Opx—orthopyroxene; (c) Amp—amphibole; (d) Cal—calcite; (e) Tob—14 Å tobermorite; (f) 14 Å d-spacing—mineral with a broad 14 Å d-spacing. Plus signs show the locations of analyzed samples.
Minerals 10 00719 g006
Figure 7. Backscattered electron images of the assemblages from selected samples: (a) T2-2; (b) DH3-1; (c) DH4-9; (d) DH3-1; (e) DH3-6; and (f) T2-2; Opx—orthopyroxene; Amp—amphibole; Srp—serpentine; Tc—talc; Chl—chlorite; Plag—plagioclase; Chrm—chromite.
Minerals 10 00719 g007
Figure 8. Backscattered electron images of infillings in selected samples: (a) T3-4; and (b) T3-2; Cal—calcite.
Minerals 10 00719 g008
Figure 9. Distribution of the median of (Fe + Mg + Al)/Si (panels a and c) and median of (Fe + Mg)/(Si + Al) (panels b and d) ratios of the Fe-Mg-Si infillings along depth in the study areas: (a,b) section A-a; and (c,d) section B-b. Plus signs show the locations of the analyzed samples.
Minerals 10 00719 g009
Figure 10. Geochemical reaction models of mixing between seawater or freshwater and alkaline seepage: (a) pH; and (b) formed minerals.
Minerals 10 00719 g010
Table 1. The 14C ages of humin and XRD analysis results for the <2-μm fraction in the middle of the fan (T4, DH1, DH3, DH4) and at the fan toe (T7).
SampleDepth [m]14C Age [14C yr BP]Intensity of Broad 14 Å d-Spacingd(001) after EG Treatment [Å]d(060) [Å]d(001) during Heating at 250 °C [Å]Type
DH1-72.24520low15.91.5314.6Type-I
T4-32.85060middle16.41.5313.6 + 10.1Type-II
DH1-43.79010middle16.71.5415.3 + 9.9Type-II
T4-13.96300middle16.71.54 + 1.5214.7 + 10.0Type-II + Type-III
DH4-9814,110high17.01.5115.1 + 9.9Type-III
DH3-11015,000high17.01.5114.9 + 9.9Type-III
T7-70.74010middle–high17.01.5114.6 + 10.1Type-III