Abstract
Outer shelf sedimentary records are promising for determining the recurrence intervals of tsunamis. However, compared to onshore deposits, offshore deposits are more difficult to access, and so far, studies of outer shelf tsunami deposits are scarce. Here, an example of studying these deposits is presented to infer implications for tsunami-related signatures in similar environments and potentially contribute to pre-historic tsunami event detections. A multidisciplinary approach was performed to detect the sedimentary imprints left by the 1755 CE tsunami in two cores, located in the southern Portuguese continental shelf at water depths of 58 and 91 m. Age models based on 14C and 210Pbxs allowed a probable correspondence with the 1755 CE tsunami event. A multi-proxy approach, including sand composition, grain-size, inorganic geochemistry, magnetic susceptibility, and microtextural features on quartz grain surfaces, yielded evidence for a tsunami depositional signature, although only a subtle terrestrial signal is present. A low contribution of terrestrial material to outer shelf tsunami deposits calls for methodologies that reveal sedimentary structures linked to tsunami event hydrodynamics. Finally, a change in general sedimentation after the tsunami event might have influenced the signature of the 1755 CE tsunami in the outer shelf environment.
1. Introduction
Research related to tsunamis has increased significantly in the last two decades, focusing not only on retrieving return periods, but also on understanding tsunami event dynamics [1]. Defining the coastal hazard of tsunamis by studying their sedimentary records benefits from their extensive chronology compared to instrumental or historic documentation [2,3,4]. While onshore tsunami deposits are easy to access, they lack the better preservation potential and spatial coverage of offshore deposits [5,6,7], recorded mainly by highly sediment-laden backwash flows. However, post-sedimentary processes, such as waves, currents, and bioturbation, can alter tsunami deposits in the offshore realm [8,9,10], making the selection of the study area of key importance. Although it might be less likely to have significant sedimentary imprints of tsunamis in deeper offshore areas (i.e., mid to outer shelf) [5], the controversial differentiation between tsunami and storm deposits [11] can be neglected when studying sediments beneath the storm wave base [12]. Relatively few studies have focused on analyzing deeper offshore sedimentary records [2,3,8,13,14,15,16,17,18,19,20,21,22] and even fewer have involved possible historical/palaeotsunami deposits in such environments [2,3,4,13,17,22,23,24,25,26].
Generally, after tsunami waves inundate the coastal areas, backwash flows, generated by gravity, erode, transport, and deposit land-derived or near-shore material farther offshore [27,28]. However, the resuspension of seafloor material induced by the landward propagating tsunami wave is another sedimentation process frequently observed in sedimentary records. This process is traced by an erosional contact at the base of offshore tsunami units [3,15,20]. Different sedimentation processes within a tsunami event and widely differing coastal and shelf settings characterized by varying topography/bathymetry and sediment sources lead to varying characteristics of tsunami sediments. Overall, this makes a clear identification of a tsunami deposit based on a single characteristic very unlikely. Consequently, exploring tsunami-related deposits demands a multiproxy approach covering several sedimentary aspects such as geochemistry, micropaleontology, and magnetic and textural analysis to differentiate the event unit from the background sedimentation [19,29,30]. Grain size variations and allochthonous materials (e.g., shell, coral fragments, or coastal foraminifera species) reinforced by inorganic geochemical signatures are most indicative of an offshore tsunami event unit [2,3,4,15,17,20,22]. Moreover, peaks of different sediment components have been utilized to serve as a tsunami backwash tracer. These range from biogenic components such as terrestrial plant fragments [10], mollusk fragments from the littoral zone [4,8,17,25] and low numbers of foraminifera at the base of tsunami layers [3,20,31] to lithic fragments of continental rocks such as quartz, mica (Illite) [4] and opaque minerals [32]. Another advantage of studying sediment composition is the varying hydrodynamical behavior of the different components attributed to their shape and density, which helps illuminate sedimentation dynamics of tsunami events. Going a step further in resolution, microtextural features on quartz grain surfaces can also be used to study (onshore) tsunami deposits [33,34,35]. For example, in subaqueous high-energy environments with a high sediment concentration regime, grain collisions imprint percussion marks (such as v-shaped patterns) and fresh surfaces on quartz grains [36]. However, superficial imprints on grains caused by tsunamis are biased by the grain’s provenance since the geomorphological context plays an important role in the imprint intensity [37]. Thus, variations in microtextures of tsunami grains compared to non-tsunami grains might not be straight forward.
In 1755 CE, southwest of Portugal, an earthquake of 8.5 ± 0.3 MW (moment magnitude) occurred [38] and triggered the well-studied 1755 CE Lisbon tsunami. The present study explores sedimentary evidence of this tsunami by analyzing sediment records from two gravity cores, located in the southern Portuguese shelf at water depths of 58 m and 91 m. In preliminary work, sedimentological data and age estimations show distinct layers, most probably originating from the backwash of the 1755 CE tsunami in these cores [39] (Section 1.2). Also, in another core (VC2B) located in proximity to the cores of the present study (Figure 1), offshore evidence of the 1755 CE tsunami event has already been detected through the identification of a coarser layer coupled with a significant increase in coastal foraminifera species, controlled by compatible 14C and 210Pb age estimations [22]. Based on these findings, the preliminarily identified units of these two cores are used to explore other possible imprints to substantiate the interpretation of a tsunami event unit and hereby enlarge the possibilities to detect offshore tsunami signatures. Thus, a sand composition (SC) analysis, incorporating components previously attributed to offshore tsunami sedimentation, multivariate statistical analysis of sedimentological proxies (such as magnetic susceptibility (MS), geochemistry, and grain size), and microtextures on quartz grain surfaces (MT) were examined in the present study. SC and MT analyses are used for the first time to study offshore tsunami deposits in the mid to outer continental shelf environment. The MT analysis is implemented speculatively to explore its potential for tsunami deposits identification in deeper realms. Expanding the possibilities to detect offshore tsunami sediments will support offshore tsunami sediment identification and will provide for additional insights into the dynamics of tsunami sedimentation. Also, tsunami recurrence intervals derived from sedimentary records will be more reliable with a larger set of proven proxies for tsunami signatures in sedimentary records.
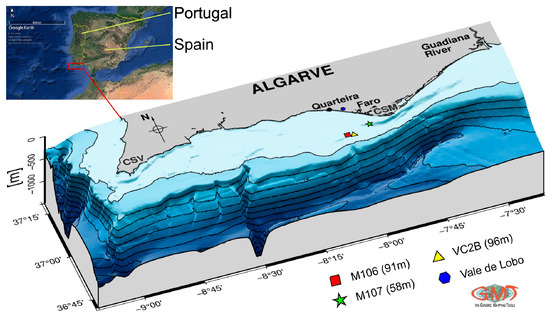
Figure 1.
Bathymetry map of the study area in 3D-perspective and core locations. The contour lines are at 100 m intervals. Cores M106 (red, 91 m bsl) and M107 (green, 58 m bsl) were analyzed in the present study, while core VC2B (yellow, 96 m bsl) was analyzed for tsunami imprints by Quintela et al. [19]. CSV = Cape St. Vincent; CSM = Cape Santa Maria. The map was produced using GMT v6.0 [49].
Ultimately, exploring offshore tsunami sediments will aid assessment of tsunami hazard and risk. Studying offshore tsunami deposits related to the 1755 CE Lisbon tsunami in the southern Portuguese shelf has advantages as it has well-studied onshore deposits [34,40,41,42,43,44,45,46] and the fact that, out of seven verified historical tsunamis hitting Portugal, only the 1755 CE tsunami left geological evidence onshore [47]. Hence, this event is not only recognized as the most damaging tsunami that hit Europe since Roman times, but also, its geological imprint is remarkable and the object of numerous studies. This provides a good framework for exploring offshore tsunami deposits that can have small variations to the background sedimentation and small deposit thicknesses.
1.1. Study Site
The two studied gravity cores MW14-GC-106 (referred to as M106) (36.89° N, −8.07° W) and MW14-GC-107 (referred to as M107) (36.93° N, −7.99° W) were retrieved in 2014 (during the MOWER project sea mission [48]) from 91 m and 58 m below sea level (bsl), respectively. Core locations lie in the southern Portuguese continental shelf and correspond to the Eastern Algarve proximal continental margin about 15 km and 7 km offshore Quarteira/Faro for core M106 and M107, respectively (Figure 1).
In the study area, the outer shelf passes over to the continental slope at depths of approximately 100 m. The shelf has a slope gradient of 0.3° to 0.4° in the outer continental shelf (core M106) and up to 2° in the inner continental shelf (core M107). The narrow width (ca. 5 km off Faro) and relatively high slope gradients of the continental shelf in proximity to the Cape Santa Maria (CSM) are created by the erosive action of the Mediterranean outflow water (MOW) [50]. The CSM divides the western and eastern continental shelves with distinct surface water currents generated by two gyres, the cyclonic eddy off Cape São Vicente (CSV) and a coastal counter current (CCC), respectively [51]. With strong easterlies, the CCC bifurcates off CSM and invades the western part of the shelf [52]. Further, in the study area 70% of the waves originate from SW and 30% from SE with maximal significant wave heights of 7 m, although the wave climate is characterized by a predominantly smooth and moderate sea state [53]. The main contributors of sediments to the shelf off Algarve are cliff erosion [54] and the input of rivers, mainly the Guadiana River [55]. The red sand cliffs (Pleistocene) at Vale de Lobo consist mainly of quartz and clay minerals with accessory goethite, feldspars, and Ti-oxides. Illite and kaolinite dominate the clay fraction [56]. Generally, only the fine particles are deposited on the shelf because sands are directly transported eastwards by alongshore currents. However, the fine-grained material is to 86% transported further beyond the outer shelf, while the remaining 14% is deposited on the shelf [57]. The present high stand stage hydrodynamic conditions (since ca. 4.0 ky) favor depositional processes and add sediments to the continental shelf sedimentary cover [50]. Cores M106 and M107 are located in the outer shelf and inner shelf sub-domains, respectively [50]. The inner shelf is mostly covered by quartz-bioclastic sands with varying grain-size, while the mid to outer shelf is covered by mud and sandy-mud [58]. The main source of these distal aggradational deposits is interpreted to be point sources far from this area and controlled by along-shelf currents and a reduced local fluvial supply [59].
1.2. Previous Study
Some results of a previous study within the ASTARTE project (www.astarte-project.eu) are described and have been used to analyze specific layers (Figure 2) in order to study possible 1755 CE tsunami deposits in a more sophisticated analysis (present study). All results that are not shown here can be found in the ASTARTE deliverable report 2.43 [60].
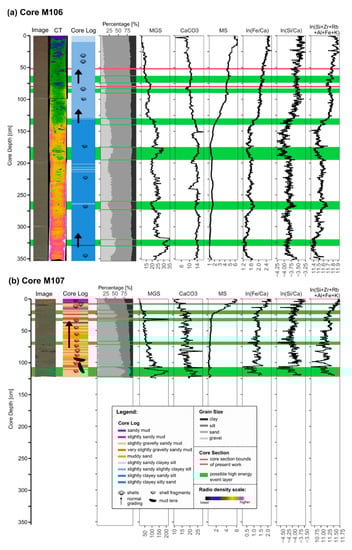
Figure 2.
Multiproxy plot of core (a) M106 (91 m bsl) and (b) M107 (58 m bsl). From left to right: core image, computed tomography scan (only for core M106), core log, textural type percentages, mean grain size (MGS) (µm), CaCO3-content (%), magnetic susceptibility (MS) (10−4 SI), log transformed XRF elemental counts/ratios (cps). These data originate from a previous study (see Section 1.2, [60]) and show anomalous layers that are interpreted as possible high energy event layers (green horizontal bars). Also, the cores sections of the present study are depicted (core section within the red lines).
Both cores under study show a general grain size fining upward trend indicative of a transgressive succession with decreasing energy depositional regimes from the bottom to the top (Figure 2).
In core M106, several lithologic units can be identified, a slightly clayey sandy silt unit between 354 cm and 130 cm below sea-floor (bsf), slightly sandy slightly clayey silt between 130 and 9 cm bsf, and slightly sandy clayey silt until the core top (Figure 2a, lithology classes as defined by [61]). Within these units, the sediment is very uniform, with no visible structures or laminations that, however, are observed in the X-rays imagery (not shown here, see [60]). Frequently, shell fragments, mainly bivalves, are visible throughout the core. The mean grain size ranges from ca. 35 μm at the base to ca. 11 μm at the upper core section. This general decrease in mean grain size entails marked and successive decreases at specific core levels (at ca. 316, 263, 215, 133, and 73 cm bsf) with minor oscillations between these levels. The sand percentage mimics the mean grain size variation and varies between 44% at the base and 5% at the top of the core. The silt fraction is always the textural predominant type with a mean of 62% (max: 75%; min: 44%), exhibiting several peaks in abundance, in general, coincident with mean grain size decreases. Clay is more constant along the core, with an average of 14% (max: 20%; min: 9%).
Core M107 is coarser than M106 but similarly does not show clear visible structures or laminations (Figure 2b), although they can be observed at X-ray images (not shown here, see [60]). In core M107, the laminations are not as well defined as in core M106 and it seems intensely bioturbated with abundant shells and shell fragments. The main feature is a moderate yellowish brown (10YR 5/4) top layer with finer sediments until 20–25 cm depth, whose base is not well defined, and there is a gradual transition to a coarser sand and to dark yellowish brown (10YR 4/2) sediments. Lithologically, core M107 is characterized by alternating layers of slightly gravelly sandy mud, very slightly gravelly sandy mud, and muddy sand. Above a depth 38 cm bsf, some sandy mud layers appear while the top is exclusively constituted by an alternation of sandy mud and slightly sandy mud. The mean grain size is, in general, much coarser than core M106, ranging from 212 μm at the base to ca. 14 μm at the top of the section. The upward fining trend is intercepted between 35 and 30 cm bsf by a peak that reaches 216 µm. Sand fraction is the predominant textural type from the base until 20 cm bsf, where it is possible to observe a gradual decrease (from 75% to 42%). Above this depth, the sand decrease is marked until the top, where it reaches 21%. Silt has a profile almost inverse of the sand’s profile, varying from 15% at the base until 59% at the top (with an average of 32%). Clay presents a similar profile to silt, with a lower percentage (average 11%; min 6% and max 25%). Gravel is also present along the core with minor fluctuations and an average percentage of 3% and a maximum of 14%.
X-ray fluorescence (XRF) on cores M106 and M107 was performed with a 1-cm resolution and the identified elements were: Al, Si, S, Cl, K, Ca, Ti, V, Cr, Mn, Fe, Ni, Zn, Ga, Ge, As, Br, Rb, Sr, Y, Zr, Cs, Ba, La, Ce, Nd, Sm, and Pb. Globally, both cores XRF-logs show general increasing Si/Ca trends from the base to the top, indicating increased carbonate facies at the base, also shown on the carbonate contents (Figure 2). This general trend reflects the increased shells content in the very coarse sand chaotic facies, also noticeable in the Ca and Sr profiles (not shown here, see [60]). In both cores, this trend occurs with two distinct gradients. At the top of the cores (up to 176 cm bsf in M106 and up to 27 cm bsf in M107), this decrease in carbonate content is more pronounced, being more subtle below these depths (Figure 2). The elements considered to indicate detrital source (Si, Zr, Rb, Al, Fe, and K) show, in general, low variability throughout the cores, indicating a relatively constant source of the sediments into the shelf. Elements considered to be involved in diagenetic (oxidation) processes (Mn, V, Co, S) are all consistent and show increased reactivity in the top 30–40 cm (not shown here, see [60]). Pb, which is usually related with anthropogenic sources, reach higher values at the top and at very discrete layers within the very coarse sand with chaotic facies of abundant shells. Combined analysis of the geochemical (the detrital source elements and the Si/Ca trends) and lithological properties of the cores allowed us to define discrete layers that represent anomalous behavior in relation to the general trends along the cores. In particular, events associated with high energy or abnormal sedimentary sources are being investigated with more detail to evaluate their potential relationship with past tsunami events. Several of these events were identified, and while some correspond to 1–2 cm thick layers, others correspond to 10–20 cm thick layers (see Figure 2).
Magnetic susceptibility profiles are quite similar, being possible to divide each core in two main domains, with limits at 175 cm bsf for core M106 and at 30 cm bsf for core M107 (Figure 2). The lower most domain is characterized by lower and quite stable magnetic susceptibility values (around 1 × 10⁻⁷ m3·kg−1). Above, values increase significantly, reaching 4 × 10⁻⁷ m3·kg−1 at 100 cm bsf for M106 and at 15 cm bsf for core M107). At the top of the cores, it is still possible to observe a gentle increase with some oscillations. The uppermost part defines a peak, reaching the highest values ~6 × 10⁻⁷ m3·kg−1 at 10 and 4 cm bsf for cores M106 and M107, respectively.
Based on the variations in grain-size, XRF, carbonate content and magnetic parameters, several anomalous layers were identified on the basis of significant coincident changes in several properties. Five of these layers were identified on core M107 and seven layers were identified in core M106, all defined by: i) marked grain-size variations (increase or decrease in grain-size, usually expressed in the mean grain-size); ii) increases in terrigenous proxies (Fe/Ca and Si/Ca) or by detrital source proxies (Si, Zr, Rb, Al, Fe, and K) in XRF data; and iii) magnetic mineral phases variations and environmental magnetic parameters (not shown here, see [60]). Most of these layers were 210Pb and 14C-dated and the most recent of such layers was dated in both cores, indicating an age that is compatible with the AD 1755 tsunami event. Therefore, this layer was selected for further detailed investigation, the focus of this work.
2. Materials and Methods
The focus was given on the specific sections of the two cores, M106 and M107, that incorporate the possible 1755 CE tsunami layer and levels below and above the event layer (pre- and post-tsunami) (Figure 2). For the detection of differences between the possible 1755 CE tsunami layer and the background sedimentation, MS, SC, and MT were examined, including multivariate statistical analysis.
2.1. Supporting Data
Supporting data, i.e., data obtained from previous works include grain size, carbonate content and inorganic geochemistry for cores M107 and M106 from a previous study (Section 1.2). The data are available for the whole cores at a minimum resolution of 1 cm.
Grain size and carbonate content analyses were performed at IPMA-Tavira geological lab (Tavira, Portugal). Grain size distribution was determined by laser diffraction with a Malvern Mastersizer Hydro 2000G, following the necessary protocol and the adequate software (v.5.61). The resulting grain size data are a volume percentage for all the textural distributions ranging from 0.01 μm to 2 mm in 1 cm intervals. In the coarser core M107, a 500 μm sediment separation was made beforehand to yield more representative and reliable grain size analysis by analyzing the fraction <500 μm by laser diffraction and >500 μm by classical sieving. Textural type percentages and mean grain size (geometric methods of moments) were calculated using Gradistat (v8.0) [62]. Carbonate content was analyzed with the volumetric method of Scheibler as described by Tatzber et al. [63] using an Eijkelkamp calcimeter.
MS was continuously measured on whole-round cores with a GEOTEK Multisensor Core Logger (MSCL) at the University of Vigo with a frequency of 1/cm and in a discrete way (mass normalized magnetic susceptibility χLF) through cylindrical samples (one centimeter of height and diameter) measured in the magnetic susceptibility bridge MFK1 (AGICO), at the Laboratory of Paleomagnetism and Geomagnetism of Instituto Dom Luiz (University of Lisbon, Lisbon, Portugal).
XRF data were collected every 10 mm down-core over a 15 mm2 area by using generator settings of 30 kV, 55 mA, and 20 s directly at the split core surface of the archive half with an ITRAX Core Scanner at the University of Vigo (Vigo, Spain). The split-core surface was covered with a 4 μm thin SPEXCerti Prep Ultralene1 foil to avoid contamination of the XRF measurement unit and desiccation of the sediment. The acquired data have been processed with the software CoreScanner 8.6.3 using the Q-spec 8.6.0 package. Identified elements with sufficient abundance cover Al, Si, S, Cl, K, Ca, Ti, V, Cr, Mn, Fe, Ni, Zn, Ga, Br, Rb, Sr, Y, Zr, Cs, and Nd, and were recorded in counts per second (cps). Counts were normalized over cps to correct surface geometry variations and grain size. The ratio of incoherent over coherent scattering (MoR) is used as an indicator of organic matter content [64]. For terrestrial input, the elemental count of Al + Si is used as a proxy of the Pleistocene red sand (with high quartz and Illite/Kaolinite content), Ti/Ca as a sediment source dependent proxy, and Fe of the input of fine material [17].
Computed tomography (CT) data for core M106 was obtained using a HITACHI ECLOS 16 Multislice CT from the Veterinary University Hospital Rof Codina of Lugo (University of Santiago de Compostela, Santiago de Compostela, Spain) following the acquisition protocol of Mena et al. [65]. The final resolution per voxel is of 0.2 mm × 0.2 mm × 0.65 mm (x, y, z). Images from the CT-scan were obtained using the free software “MRIcro” [66]. The radio-density profile was extracted, using the free software “anidoC” [65], from a centered cylinder with 5 cm of diameter, trying to avoid the interaction between the plastic material of the core and the sediment.
2.2. Sand Composition and Microtextural Analysis of Quartz Grains
Samples for SC and MT analysis were wet sieved using a 63 μm mesh, deflocculated (with sodium hexametaphosphate, Na6O18P6), dried (max. 40 °C), and sieved again in a 1 Φ interval (logarithmic scale after Krumbein [67]). The SC analysis incorporates 100 grains of the 250–125 µm fraction of each sample, counted, and identified under a binocular microscope (SZX7, OLYMPUS, Tokyo, Japan). A preliminary study was performed to statistically determine the count number and best-suited fraction for the SC analysis [68]. The grains are classified as terrigenous, biogenic, or non-identified and subdivided into 11 components (Table 1).

Table 1.
Classification of sand sized components.
Terrigenous components are composed of quartz, mica, opaque, aggregate, and other terrigenous components. In this group, aggregates are purely terrigenous without biogenic elements. Biogenic components are subdivided in planktonic and benthic foraminifera, as well as mollusk, terrestrial biogenic (continental origin, e.g., charcoal, wood), and other biogenic components (such as echinoderms). Not identified are components where visual identification with the binocular microscope cannot yield a clear classification for the terrigenous or biogenic group. Aggregated components consisting of biogenic and terrigenous elements are classified as non-identified.
Quartz grains of the size between 250–125 µm were randomly handpicked from 9 samples of core M107 using a binocular microscope representing the 3 different chronological regimes pre-tsunami, tsunami, and post-tsunami. A population of 30 grains for each sample was chosen to gain a meaningful sedimentological interpretation based on an empirical test conducted by Costa et al. [34]. The grains were mounted on adhesive carbon stickers and high-resolution images were photographed with a scanning electron microscope (SEM) (TM4000Hitachi, Tokyo, Japan). The quartz grain shape was evaluated based on the grey level SEM-images using the free software ImageJv.1.49 [69,70]. An image processing routine was established to separate the foreground (grain) from the background based on Sobel edge detection and the Yen-thresholding method [71]. The binarized output image (Figure 3c) was used to determine grain perimeter, grain area, circularity, aspect ratio, roundness, and roughness factor.
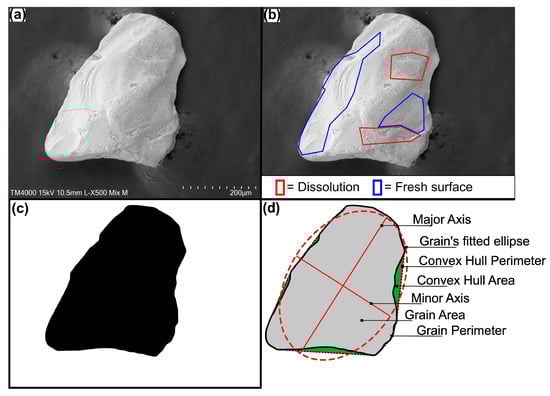
Figure 3.
Steps of the quartz grain image processing. (a) Original SEM—image. (b) Marking of areas with dominant microtextural family. The remaining area is calculated automatically (here percussion marks). (c) Binary image after the segmentation procedure to separate the grain from the background. (d) Representation of the measured parameters using ImageJ.
Surface microtextures including dissolution, adhering particles, percussion marks, and fresh surfaces were identified visually by marking areas of occurrence with polygons on the grain surface (Figure 3b). Their total percentages relative to the total surface area occupation were calculated and the results of automated routine for grain shape measurements were processed using R [72]. The automated image processing and mathematical morphology calculations, as well as the coding of the grain-image names prior processing reduces the human operator subjectivity. Shape parameters, including perimeter, circularity, and aspect ratio, were obtained using “ImageJ”, allowing the calculation of the grain roundness parameter R following the methodology and equation introduced by Takashimizu and Iiyoshi [73]. The roughness factor (FR) in this study denotes the irregularity of the grain outline resembling an angularity scale as that of Powers [74] and the methodology is based on the work of Lira and Pina [75], in which a more detailed description can be found. Following the semi-quantitative approach of Costa et al. [34], the focus was given to 5 microtextural families of grain surface features of chemical and physical nature: angularity, fresh surfaces, percussion marks, adhering particles and dissolution (Figure 3). This allows possible discrimination with statistical reliability due to the greater sampling compared to the analysis of single microtextures. To classify the microtextural area of individual grains each textural surface feature was scaled as 0 (absent), 1 (0–10% of grain surface), 2 (10–25% of grain surface), 3 (25–50% of grain surface), 4 (50–75% of grain surface), and 5 (>75% of grain surface).
2.3. 210. Pb and 14C Dating
The age models of both cores are based on accelerator mass spectrometry (AMS) 14C-dating at Beta Analytic Inc. (Miami, FL, USA) and Actlabs (Canada) and 210Pb-dating checked by 137Cs activity at University Bordeaux (Pessac, France) (Table 2).
Table 2.
Radiocarbon ages obtained from the 2 cores M106 and M107. Calibrated radiocarbon ages are minimum and maximum values of the calibrated ages with “rbacon” [77] (see text in chapter 2.3. for more details). BP = before present (i.e., before 1950 CE); CE = common era; BCE = before common era; prob = probability.
Ages obtained from the age estimation analysis were projected on core depths using Bayesian statistics with the help of the “rbacon” package (v.2.4.2) [76] implemented in the software “R” [72]. This methodology divides the core into small vertical sections (here 5 cm) and uses Markov chain Monte Carlo (MCMC) iterations to estimate the sedimentation rates for each section. Thus, no constant sedimentation rate between dated levels must be assumed, resulting in better sedimentation rate estimations [77]. Radiocarbon ages were corrected using the calibration curve “Marine13” [78] coupled with a calculated marine reservoir effect value (∆R) for the core location (Figure 1). ∆R was established by using the database of “CALIB” (http://calib.org/marine/, 6 September 2019) entering the approximate core location and choosing the 20 closest points. Out of the 20 listed results, only points from the south coast of Portugal were chosen, excluding also points originating from freshwater influenced areas as the Ria Formosa lagoon. This yield ∆R = 268 ± 122 based on the average of 9 points out of this database ([79], http://calib.org/marine/references.php).
Excess 210Pb (210Pbxs) was calculated by subtracting the supported fraction, 226Ra from the total 210Pb activity. Measurements were done downcore using a low-background, high efficiency gamma detector until reaching negligible excesses. Then, 210Pbxs profiles of each cores were used to calculate mean sedimentation rates using the CFCS (constant flux constant sedimentation) model [80]. This age-depth model was computed using R package “serac” (v.0.1.0) [81]. In contrast to 14C-ages, 210Pb-ages were used as absolute dates within the final age–depth model, with error estimates yielded from the CFCS model, and then combined in the same age model using “rbacon”. Previously detected layers, that are interpreted to correspond to possible high energy events (see Section 1.2, Figure 2) were speculatively considered as sections of the instantaneous deposition of sediments. Hence, these layers were excised before modeling to further enhance the age-depth relations, because ignoring any age gaps may cause even more error in the age model [82]. Also, parameters for the age model vary from the basic settings of the “rbacon”-function (see Figure 4 for the values).
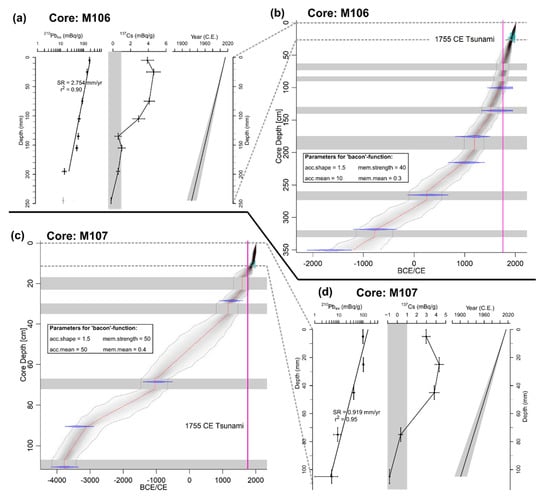
Figure 4.
Age-depth relation of core M106 and M107. (a,d) Profiles and age-depth relation using 210Pb-ages (“serac” output). SR = sedimentation rate. Grey vertical bar indicates 137Cs values that are negligible. (b,c) Age-depth relation using 210Pbxs and 14C method (“rbacon” output) including calibrated 14C-ages (blue). The red curve shows a single “best” model based on the weighted mean age for each depth. Darker grey indicates CE-ages that are more likely and dashed grey lines represent the 95% confidence intervals (max. and min. CE-ages). Horizontal grey bars represent possible high energy event layers (abrupt sedimentation) detected by a previous study (see Section 1.2, [60]). Age model parameters are shown for better reproducibility.
2.4. Statistical Analysis
Besides visualization of the supporting data, a linear discriminant analysis (LDA) was conducted incorporating selected geochemical and sedimentological data as an independent set of quantitative variables and the chronological regime grouping of samples as a response variable that was obtained independently from the explanatory variables. LDA can be used to determine to what degree the set of quantitative variables can explain the sample grouping [83]. Data of the LDA were checked for multivariate homogeneity of within-group covariance matrices (permutational test, p-value > 0.05) and for distinct means of the explanatory variables (Wilks’ lambda test, p-values < 0.05), as well as centered and scaled. The LDA was performed using package “vegan” (v.2.5-6) [84] implemented in “R” [72]. A principal component analysis (PCA) using the function “rda” (basic settings) of the package “vegan” was conducted incorporating a hierarchical cluster analysis (HCL) (Ward’s method) and including samples of both cores. The PCA data matrix was standardized and consists of the supporting proxies along with textural type percentages.
The Hellinger-transformed (abundance values divided by sample total abundance with following square-root transformation) count data [85] of the SC were further analyzed using PCA for each core (function “rda”, basic settings).
P-values for the MT analysis were calculated to test if there are statistical differences in mean values of the 3 populations (pre-tsunami, tsunami, post-tsunami) aiding interpretation of results by using Kruskal–Wallis test [86] from the base “R”-package “stats” (v.4.0).
3. Results
3.1. Chronology
Based on the depth decrease in 210Pbxs activities and the CFCS model, a mean sedimentation rate of 0.92 mm was estimated in the uppermost 20 cm of core M107, and 2.75 mm·yr−1 in the uppermost 10 cm of core M106.
In general, sedimentation rates varied over time in both cores with lower rates in lower core depths and higher rates in the upper core sections (Figure 4b,c). Notwithstanding, at the base of core M107, the sedimentation rate is apparently high. Moreover, the removing of the possible high energy events (abrupt sedimentation) in the age model is speculative, and their limits must be investigated more precisely. In the top cores, the artificial 137Cs had permitted to validate the chronology. The onset of 137Cs is observed early 50s, as expected, and the maximum activities in subsurface are in agreement with the known inputs events (maximum nuclear weapon test atmospheric fallout in 1963 CE and Chernobyl in 1986 CE), the low sedimentation rate in core M107 do not permit to identify the two peaks (Figure 4a,d). Thereafter, the age model presents increasing uncertainties with greater distance from dated levels which is due to the relatively low number of radiocarbon ages. Yet, core M107 includes a longer sedimentary sequence with suggested ages until 3785 BCE compared to core M106 that covers mean ages until 1192 BCE. Consequently, the mean sedimentation rate of the entire core length is ca. 1.09 mm·yr−1 for core M106 and 0.21 mm·yr−1 for core M107. Estimated ages for the possible 1755 CE tsunami layers is 1769 CE single best model age with a 95% confidence interval between 1628 CE and 1871 CE for core M106 and single best model age of 1589 CE for core M107, while the 95% confidence interval comprises ages between 1326 CE and 1794 CE.
3.2. Multi Proxy Data
Both cores show a general grain size fining upward trend indicative of a transgressive succession with decreasing energy depositional regimes from the bottom to the top of the studied core sections (Figure 5). The mean grain size of core M106 is ranging from 19 μm at the base to ca. 13 μm at the upper core section. The mean grain size of core M107, which is generally coarser than core M106, ranges from 200 μm at the base to ca. 40 μm at top of the section. In core M107, sand is the predominant textural type, while in core M106 silt is predominant with percentages of 40–70% (Figure 2; Section 1.2). Gravel is absent in core M106. This is coherent with the results of Lobo et al. [59], where core M106 represents the distal muddy belt environment and core M107 the infralittoral propagating wedge. The base of the pre-tsunami layer includes the highest values in mean grain size in both cores. The tsunami layer contains mean grain size peaks in both cores. However, it is subtle in core M106 (at core depth 71 cm and 69 cm) and more pronounced in core M107 (at core depth 23 cm and 20 cm), where it is directly linked with the increase of gravel content. In the post-tsunami layer, mean grain size is decreasing with minor variations. Carbonate content is varying between 10% to 11.5% and 12% to 20% in cores M106 and M107, respectively (Figure 5). Peaks of carbonate content in the tsunami layer are visible in both cores. In contrast to core M107, core M106 has higher levels of carbonate content in the upper tsunami layer which remains high until 58 cm core depth in the post-tsunami section.
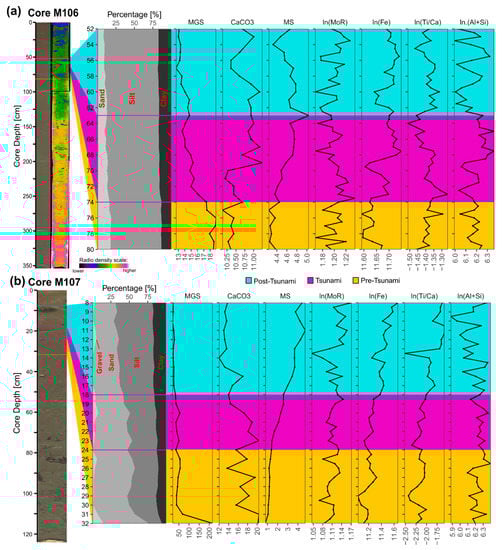
Figure 5.
Multiproxy plot of core (a) M106 (91m bsl) and (b) M107 (58 m bsl) showing the studied section (Figure 2). From left to right: core image, computed tomography scan (CT-scan) (only for core M106), textural type percentages, mean grain size (MGS) (µm), CaCO3-content (%), magnetic susceptibility (MS) (10−7 SI), log transformed XRF elemental counts/ratios and MoR-ratio (cps). Horizontal blue, violet and yellow lines/bars represent the sections analyzed in detail for multivariate statistical analysis, SC and MT and their respective chronological group: post-tsunami (blue), 1755 CE tsunami (violet), pre-tsunami (yellow).
MS is generally higher in core M106 compared to core M107 with values ranging from 4.2 to 5 (10−4 SI) and 1 to 4.5 (10−4 SI), respectively (Figure 5). In core M106 between 70 cm to 55 cm, MS is increased with a distinct peak at depth 63 cm, which is the uppermost sample of the tsunami layer. In core M107, shows a tenuous increase in the upper tsunami layer and a pronounced peak in the post-tsunami layer around depth 11 cm. Considering mass-normalized magnetic susceptibility χLF for both cores (including all samples) (Figure 6) it is verified for core M106 that pre to post tsunami depths are within an interval that mostly defines a relative plateau of magnetic susceptibility values between 100 and 32 cm compared to adjoining lower and upper core sections. Despite some oscillations, such an interval seems to interrupt the increase of susceptibility observed below 100 cm and above 32 cm. Within this range, it is possible to see some abrupt variations that are distinguished from low amplitude oscillations, such as those observed between 93 cm and 87 cm, the positive peak at 63 cm, and the negative one at 54 cm. For core M107, the pre-tsunami range is characterized by very stable, gradually increasing magnetic susceptibility values, the tsunami one by a sharp increase, and the post-tsunami by oscillations starting at 15 cm that interrupt the general increase observed below.
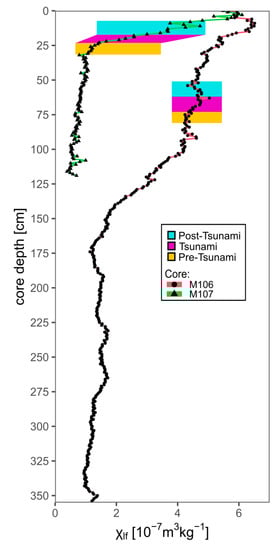
Figure 6.
Mass normalized magnetic susceptibility χLF (10−7 m3·kg−1) values obtained for core M106 and M107. Horizontal bars represent the chronological layers: pre-tsunami (yellow), 1755 CE tsunami (violet), and post-tsunami (blue). Please note that this figure depicts all available samples of the cores.
XRF data show a significantly larger range in core M107 compared to core M106, except for the Al + Si elemental counts, where variability is similar (Figure 5). Especially, the Ti/Ca ratio is higher in core M106 compared to core M107 which might be related to the higher mean grain size values in core M107. Out of all XRF proxies used in the present study, the Al + Si elemental counts show increased mean values in the tsunami layer relative to the post- and pre-tsunami units. In core M106 mean values are 6.15, 6.21, and 6.17 for post-tsunami, tsunami, and pre-tsunami units, respectively. In core M107, post-tsunami, tsunami, and pre-tsunami units have mean values of 6.14, 6.28, and 6.24, respectively.
CT-scan data of core M106 show a decreasing radio-density trend (from lighter to darker colors) (Figure 5). For the studied section (80–52 cm), CT shows a decreasing radio-density in the pre-tsunami layer (blue colors, 900–840 HU) and a relatively abrupt change in the tsunami layer, from low radio-density materials (ca. 780 HU) to increasing amount of higher radio-density materials (ca. 860 HU) (Figure 7). The post-tsunami layer is characterized by material of relatively constant high radio-density material (ca. 865 HU) with a scarce presence of low radio-density material (down to 810 HU).
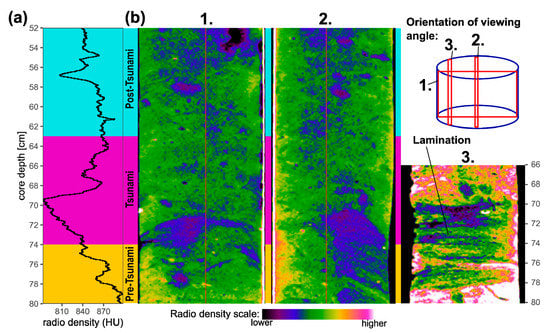
Figure 7.
Radio density values (HU) (a) and computed tomography (CT) images (b) of core M106 in the studied core section (Figure 2). Please note the different viewing angles of the core section and the change of visualization scale in image 3.
For the multivariate statistical analyses a data matrix was created consisting of the supporting data set including magnetic susceptibility (log(MS)), mean grain size (log(MGS)), textural type percentages (sand, silt, clay) carbonate content (CaCO3), organic matter content (MoR-ratio), specific XRF elemental counts and ratios (log(MoR), log(Ti/Ca), log(Fe), log(Al + Si) (Figure 5), as well as counts of the SC (mollusks (Moll), foraminifera (benthic + planktonic)). PCA, LDA, and HCL were conducted on these data matrices with slightly different variables (In the LDA the textural types are excluded and SC counts and log(Al + Si) are excluded for PCA and HCL). The results of the analyses are graphically presented in Figure 8. LDA results show that the pre-defined chronological layers can be explained by the data set, although the grouping of samples is clearer in core M107 than in core M106 (Figure 8a,b). Here, post-tsunami samples and the tsunami samples are overlapping, indicating a more similar sedimentary characteristic (>90% of correct classification), and sample 61 (depth 61 cm to 62 cm) is classified in the tsunami-group. However, higher Al + Si-content, more abundant mollusk fragments, lower Fe-content, and total foraminifera counts are separating the post-tsunami and tsunami samples. Mean grain size is increasing with core depth and is the main factor responsible for the distinction between the pre-tsunami samples and the two younger units. In core M107, the increase of mean grain size is the main factor for the differentiation of the tsunami layer. Higher Al + Si-content, lower abundance of foraminifera, and lower Ti/Ca ratio is contributing to a minor degree to the differentiation. Post tsunami samples show higher MS and carbonate-content compared to the lower layers. Pre-tsunami samples have higher organic matter (MoR-ratio) content and low MS values.
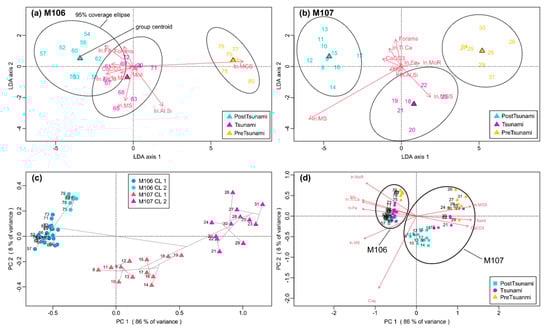
Figure 8.
Results of the multivariate statistics of the supporting data. The numbers correspond to the sample depth (cm). (a,b) First and second LDA-axes of core M106 showing the 3 group classification (pre-tsunami, tsunami, and post-tsunami) of core M106 explained by the supporting data set (Forams = benthic and planktonic foraminifera, Moll = mollusks, ln.MS = log-transformed magnetic susceptibility, ln.MGS = log-transformed mean grain size and log-transformed XRF elemental counts/ratios. (c) PCA-biplot (scaling 1) with overlaid HCL results including samples of core M106 and M107. (d) PCA-biplot (symmetrically scaled by the square root of eigenvalues) showing samples of core M106 and M107 and the variables (red arrows: length proportional to contribution). The samples are coloured for their respective chronological group.
The PCA includes samples of both cores and depicts general differences between the cores besides information regarding the possible tsunami imprint (Figure 8d). Core M107 differs from core M106 with higher proportions of sand-sized particles, higher carbonate content, and higher mean grain size, while Fe-content, Ti/Ca-ratio, organic matter content, and MS are lower compared to core M106. Also, the variability between the samples is higher in core M107 as indicated by the higher variation in PCA loadings. In general, core M107 has a greater intravariability of the studied sediments in their sedimentary characteristic compared to core M106. Nevertheless, differences in the sedimentology between the three chronological units (post-tsunami, tsunami, and pre-tsunami) are visible in both cores using PCA. Results in respect of the distinction between the chronological units already shown by the two LDAs are mimicked by the PCA. The cluster analysis of the PCA results (Figure 8c) with a solution of four clusters is separating the analyzed samples in two units, roughly before and after the tsunami event unit.
3.3. Sand Composition
For the SC analysis, a total of 51 samples of the two cores were analyzed. By counting and identifying 100 grains per sample a total of 5100 random grains were processed, while 159 grains were classified as non-identified (ca. 3.1% of total). Overall, sand components show minor fluctuations in their percentages in the studied sections in both cores (52–80 cm in core M106 and 8–32 cm in core M107) (Figure 9).
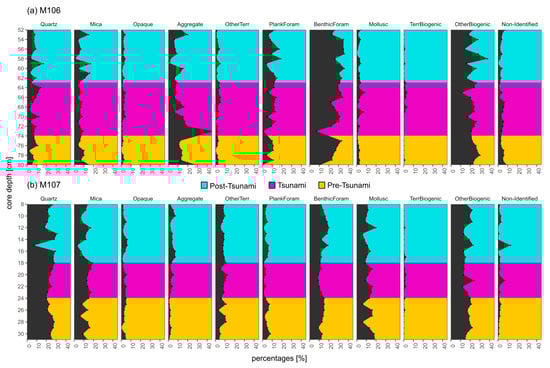
Figure 9.
Sand composition (SC) in percentages along core depths of core M106 (a) and core M107 (b).
A general difference in SC between core M107 and M106 is apparent: (1) In the shallower shelf core M107 higher percentages of terrigenous components (ca. 50%) are present compared to the deeper shelf core M106 (ca. 30%). (2) In core M106, percentages of benthic foraminifera are higher, and percentages of mollusks are lower compared to core M107. The terrigenous part of core M107 is made up of mainly quartz and mica, while opaques, other terrigenous, and aggregates are low in percentages (<8%) (Figure 9b). The biogenic components are mainly other biogenic, mollusk, and benthic foraminifera. Terrestrial biogenic components have very low percentages throughout the studied core section. Although core M106 shows general fluctuations in the SC there is no general trend in the studied section (Figure 9a). The terrigenous part consists mainly of quartz, mica, and aggregates, while opaques and other terrigenous components are underrepresented. A peak of aggregates at depth 73 cm in core M106 is accompanied by lower densities as depicted by the CT-data (Figure 7). The biogenic part is dominated by other biogenic components and benthic foraminifera (up to 36%). Mollusk and terrestrial biogenic components are low in this core with maximal percentages of ca 5%. In the possible tsunami layer, no remarkable peak of terrigenous components can be observed in either cores, that could serve as a backwash tracer. However, higher percentages of mollusk shells/fragments (only in core M106) and terrestrial biogenic components are present in the high-energy event layer with peak percentages within the total studied section, indicative of sediment transportation from beach or nearshore areas to the shelf.
For each core, a separate PCA of the SC was conducted, and results are visualized in Figure 10. A solution of 4 principal components was chosen, and in both cores selected principal components explained >77% of the total variance in the data set. For core M107, selected component assemblages are PC1_107 and PC2_107, explaining 49.9% of the total variance and PC1_106 and PC4_106 for core M106 that explain 50% of the total variance. Both cores show a distinction between the chronological groups by their SC, but differences of the background sedimentation and the possible tsunami units are small. Still, important results are depicted: (1) possible tsunami samples of both cores differ from the background sediments by higher abundance of quartz, mica, and terrestrial biogenic components and mainly in more abundant mollusk fragments (core M106). Also, in both cores, tsunami samples have lower amounts of foraminifera. (2) Core M107, representative of the inner shelf, shows a more distinct differentiation of the tsunami samples from the background sedimentation, while core M106, which is representative of the outer shelf, shows a weaker tsunami signature.
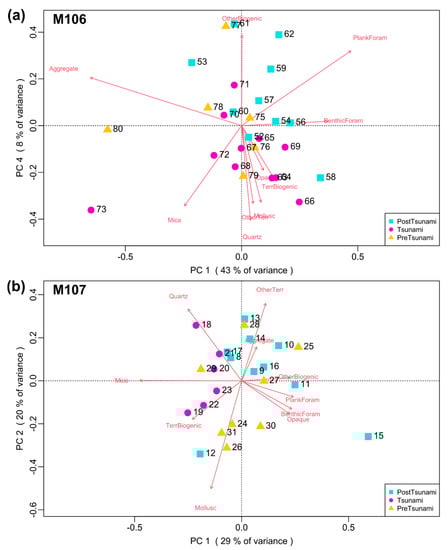
Figure 10.
SC PCA-biplot (scaling 1) of core M106 (a) and M107 (b) showing the samples colored after their respective chronological group and the SC variables (red arrows).
3.4. Microtextural Analysis of Quartz Grains
In general, the quartz grain samples show minor differences between them. The predominant microtexture is dissolution with median values of 3 (25–50% of grain surface) up to the whole grain surfaces, in some cases (Figure 11) while percussion marks are the second most abundant followed by fresh surfaces. Adhering particles occupy minor percentages of the grain surfaces. Roundness (R) and roughness factor (RF) show a small variation between samples and show similar trends. Grouping the samples in their respective chronological regime shows small and no significant differentiation between tsunami and non-tsunami samples. However, a tendency of more percussion marks on possible tsunami samples can be seen and adhering particles are significantly more abundant on post tsunami grains.
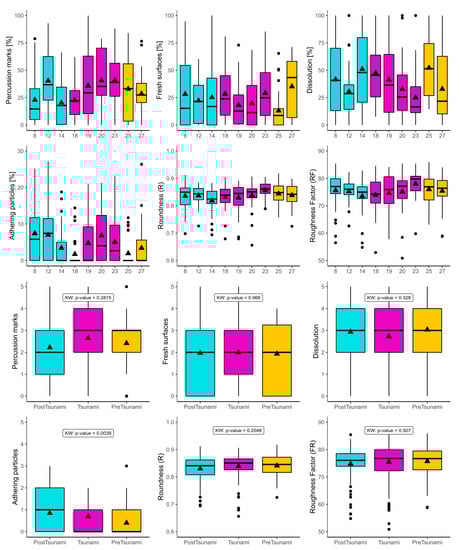
Figure 11.
Boxplots of each microtextural family, roundness parameter (R), and roughness factor (FR). Distributions of each sample are depicted and after the grouping of samples in their respective chronological group with calculated p-values using Kruskal-Wallis test. Black points indicate outliers, black triangles indicate mean values while black lines indicate the median.
4. Discussion
A multi-proxy approach was applied to investigate sedimentary signatures of the 1755 CE tsunami in the southern Portuguese continental outer shelf. The presumed 1755 CE tsunami layer in the southern Portuguese continental shelf off Faro is identifiable by the combination of several indicators frequently discussed in the literature. Before the interpretation of the presumed tsunami signatures, the correspondence of the studied sediments to the 1755 CE tsunami is discussed.
4.1. Correspondence to the 1755 CE Tsunami
Storms are capable of creating similar deposits as tsunamis and their discrimination is problematic [11,29,87]. To be certain that storms did not affect the tsunami deposits, the deposits have to be either in storm sheltered areas or beneath the storm wave base. After Weiss and Bahlburg [12] the water depth (d) where a storm wave affects the bottom sediments (db) is:
where g is the gravitational acceleration (g ≈ 9.81 m·s−2) and A the amplitude (A = wave height (H) · 2−1), assuming exactly the boundary between deep-water (0.5 · wavelength (L) < d) and intermediate-water (0.5 L > d > 0.05 L). Core M107 has the lower water depth of the studied cores with 58 m. By assuming db = 58 m, the amplitude of the storm wave must be at least 7 m (or H = 14 m) to be capable of reworking the tsunami sediments. The storm of 1941 CE, assumed to be the biggest storm of the century [88], had (modeled) wave heights of max. 14 m and periods of 14 s [89]. Considering a SW direction of the storm, similar wave heights could have reached the present study area, but an erosion of the tsunami layers in water depths > 58 m can be precluded.
db = π × g × A2 × 25−1
Fluvial floods are other possible events leading to a terrestrial input to the offshore areas. Similar to tsunami backwash flows, flash floods can generate hyperpycnal flows because of their high suspension load. However, there are different sedimentological characteristics between tsunami and flood deposits. The latter show generally better sorting and are composed of less coarse material than tsunami backwash deposits, because of the higher energy involved in tsunami backwash events [90]. Regarding the lower energy in flood events, their sedimentary/hydrodynamic equilibrium is reached in closer proximity to the coast and thus unlikely to have a pronounced depositional signature in the outer shelf. Despite this, in the Algarve region, no extreme fluvial flood is reported in the study area, although maximal historical peak discharges of ~11,000 m3·s−1 in 1876 CE and 1603 CE were documented for the next biggest and closest river (Guadiana River) (80–100km) to the study area [91].
Recorded historical tsunamis have the advantage to allow chronological correlation between the year of the tsunami event and the potential event layer as a first basis. The established age models are based on a small number of 14C-ages and 210Pb ages in the topmost sections and some radiocarbon ages are taken from probable reworked material (Figure 4), which can lead to incorrect age estimations [92]. However, in the age model function of “rbacon”, outliers are addressed by considering a student-t distribution instead of assuming an error of the radiocarbon age [93], minimizing the effect of outliers [76]. Thus, by using Bayesian age-depth models, the most realistic precision and robustness, compensating the small number of dated levels, can be expected compared to such classical methods as linear interpolation [94]. Results of the established age-depth relations suggest a highly probable correlation of the 1755 CE Lisbon event with the presumed tsunami deposit under study. The deposit in core M106 also likely correlates, on the basis of similar core depths (~75 cm to 40 cm), to possible 1755 tsunami deposits in proximity (~400 m) to core M106, as described by Quintela et al. [22]. Dating tsunami deposits can be challenging even when clear limits of the tsunami layer are established. The reason is the erosional action of tsunami events, incorporating material of different ages [95]. Thus, age errors of offshore tsunami deposits are expected to be relatively high, because confining the event unit is additionally complicated (see Section 4.2). Also, many assumptions have to be accepted, such as the marine reservoir effect, calibration curves, and constant rate of 210Pb supply to the sediment (etc.), increasing the age error [82]. Concerning tsunami ages, it is suggested to have a precision within a few hundred years or less to allow the implication of tsunami frequency [82]. Here, errors indicated by the age model are 246 yrs and 468 yrs for the tsunami units of core M106 and M107, respectively (Figure 4). The age model of core M107 should be thus supplemented with more radiocarbon ages to increase its precision. High age uncertainties were also reported in other offshore paleo-tsunami studies [3,96], stressing that age control of tsunami deposit is difficult and needs to be conducted carefully. Another issue of the age uncertainty is the distinguishing of the transatlantic tsunami in 1761 CE [97] from the 1755 CE event. The source area of the 1761 CE tsunami is proposed to be in the Southwest Iberian Margin similar to the 1755 CE tsunami [97]. Despite the effects of the earthquake in mainland Portugal, the related tsunami had about zero impact in respect to human and economic losses [47]. It is possible, that the 1761 CE event created tsunami related signatures in the studied sedimentary records. However, regarding the much lower severity of the 1761 CE tsunami compared to the 1755 CE event [47,98], it seems more unlikely to have signatures of the 1761 CE tsunami in the sedimentary record.
4.2. Identifying Outer Shelf Tsunami Deposits
Identifying tsunami event layers in outer shelf sedimentary records is not a straightforward task and several authors suggest a multidisciplinary approach [4] since tsunami deposits are notably site-specific and share only a few common characteristics [29]. Moreover, subtle sedimentological changes are expected instead of unequivocal indicators for the upper and lower boundary of an offshore tsunami deposit. Grain size increases in offshore tsunami deposits, as in core M107 (Figure 5b and Figure 8b), is a common global feature [4,14,22,23,24,96] and related to the higher energy involved during the tsunami event when compared to the background sedimentation. The absence of grain size variations [3,17], and decreased grain size [16] are also reported, especially in water depths > 50 m. In core M106, grain size variations are minor (Figure 5a and Figure 8a). However, an increase in grain size was detected in proximity to core M106 for the correlative interpreted tsunami layer by Quintela et al. [22]. Considering a channelized backwash flow [28], grain size variation in offshore tsunami deposits might greatly depend on the local bathymetry. Some offshore tsunami deposits show stacked fining up sequences interpreted as different backwash phases [23,31,90], which is not well recorded in the here studied tsunami layer. However, both studied tsunami units show a fining upward sequence (Figure 5a,b) that might reflect the decreasing energy evolution of the backwash flow. SC analysis revealed subtle increases in quartz, mica, and terrestrial biogenic components (Figure 8 and Figure 9). In the study area, quartz and mica (here Illite and Kaolinite) are abundant in onshore sediments/rocks [56] and the here used proxy, XRF elemental counts of Al + Si, increases in the tsunami deposit (Figure 5). High Ti/Ca-ratios were used as indicator for increased terrestrial input in offshore tsunami sediments [3,4,15,19,30,90]. Although, in core M106 the highest value of Ti/Ca is observed in the tsunami layer (Figure 5), this proxy shows no pronounced occurrence in the 1755 CE tsunami layer in the southern Portuguese shelf (present study) and the western Portuguese shelf [17]. In the southwestern Portuguese margin, a turbidite deposit related to the 1755 CE event shows, however, clear peaks in Ti/Ca (depicted as Ca/Ti) [96]. The weak peak of Ti/Ca can be linked to the different geology in the southwestern part of the Algarve compared to south coast in proximity to the studied deposits. Numerical modeling of the tsunami wave can aid in the detection of approximate sediment source areas. In the case of the deposit of this study, possible sediment provenance might be the coastal area between Faro and Quarteira (Figure 1) [68,99]. This highlights the importance of the local geology from the event sediment sources, and proxies must be adapted accordingly. The accumulation of allochthonous mollusk fragments in offshore tsunami deposits is another frequently observed feature [4,8,18,25,100,101,102], dragged from shallower water depths by backwash flows [8]. Abundant mollusk fragments were observed both, in the present study (Figure 8 and Figure 9) and in the 1755 CE tsunami deposit southwest of the Tagus estuary (Portuguese west coast) from similar water depths [17,100]. The accumulation of mollusk fragments is further validated by a general high carbonate content in the studied tsunami layer (Figure 5 and Figure 8) [17]. The possible provenance could be the inner shelf, where mollusk fragments are more abundant [103]. Besides the abundant occurrence of mollusk fragments in the coastal areas, their planar shape might increase their buoyancy, and thus their sedimentary equilibrium is reached farther offshore, possibly in the outer shelf. Similar behavior of planar shaped particles was proposed for mica, suggesting a higher abundance of those components in upper tsunami units [104]. In core M107, an increase of mica in the upper tsunami unit can be observed, which is subsequently decreasing again (Figure 9), possibly indicating the decrease in energy. MS increases accompanied by higher Fe and organic matter contents was interpreted as an input of fine material, consisting of fine-grained magnetic minerals [17]. The same can be found in the upper tsunami unit in core M106 (Figure 5a and Figure 8a), suggesting a settling of finer material in the upper tsunami unit of sediment-rich plumes generated by the tsunami event. Also, in the present-day sedimentation, studies show that only ~14% of fine land-derived material is deposited in the shelf with the tendency of fine-material transport beyond the outer shelf [57]. This could further explain (1) the minor grain size variation within the tsunami layer in core M106, and (2) the lack of the pronounced fine-material input in the upper tsunami unit of core M107 (Figure 5) because of the more landward location. The MT analysis did not detect a clear tsunami-related signature, although percussion marks are slightly increased in tsunami samples (Figure 11), which coincide with results from onshore deposit of the 1755 CE tsunami [34] and in onshore tsunami samples in general [33,105]. An increase in percussion marks was also observed in laboratory experiments, where high sediment concentration and supercritical flow conditions carved percussion marks onto the grain surfaces [36]. Another signature is the wider range of observed microtextural types (i.e., adhering particles, dissolution, fresh surface, percussion marks, and angularity) on tsunami quartz grain surfaces which was not found here. Besides the identification of high energy conditions, MT analysis could be useful for provenance studies of tsunami sediments when the geological setting of the study area is well constrained [37] and samples of the potential source material are available for the analysis.
Detecting the lower and upper bounds of offshore paleo-tsunamis in the sedimentary record is difficult, especially for the upper limit, since biological and physical post-depositional alterations affect sedimentary structures and tsunami tracers within the tsunami layer [3,9,31,106]. The lower boundary is mostly indicated by an erosional feature caused by the incoming tsunami wave or by the turbiditic backwash current. In studies of recent and paleo offshore tsunami deposits in the outer shelf, erosional surfaces were detected and used for setting the lower boundary [3,20], while other studies lack this identification [2,22]. Smedile et al. [2] and Quintela et al. [22] explain this by the farther distance to the shore or a reworking of the sediments, rather than a strong erosional action. In the present study, the presumed tsunami layers lack a sharp basal contact at the onset of the tsunami unit. However, the CT-image of core M106 reveals a layer of less dense sediments in proximity to the base of the tsunami unit (Figure 7), coupled with a small peak of magnetic susceptibility and a peak in aggregates (Figure 5a, Figure 6 and Figure 9). The abrupt change in radio-density at ca. 70 cm core depth (Figure 7a) and the internal sedimentary structures (i.e., of lamination or ripples) below (Figure 7b) can be related to the action of erosion. Speculatively, this can be interpreted as a reworking of the sediments by the land-ward propagating tsunami wave. Amore significant piece of evidence is the low numbers of total foraminifera tests at the onset of the tsunami unit in core M106 (Figure 9). Interestingly, the same trend was observed in tsunami deposits close to the shelf break in Augusta Bay (Eastern Sicily, Italy) [3] and Sendai Bay (Japan) [20]. Smedile et al. [3] interpret the low foraminifera numbers as a major input of fine sediments that can be assumed in the present study as well, based on the increase in Fe-content, MoR, and magnetic susceptibility (Figure 5 and Figure 6). In core M107, the base of the tsunami layer is furthermore identified through increased sand-sized particles and carbonate content (Figure 5b). The upper limits of the tsunami units are set by diminishing of the tsunami proxies and controlled with compatible age estimations, although the set limits remain speculative. Despite under such uncertainties, it is possible to verify that χLF values within possible tsunami layer of both cores mostly agree with an interruption of the overall increasing trend to a steeper increase, relative to the underlying sediment (Figure 6). This means that the general trend of χ.
χLF values is marked by an increase at the uppermost 150 cm of core M106 and uppermost 30 cm of core M107 that are interrupted within the suggested tsunami layers for core M106 and the post-tsunami layer for core M107. The general trend is expected due to early sedimentary diagenesis [107] but the origin of such interruption is not clear. Reworking of the sedimentary column and/or a change of the background sedimentary regime could be a plausible explanation.
As seen above, the limits of the tsunami deposits are questionable and clear tsunami-related sedimentary patterns are not evident. However, the combination of many small pieces of evidence determined by different proxies, namely a subtle terrestrial fingerprint, grain size variation, more abundant mollusk fragments, a decrease in total foraminifera abundance, and fine material input backed up by matching age correlations, are consistent with a deposition by the 1755 CE tsunami of the two units under study. Here, multivariate statistical analysis is essential to detect small changes in the outer shelf sedimentary record and to aid interpretation of the significance in proxy-variations between the tsunami layer and the marine background sedimentation. Moreover, the small increase of percussion marks of tsunami samples (Figure 11) could point to higher energy conditions during the tsunami event. Differences between the cores in the two tsunami units are present and can be ascribed to the differing core locations, and thus, to probable differing sedimentation processes. Based on the PCA and LDA results of both cores (Figure 8a,b,d), it might be concluded that it is easier to filter out differences between tsunami and background sediments in sand-rich deposits compared to finer deposits. However, the higher sedimentation rates of core M106 and the seawards decreasing energy of tsunami events [108] might be another reason for greater differences.
It is known that no remarkable terrestrial signatures are expected in the outer shelf environment [5,31]. Moreover, wave flume experiments showed, that offshore tsunami deposits are only ~ 30% composed of onshore material [108]. Hence, wave motions and return flows might be a major process incorporating autochthonous material and creating tsunami-related sedimentary structures of offshore tsunami deposition [20,108]. This might additionally veil the tsunami signal in the sedimentary record and explains the subtle terrestrial fingerprint. Thus, tsunami-related signatures in the outer shelf sedimentary record are small discrepancies between periods of normal marine sedimentation. Nevertheless, the poor signatures of the severe 1755 CE tsunami event in offshore sedimentary records (present study and in others [17,22,109]) and the fact that, among several well-documented historical tsunamis, only the 1755 CE tsunami left geological evidence onshore [47], is contradicting. Recent (preliminary) offshore studies in the southwestern part of the south Portuguese shelf have also encountered relatively small signatures of the 1755 CE tsunami [109]. However, other possible older events show a very clear signature such as a sandy layer interbedded in silty normal marine background sediments with well supporting XRF-data and biomarker analysis [109]. The small signature of the 1755 CE tsunami could be explained by a change in sedimentation dynamics in general observed by PCA results including both cores (Figure 8c,d) (see also Figure 2), the mass normalized magnetic susceptibility variation (Figure 6) and other studies of the southern Portuguese shelf sedimentary records [110,111,112]. Several hypotheses are discussed for this change in sedimentation, i.e., of a decreasing trend in grain size and higher sedimentation rates: (1) the change of coastal morphology, such as the opening/closing of the Ria Formosa barrier island system [113], (2) the intensification of fine-grained loaded river discharge associated with the wetter climatic condition since the Little Ice Age [114], and (3) the increased settlement density induced land-use change, that probably resulted in an increased input of terrigenous material into the shelf [111]. However, more studies regarding the provenance of the material need to be conducted to interpret this change and the contradicting small signature of the 1755 CE tsunami in the southern Portuguese continental shelf.
In summary, we presented a detailed analysis of two deposits related to the 1755 CE tsunami. SC analysis reinforced by XRF analysis seems to be an appropriate approach to detect tsunami deposits in similar environments. Improvements in sand grain analysis, such as automated recognition and counting [115], help to extend the analysis in the sedimentary record to establish possible provenances of the tsunami sediments. Also, changes in the background sedimentation could be established and linked to paleoenvironmental changes. However, the small terrestrial fingerprint of the tsunami deposits calls for methodologies that reveal sedimentary structures, such as CT on X-ray core images, produced by wave motions and backwash flows of the tsunami [1,116]. Although it is possible to detect tsunami deposits in outer shelf environments, recent works suggest the inner shelf and more protected bays as a more suitable study area [5,15]. Concerning the preservation potential of the event deposits, inner shelf environments are at risk of erosion by storm waves (see Section 4.1), while bays might be sheltered for some tsunamis. Open shelf settings have probably less developed tsunami deposits but possibly cover more tsunami events. Hence, investigating offshore tsunami sediments is important to complete the dataset of tsunami events and enable accurate estimations of recurrence intervals for tsunami hazard assessments [117]. The results of this study will aid other studies on outer shelf tsunami deposits and the findings of the detailed analysis of the presumed 1755 CE layer can be used on other possible tsunami layers already recognized in the same cores (see Section 1.2).
5. Conclusions
We presented a detailed analysis of the 1755 CE tsunami sediments in outer shelf settings applying a multi-proxy approach. From the results of our data, we can extract the following conclusions:
- In the present study, there is no pronounced single-proxy evidence for tsunami sedimentation. Yet, taking the sum of multiple small pieces of evidence reveals evidence of a tsunami-related deposition. Relative to non-tsunami samples, presumed tsunami samples have a subtle terrestrial fingerprint (increases of Al + Si ratio, quartz, terrestrial biogenic components), grain size variation, more abundant mollusk fragments, a decrease in total foraminifera abundance, and fine material input with deposit age ranges that overlap the 1755 CE event. The subtle terrestrial fingerprint of the tsunami sediments found here, as well as results in the literature, implies that the usage of methodologies that can reveal sedimentary structures related to the action of the tsunami wave and the backwash flow might have a higher potential. Moreover, outer shelf tsunami deposits depend greatly on the local geology and bathymetry, and differences between the two tsunami units were encountered related to the differing core location at 58 m and 91 m bsl. The site-specific tsunami deposit characteristics call for adapting the methodology to identify these deposits in similar environments.
- Microtextural analysis of quartz grain surfaces was performed for the first time in outer shelf tsunami samples. Although tsunami samples showed a minor increase in percussion marks, this increase was insignificant, and no other possible tsunami signature was detected, suggesting that microtextural analysis is not useful for identifying tsunami deposits in shelf settings, unlike for onshore high-energy deposits.
- A possible change in the general sedimentation following the tsunami event might have influenced the signature of the 1755 CE tsunami in the outer shelf sedimentary record. The contradicting result, that the 1755 CE tsunami is so far the only historical tsunami event that left geological evidence onshore and its subtle signature on the shelf, needs further investigation.
- The methods described here to study outer shelf tsunami deposits (CT scans, SC reinforced by XRF, magnetic parameters, and multivariate statistical analysis) can be applied for other potential tsunami deposits in the cores under study to ultimately improve the dataset of past tsunamis in Portugal, which lacks geological data and the extension to pre-historic times.
Author Contributions
V.K.: Investigation (lead), methodology (equal), conceptualization (lead), validation (equal), writing—original draft preparation (lead), review (lead); T.D.: investigation (equal), methodology (equal), supervision (lead), validation (equal), review & editing (equal); C.V.-P.: investigation (equal), methodology (equal), supervision (lead), validation (equal), review & editing (supporting); P.F.S.: investigation (equal), methodology (equal), writing—review & editing (equal); V.M.: investigation (equal), methodology (equal), writing—review & editing (equal); A.M.: investigation (equal), methodology (equal), writing—review & editing (equal); A.L.: methodology (equal), review & editing (supporting); A.I.R.: investigation (equal), methodology (equal), review & editing (supporting); S.S.: investigation (equal), methodology (equal), review & editing (equal); P.T.: investigation (equal), project administration (lead), writing—review & editing (supporting); M.A.B.: investigation (equal); funding acquisition (lead); project administration (lead), writing—review & editing (supporting). All authors have read and agreed to the published version of the manuscript.
Funding
This research was funded by ASTARTE project “Assessment, STrategy and Risk Reduction for Tsunamis in Europe” (603839) co-financed by the EC (FP7), MOWER project “Rasgos Erosivos Y Depósitos Arenosos Generados Por La Mow Alrededor De Iberia: Implicaciones Paleoceanográficas, Sedimentarias Y Económicas” (CTM 2012---39599---C03). It also received financial support of the Portuguese Foundation of Science and Technology (FCT) from CIMA through UID/0350/2020 project and from IDL through project UIDB/50019/2020. Ana Lopes receives funding from the FCT through a PhD grant (SFRH/BD/147685/2019).
Acknowledgments
The authors wish to acknowledge the R/V Sarmiento de Gamboa crew for their assistance during MOWER cruise, and in particular the chief scientists (Javier Hernández Molina, Gemma Ercilla and David Casas) for the core sampling opportunity. The authors want also to acknowledge the ASTARTE team member Cristina Roque for the ideas and nice discussions along the project, Emília Salgueiro and Ana Alberto for forams preparation for 14C-dating, Guillermo Francés for the availability and opportunity to perform MSCL, XRF and CT-Scan analyses at Vigo University; and Pedro Costa for introducing Vincent Kümmerer to the microtextural analysis of quartz grains and fruitful discussions. Also, we want to acknowledge the SEM utilization (acquired in the scope of the EMSO-PT project, IPMA) under the responsibility of Fátima Abrantes, and particularly Cristina Lopes for the help in this analysis; and also the CIMA research center for receiving Vincent Kümmerer in their facilities. The authors also thank the three anonymous reviewers for their constructive comments and suggestions to improve this manuscript.
Conflicts of Interest
The authors declare no conflict of interest. The funders had no role in the design of the study; the collection, analyses, or interpretation of data; in the writing of the manuscript, or in the decision to publish the results.
References
- Costa, P.J.M.; Andrade, C. Tsunami deposits: Present knowledge and future challenges. Sedimentology 2020, 67, 1189–1206. [Google Scholar] [CrossRef]
- Smedile, A.; De Martini, P.M.; Pantosti, D.; Bellucci, L.; Del Carlo, P.; Gasperini, L.; Pirrotta, C.; Polonia, A.; Boschi, E. Possible tsunami signatures from an integrated study in the Augusta Bay offshore (Eastern Sicily-Italy). Mar. Geol. 2011, 281, 1–13. [Google Scholar] [CrossRef]
- Smedile, A.; Molisso, F.; Chagué, C.; Iorio, M.; De Martini, P.M.; Pinzi, S.; Collins, P.E.F.; Sagnotti, L.; Pantosti, D. New coring study in Augusta Bay expands understanding of offshore tsunami deposits (Eastern Sicily, Italy). Sedimentology 2020, 67, 1553–1576. [Google Scholar] [CrossRef]
- Tyuleneva, N.; Braun, Y.; Katz, T.; Suchkov, I.; Goodman-Tchernov, B. A new chalcolithic-era tsunami event identified in the offshore sedimentary record of Jisr al-Zarka (Israel). Mar. Geol. 2018, 396, 67–78. [Google Scholar] [CrossRef]
- Dawson, A.G.; Stewart, I. Tsunami deposits in the geological record. Sediment. Geol. 2007, 200, 166–183. [Google Scholar] [CrossRef]
- Rhodes, B.; Tuttle, M.; Horton, B.; Doner, L.; Kelsey, H.; Nelson, A.; Cisternas, M. Paleotsunami research. Eos Trans. Am. Geophys. Union 2006, 87, 205. [Google Scholar] [CrossRef]
- Goff, J.; Chagué-Goff, C.; Nichol, S.; Jaffe, B.; Dominey-Howes, D. Progress in palaeotsunami research. Sediment. Geol. 2012, 243–244, 70–88. [Google Scholar] [CrossRef]
- Toyofuku, T.; Duros, P.; Fontanier, C.; Mamo, B.; Bichon, S.; Buscail, R.; Chabaud, G.; Deflandre, B.; Goubet, S.; Grémare, A.; et al. Unexpected biotic resilience on the Japanese seafloor caused by the 2011 Tōhoku-Oki tsunami. Sci. Rep. 2014, 4, 7517. [Google Scholar] [CrossRef]
- Seike, K.; Kobayashi, G.; Kogure, K. Post-depositional alteration of shallow-marine tsunami-induced sand layers: A comparison of recent and ancient tsunami deposits, Onagawa Bay, northeastern Japan. Isl. Arc 2017, 26, e12174. [Google Scholar] [CrossRef]
- Feldens, P.; Schwarzer, K.; Sakuna, D.; Szczuciński, W.; Sompongchaiyakul, P. Sediment distribution on the inner continental shelf off Khao Lak (Thailand) after the 2004 Indian Ocean tsunami. Earth Planets Sp. 2012, 64, 875–887. [Google Scholar] [CrossRef]
- Milker, Y.; Wilken, M.; Schumann, J.; Sakuna, D.; Feldens, P.; Schwarzer, K.; Schmiedl, G. Sediment transport on the inner shelf off Khao Lak (Andaman Sea, Thailand) during the 2004 Indian Ocean tsunami and former storm events: Evidence from foraminiferal transfer functions. Nat. Hazards Earth Syst. Sci. 2013, 13, 3113–3128. [Google Scholar] [CrossRef]
- Weiss, R.; Bahlburg, H. A Note on the Preservation of Offshore Tsunami Deposits. J. Sediment. Res. 2006, 76, 1267–1273. [Google Scholar] [CrossRef]
- Yang, W.; Zhou, X.; Xiang, R.; Wang, Y.; Sun, L. Palaeotsunami in the East China Sea for the past two millennia: A perspective from the sedimentary characteristics of mud deposit on the continental shelf. Quat. Int. 2017, 452, 54–64. [Google Scholar] [CrossRef]
- Riou, B.; Chaumillon, E.; Schneider, J.-L.; Corrège, T.; Chagué, C. The sediment-fill of Pago Pago Bay (Tutuila Island, American Samoa): New insights on the sediment record of past tsunamis. Sedimentology 2018, 67, 1577–1600. [Google Scholar] [CrossRef]
- Riou, B.; Chaumillon, E.; Chagué, C.; Sabatier, P.; Schneider, J.-L.; Walsh, J.-P.; Zawadzki, A.; Fierro, D. Backwash sediment record of the 2009 South Pacific Tsunami and 1960 Great Chilean Earthquake Tsunami. Sci. Rep. 2020, 10, 4149. [Google Scholar] [CrossRef]
- Noda, A.; Katayama, H.; Sagayama, T.; Suga, K.; Uchida, Y.; Satake, K.; Abe, K.; Okamura, Y. Evaluation of tsunami impacts on shallow marine sediments: An example from the tsunami caused by the 2003 Tokachi-oki earthquake, northern Japan. Sediment. Geol. 2007, 200, 314–327. [Google Scholar] [CrossRef]
- Abrantes, F.; Alt-Epping, U.; Lebreiro, S.; Voelker, A.; Schneider, R. Sedimentological record of tsunamis on shallow-shelf areas: The case of the 1969 AD and 1755 AD tsunamis on the Portuguese Shelf off Lisbon. Mar. Geol. 2008, 249, 283–293. [Google Scholar] [CrossRef]
- Feldens, P.; Schwarzer, K.; Szczuciński, W.; Stattegger, K.; Sakuna, D.; Somgpongchaiykul, P.; Kiel, D. Impact of the 2004 Indian Ocean Tsunami on seafloor morphology and sediments offshore Pakarang Cape, Thailand The research area Methods. Methods 2008, 18, 63–68. [Google Scholar]
- Sakuna, D.; Szczuciński, W.; Feldens, P.; Schwarzer, K.; Khokiattiwong, S. Sedimentary deposits left by the 2004 Indian Ocean tsunami on the inner continental shelf offshore of Khao Lak, Andaman Sea (Thailand). Earth Planets Sp. 2012, 64, 931–943. [Google Scholar] [CrossRef]
- Ikehara, K.; Irino, T.; Usami, K.; Jenkins, R.; Omura, A.; Ashi, J. Possible submarine tsunami deposits on the outer shelf of Sendai Bay, Japan resulting from the 2011 earthquake and tsunami off the Pacific coast of Tohoku. Mar. Geol. 2014, 349, 91–98. [Google Scholar] [CrossRef]
- Pongpiachan, S. Application of binary diagnostic ratios of polycyclic aromatic hydrocarbons for identification of tsunami 2004 backwash sediments in khao lak, Thailand. Sci. World J. 2014, 2014, 14. [Google Scholar] [CrossRef] [PubMed]
- Quintela, M.; Costa, P.J.M.; Fatela, F.; Drago, T.; Hoska, N.; Andrade, C.; Freitas, M.C. The AD 1755 tsunami deposits onshore and offshore of Algarve (south Portugal): Sediment transport interpretations based on the study of Foraminifera assemblages. Quat. Int. 2016, 408, 123–138. [Google Scholar] [CrossRef]
- Van den Bergh, G.D.; Boer, W.; De Haas, H.; van Weering, T.C.E.; van Wijhe, R. Shallow marine tsunami deposits in Teluk Banten (NW Java, Indonesia), generated by the 1883 Krakatau eruption. Mar. Geol. 2003, 197, 13–34. [Google Scholar] [CrossRef]
- Goodman-Tchernov, B.N.; Dey, H.W.; Reinhardt, E.G.; McCoy, F.; Mart, Y. Tsunami waves generated by the Santorini eruption reached Eastern Mediterranean shores. Geology 2009, 37, 943–946. [Google Scholar] [CrossRef]
- Goodman-Tchernov, B.N.; Austin, J.A. Deterioration of Israel’s Caesarea Maritima’s ancient harbor linked to repeated tsunami events identified in geophysical mapping of offshore stratigraphy. J. Archaeol. Sci. Rep. 2015, 3, 444–454. [Google Scholar] [CrossRef]
- Tchernov, B.G.; Katz, T.; Shaked, Y.; Qupty, N.; Kanari, M.; Niemi, T.; Agnon, A. Offshore evidence for an undocumented tsunami event in the “low risk” Gulf of Aqaba-Eilat, northern Red Sea. PLoS ONE 2016, 11, e0145802. [Google Scholar]
- Einsele, G.; Chough, S.K.; Shiki, T. Depositional events and their records—an introduction. Sediment. Geol. 1996, 104, 1–9. [Google Scholar] [CrossRef]
- Le Roux, J.P.; Vargas, G. Hydraulic behavior of tsunami backflows: Insights from their modern and ancient deposits. Environ. Geol. 2005, 49, 65–75. [Google Scholar] [CrossRef]
- Shanmugam, G. Process-sedimentological challenges in distinguishing paleo-tsunami deposits. Nat. Hazards 2012, 63, 5–30. [Google Scholar] [CrossRef]
- Chagué-Goff, C.; Szczuciński, W.; Shinozaki, T. Applications of geochemistry in tsunami research: A review. Earth-Science Rev. 2017, 165, 203–244. [Google Scholar] [CrossRef]
- Tamura, T.; Sawai, Y.; Ikehara, K.; Nakashima, R.; Hara, J.; Kanai, Y. Shallow-marine deposits associated with the 2011 Tohoku-oki tsunami in Sendai Bay, Japan. J. Quat. Sci. 2015, 30, 293–297. [Google Scholar] [CrossRef]
- Jagodziński, R.; Sternal, B.; Szczuciński, W.; Lorenc, S. Heavy minerals in 2004 tsunami deposits on Kho Khao Island, Thailand. Polish J. Environ. Stud. 2009, 18, 103–110. [Google Scholar]
- Mahaney, W.C.; Dohm, J.M. The 2011 Japanese 9.0 magnitude earthquake: Test of a kinetic energy wave model using coastal configuration and offshore gradient of Earth and beyond. Sediment. Geol. 2011, 239, 80–86. [Google Scholar] [CrossRef]
- Costa, P.J.M.; Andrade, C.; Dawson, A.G.; Mahaney, W.C.; Freitas, M.C.; Paris, R.; Taborda, R. Microtextural characteristics of quartz grains transported and deposited by tsunamis and storms. Sediment. Geol. 2012, 275–276, 55–69. [Google Scholar] [CrossRef]
- Bellanova, P.; Bahlburg, H.; Nentwig, V.; Spiske, M. Microtextural analysis of quartz grains of tsunami and non-tsunami deposits—A case study from Tirúa (Chile). Sediment. Geol. 2016, 343, 72–84. [Google Scholar] [CrossRef]
- Costa, P.J.M.; Park, Y.S.; Kim, Y.D.; Quintela, M.; Mahaney, W.C.; Dourado, F.; Dawson, S. Imprints in Silica Grains Induced During An Open-Channel Flow Experiment: Determination of Microtextural Signatures During Aqueous Transport. J. Sediment. Res. 2017, 87, 677–687. [Google Scholar] [CrossRef]
- Costa, P.J.M.; Rasteiro Da Silva, D.; Figueirinhas, L.; Lario, J. The importance of coastal geomorphological setting as a controlling factor on microtextural signatures of the 2010 maule (Chile) tsunami deposit. Geol. Acta 2019, 17, 1–10. [Google Scholar]
- Martínez Solares, J.M.; López Arroyo, A. The great historical 1755 earthquake. Effects and damage in Spain. J. Seismol. 2004, 8, 275–294. [Google Scholar] [CrossRef]
- Drago, T.; Silva, P.; Lopes, A.; Magalhães, V.; Roque, C.; Rodrigues, A.I.; Noiva, J.; Terrinha, P.; Mena, A.; Francés, G.; et al. Searching for tsunamis evidences on the Algarve (Southern Portugal) continental shelf sedimentary record. In Proceedings of the EGU General Assembly, Vienna, Austria, 17–22 April 2016; Volume 18. id. EPSC2016-16997. [Google Scholar]
- Dawson, A.G.; Hindson, R.; Andrade, C.; Freitas, C.; Parish, R.; Bateman, M. Tsunami sedimentation associated with the Lisbon earthquake of 1 November AD 1755: Boca do Rio, Algarve, Portugal. Holocene 1995, 5, 209–215. [Google Scholar] [CrossRef]
- Hindson, R.A.; Andrade, C.; Dawson, A.G. Sedimentary processes associated with the tsunami generated by the 1755 Lisbon earthquake on the Algarve coast, Portugal. Phys. Chem. Earth 1996, 21, 57–63. [Google Scholar] [CrossRef]
- Cuven, S.; Paris, R.; Falvard, S.; Miot-Noirault, E.; Benbakkar, M.; Schneider, J.L.; Billy, I. High-resolution analysis of a tsunami deposit: Case-study from the 1755 lisbon tsunami in southwestern spain. Mar. Geol. 2013, 337, 98–111. [Google Scholar] [CrossRef]
- Font, E.; Veiga-Pires, C.; Pozo, M.; Nave, S.; Costas, S.; Ruiz Muñoz, F.; Abad, M.; Simões, N.; Duarte, S.; Rodríguez-Vidal, J. Benchmarks and sediment source(s) of the 1755 Lisbon tsunami deposit at Boca do Rio Estuary. Mar. Geol. 2013, 343, 1–14. [Google Scholar] [CrossRef]
- Costa, P.J.M.; Costas, S.; González-Villanueva, R.; Oliveira, M.A.; Roelvink, D.; Andrade, C.; Freitas, M.C.; Cunha, P.P.; Martins, A.; Buylaert, J.P.; et al. How did the AD 1755 tsunami impact on sand barriers across the southern coast of Portugal? Geomorphology 2016, 268, 296–311. [Google Scholar] [CrossRef]
- Feist, L.; Frank, S.; Bellanova, P.; Laermanns, H.; Cämmerer, C.; Mathes-Schmidt, M.; Biermanns, P.; Brill, D.; Costa, P.J.M.; Teichner, F.; et al. The sedimentological and environmental footprint of extreme wave events in Boca do Rio, Algarve coast, Portugal. Sediment. Geol. 2019, 389, 147–160. [Google Scholar] [CrossRef]
- Vigliotti, L.; Andrade, C.; Conceição, F.; Capotondi, L.; Gallerani, A.; Bellucci, L.G. Paleomagnetic, rock magnetic and geochemical study of the 1755 tsunami deposit at Boca do Rio (Algarve, Portugal). Palaeogeogr. Palaeoclimatol. Palaeoecol. 2019, 514, 550–566. [Google Scholar] [CrossRef]
- Andrade, C.; Freitas, M.C.; Oliveira, M.A.; Costa, P.J.M. On the Sedimentological and Historical Evidences of Seismic-Triggered Tsunamis on the Algarve Coast of Portugal. In Plate Boundaries and Natural Hazards; Delve Publishing LLC: New York, NY, USA, 2016; pp. 219–238. [Google Scholar]
- Valencia, J.; Ercilla, G.; Hernández-Molina, F.J.; Casas, D. Oceanographic Mower Cruise. Isprs Int. Arch. Photogramm. Remote Sens. Spat. Inf. Sci. 2015, XL-5/W5, 223–230. [Google Scholar] [CrossRef]
- Wessel, P.; Luis, J.F.; Uieda, L.; Scharroo, R.; Wobbe, F.; Smith, W.H.F.; Tian, D. The Generic Mapping Tools Version 6. Geochemistry Geophys. Geosystems 2019, 20, 5556–5564. [Google Scholar] [CrossRef]
- Roque, C.; Lobo, F.; Somoza, L.; Roque, C.; Hernández-Molina, F.J.; Lobo, F.; Somoza, L.; Díaz-de-Río, V.; Vázquez, J.T.; Dias, J. Geomorphology of the Eastern Algarve proximal continental margin (South Portugal, SW Iberia Peninsula): Sedimentary dynamics and its relationship with the last asymmetrical eustatic cycle. Ciencias da Terra 2010, 17, 28. [Google Scholar]
- García-Lafuente, J.; Delgado, J.; Criado-Aldeanueva, F.; Bruno, M.; del Río, J.; Miguel Vargas, J. Water mass circulation on the continental shelf of the Gulf of Cádiz. Deep. Res. Part II Top. Stud. Oceanogr. 2006, 53, 1182–1197. [Google Scholar] [CrossRef]
- Relvas, P.; Barton, E.D. Mesoscale patterns in the Cape São Vicente (Iberian Peninsula) upwelling region. J. Geophys. Res. C Ocean. 2002, 107, 1–28. [Google Scholar] [CrossRef]
- Almeida, L.P.; Ferreira, Ó.; Vousdoukas, M.I.; Dodet, G. Historical variation and trends in storminess along the Portuguese South Coast. Nat. Hazards Earth Syst. Sci. 2011, 11, 2407–2417. [Google Scholar] [CrossRef]
- Alveirinho Dias, J.M.; Neal, W.J. Sea cliff retreat in southern Portugal: Profiles, processes, and problems. J. Coast. Res. 1992, 8, 641–654. [Google Scholar]
- Andrade, C.A.C.F. O ambiente de Barreira da Ria Formosa: Algarve-Portugal. Ph.D. Thesis, Universidade de Lisboa, Lisboa, Portuga, 1990; 645p. [Google Scholar]
- Trindade, M.J.; Rocha, F.; Dias, M.I.; Prudêncio, M.I. Mineralogy and grain-size distribution of clay-rich rock units of the Algarve Basin (South Portugal). Clay Miner. 2013, 48, 59–83. [Google Scholar] [CrossRef]
- Magalhães, F. Os sedimentos da Plataforma Continental Portuguesa: Contrastes Espaciais; Instituto Hidrográfico: Lisboa, Portugal, 2001. [Google Scholar]
- Moita, I. Noticia Explicativa da Carta dos Sedimentos Superficiais da Plataforma, Folha SED 8; Instituto Hidrográfico: Lisboa, Portugal, 1986. [Google Scholar]
- Lobo, F.J.; Sánchez, R.; González, R.; Dias, J.M.A.; Hernández-Molina, F.J.; Fernández-Salas, L.M.; Díaz Del Río, V.; Mendes, I. Contrasting styles of the Holocene highstand sedimentation and sediment dispersal systems in the northern shelf of the Gulf of Cadiz. Cont. Shelf Res. 2004, 24, 461–482. [Google Scholar] [CrossRef]
- Terrinha, P.; Noiva, J.; Brito, P.; Baptista, L.; Roque, C.; Drago, T.; Silva, P.F.; Magalhães, V.; Rodrigues, A.I.; Lopes, A. New Results of the Offshore Record of Tsunami Deposits and MTDs in the NEAM Region: The Southwestern Iberian Margin case. Available online: http://www.astarte-project.eu/index.php/deliverables.html (accessed on 9 August 2020).
- Blott, S.J.; Pye, K. Particle size scales and classification of sediment types based on particle size distributions: Review and recommended procedures. Sedimentology 2012, 59, 2071–2096. [Google Scholar] [CrossRef]
- Blott, S.J.; Pye, K. GRADISTAT: A grain size distribution and statistics package for the analysis of unconsolidated sediments. Earth Surf. Process. Landforms 2001, 26, 1237–1248. [Google Scholar] [CrossRef]
- Tatzber, M.; Stemmer, M.; Spiegel, H.; Katzlberger, C.; Haberhauer, G.; Gerzabek, M.H. An alternative method to measure carbonate in soils by FT-IR spectroscopy. Environ. Chem. Lett. 2007, 5, 9–12. [Google Scholar] [CrossRef]
- Chagué-Goff, C.; Chan, J.C.H.; Goff, J.; Gadd, P. Late Holocene record of environmental changes, cyclones and tsunamis in a coastal lake, Mangaia, Cook Islands. Isl. Arc 2016, 25, 333–349. [Google Scholar] [CrossRef]
- Mena, A.; Francés, G.; Pérez-Arlucea, M.; Aguiar, P.; Barreiro-Vázquez, J.D.; Iglesias, A.; Barreiro-Lois, A. A novel sedimentological method based on CT-scanning: Use for tomographic characterization of the Galicia Interior Basin. Sediment. Geol. 2015, 321, 123–138. [Google Scholar] [CrossRef]
- Rorden, C.; Brett, M. Lesion analysis. Behav. Neurol. 2000, 12, 191–200. [Google Scholar] [CrossRef]
- Krumbein, W.C. Size Frequency Distributions of Sediments. Sepm J. Sediment. Res. 1934, 4, 65–77. [Google Scholar] [CrossRef]
- Kümmerer, V. Anomalous Layers in the Southern Portuguese Continental Shelf Sedimentary Record: Potential Evidence of the 1755 CE Lisbon Tsunami. Master’s Thesis, Universidade do Algarve, Faro, Portugal, 2019. [Google Scholar]
- Abràmoff, M.D.; Magalhães, P.J.; Ram, S.J. Image Processing with ImageJ Second Edition; Laurin Publishing: Pittsfield, MA, USA, 2004; Volume 11, ISBN 9781785889837. [Google Scholar]
- Schneider, C.A.; Rasband, W.S.; Eliceiri, K.W. NIH Image to ImageJ: 25 years of image analysis. Nat. Methods 2012, 9, 671–675. [Google Scholar] [CrossRef] [PubMed]
- Yen, J.C.; Chang, F.J.; Chang, S. A New Criterion for Automatic Multilevel Thresholding. IEEE Trans. Image Process. 1995, 4, 370–378. [Google Scholar] [PubMed]
- R Core Team. R: A Language and Environment for Statistical Computing, R Foundation for Statistical Computing, Vienna, Austria, 2020. Available online: https://www.r-project.org (accessed on 4 April 2020).
- Takashimizu, Y.; Iiyoshi, M. New parameter of roundness R: Circularity corrected by aspect ratio. Prog. Earth Planet. Sci. 2016, 3, 1–16. [Google Scholar] [CrossRef]
- Powers, M.C. A New Roundness Scale for Sedimentary Particles. Sepm J. Sediment. Res. 1953, 23, 117–119. [Google Scholar]
- Lira, C.; Pina, P. Granulometry on classified images of sand grains. In Proceedings of the 11th International Coastal Symposium ICS2011, Szczecin, Poland, 9–13 May 2011; pp. 1697–1701. [Google Scholar]
- Blaauw, M.; Christen, J.A. Flexible paleoclimate age-depth models using an autoregressive gamma process. Bayesian Anal. 2011, 6, 457–474. [Google Scholar]
- Blaauw, M.; Christen, J.A.; Bennett, K.D.; Reimer, P.J. Double the dates and go for Bayes—Impacts of model choice, dating density and quality on chronologies. Quat. Sci. Rev. 2018, 188, 58–66. [Google Scholar] [CrossRef]
- Reimer, P.J.; Bard, E.; Bayliss, A.; Beck, J.W.; Blackwell, P.G.; Ramsey, C.B.; Buck, C.E.; Cheng, H.; Edwards, R.L.; Friedrich, M.; et al. IntCal13 and Marine13 Radiocarbon Age Calibration Curves 0–50,000 Years cal BP. Radiocarbon 2013, 55, 1869–1887. [Google Scholar] [CrossRef]
- Monge Soares, A.M. The 14C Content of Marine Shells: Evidence for Variability in Coastal Upwelling off Portugal during the Holocene; International Atomic Energy Agency (IAEA): Vienna, Austria, 1993; ISBN 0074-1884. [Google Scholar]
- Krishnaswamy, S.; Lal, D.; Martin, J.M.; Meybeck, M. Geochronology of lake sediments. Earth Planet. Sci. Lett. 1971, 11, 407–414. [Google Scholar] [CrossRef]
- Bruel, R.; Rosalie, B.; Pierre, S.; Blanc, U.S. serac: A R package for ShortlivEd RAdionuclide Chronology of recent sediment cores. EarthArXiv 2020, in press. [Google Scholar] [CrossRef]
- Ishizawa, T.; Goto, K.; Yokoyama, Y.; Goff, J. Dating tsunami deposits: Present knowledge and challenges. Earth-Sci. Rev. 2020, 200, 102971. [Google Scholar] [CrossRef]
- Borcard, D.; Gillet, F.; Legendre, P. Numerical Ecology with R; Springer: Berlin, Germany, 2018; ISBN 331971404X. [Google Scholar]
- Oksanen, J.; Blanchet, F.G.; Friendly, M.; Kindt, R.; Legendre, P.; McGlinn, D.; Minchin, P.R.; O’Hara, R.B.; Simpson, G.L.; Solymos, P.; et al. Vegan: Community Ecology Package. 2019. Available online: http://www.sortie-nd.org/lme/R%20Packages/vegan.pdf (accessed on 9 August 2020).
- Legendre, P.; Gallagher, E.D. Ecologically meaningful transformations for ordination of species data. Oecologia 2001, 129, 271–280. [Google Scholar] [CrossRef] [PubMed]
- Kruskal, W.H.; Wallis, W.A. Use of Ranks in One-Criterion Variance Analysis. J. Am. Stat. Assoc. 1952, 47, 583–621. [Google Scholar] [CrossRef]
- Morton, R.A.; Gelfenbaum, G.; Jaffe, B.E. Physical criteria for distinguishing sandy tsunami and storm deposits using modern examples. Sediment. Geol. 2007, 200, 184–207. [Google Scholar] [CrossRef]
- Freitas, J.G.; Dias, J.A. 1941 windstorm effects on the Portuguese Coast. What lessons for the future? J. Coast. Res. 2013, 65, 714–719. [Google Scholar] [CrossRef]
- Fortunato, A.B.; Freire, P.; Bertin, X.; Rodrigues, M.; Ferreira, J.; Liberato, M.L.R. A numerical study of the February 15, 1941 storm in the Tagus estuary. Cont. Shelf Res. 2017, 144, 50–64. [Google Scholar] [CrossRef]
- Sakuna-Schwartz, D.; Feldens, P.; Schwarzer, K.; Khokiattiwong, S.; Stattegger, K. Internal structure of event layers preserved on the Andaman Sea continental shelf, Thailand: Tsunami vs. storm and flash-flood deposits. Nat. Hazards Earth Syst. Sci. 2015, 15, 1181–1199. [Google Scholar] [CrossRef]
- Ortega, J.A.; Garzón, G. A contribution to improved flood magnitude estimation in base of palaeoflood record and climatic implications—Guadiana River (Iberian Peninsula). Nat. Hazards Earth Syst. Sci. 2009, 9, 229–239. [Google Scholar] [CrossRef]
- Fowler, A.J.; Gillespie, R.; Hedges, R.E.M. Radiocarbon Dating of Sediments. Radiocarbon 1986, 28, 441–450. [Google Scholar] [CrossRef]
- Andrés Christen, J.; Pérez, E.S. A New Robust Statistical Model for Radiocarbon Data. Radiocarbon 2009, 51, 1047–1059. [Google Scholar] [CrossRef]
- Aquino-López, M.A.; Blaauw, M.; Christen, J.A.; Sanderson, N.K. Bayesian Analysis of 210 Pb Dating. J. Agric. Biol. Environ. Stat. 2018, 23, 317–333. [Google Scholar] [CrossRef]
- Ishizawa, T.; Goto, K.; Yokoyama, Y.; Miyairi, Y.; Sawada, C.; Nishimura, Y.; Sugawara, D. Sequential radiocarbon measurement of bulk peat for high-precision dating of tsunami deposits. Quat. Geochronol. 2017, 41, 202–210. [Google Scholar] [CrossRef]
- Gràcia, E.; Vizcaino, A.; Escutia, C.; Asioli, A.; Rodés, Á.; Pallàs, R.; Garcia-Orellana, J.; Lebreiro, S.; Goldfinger, C. Holocene earthquake record offshore Portugal (SW Iberia): Testing turbidite paleoseismology in a slow-convergence margin. Quat. Sci. Rev. 2010, 29, 1156–1172. [Google Scholar] [CrossRef]
- Wronna, M.; Baptista, M.A.; Miranda, J.M. Reanalysis of the 1761 transatlantic tsunami. Nat. Hazards Earth Syst. Sci. 2019, 19, 337–352. [Google Scholar] [CrossRef]
- Baptista, M.A.; Miranda, J.M. Revision of the portuguese catalog of tsunamis. Nat. Hazards Earth Syst. Sci. 2009, 9, 25–42. [Google Scholar] [CrossRef]
- Kümmerer, V.; Drago, T.; Pires, C.V.; Silva, P.; Lopes, A.; Magalhaes, V.; Roque, C.; Rodrigues, A.I.; Terrinha, P.; Mena, A.; et al. Offshore 1755 CE Lisbon Tsunami Deposit in the Southern Portuguese Continental Shelf. In Proceedings of the EGU General Assembly, Vienna, Austria, 4–8 May 2020; Volume 2020. id. EGU2020-20. [Google Scholar]
- Abrantes, F.; Lebreiro, S.; Rodrigues, T.; Gil, I.; Bartels-Jónsdóttir, H.; Oliveira, P.; Kissel, C.; Grimalt, J.O. Shallow-marine sediment cores record climate variability and earthquake activity off Lisbon (Portugal) for the last 2000 years. Quat. Sci. Rev. 2005, 24, 2477–2494. [Google Scholar] [CrossRef]
- Puga-Bernabéu, Á.; Aguirre, J. Contrasting storm- versus tsunami-related shell beds in shallow-water ramps. Palaeogeogr. Palaeoclimatol. Palaeoecol. 2017, 471, 1–14. [Google Scholar] [CrossRef]
- Riou, B. Shallow Marine Sediment Record of Tsunamis: Analysis of the Sediment-Fill of Bays of Tutuila (American Samoa) and Backwash Deposits of the 2009 South Pacific Tsunami; Université de La Rochelle (France): La Rochelle, France, 2019. [Google Scholar]
- Rosa, F.; Rufino, M.M.; Ferreira, Ó.; Matias, A.; Brito, A.C.; Gaspar, M.B. The influence of coastal processes on inner shelf sediment distribution: The Eastern Algarve shelf (Southern Portugal). Geol. Acta 2013, 11, 59–73. [Google Scholar]
- Jagodziński, R.; Sternal, B.; Szczuciński, W.; Sugawara, D. Heavy minerals in the 2011 Tohoku-oki tsunami deposits—insights into sediment sources and hydrodynamics. Sediment. Geol. 2012, 282, 57–64. [Google Scholar] [CrossRef]
- Vos, K.; Vandenberghe, N.; Elsen, J. Surface textural analysis of quartz grains by scanning electron microscopy (SEM): From sample preparation to environmental interpretation. Earth-Sci. Rev. 2014, 128, 93–104. [Google Scholar] [CrossRef]
- Seike, K.; Kitahashi, T.; Noguchi, T. Sedimentary features of Onagawa Bay, northeastern Japan after the 2011 off the Pacific coast of Tohoku Earthquake: Sediment mixing by recolonized benthic animals decreases the preservation potential of tsunami deposits. J. Oceanogr. 2016, 72, 141–149. [Google Scholar] [CrossRef]
- Liu, Q.; Roberts, A.P.; Larrasoaa, J.C.; Banerjee, S.K.; Guyodo, Y.; Tauxe, L.; Oldfield, F. Environmental magnetism: Principles and applications. Rev. Geophys. 2012, 50, 1–50. [Google Scholar]
- Yoshii, T.; Tanaka, S.; Matsuyama, M. Tsunami deposits in a super-large wave flume. Mar. Geol. 2017, 391, 98–107. [Google Scholar] [CrossRef]
- Feist, L.; Reicherter, K.; Costa, P.J.M.; Bellanova, P.; Santisteban, J.I.; Bosnic, I.; Val-peón, C.; Schwarzbauer, J.; Frenken, M.; Vött, A.; et al. The Continental Shelf as an Offshore Archive for Tsunami Deposits—An Example from Southwest Iberia (RV METEOR Cruise M152). 2020. Available online: https://doi.org/10.5194/egusphere-egu2020-8504 (accessed on 9 August 2020).
- Mendes, I.; Rosa, F.; Dias, J.A.; Schönfeld, J.; Ferreira, Ó.; Pinheiro, J. Inner shelf paleoenvironmental evolution as a function of land-ocean interactions in the vicinity of the Guadiana River, SW Iberia. Quat. Int. 2010, 221, 58–67. [Google Scholar] [CrossRef]
- Mendes, I.; Dias, J.A.; Schönfeld, J.; Ferreira, Ó.; Rosa, F.; Gonzalez, R.; Lobo, F.J. Natural and human-induced Holocene paleoenvironmental changes on the Guadiana shelf (northern Gulf of Cadiz). Holocene 2012, 22, 1011–1024. [Google Scholar] [CrossRef]
- Mil-Homens, M.; Vale, C.; Naughton, F.; Brito, P.; Drago, T.; Anes, B.; Raimundo, J.; Schmidt, S.; Caetano, M. Footprint of roman and modern mining activities in a sediment core from the southwestern Iberian Atlantic shelf. Sci. Total Environ. 2016, 571, 1211–1221. [Google Scholar] [CrossRef]
- Pacheco, A.; Williams, J.J.; Ferreira, Ó.; Garel, E.; Reynolds, S. Applicability of sediment transport models to evaluate medium term evolution of tidal inlet systems. Estuar. Coast. Shelf Sci. 2011, 95, 119–134. [Google Scholar] [CrossRef]
- Burdloff, D.; Araújo, M.F.; Jouanneau, J.M.; Mendes, I.; Monge Soares, A.M.; Dias, J.M.A. Sources of organic carbon in the Portuguese continental shelf sediments during the Holocene period. Appl. Geochem. 2008, 23, 2857–2870. [Google Scholar] [CrossRef]
- Maitre, J.; Bouchard, K.; Bédard, L.P. Mineral grains recognition using computer vision and machine learning. Comput. Geosci. 2019, 130, 84–93. [Google Scholar] [CrossRef]
- Paris, R.; Falvard, S.; Chagué, C.; Goff, J.; Etienne, S.; Doumalin, P. Sedimentary fabric characterized by X-ray tomography: A case-study from tsunami deposits on the Marquesas Islands, French Polynesia. Sedimentology 2020, 67, 1207–1229. [Google Scholar] [CrossRef]
- Priest, G.R.; Witter, R.C.; Zhang, Y.J.; Goldfinger, C.; Wang, K.; Allan, J.C. New constraints on coseismic slip during southern Cascadia subduction zone earthquakes over the past 4600 years implied by tsunami deposits and marine turbidites. Nat. Hazards 2017, 88, 285–313. [Google Scholar] [CrossRef]


© 2020 by the authors. Licensee MDPI, Basel, Switzerland. This article is an open access article distributed under the terms and conditions of the Creative Commons Attribution (CC BY) license (http://creativecommons.org/licenses/by/4.0/).