Article

Mobility of Radiogenic Helium in Amphibole

1
Kola Scientific Centre of Russian Academy of Sciences, Geological Institute, 184209 Apatity, Russia
2
The Laboratory of Glass Property, 196128 St. Petersburg, Russia
3
Northern Energetic Research Centre, Kola Scientific Centre of Russian Academy of Sciences, 184209 Apatity, Russia
*
Author to whom correspondence should be addressed.
Minerals 2021, 11(1), 27; https://doi.org/10.3390/min11010027
Submission received: 27 October 2020 / Revised: 17 December 2020 / Accepted: 22 December 2020 / Published: 28 December 2020

Abstract

:
Recently experiments on He extraction from an amphibole by the incremental heating unexpectedly revealed that the He release pattern depends on the heating rate. During slow heating (~4 K·min−1) of the amphibole grains, one smooth peak of the He flux from the mineral was observed; in contrast, during fast heating (~40 K·min−1) an additional sharp peak appeared at a temperature about 750 °C. In order to explain these observations, we developed a model of He diffusion from the amphibole, which allowed the calculated He fluxes from the mineral to be reconciled with those observed. From the modelling we derived: (i) the helium diffusion domain size distribution, and evolution of the distribution in the course of incremental heating; (ii) occurrence of the tensile stresses, operating under enhanced temperatures above 700 °C. The stresses are different in sites with the different local thermal expansion of the crystalline lattice and they increase the He diffusion flux. The model can be applied to other minerals (materials).

1. Introduction

Studies of noble gas mobility in minerals may be contingently separated into two major branches. The first one aims to distinguish the different noble gas components in a mineral, to understand the origin and behavior of each, and to use the results in such fields as radiometric dating, e.g., [1,2,3,4], isotope geochemistry and hydrology [5,6,7,8]. Within the frame of the second branch, noble gas atoms are considered as penetrating chemically inert nano-tracers, whose migration through a material sheds light on its structure [7,9,10,11], defects [12], and such parameters as the sorption [13,14], the solubility [15,16,17,18], the melt/mineral partition [19,20], and the noble gas accessible volumes [8,21].
In this contribution, we continue investigations of the He sites and mobility in amphiboles. 4He and 3He concentrations in amphiboles generally exceed those in the host whole rock samples and in some rocks provide the balance of both He isotopes. Since the early papers of Gerling et al. [22,23] a specific role of amphiboles in the noble gas balance of terrestrial rocks was considered in several contributions [9,24,25,26,27,28,29,30].
Recently, two new features of the He isotope migration in amphiboles were reported [1].
(1) Even though the light isotope, 3He, is generally considered as a more movable one [31,32], values of the 4He retention parameter (RET, which is the He amount retained in a mineral/total amount of radiogenic He produced) in some samples are well below those for 3He, RET(3He) > RET(4He). To study He isotope mobility in such samples, the high-resolution step-wise-heating experiments (with a 50 °C heating step) were performed and the diffusion process was applied to model the release fluxes. The modeling showed that the diffusion parameters of 3He and 4He atoms, survived in the mineral, can’t be applied to those that have been lost [33].
This result was explained by the different sites of the parent isotopes in the mineral: 6Li for 3He and 232Th, 235U, 238U for 4He. Li atoms are supposed to be uniformly distributed within the amphibole crystalline lattice as components of the structural formula or substituting similar size ions of Mg+, Fe++ and Al+. Therefore, the radiation tracks, yielded by the 6Li(n, α)3H reaction, have an enhanced probability to remain within the amphibole grain and to preserve 3He atoms, produced by 3H β-decay. U and Th are the highly incompatible elements; they are often concentrated near the mineral boundaries, in the micro mineral inclusions or within the thin film mineralization. Thus, α-tracks, produced by U and Th decay, often cross the grain surface or fissures. The residence times of He atoms within an open track is as short as ≈ 1 year (at normal temperature) and 4He atoms easily migrate from such tracks. Hence, the different sites of the parent isotopes stimulate the preferential release of 4He atoms (compared to 3He ones), migrating from a mineral by the non-diffusion mechanisms [33].
(2) Another new feature of He migration from some amphiboles is the dependence of the He release pattern on the heating rate during incremental linear heating [1]. If a slow heating rate, e.g., 6 °C·min−1, was applied to the amphibole grains (separated from the alkaline granites, the Ponoi massif, the Kola Peninsula), He was released as one smooth peak within a temperature interval from 300 to 900 °C. However, in case of the enhanced rate, e.g., 40 °C·min−1, a sharp second peak appeared with a maximum at ≈ 770 °C. These observations were reproduced in two different laboratories (see Figure 4 in [1]). Further studies showed that: (i) such a peculiarity of the release pattern is seen in amphibole samples from several other sites; however, this is not an inherent feature of the amphibole group minerals; (ii) generally, the amphiboles contain micro inclusions of other minerals; (iii) the incremental heating of the crushed samples (a powder particle size ≤ 50 μm) results in the one peak He release pattern, irrespective of the heating rate.
The objectives of this study are to present new data on He release from the amphibole grains and powder by fast and slow incremental heating, and to explain the observed release patterns by an adequate diffusion model that takes into account the diffusion domain size distribution and the processes governing He diffusion in the course of heating of the mineral.

2. Materials and Methods

2.1. Experimental Procedure

He extraction from a mineral by its heating with a linear incessant increase in the temperature (defined here as incremental heating) was performed in a stainless-steel crucible heated by a resistance furnace up to ~1000 °C and controlled by a digital temperature controller with Pt-Pt-Rh thermocouple.
Helium was extracted by the incremental heating from the amphibole grains (which sizes were from 0.25 to 0.63 mm) and powder (from ~5 × 10⁻³ to ~5 × 10⁻¹ mm).
Gases, extracted from a mineral, were admitted into the inlet-purification system. Chemically active gases and heavy noble gases were removed, using cold traps and Ti-Zr getters. He and Ne were admitted into the mass spectrometer, and the He flux from a mineral was measured. The magnetic sector mass spectrometer (MI 1201) was used for measurements of (i) the flux of He, released from a sample during the incremental heating experiments (in the dynamic mode), and (ii) noble gas isotope compositions and concentrations (in the static mode). The mass resolution of ~1000 allowed a complete separation of 3He+ from hydrogen ions H3+ and HD+. The sensitivity for He was 3 × 10⁻⁵ A torr−1. Before each run, the mass spectrometer was calibrated by the laboratory standard with the 4He/3He and 4He/20Ne ratios being 6.29 × 10⁵ and 47, respectively. The 4He analytical blank was within 4.5 × 10⁻¹⁴ mol.

2.2. Alkaline Amphiboles and Their Host Rocks

The Ponoi massif of alkaline granites is located in the east segment of the Kola Peninsula and consists of aegirine–arfvedsonite granites, granosyenites, quartz syenites and lepidomelane granites. Major minerals are plagioclase (31%), quartz (31%), K-Na feldspar (28%), amphibole (5%), aegirine (5%). The accessory minerals are: titanite, allanite, zircon, monazite, apatite, fluorite, magnetite, ilmenite, britholite, astrophyllite. Amphibole in the Ponoi massif is represented by the alkaline varieties, i.e., arfvedsonite, ribekite, ferrowinchite, and are characterize by high concentrations of Fe and numerous micro-inclusions of quartz, microcline, ilmenite, rutile (see Figure 8 in [1]). Amphibole 23/90 (collection by V.R. Vetrin), considered in this study, was separated from a pegmatite vein, SiO2 (49%), Fe2O3 (12%) and FeO (22%) being the major constituents of the mineral [26].
The U-Pb age of the granites, obtained from the zircon cores, is 2666 ± 10 Ma. The late Paleoproterozoic stage of the Svekofennian tectono-magmatic activity caused the amphibole facies metamorphism of these rocks. The temperature and pressure of this event approached 600 °C and 6 kbar, respectively. New mineral paragenesis was formed (zircon, titanite, monazite, etc.) and some isotopic chronometers (e.g., K-Ar, Rb-Sr) were reset. U-Th-Pb dating of the zircon shells gives 1802 ± 22 Ma, accepted hereafter as the age of metamorphism [34].

3. Results

3.1. Experimental Results

The He release patterns, measured in the course of the fast and slow incremental heating of the powder and grains of amphibole 23/90, and the heating rates are presented in Figure 1 and Figure 3 and in the Supplementary File; the 4He amounts, released in the extraction experiments, are shown in the captions to these Figures. The 4He concentration in the amphibole was 2.3 × 10⁻⁸ mol·g−1.
The He release patterns reveal three principal features, modelled and discussed below.
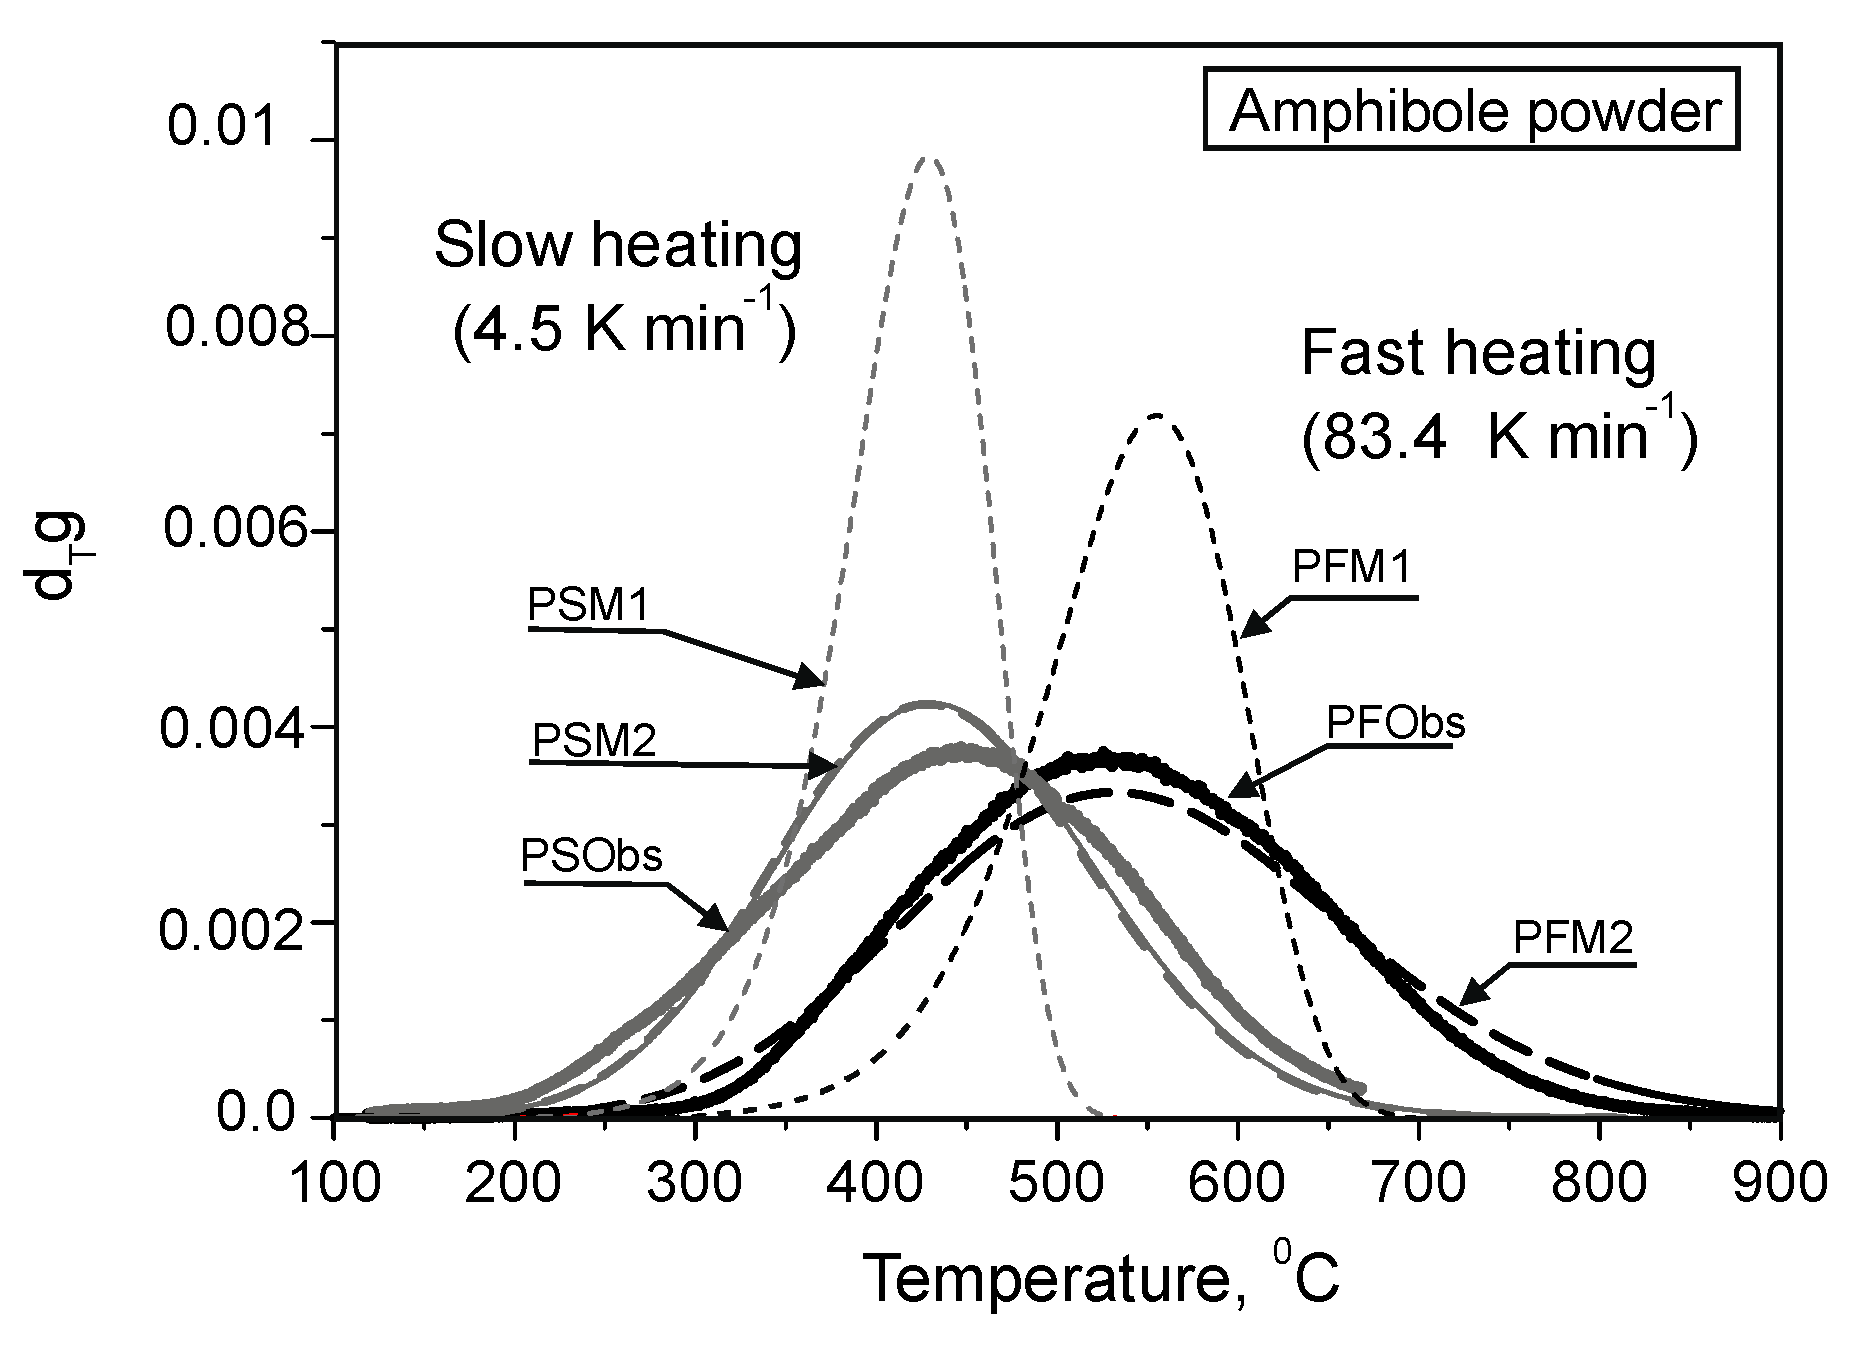
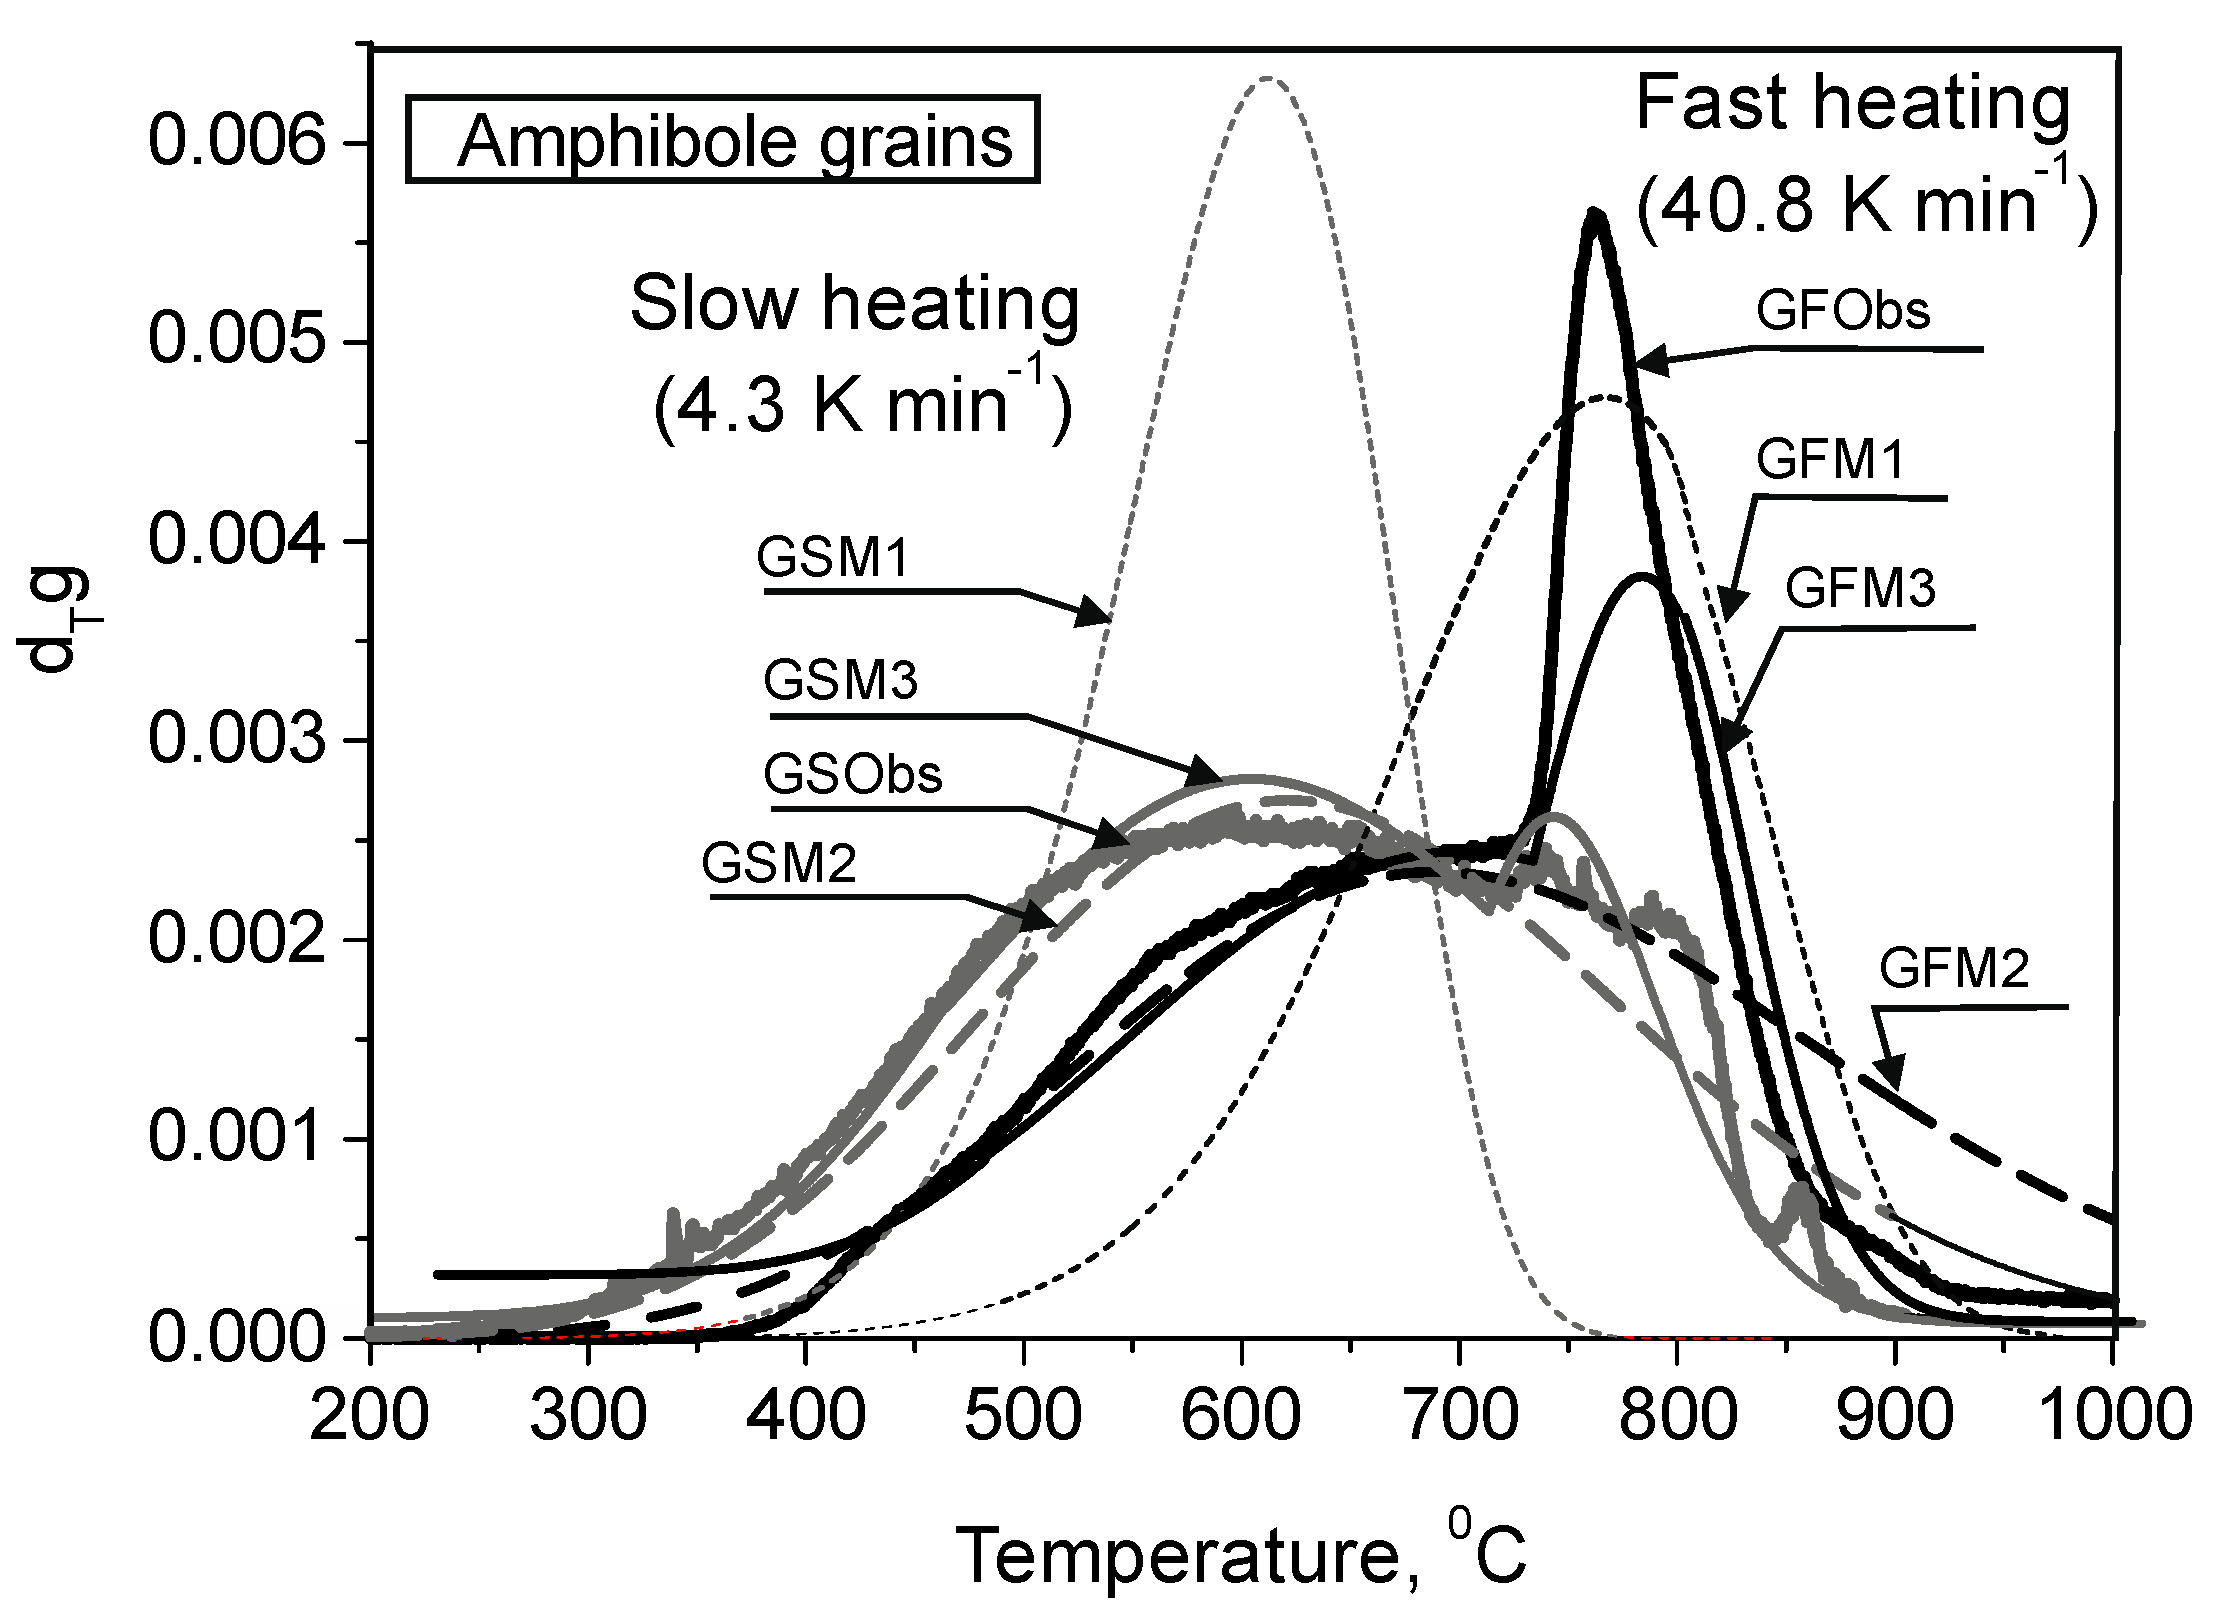
  • In case of the fast heating rate, He is released from the powder and grains under higher temperatures compared with the slow rate.
  • He is released as a smooth peak within a wider temperature interval compared with that expected from He diffusion from the single size diffusion domain.
  • During fast isothermal heating of the amphibole grains, a sharp second peak appeared with a maximum at ≈ 770 °C; the second peak has never been observed if He is extracted from the powder.

3.2. He Migration in a Diffusion Domain: The Model

Migration of He atoms in a mineral grain is considered to be governed by a diffusion mechanism operating within a diffusion domain, whose size and shape are unknown. In order to simplify the model, we discuss here three symmetric cases introduced by the shape coefficient γ, which is equal to 0 for a plane, to 1 for a cylinder and to 2 for a sphere. Then, the He concentration C in each site of the domain at time t is described by Equation (1)
t C = 1 ξ γ ξ ( ξ γ D ξ C ) ,
where ξ is the coordinate, D is the diffusion coefficient, which is assumed to be dependent (within a given mineral) only on the temperature, DD(T). He is considered to escape readily from the surface of the domain; therefore, the boundary condition is
C | ξ = r = 0 , t > 0 .
He is considered to be homogeneously distributed within a domain at time t = 0, when the extraction experiment starts, therefore the initial condition is:
C | t = 0 = 1 , ξ < r .
In expressions (2,3), r is the size of the diffusion domain, i.e., the half-width for the plane, and the radius for the cylinder or sphere.
Integrating Equation (1) by the domain volume gives:
t 0 r ξ γ C   d ξ = r γ D ξ C | ξ = r ,
The left side of (4) expresses the rate of change of the He amount inside the diffusion domain (within a constant factor), and the right side represents the He flux through its surface. Let us introduce the average relative concentration of He within the domain,
C ¯ = 0 r ξ γ C   d ξ 0 r ξ γ   d ξ = γ + 1 r γ + 1   0 r ξ γ C   d ξ ,
and estimate the He mass flux through the surface of the domain (see the right part of Equation (4)), replacing the derivative by the finite difference:
D ξ C | ξ = r D C | ξ = r C ¯ r = D C ¯ r .
Substituting the average concentration and the He mass flux from Equations (5) and (6) into (4) gives:
t C ¯ = ( γ + 1 ) D r 2 C ¯ .
Now, we introduce the relaxation time τ, which is the characteristic time of the diffusion, according to the following expression:
τ r 2 ( γ + 1 ) D .
Substitution of Equation (8) into (7) yields:
d t C ¯ = C ¯ τ .
Equation (9) shows that during the relaxation time τ the amount of He in a diffusion domain decreases by a factor of “e” times (e ≅ 2.71828). As it follows from Equation (8), the relaxation time τ depends on: the size and shape of the diffusion domain; the diffusion coefficient and therefore on the temperature.
Equation (9) is the ordinary differential equation that determines the average He concentration in a diffusion domain at any given time; at t = 0 the concentration C ¯ is (in accordance with expression (3)):
C ¯ | t = 0 = 1 ,
and the value at any subsequent time is determined by the solution (11) of the problem (9) with the condition (10):
C ¯ ( t ) = exp   [ 0 t d t τ ( t ) ] .
Hereafter, we discuss the dimensionless relative He amount in a diffusion domain, i.e., the fraction of He retained at time t, or the fraction lost (see Equation (19)). This comment is also valid for: (i) the case when diffusion takes place in the domains of different size (Equation (12)); (ii) the related parameters, e.g., for the He flux, whose dimension is time−1.
Equation (11) is the simplest version of the model, envisaging an equal size for all diffusion domains, and the respective calculations are not able to reproduce the observed decreasing of the average He amount (expressed as the He flux from the mineral) in the course of incremental heating (see Figure 1 below and related text).

3.3. The Model with Variable Sizes of the Diffusion Domains

Now, we consider the multi-size distribution of the diffusion domains and introduce the time-dependent function κr, representing the density of distribution of the He amount over the size r (radius) of the domains (hereafter, it is termed as the helium domain size distribution function, DSD, m−1). Then, the He amount in domains with the radius varying within an interval (r, r + dr) is d C ¯ = κ r ( t , r ) d r , and the total He amount at the time t can be obtained by integration of all domains:
C ¯ ( t ) = 0 κ r ( t , r )   d r .
As the diffusion processes are independent in the domains with different sizes, then, by analogy with Equations (7) and (9), the following equation is valid:
d t κ r = κ r τ ( r ) ,
where τ(r) is the relaxation time defined by Equation (8).
Equation (13) is the ordinary differential equation that determines κr values of the DSD at each time moment. Integrating (13) requires the initial condition:
κ r | t = 0 = κ r 0 ,
where κ r 0 is the DSD at the initial time t = 0.
The following normalization takes place:
0 κ r 0 ( r )   d r = 1 .
Integrating (13) yields:
κ r ( t , r ) = κ r 0 exp   [ 0 t d t τ ( t , r ) ] .
Equation (16) makes it possible to calculate relationships between the time and: (i) the DSD function κ r ; (ii) the He amount in the sample, expressed by (12).
Below, we use the 3-parameter distribution (17) as the initial DSD,
κ k 0 ( r ) = K   r α exp ( r β R m β ) ,
where R m is the representative radius of the domains (see Figure 2); α ,   β are constants ( α ,   β > 0 ) ; K is a coefficient, whose value is derived from the normalization (15). Equation (17) is a modification of the Erlang’s law of distribution [35], well-known from the theory of probability.
The initial distribution κ k 0 ( r ) (Figure 2, see curves corresponding to the temperature 20 °C) shows that for r = 0 the He amount κ k 0 ( r ) = 0. While the radius r increases, κ k 0 ( r ) is increasing as well up to a maximum value for r = R m   α 1 β β   1 β ; further increase results in monotonous decreasing of κ k 0 ( r ) and κ k 0 ( r ) → 0 when r . The distribution of κ k 0 ( r ) is asymmetric. Therefore, the averaged radius of the diffusion domain R at the initial time t = 0, expressed by Equation (18)
R t = 0 R 0 = 0 r κ k 0 ( r )   d r ,
differs from the representative radius Rm.
The He amount in a domain is decreasing with time, as it follows from Equation (11), and it falls to zero when the time is long enough. Correspondingly, the function g(t),
g ( t ) 1 C ¯ ( t ) ,
is the He fraction that has released from a sample at time t; g ( t ) is increasing with time and tends to 1. The time derivative of g ( t ) is the He flux from a sample in the course of its incremental heating (Section 3.1):
g d t g = d C ¯ d t .
In our experiments, the heating rate is T d t T = c o n s t and heating temperature varies from an initial room value T 0 ≅ 20 °C to T max ≅ 1000 °C. Because of the linear connection between the time and the temperature, it is more convenient to use temperature as the independent variable, i.e., to operate by g ( T ) and d T g ( T ) instead of g ( t ) and g ( t ) ; notice that the following relationship takes place:
d T g = g / T .
By analogy with g ( t ) we define the derivative d T g as the rate of He release from a sample (also termed here as the He flux, K−1), depending on the relationships between the diffusion coefficient and the temperature expressed by the Arrhenius Equation (22)
D = D 0 exp ( E R A T ) ,
where D0, m2·s−1, is the frequency factor, E, J·mol−1, is the activation energy and RA = 8.31 J ·mol−1·K−1 is the universal gas constant.
Equation (22) can also be expressed as the Boltzmann exponent and we use below this expression,
D = D 0 exp ( U k T ) ,
where U, J, is the activation energy per 1 molecule, k = 1.38 × 10⁻²³ J·K−1 is the Boltzmann constant. According to (22) and (23), parameters in the above equations are related as
E = N A   U ,   R A = N A   k ,
where NA ≈ 6.03 × 10²³ mol−1 is the Avogadro number.
The above equations were applied to model He release from the amphibole powder and grains for the slow and fast heating rates. The following fixed values of the model parameters were used for all simulations: the temperature diapason from an initial temperature T0 = 20 °C to a final Tmax = 1000 °C; the diffusion constants D0 = 2 × 10⁻⁵ m2·s−1, E = 9.94 × 10⁴ J·mol−1. The latter values are similar to those reported in the original papers [30,36] and review [37].

3.4. He Release from the Powdered Samples: Comparison of the Experimental and Calculated Results

In this section, we compare the He extraction patterns, obtained by incremental heating of the amphibole powder (Section 3.1), with those derived from the diffusion model (Section 3.2). According to the measurements, the He flux dTg increases with increasing of the temperature, approaches a maximum at the temperature Tm, and then smoothly decreases to zero (Figure 1). Two features of the He release patters are important: (i) Tm depends on the heating rate of a sample: a higher rate T shifts the maximum dTg towards a higher temperature; (ii) the He release patterns are almost symmetrical for the slow and fast heating rates.
Figure 1 shows that the simplest version of the model (Section 3.2), envisaging a single-size diffusion domain with a model-derived radius R = 0.037 mm, reproduces the temperatures of the maximum fluxes (see the calculated curves Powder Slow Model 1, PSM1, and PFM1 for the slow and fast heating rates, respectively, in Figure 1). However, the calculated peaks are narrow and their maxima are significantly higher than those measured.
A good agreement between the experimental and calculated fluxes was achieved using the model 2 with the multi-size diffusion domains (the calculated curves Powder Slow Model 2, PSM2, and PFM2 for the slow and fast heating rates, respectively, in Figure 1). The initial DSD function, κ k 0 ( r ) , used for these calculations (Figure 2, see curves labeled by a temperature 20 °C), was derived for α = 0.5 ,   β = 0.7 ,   R m = 0.006   mm (Equation (17)). The above values of α and β are also valid for the DSD calculated for the amphibole grains, but Rm, the representative radius of the domains containing the maximum amount of 4He at the initial time t = 0, approaches 0.064 and 0.037 mm for the slow and fast incremental heating of the grains, respectively (see Section 3.5 below).
The calculated sizes (radii) of the powder diffusion domains vary from ~10−4 to ~10−1; these sizes are in a reasonable agreement with those observed for the powder particles, from ~10−3 to ~5 × 10⁻¹ mm. The average radius of the diffusion domain R = 0.033   mm , calculated via Equation (18) for the initial time t = 0 (or the initial temperature, T0 = 20 °C), is quite similar to the radius R = 0.037   mm , derived from the single-size domain model.
Figure 2 also presents the model-derived evolution of the DSD function κ r ( r ) in the course of slow and fast heating. As far as the heating proceeds, the distribution curves shift towards the larger domains; the radius corresponding to the maximum value of κ r max is increasing, whereas values of κ r max and areas below the curves κ r ( r ) are decreasing. A faster heating rate causes increase the temperature of He release from the domains of equal size. For example, when the heating temperature approaches 420 °C, He is still available only in domains with R > 8 × 10⁻³ and > 2 × 10⁻³ mm for the slow and fast heating rates, respectively (Figure 2).

3.5. He Release from the Grains: Comparison of Experimental and Calculated Results

As in the case with the powdered samples, in this section, we compare the measured He release patterns from the amphibole grains with those calculated for the single-size and multi-size domain diffusion models.
First of all, it should be emphasized that the measured He release fluxes from the powder (Figure 1) and the grains (Figure 3) are quite different, especially for the fast heating rate. In the case of slow heating the temperature interval of He release is wider (approaches ≅ 600 °C) and is shifted to a higher temperature (≅ 620 °C, Figure 3) compared with the powder release pattern (PSObs in Figure 1). In the case of fast heating (curve GFObs, Figure 3), the He extraction pattern has two peaks: the lower temperature smooth peak with a maximum value at ≅ 670 °C and the higher temperature sharp peak at ≅ 770 °C. This difference between the He extraction patterns from a mineral in the course of the slow and fast heating rates was for the first time reported in [1].
To model He fluxes from the grains, we applied: the diffusion model with the temperature range and the diffusion constants used to model He fluxes from the powder (Section 3.3); parameters for the DSD function, presented in Section 3.4.
Comparison of the observed release fluxes (curves GSObs and GFObs) with those calculated for model 1 with the single-size diffusion domains (see curves Grain Slow Model 1, GSM1, and GFM1 for the fast and slow heating rates in Figure 3) shows that we approximately reproduced temperatures of the maximal fluxes, as it was done for the powdered samples (Figure 1). However, the differences between the widths of the experimental and calculated He mass fluxes are larger, compared to the results for the powdered samples.
For a more complex multi-size-domain model 2, a reasonable agreement between the experimental and calculated fluxes is observed for the slow heating rate (curves GSObs and GSM2 in Figure 3).
In the case of the fast heating the experiment- and model-derived release fluxes (curves GFObs and GFM2) are similar up to a temperature of ~700 °C (Figure 3). At the higher temperatures there is a significant mismatch of the fluxes: the measured flux yields a sharp peak in contrast to the calculated flux, which is smoothly decreasing. Such feature of the He release flux indicates a sharp decrease in the He relaxation time τ at temperatures ≥ 700 °C; possible causes of this phenomenon are considered below.

3.6. Diffusion and the Tensile Stresses

Equation (23) determines the diffusion coefficient, D = D 0   e U k T , via the activation energy U characterizing the atomic bonds of the crystalline lattice. A helium atom starts moving through the lattice only if its energy exceeds the activation energy. However, the moving atom shifts neighboring atoms of the lattice and, thus, reduces locally this potential barrier [38]. Additionally, the potential barrier is decreased in case a crystalline lattice is stretched by the tensile stresses, increasing the inter-atomic intervals. Therefore, in accordance with the thermal-fluctuation theory of destruction [39], the energy U in Equation (23) should be replaced by the difference U V σ :
D ( T , σ ) = D 0   exp   ( U V   σ k T )   = D ( T )   exp   ( V   σ k T )
where σ is the tensile stress; V is the structural parameter, i.e., the efficient volume activated by the moving atom, whose value exceeds the atomic size by about 2 orders of magnitude. Equation (24) shows that occurrence of the tensile stresses increases the diffusion coefficient: the higher the stresses, the faster the diffusion.

4. Discussion

Now, we discuss why the tensile stresses appear in a mineral during its heating and estimate their values. It is known that atoms of the crystalline lattice perform periodic vibrations, called the thermal vibrations. Considering an atom as a simple harmonic oscillator, we obtain the following expression for the amplitude A of its thermal vibrations:
A = ξ   ( 2 k   T U a ) 1 2 ,
where ξ and U a are the length and the energy of the chemical bonds, respectively. As it follows from Equation (25), the amplitude of atomic vibrations A depends on the ratio of the atomic thermal energy k   T over the atomic bond energy U a : the larger the ratio k   T / U a , the higher the amplitude. An increase in the amplitude causes expansion of the crystalline lattice.
From the theory of elasticity, it follows that the relative deformation (elongation) d e , caused by a change of the temperature d T , is represented as:
d e = γ d T ,
where γ is the proportionality factor, termed the coefficient of thermal expansion (CTE) of a medium. It appears reasonable to assume that the relative deformation of the medium is proportional to the relative change of the vibration amplitude; namely, d e ~ d A ξ . Then, differentiating Equation (25) with respect to the temperature and comparing the result with Equation (26), we obtain the following expression for γ :
γ = C k U a   T ,
indicating the dependence of CTE on the binding energy of atoms: the higher the strength of the interatomic bonds, the lower the thermal expansion of the medium. In Equation (27) C is the constant factor. The crystalline lattice of amphiboles includes the double chains (ribbons) of silicon-oxygen tetrahedrons, the cationic positions between which are filled with ions of iron, magnesium and other elements. As it follows from the chemical composition of our amphibole (Section 2), the bindings between Si–O and Fe–O atoms are the dominants, and their binding energies are quite different, U S i O 794   KJ / mol and U F e O   405   KJ / mol [40]. Correspondingly, the CTE value (Equation (27)) at different sites of the amphibole is different, and this initiates the internal stresses.
To estimate the difference, we define γ as the CTE of the amphibole as a whole; then, if the temperature is increased by a dT value, the internal stresses should increase approximately by
d σ = G   ( γ γ )   d T ,
where G is the amphibole elastic modulus. Equation (28) shows that in the course of heating, dT > 0, the positive tensile stresses σ increases in the sites with the local thermal expansion coefficients γ below the average value γ , and, according to Equation (24), the He diffusion is getting faster through these sites.
It should be noted that the “equilibrium” temperature, below which the tensile stresses in amphibole are negligible, should be taken into account for correct using of Equation (28). The available data indicate that the process of magmatic crystallization during cooling leads to a gradual formation of the mineral crystalline structure, which is finally set at a certain temperature and does not change upon further cooling. According to thermo-barometric measurements in granites, the last restructuring of an amphibole occurs at a temperature ≈740 °C [41]. Additionally, rocks of the Ponoi massif underwent the amphibolite facies metamorphism, which occurred under temperature slightly below 700 °C [26]. Therefore, we may assume that, at a temperature ≅ 700 °C, the state of the crystal lattice was at the equilibrium and there were no internal stresses, which are developed under T > 700 °C. Using reasonable values of the parameters,
V = 10 27 m 3 ,   γ = 2 · 10 6 K 1 ,   γ = 8 · 10 6 K 1 ,   G = 50   GPa ,
responsible for occurrence of the tensile stresses (Equations (24) and (28)), and applying the diffusion model with variable sizes of the diffusion domains (Section 3.3), we were able to reconcile the calculated He fluxes with those observed in the course of slow and fast heating of the amphibole grains (compare curves GSObs and GFObs with those obtained by modeling, Grain Slow Model 3, GSM3, and Grain Fast Model 3, GFM3, Figure 3).
The dependence of the diffusion coefficient on the internal thermal stresses (Equations (24) and (28)) should be considered as a qualitative one due to: (i) uncertainty in the values of the structural parameter V , the thermal expansion coefficients γ and γ , and the elastic modulus G ; (ii) a simplified presentation of the effects of the internal stresses on the interatomic bond effective energy.
It should be highlighted that the high-temperature intense He flux (curve GFObs in Figure 3) has not been observed in some other amphiboles [1]. Within the framework of the model 3 developed here, two explanations could be proposed.
(1) The tensile stresses originate due to different CTE of the amphibole crystalline lattice and the quartz (other minerals) micro-inclusions in it. In this case Equation (28), the accepted above values of the related parameters and the results of modeling (seen in Figure 3, curve GFM3) could be valid providing a sufficient density of the micro-inclusions; the density is a rather variable “irregular” parameter. Such inclusions are present indeed in amphiboles, separated from the Ponoi alkaline granites (see Figure 8 in [1]). This could explain occurrence of the high-temperature He flux and its variable contributions seen in experiments with the different sample-weights of the same sample (see Figure 4 in [1]). A low density of the micro-inclusions in an amphibole from another locality cause insufficient tensile stresses and absence of the high-temperature He flux.
(2) As it was mentioned above, the tensile stresses occur under enhances temperatures exceeding the equilibrium “formations” temperature. If He has (mainly) released from a sample below this temperature (e.g., because of a small size of the diffusion domains), occurrence of the stresses and the related deformations of the diffusion domains would not affect the He flux. This explains the smooth release pattern of the He flux from the amphibole powder (curve PFObs).

5. Conclusions

Our results show that gas extraction by the incremental (linear incessant) heating with different rates provide a profound insight on processes governing noble gas mobility in a mineral. Thus, He extraction from some amphibole varieties revealed dependence of the He release pattern on the heating rate [1]. Here, we presented the He release fluxes from the Ponoi amphibole grains and powder in the course of their heating at the slow and fast rates (see Figure 1 and Figure 3). The measured fluxes were compared with those calculated for three different versions of the diffusion model developed in this study.
All set of the experimental results can be explained by the He diffusion model, which includes two new important features: (i) the multi-size distribution of the diffusion domains, (ii) occurrence of the tensile stresses, operating under high temperatures and accelerating He migration from a mineral.
The model allows the diffusion domains size distribution (DSD) to be quantified. This sheds light on the disturbance of the crystalline lattice (e.g., by microfractures, solid and/or fluid micro-inclusions, radiation defects), revealed by the He fluxes from a mineral.
The tensile stresses stretch the crystalline lattice, increasing the inter-atomic intervals due to the different thermal expansion at the different sites of the crystalline lattice. Thus, they increase the diffusion coefficient and accelerate He release from a sample, which process is seen as the high-temperature sharp peak of the He flux.
Even though the observed and model derived fluxes are almost identical, the model solution should be considered as a qualitative one because the parameters involved are poorly known. Further studies are needed to better understand this phenomenon, including experiments on He release from amphiboles (as well as from some other minerals) of different composition, age and evolution history.
The combination of the experiments and modeling, worked out in this contribution, can be applied to other minerals (materials), which undergo destruction in the course of heating. We also would like to emphasize that the incremental heating, applied at different rates, provides a convenient framework for numerical simulations of noble gas migration and thus helps to identify the noble gas sites in minerals and to understand processes responsible for their mobility.

Supplementary Materials

The following are available online at https://www.mdpi.com/2075-163X/11/1/27/s1, Table S1: He release patterns obtained by slow and fast heating of the powder and grains, alkaline amphibole, The Ponoi massif of alkaline granites, Kola Peninsula.

Author Contributions

Conceptualization, I.T.; Data curation, V.K. and M.G.; Formal analysis, S.T.; Investigation, S.T. and M.G.; Methodology, V.K.; Resources, M.G.; Software, S.T. and V.K.; Supervision, I.T.; Validation, I.T.; Visualization, V.K. and M.G.; Writing—original draft, I.T. and S.T. All authors have read and agreed to the published version of the manuscript.

Funding

This research received no external funding. This study was performed within the scientific project NIR 0226-2019-0052 (Geological Institute KSC RAS).

Data Availability Statement

The data presented in this study are available in the Supplementary Material here.

Acknowledgments

The authors thank V. Vetrin for preparing of the amphibole separate, used in this contribution, and for his help during our work with the manuscript, as well as M. Vetrin for preparing of the figures.

Conflicts of Interest

The authors declare no conflict of interest.

References

  1. Tolstikhin, I.N.; Verchovsky, A.B.; Kamensky, I.L.; Skiba, V.I.; Gannibal, M.A.; Vetrin, V.R.; Tarakanov, S.V. Amphibole: A major carrier of helium isotopes in crustal rocks. Chem. Geol. 2016, 444, 187–198. [Google Scholar] [CrossRef] [Green Version]
  2. Trull, T.W.; Kurz, M.D.; Jenkins, W.J. Diffusion of cosmogenic 3He in olivine and quartz: Implications for surface exposure dating. Earth Planet. Sci. Lett. 1991, 103, 241–256. [Google Scholar] [CrossRef]
  3. Shuster, D.L.; Farley, K.A.; Sisterson, J.M.; Burnett, D.S. Quantifying the diffusion kinetics and spatial distributions of radiogenic 4He in minerals containing proton-induced 3He. Earth Planet. Sci. Lett. 2003, 217, 19–32. [Google Scholar] [CrossRef]
  4. Yokochi, R.; Marty, B.; Pik, R.; Burnard, P. High 3He/4He ratios in peridotite xenoliths from SW Japan revisited: Evidence for cosmogenic 3He released by vacuum crushing. Geochem. Geophys. Geosyst. 2005, 6, Q01004. [Google Scholar] [CrossRef]
  5. Gramlich, J.W.; Naughton, J.J. Nature of source material for ultramafic minerals from Salt Lake crater, Hawaii, from measurement of helium and argon diffusion. J. Geophys. Res. 1972, 77, 3032–3042. [Google Scholar] [CrossRef]
  6. Shaw, A.M.; Hilton, D.R.; Fischer, T.P.; Walker, J.A.; de Leeuw, G.A.M. Helium isotope variations in mineral separates from Costa Rica and Nicaragua: Assessing crustal contributions, timescale variations and diffusion-related mechanisms. Chem. Geol. 2006, 230, 124–139. [Google Scholar] [CrossRef]
  7. Tolstikhin, I.; Kamensky, I.L.; Tarakanov, S.; Kramers, J.; Pekala, M.; Skiba, V.; Gannibal, M.; Novikov, D. Noble gas isotope sites and mobility in mafic rocks and olivine. Geochim. Cosmochim. Acta 2010, 74, 1436–1447. [Google Scholar] [CrossRef]
  8. Tolstikhin, I.; Waber, H.N.; Kamensky, I.; Loosli, H.H.; Skiba, V.; Gannibal, M. Production, redistribution and loss of helium and argon isotopes in a thick sedimentary aquitard-aquifer system (Molasse Basin, Switzerland). Chem. Geol. 2011, 286, 48–58. [Google Scholar] [CrossRef]
  9. Lee, J.K.W. The argon release mechanisms of hornblende in vacuo. Chem. Geol. 1993, 106, 133–170. [Google Scholar] [CrossRef]
  10. Shuster, D.L.; Farley, K.A. Diffusion kinetics of proton-induced 21Ne, 3He, and 4He in quartz. Geochim. Cosmochim. Acta 2005, 69, 2349–2359. [Google Scholar] [CrossRef]
  11. Farley, K.A. He diffusion systematics in minerals: Evidence from synthetic monazite and zircon structure phosphates. Geochim. Cosmochim. Acta 2007, 71, 4015–4024. [Google Scholar] [CrossRef]
  12. Argunova, T.C.; Sorokin, L.M.; Pevzner, B.Z.; Balitsky, V.C.; Gannibal, M.A.; Je, J.H.; Hwu, Y.; Tsai, W.-L. The Influence of Defects in the Crystal Structure on Helium Diffusion in Quartz. Phys. Solid State 2003, 45, 1910–1917. [Google Scholar] [CrossRef]
  13. Dunai, T.J.; Roselieb, K. Sorption and diffusion of helium in garnet: Implications for volatile tracing and dating. Earth Planet. Sci. Lett. 1996, 139, 411–421. [Google Scholar] [CrossRef]
  14. Matsumoto, T.; Maruo, K.; Tsuchiyama, A.; Matsuda, J.I. Occlusion of noble gases (He, Ne, Ar, Kr, Xe) into synthetic magnetite at 500–1300 °C. Earth Planet. Sci. Lett. 1996, 141, 315–324. [Google Scholar] [CrossRef]
  15. Lux, G. The behavior of noble gases in silicate liquids: Solution, diffusion, bubbles and surface effects, with applications to natural samples. Geochim. Cosmochim. Acta 1987, 51, 1549–1560. [Google Scholar] [CrossRef]
  16. Roselieb, K.; Rammensee, W.; Buttner, H.; Rosenhauer, M. Solubility and diffusion of noble gases in vitreous albite. Chem. Geol. 1992, 96, 241–266. [Google Scholar] [CrossRef]
  17. Trull, T.W.; Kurz, M.D. Experimental measurements of 3He and 4He mobility in olivine and clinopyroxene at magmatic temperatures. Geochim. Cosmochim. Acta 1993, 57, 1313–1324. [Google Scholar] [CrossRef]
  18. Parman, S.W.; Kurz, M.D.; Hart, S.R.; Grove, T.L. Helium solubility in olivine and implications for high 3He/4He in ocean island basalts. Nature 2005, 437, 1140–1143. [Google Scholar] [CrossRef]
  19. Matsuda, J.; Sudo, M.; Ozima, M.; Ito, K.; Ohtaka, O.; Ito, E. Noble gas partitioning between metal and silicate under high pressures. Science 1993, 259, 787–790. [Google Scholar] [CrossRef]
  20. Heber, V.S.; Brooker, R.A.; Kelley, S.P.; Wood, B.J. Crystal-melt partitioning of noble gases (helium, neon, argon, krypton, and xenon) for olivine and clinopyroxene. Geochim. Cosmochim. Acta 2007, 71, 1041–1061. [Google Scholar] [CrossRef]
  21. Baxter, E.F. Quantification of the factors controlling the presence of excess 40Ar or 4He. Earth Planet. Sci. Lett. 2003, 216, 619–634. [Google Scholar] [CrossRef]
  22. Gerling, E.K.; Mamyrin, B.A.; Tolstikhin, I.N.; Yakovleva, S.S. Helium isotopic composition in some rocks. Geochem. Int. 1971, 8, 755–761. [Google Scholar]
  23. Gerling, E.K.; Tolstikhin, I.N.; Drubetskoy, E.R.; Levkovsky, R.Z.; Sharkov, E.V.; Kozakov, I.K. Helium and argon isotopes in rock-forming minerals. Geochimiya 1976, 11, 1603–1611. (In Russian) [Google Scholar]
  24. Kamensky, I.L.; Tolstikhin, I.N.; Vetrin, V.R. Juvenile helium in ancient rocks: I. 3He excess in amphiboles from 2.8 Ga charnockite series—Crust-mantle fluid in intracrustal magmatic processes. Geochim. Cosmochim. Acta 1990, 54, 3115–3122. [Google Scholar] [CrossRef]
  25. Lee, J.K.W.; Onstott, T.C.; Cashman, K.V.; Cumbest, R.J.; Johnson, D.J. Incremental heating of hornblende in vacuo: Implications for 40Ar/39Ar geochronology and the interpretation of thermal histories. Geology 1991, 19, 872–876. [Google Scholar] [CrossRef]
  26. Vetrin, V.R.; Kamensky, I.L.; Bayanova, T.B.; Timmerman, M.; Belyatsky, B.V.; Levsky, L.K.; Balashov, Y.A. Melanocratic nodules in alkaline granites of the Ponoiskii Massif, Kola Peninsula: A clue to petrogenesis. Geochem. Int. 1999, 37, 1061–1072. [Google Scholar]
  27. Kendrick, M.A.; Scambelluri, M.; Honda, M.; Phillips, D. High abundances of noble gas and chlorine delivered to the mantle by serpentinite subduction. Nat. Geosci. 2011, 4, 807–812. [Google Scholar] [CrossRef]
  28. Jackson, C.R.M.; Parman, S.W.; Kelley, S.P.; Cooper, R.F. Noble gas transport into the mantle facilitated by high solubility in amphibole. Nat. Geosci. 2013, 6, 562–565. [Google Scholar] [CrossRef]
  29. Jackson, C.R.M.; Parman, S.W.; Kelley, S.P.; Cooper, R.F. Light noble gas dissolution into ring structure-bearing materials and lattice influences on noble gas recycling. Geochim. Cosmochim. Acta 2015, 159, 1–15. [Google Scholar] [CrossRef]
  30. Jackson, C.R.M.; Shuster, D.L.; Parman, S.W.; Smye, A.J. Noble gas diffusivity hindered by low energy sites in amphibole. Geochim. Cosmochim. Acta 2016, 172, 65–75. [Google Scholar] [CrossRef]
  31. Shelby, J.E. Diffusion of helium isotopes in vitreous silica. Phys. Rev. B 1971, 4, 2681–2686. [Google Scholar] [CrossRef]
  32. Burnard, P. Diffusive fractionation of noble gases and helium isotopes during mantle melting. Earth Planet. Sci. Lett. 2004, 220, 287–295. [Google Scholar] [CrossRef]
  33. Gudkov, A.V.; Kolobov, V.V.; Tarakanov, S.V.; Tolstikhin, I.N. Mobility of radiogenic isotopes 4He and 3He and their retention in a mineral (by the example of amphibole). Dokl. Earth Sci. 2019, 488, 1193–1195. [Google Scholar] [CrossRef]
  34. Vetrin, V.R.; Rodionov, N.V. Geology and geochronology of neoarchean anorogenic magmatism of the Keivy structure, Kola Peninsula. Petrology 2009, 17, 578–600. [Google Scholar] [CrossRef]
  35. Erlang, A.K. The theory of probabilities and telephone conversations. In The Life and Works of A.K. Erlang: Transactions of the Danish Academy of Technical Sciences; Brockmeyer, E., Halstrøm, H.L., Jensen, A., Eds.; Akademiet for de Tekniske Videnskaber: Copenhagen, Denmark, 1948; Volume 2, pp. 131–137. [Google Scholar]
  36. Lippolt, H.J.; Weigel, W. 4He diffusion in 40Ar-retantative minerals. Geochim. Cosmochim. Acta 1988, 52, 1449–1458. [Google Scholar] [CrossRef]
  37. Baxter, E.F. Diffusion of noble gases in minerals. Rev. Miner. Geochem. 2010, 72, 509–997. [Google Scholar] [CrossRef]
  38. Kalashnikov, E.V.; Pevzner, B.Z. Motion of a helium atom through a comparable-diameter channel in the Frenkel-Kontorova model. Phys. Solid State 2002, 44, 294–299. [Google Scholar] [CrossRef]
  39. Regel, V.R.; Slucker, A.I.; Tomashevsky, E.E. Kinetic Theory of the Strength of Solid Bodies; Nauka: Moscow, Russia, 1974; 560p. (In Russian) [Google Scholar]
  40. Kondratiev, V.N. Bond Breaking Energies: Ionization Potentials and Electron Affinity; Nauka: Moscow, Russia, 1974; 351p. (In Russian) [Google Scholar]
  41. Elliott, B.A. Crystallization conditions of the Wiborg Rapakivi Batholith, SE Finland: An evaluation of amphibole and biotite mineral chemistry. Mineral. Petrol. 2001, 72, 305–324. [Google Scholar] [CrossRef]
Figure 1. Comparison of the He release patterns (the He flux, K−1, versus the temperature, °C), measured in the course of slow (curve Powder Slow Observed, PSObs) and fast (PFObs) incremental heating of the amphibole powder, with the modeling results. 4He amounts extracted from the powdered samples in the course of slow and fast heating were 4.7 × 10⁻¹⁰ and 5.1 × 10⁻¹⁰ mol, respectively.
Minerals 11 00027 g001
Figure 2. The calculated He distribution function κ r ( r ) for the diffusion domains of different sizes R during slow and fast incremental heating of the amphibole powder.
Minerals 11 00027 g002
Figure 3. Comparison of the He release patterns (the He flux, K−1, versus the temperature, OC), measured in the course of slow (curve Grain Slow Observed, GSObs) and fast (GFObs) incremental heating of the amphibole grains, with the modeling results. 4He amounts extracted from the grain samples in the course of slow and fast heating were 5.1 × 10⁻¹⁰ and 1.1 × 10⁻⁹ mol, respectively.
Minerals 11 00027 g003
Publisher’s Note: MDPI stays neutral with regard to jurisdictional claims in published maps and institutional affiliations.

