Kinetics of the Thermal Decomposition of Rhodochrosite

 , , , ,
  and
and 
Abstract
:1. Introduction
2. Materials and Methods
3. Results and Discussion
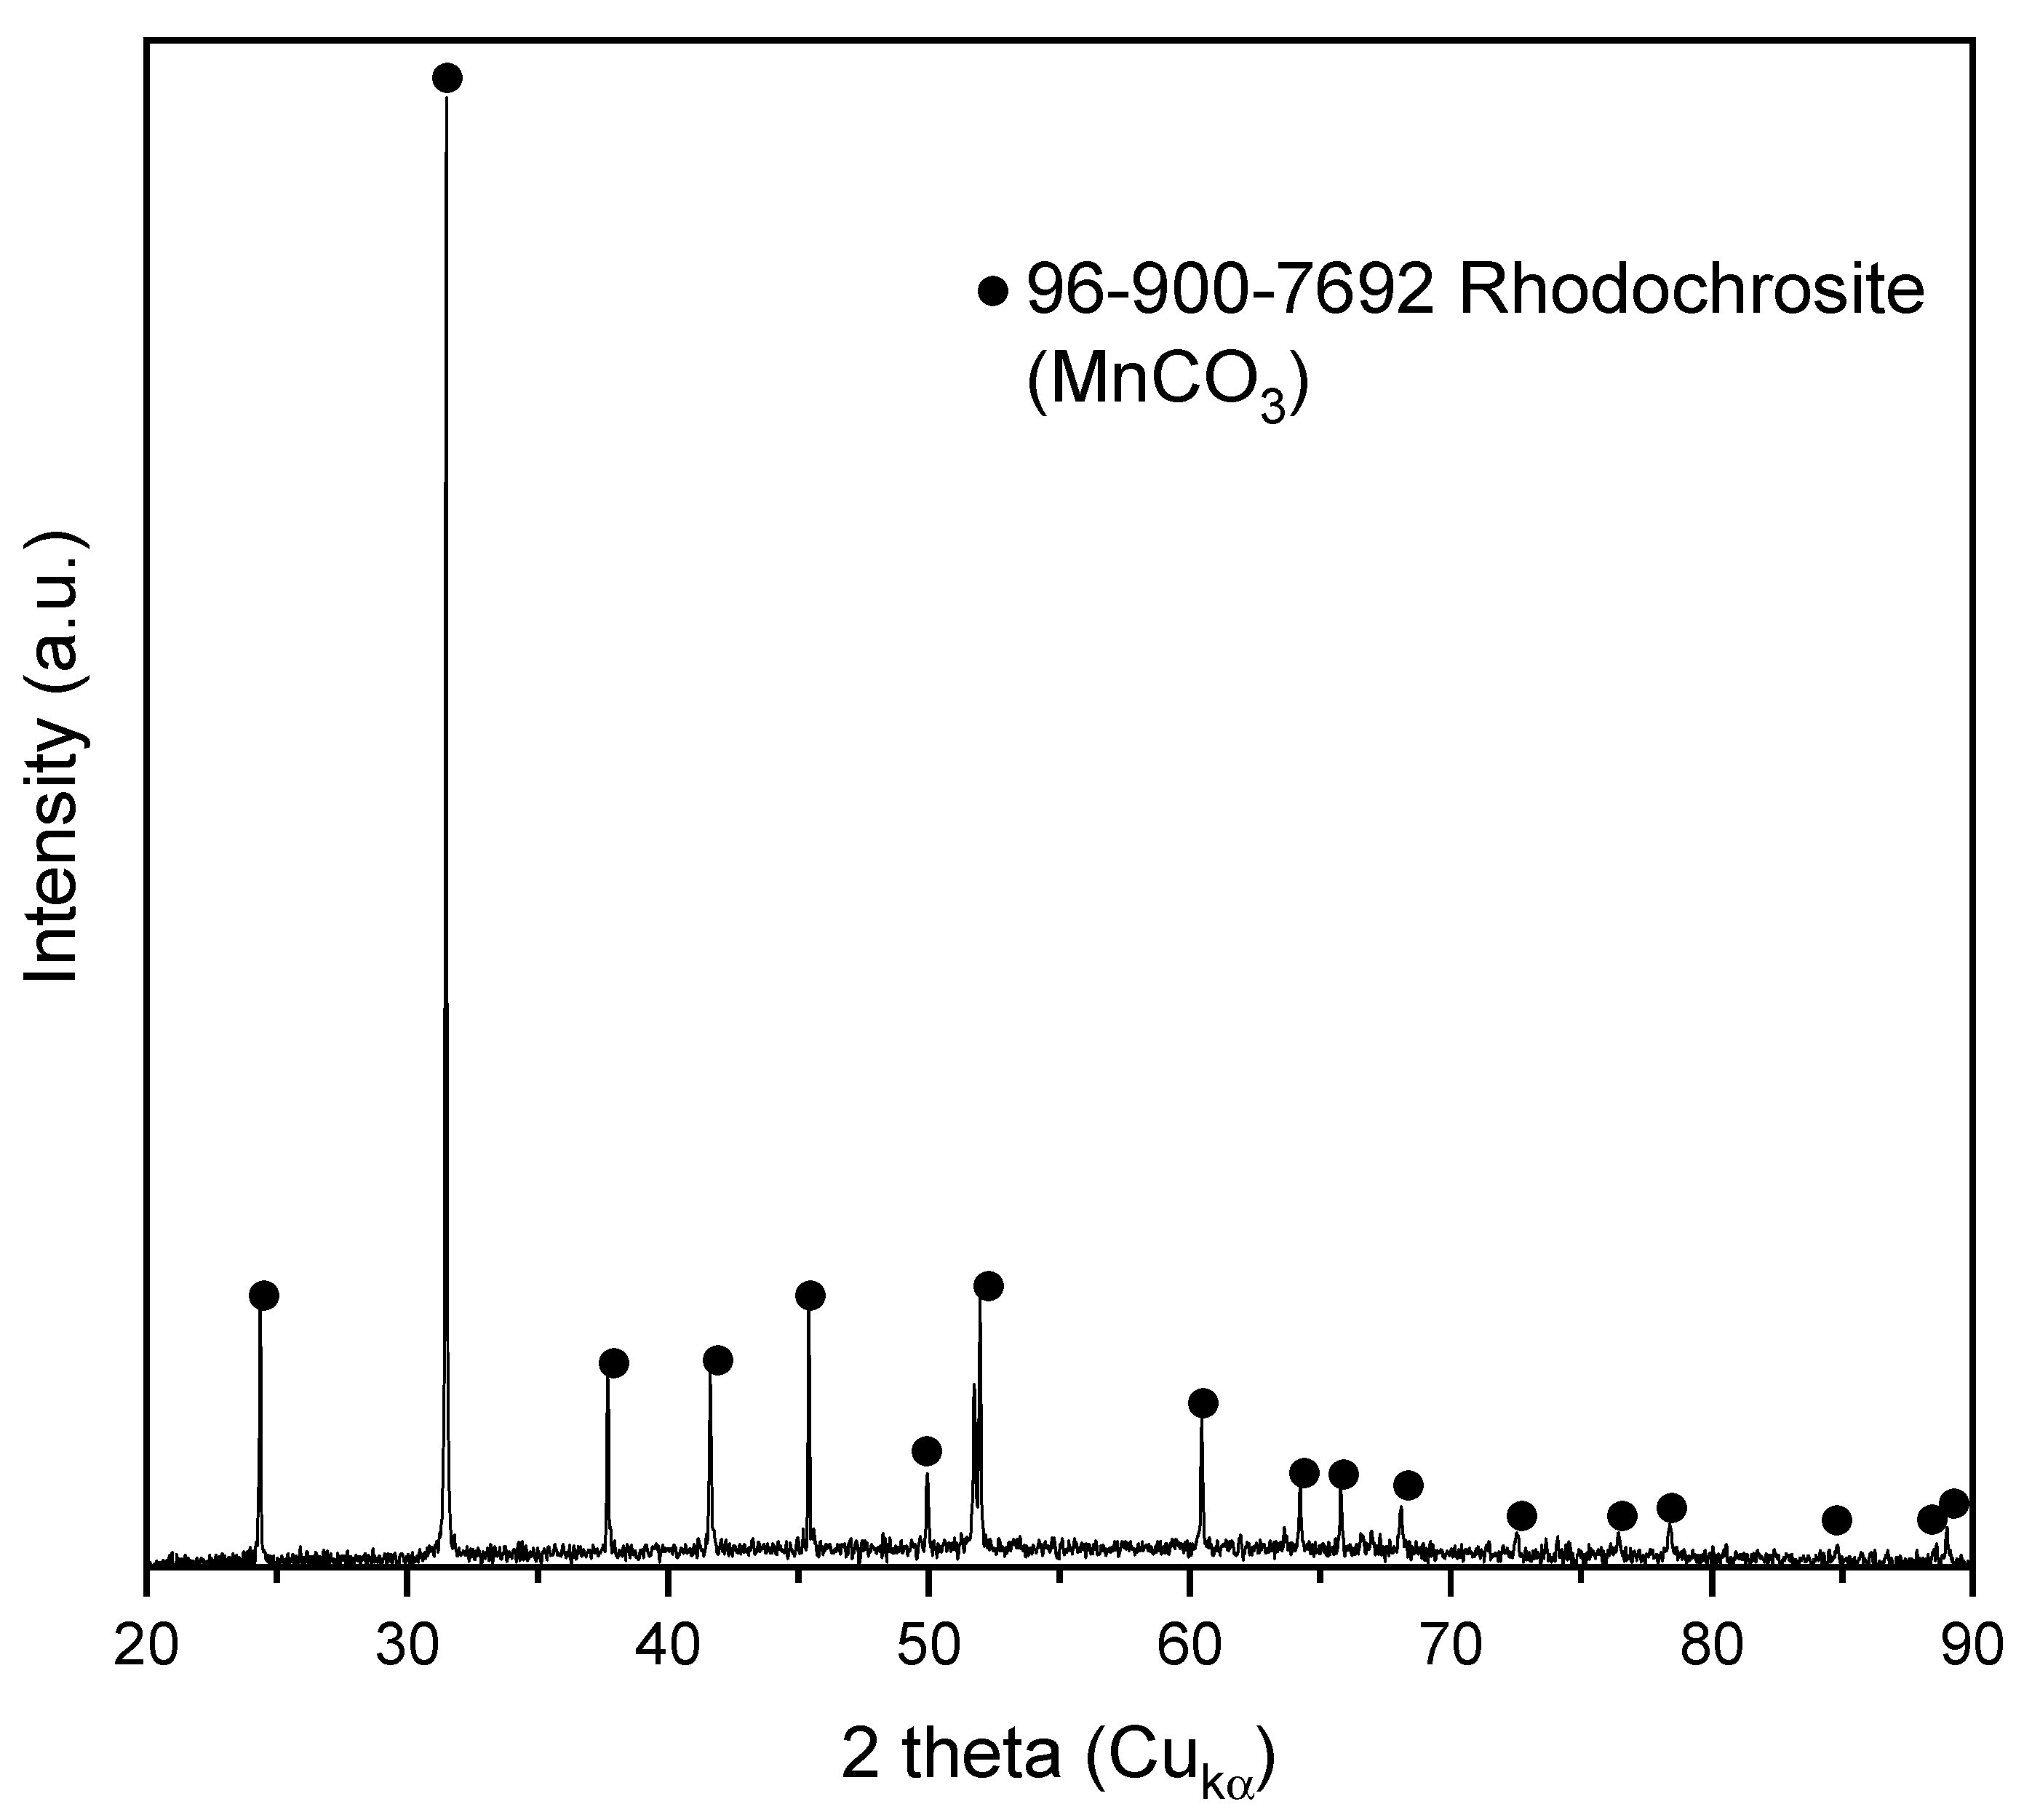
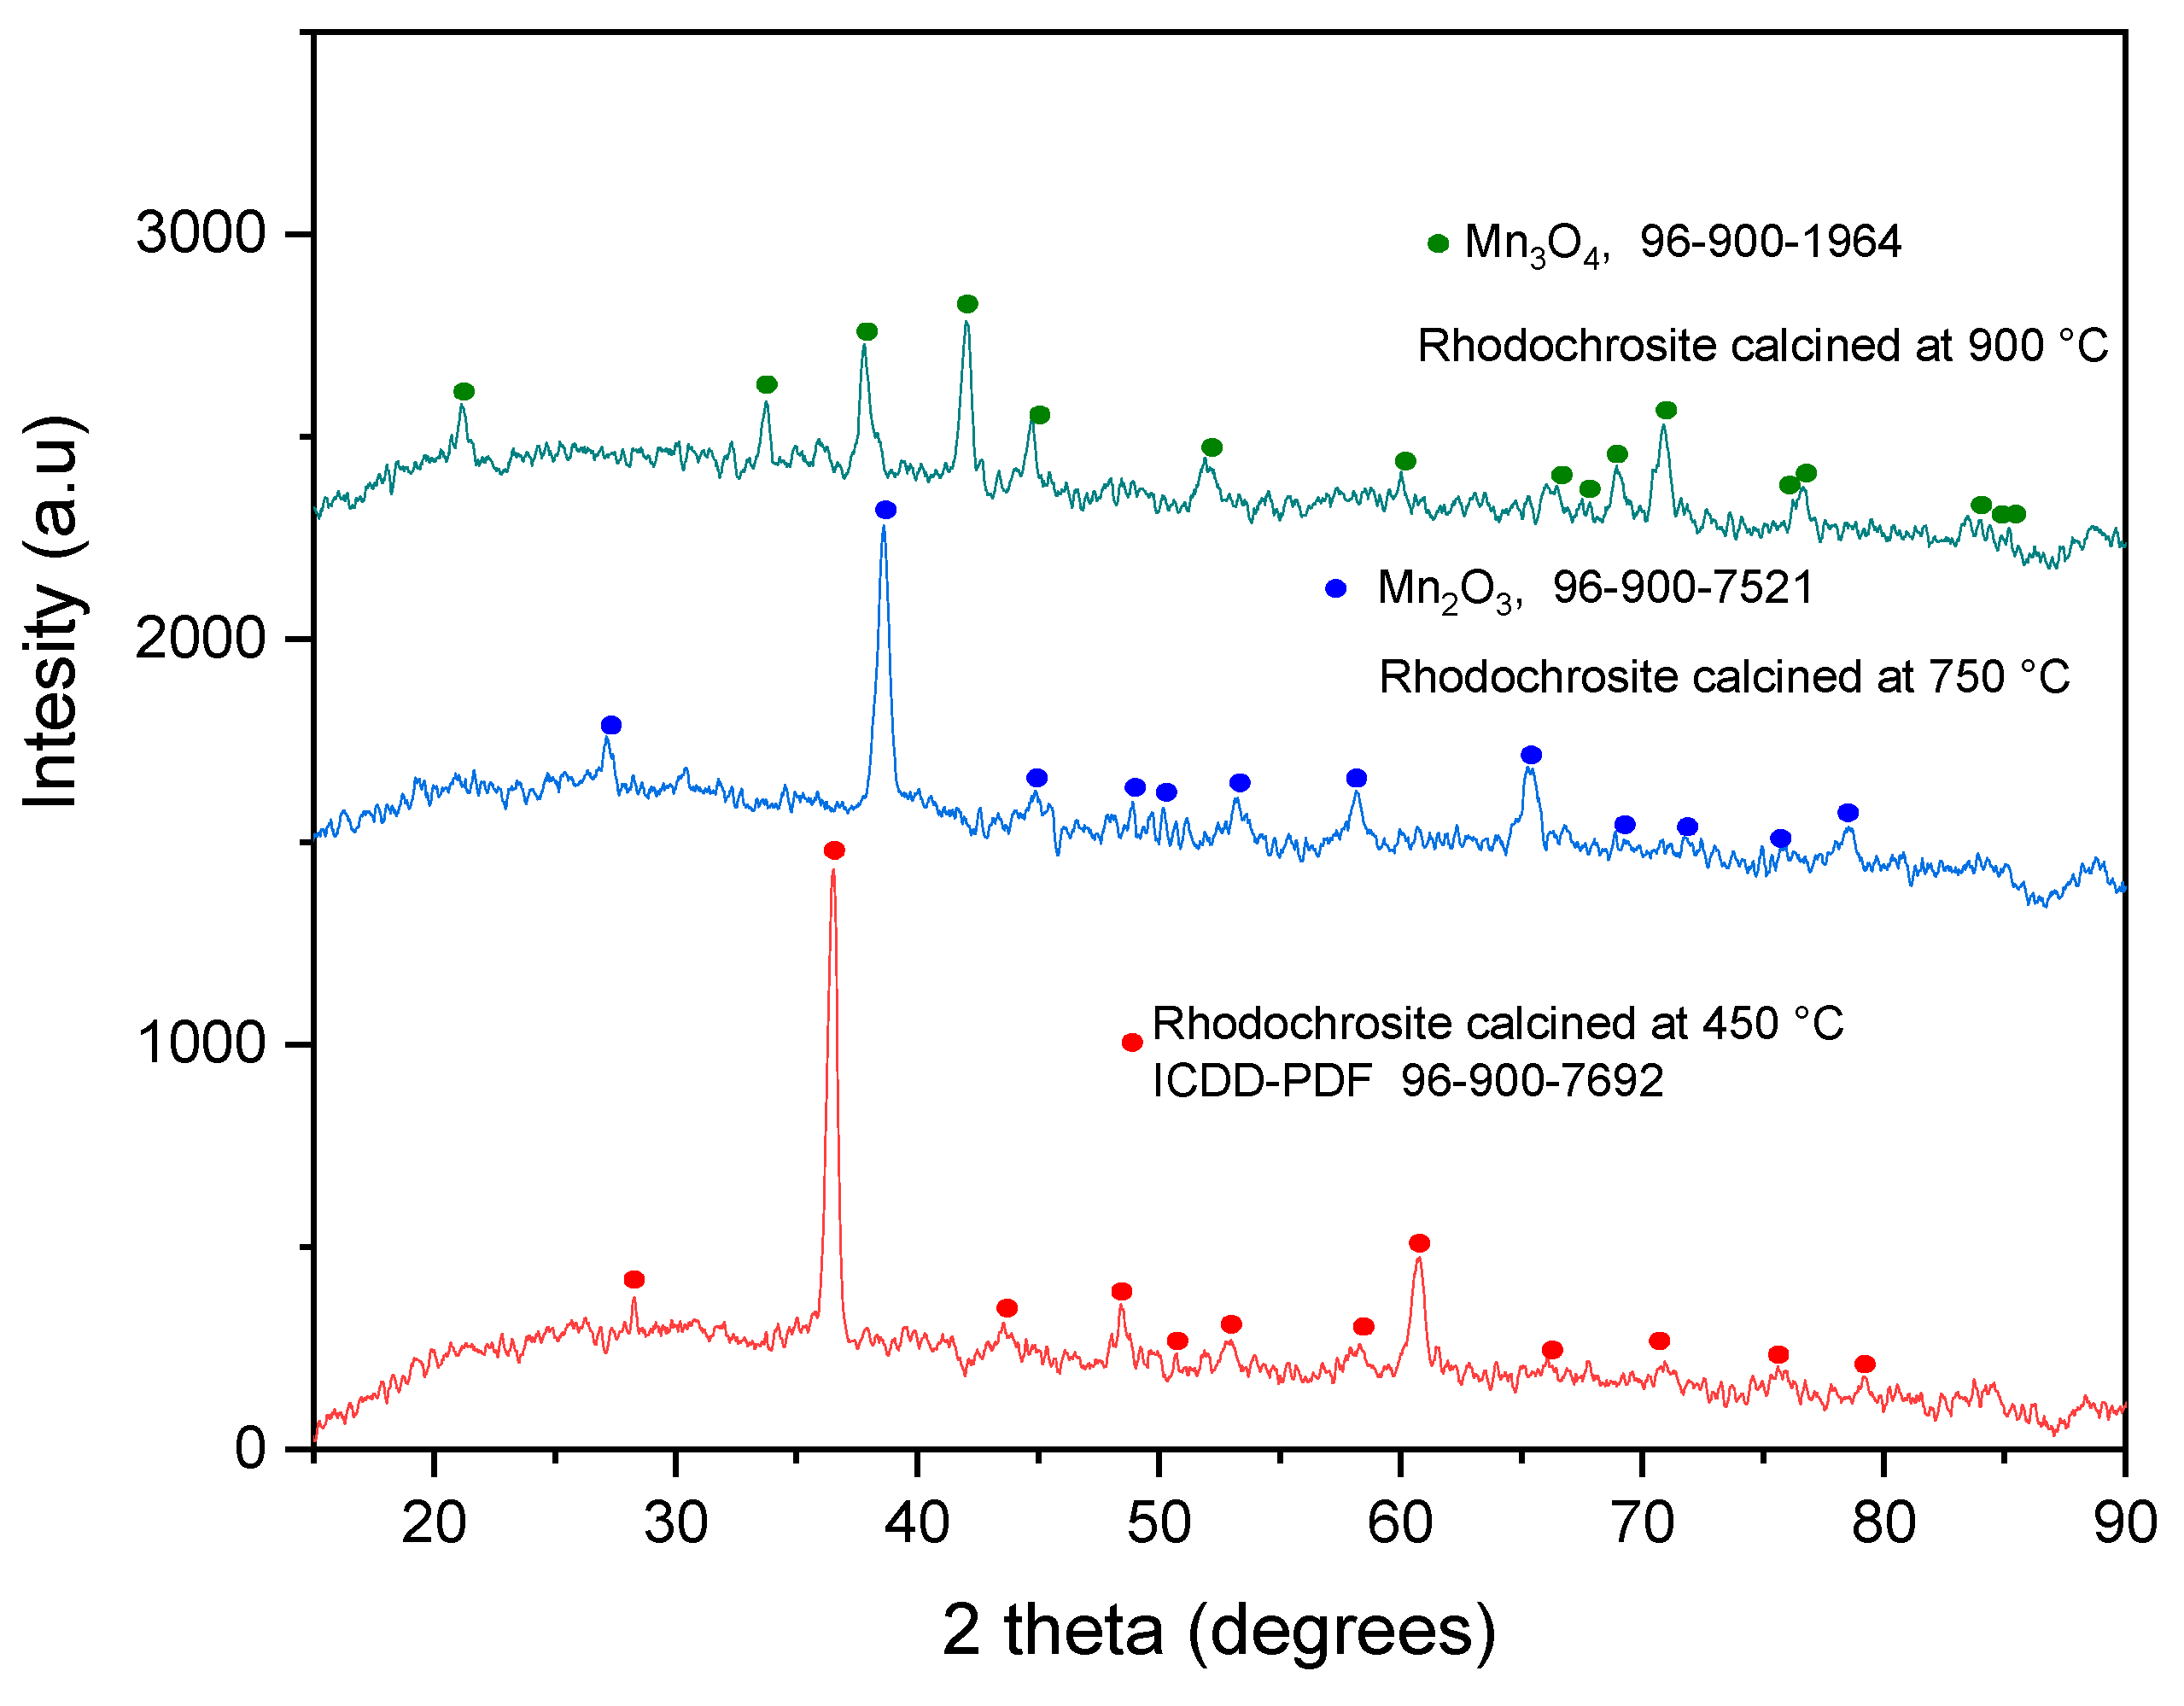
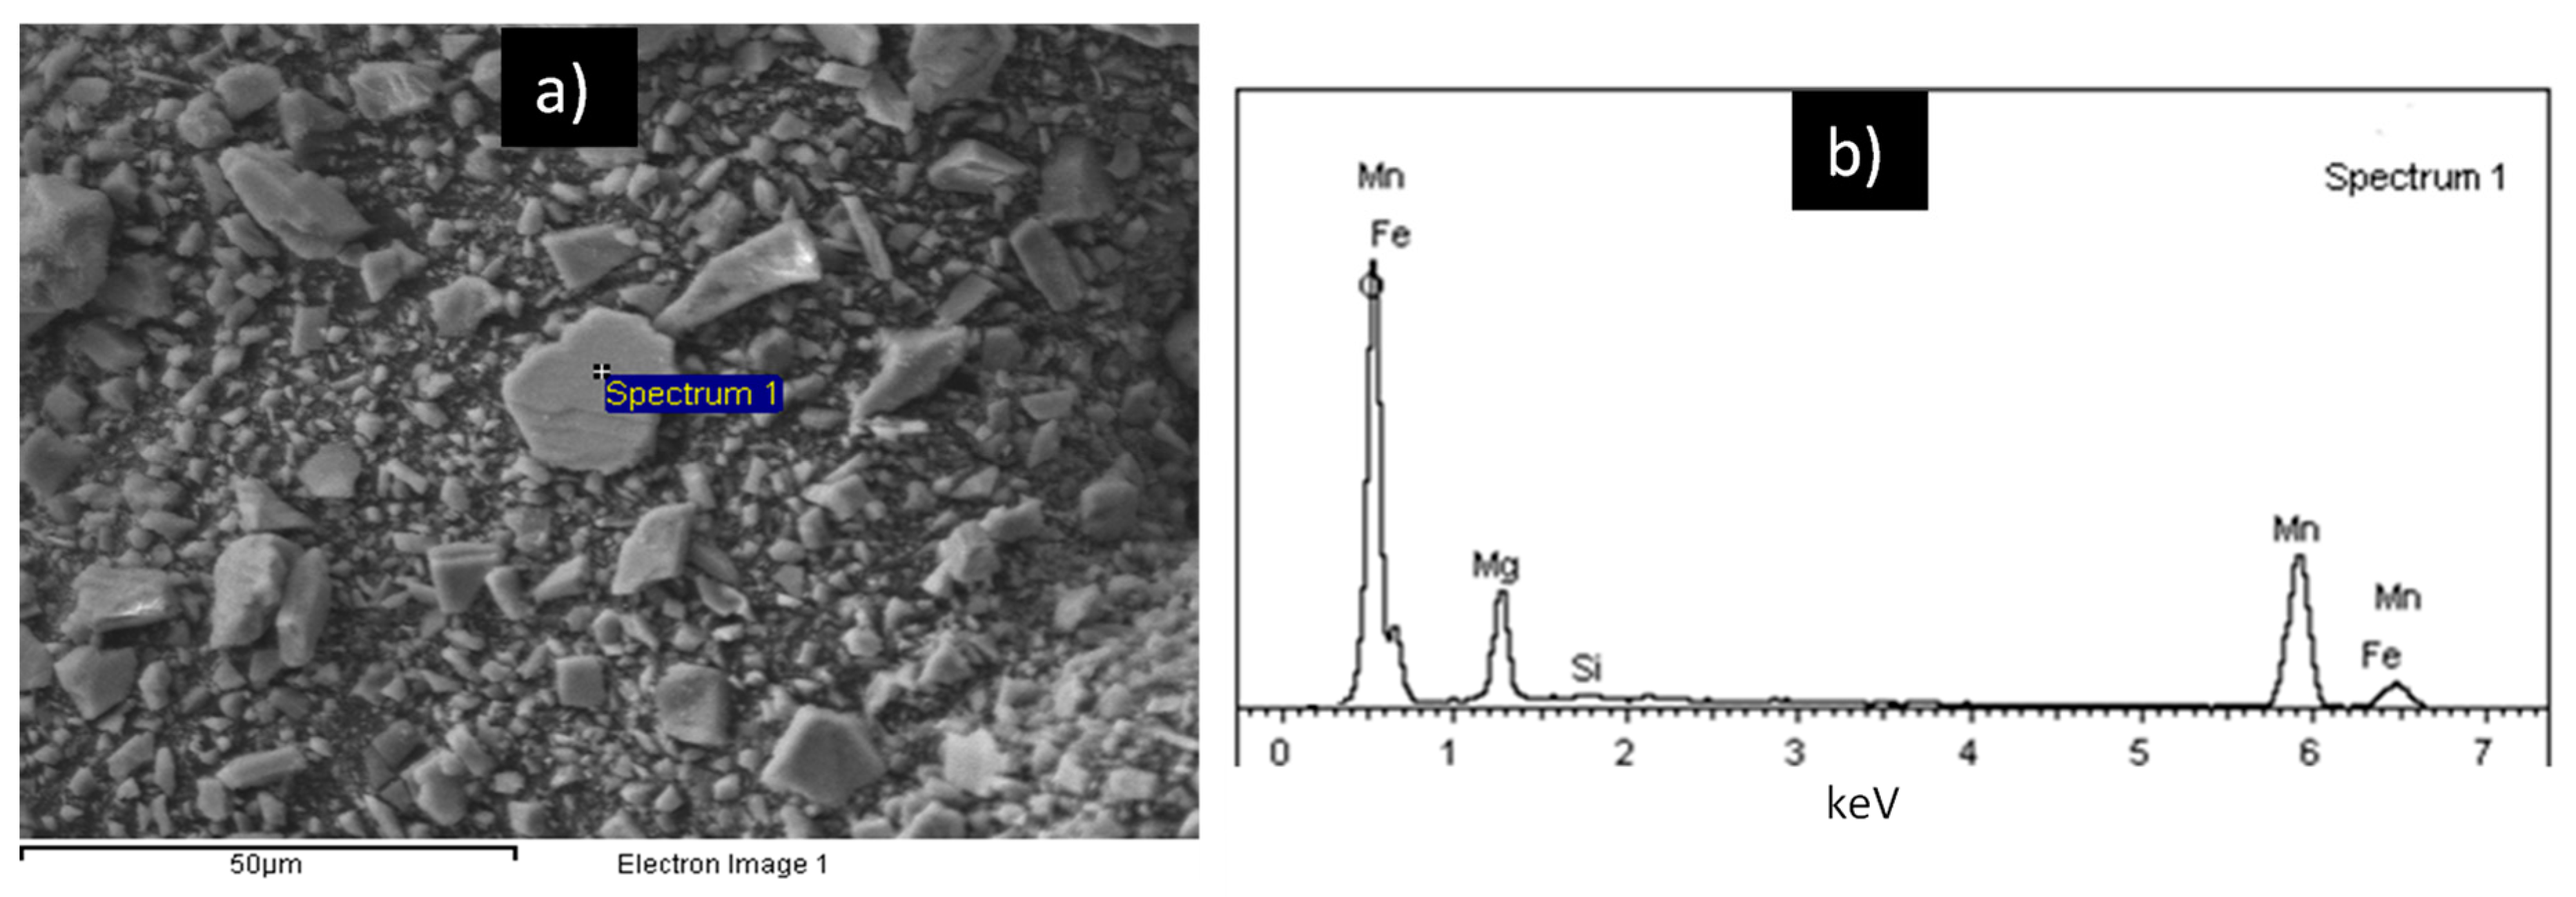
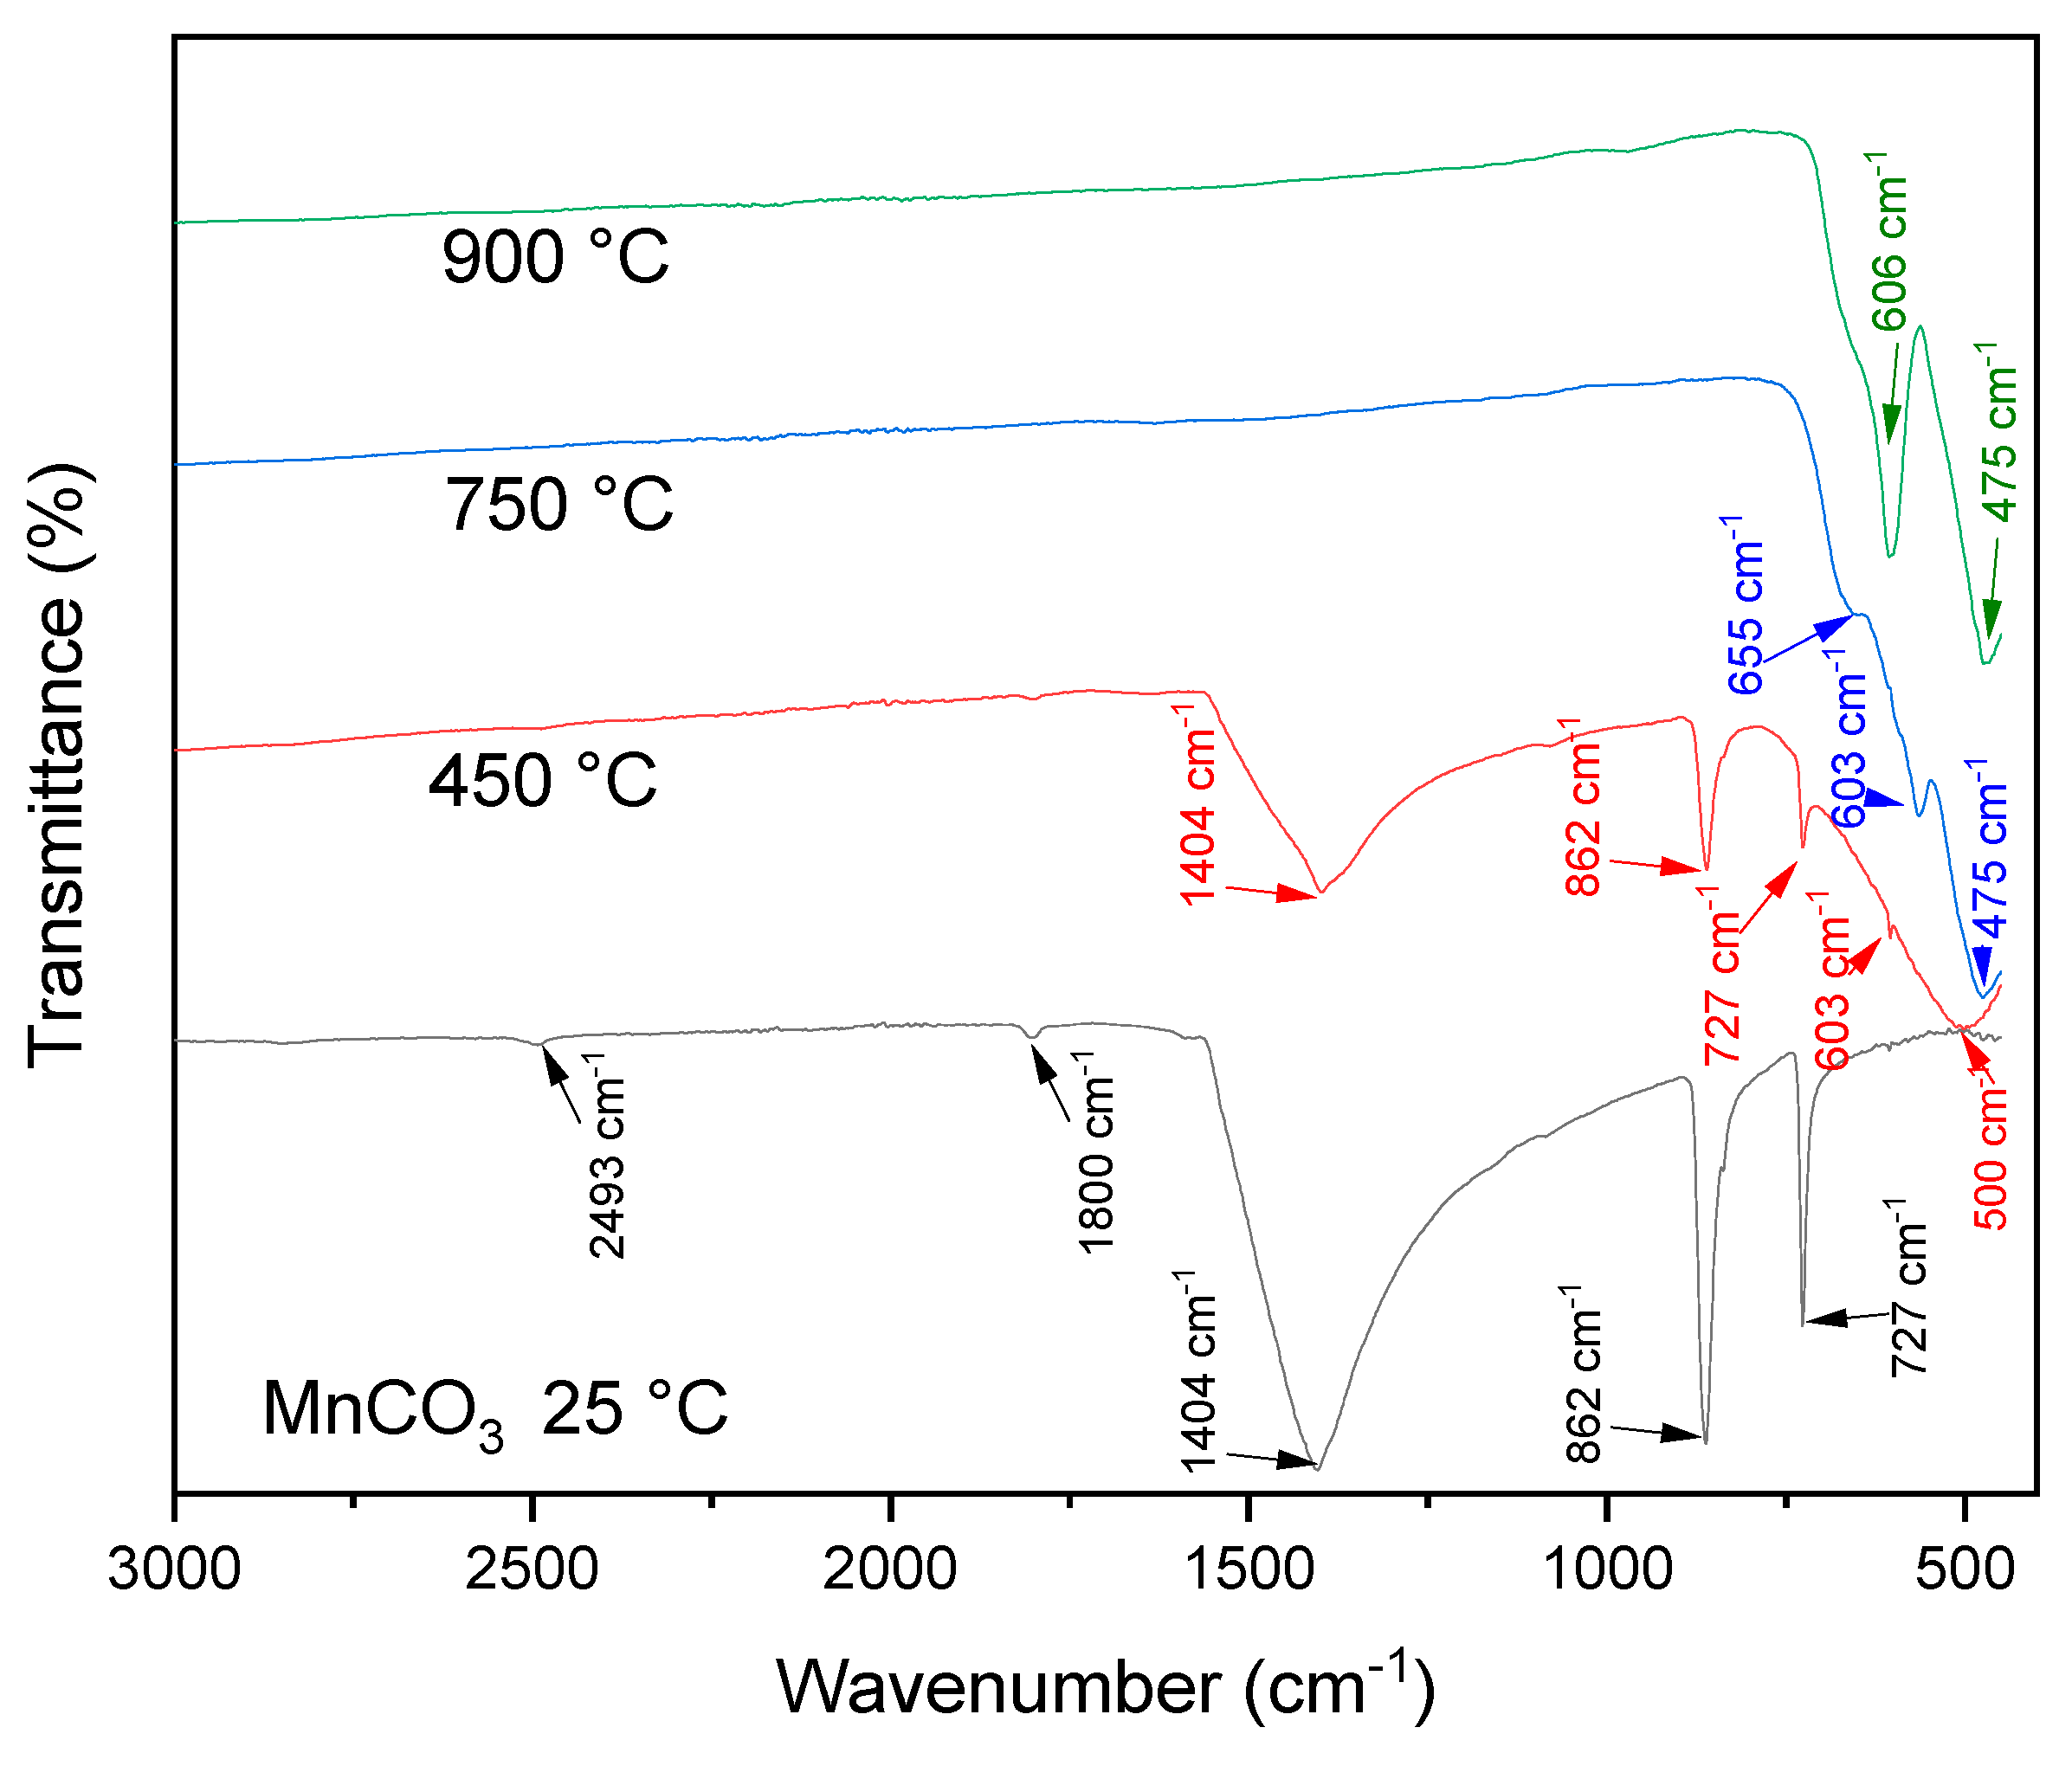
3.1. Sample Characterization
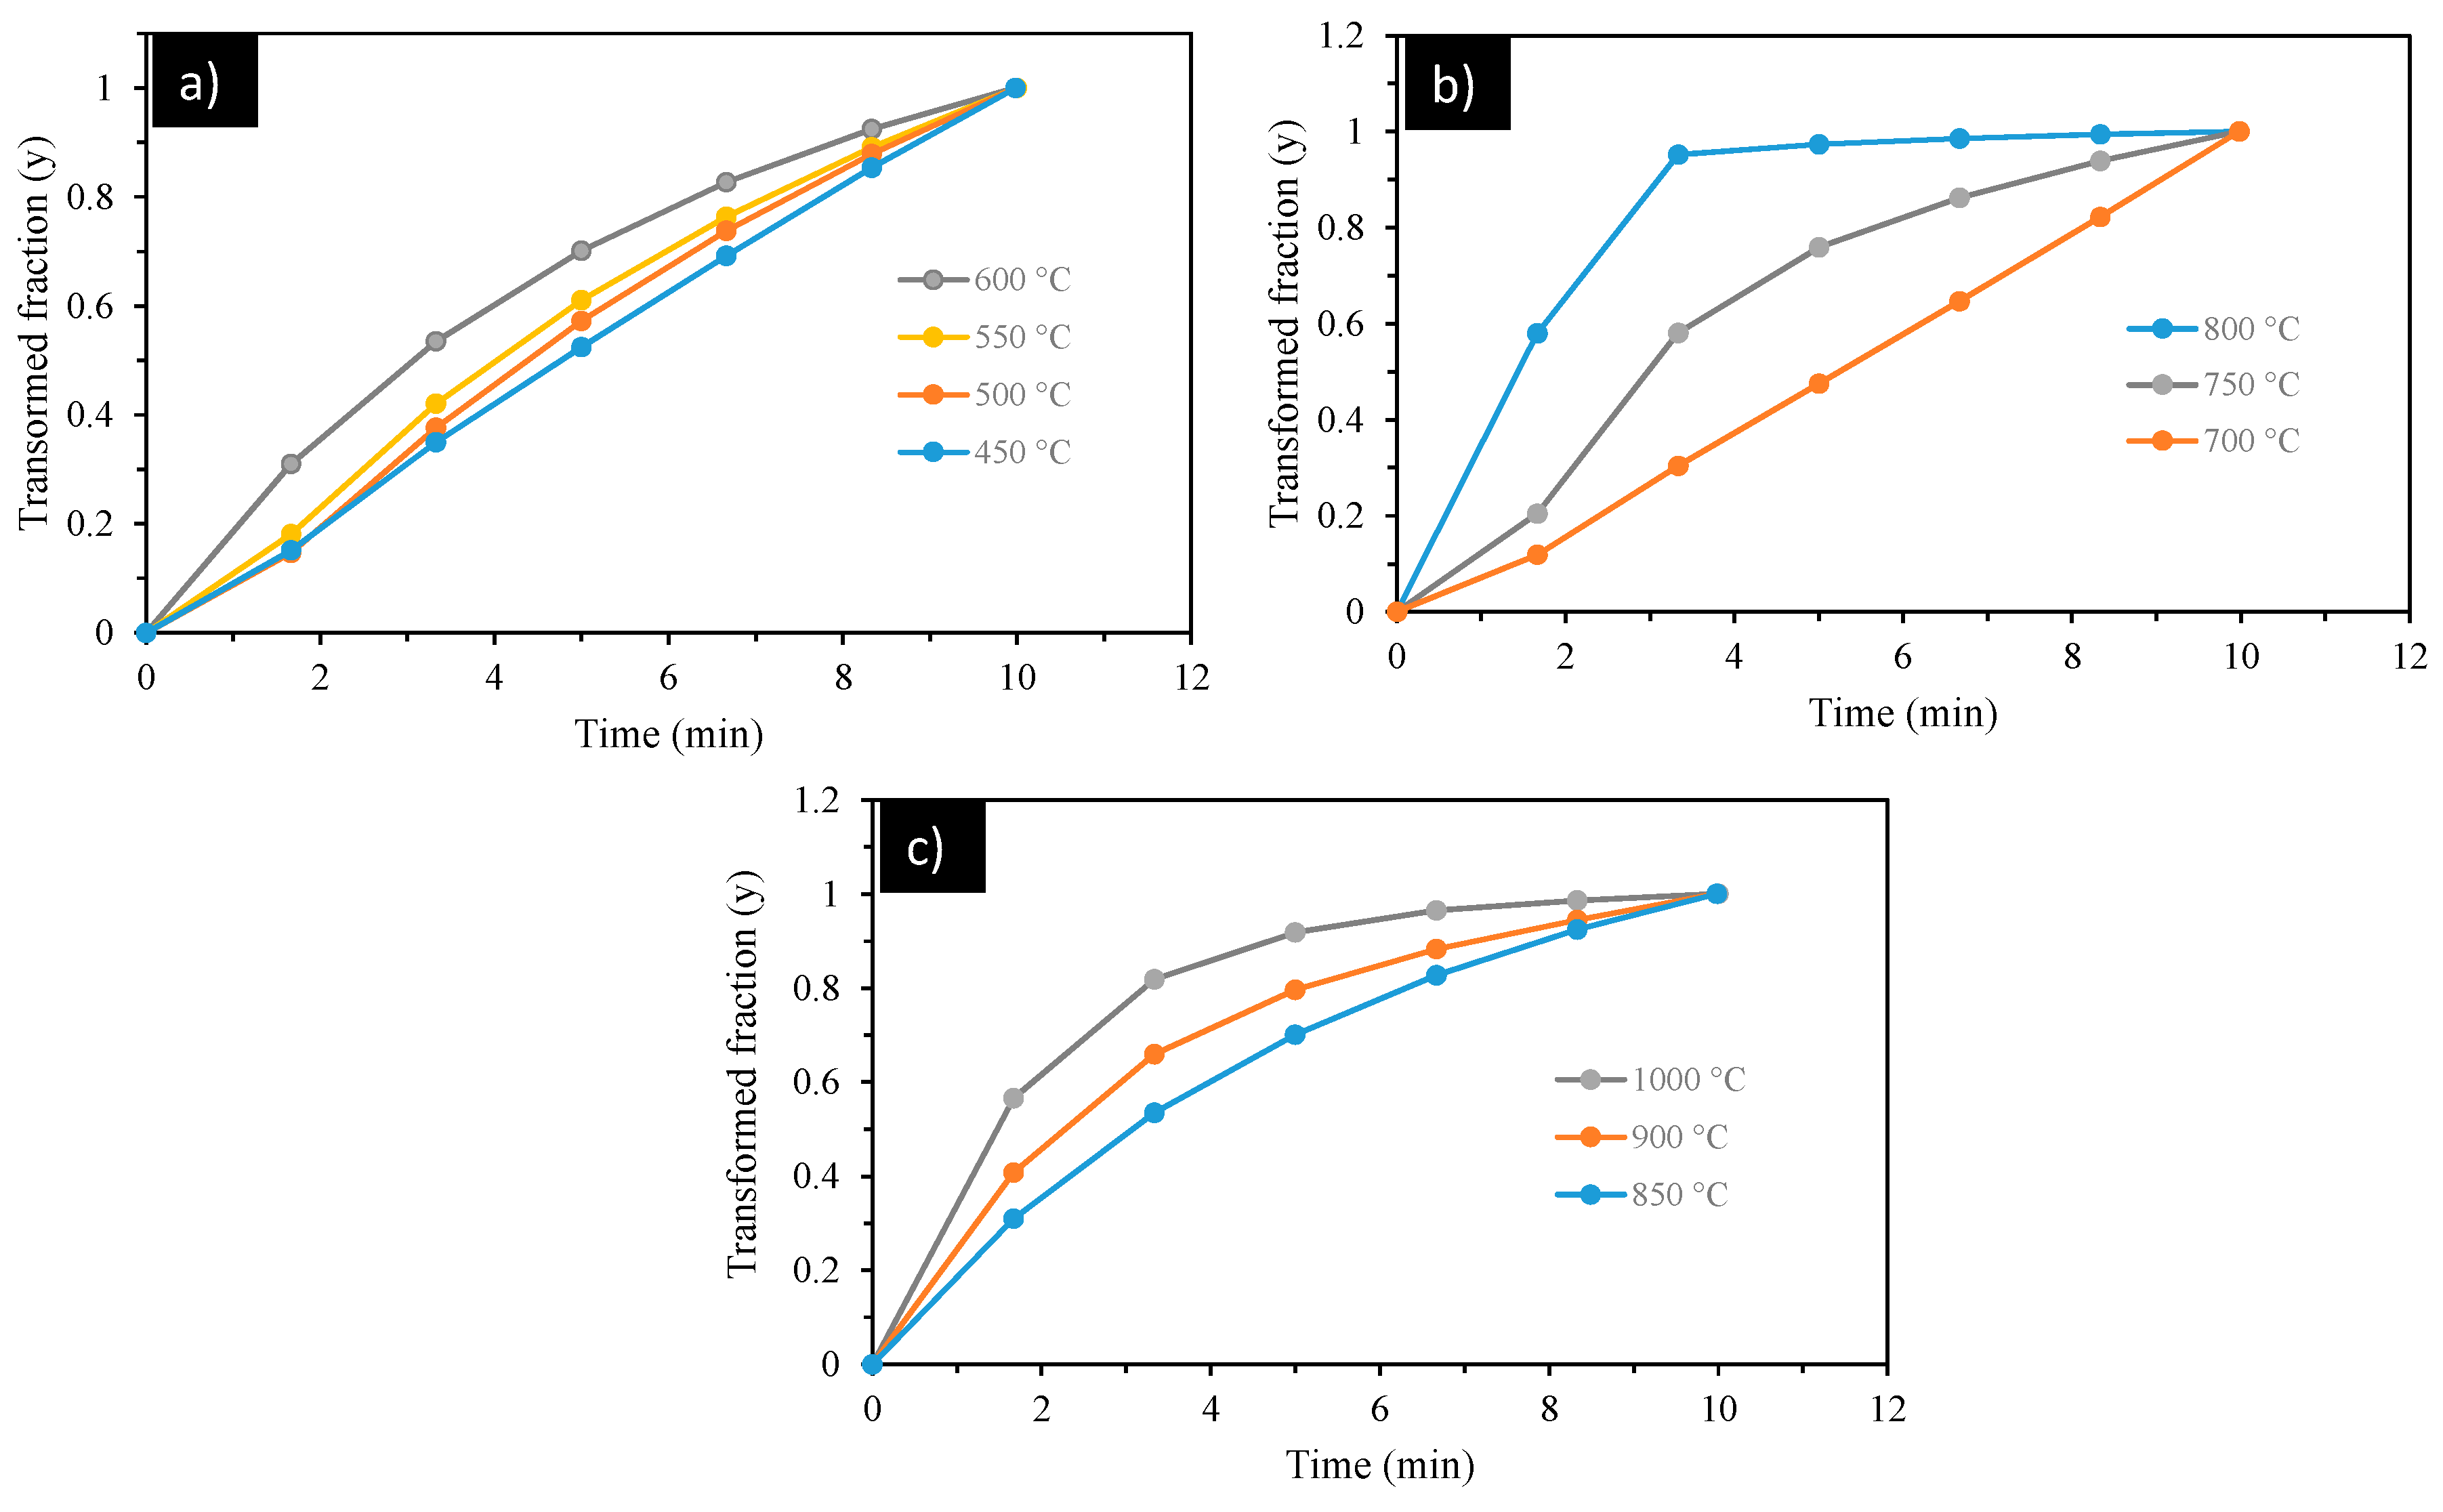
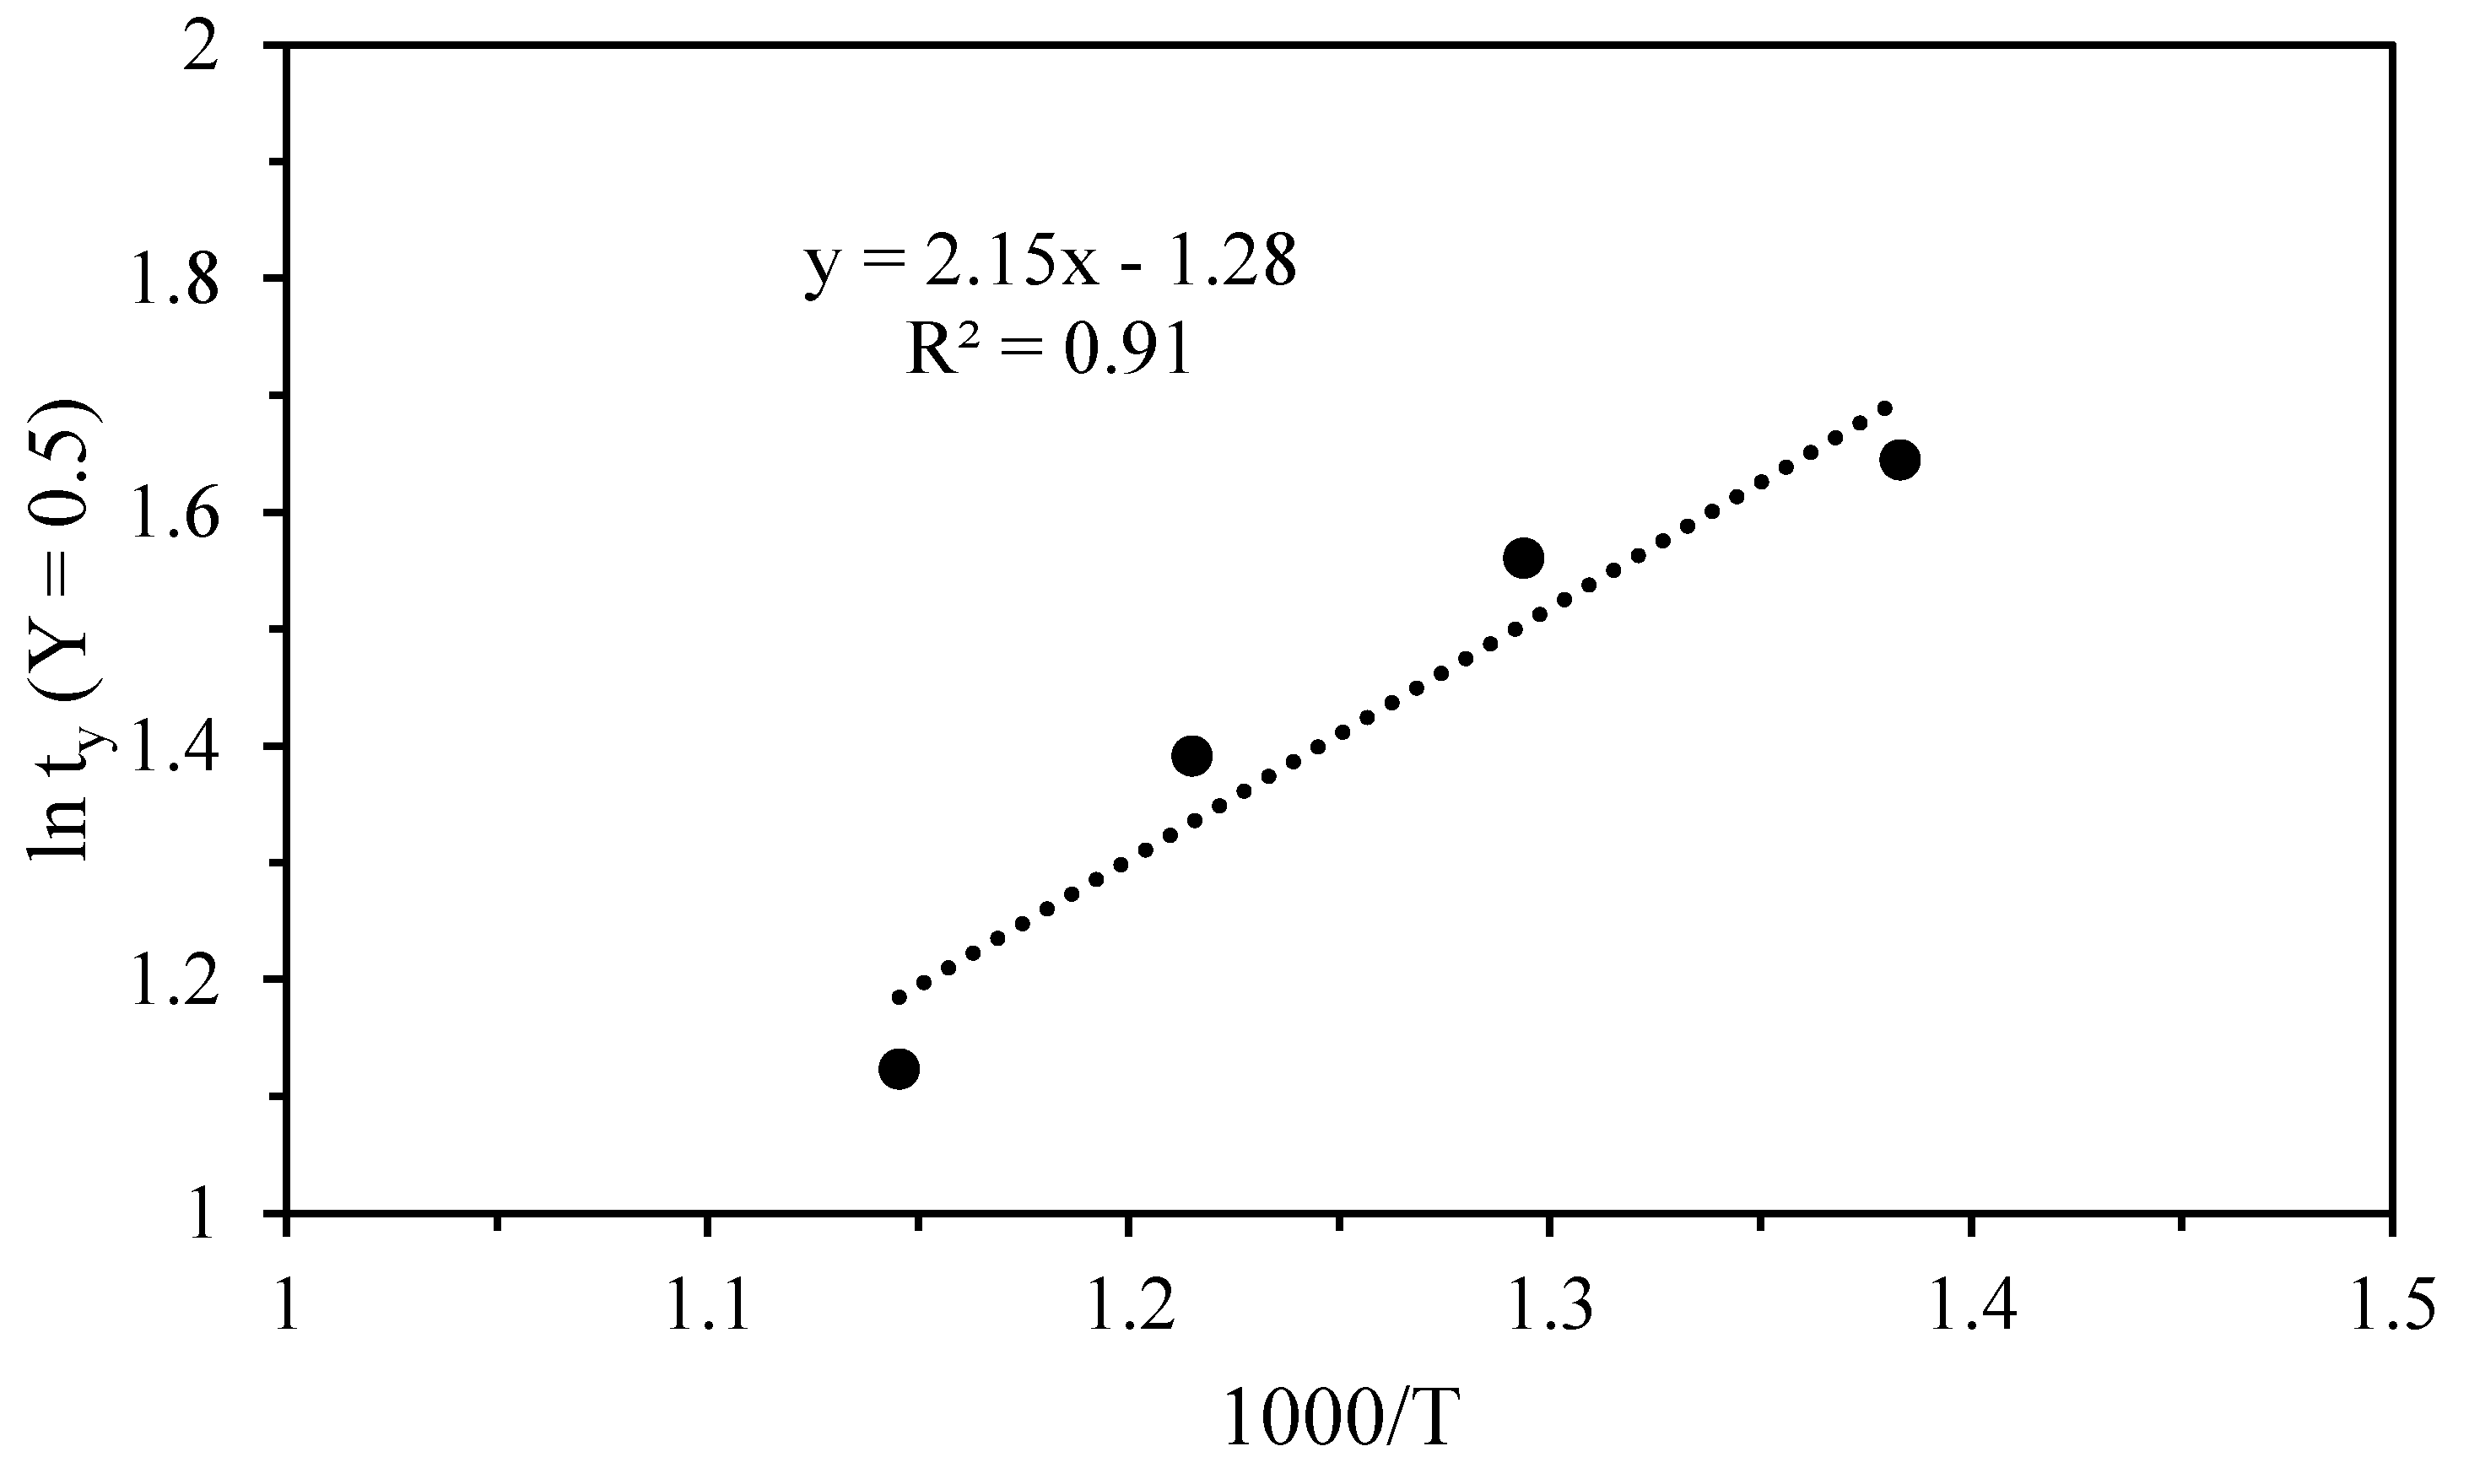
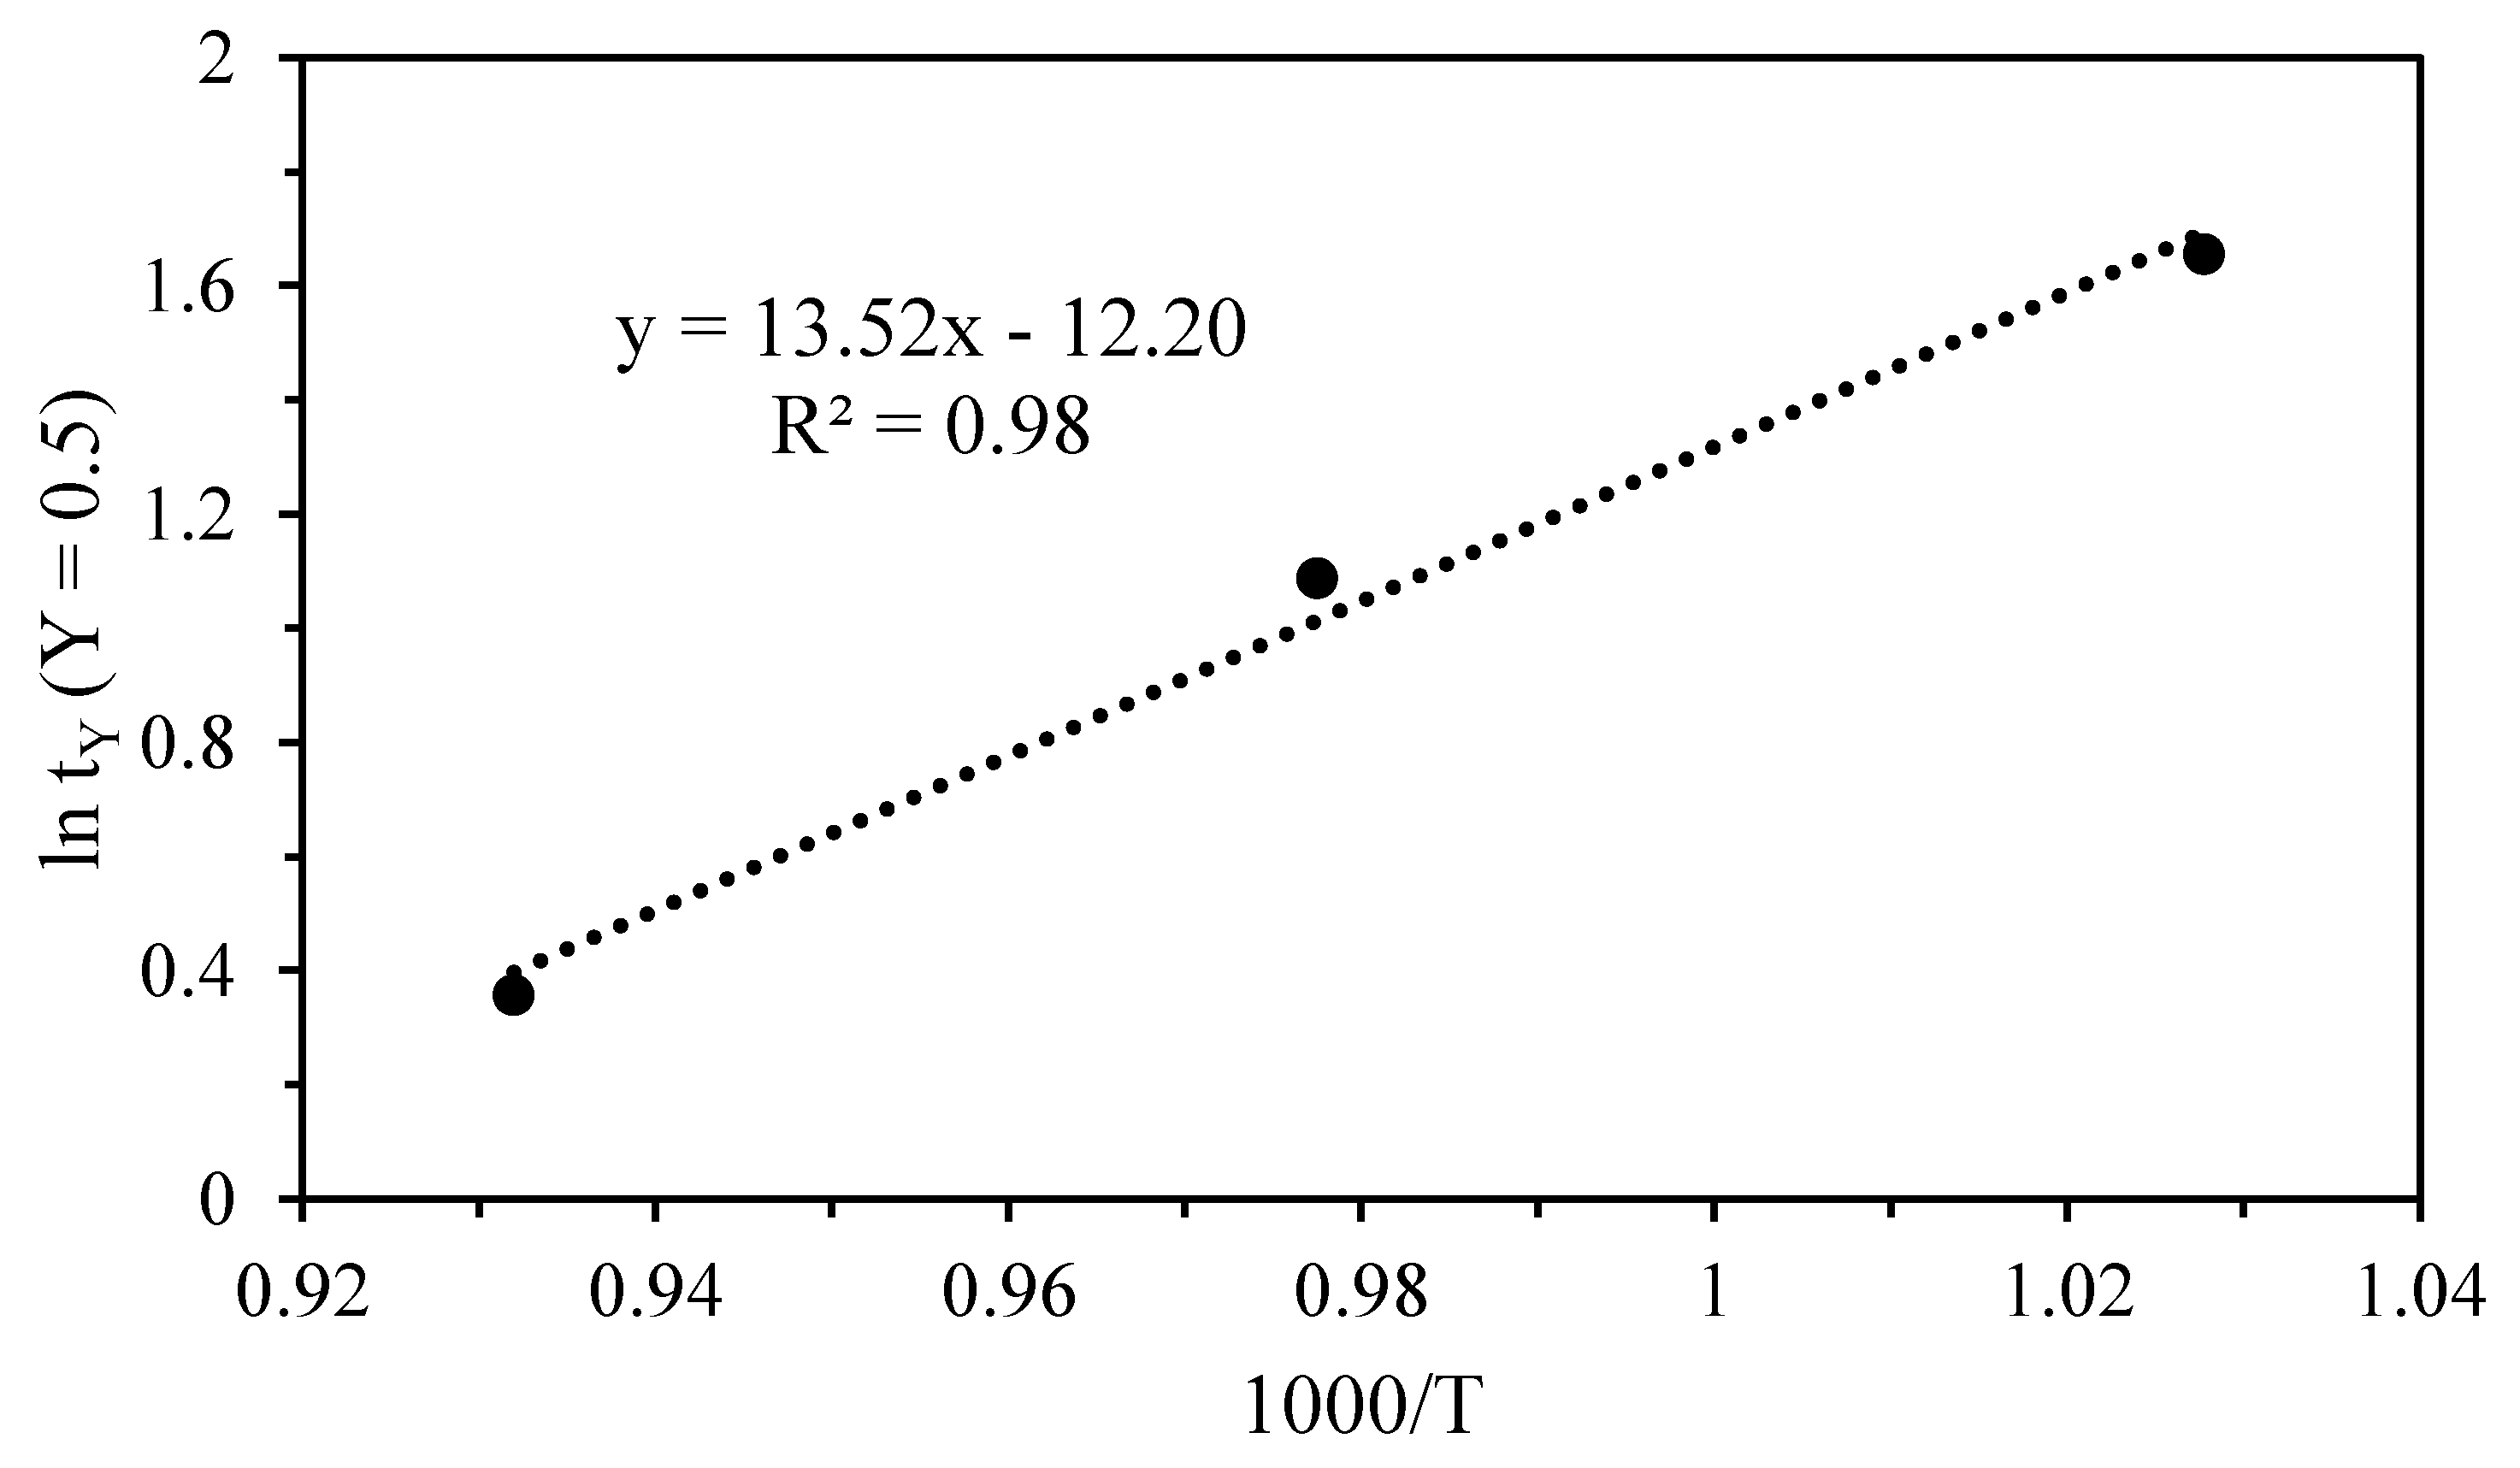
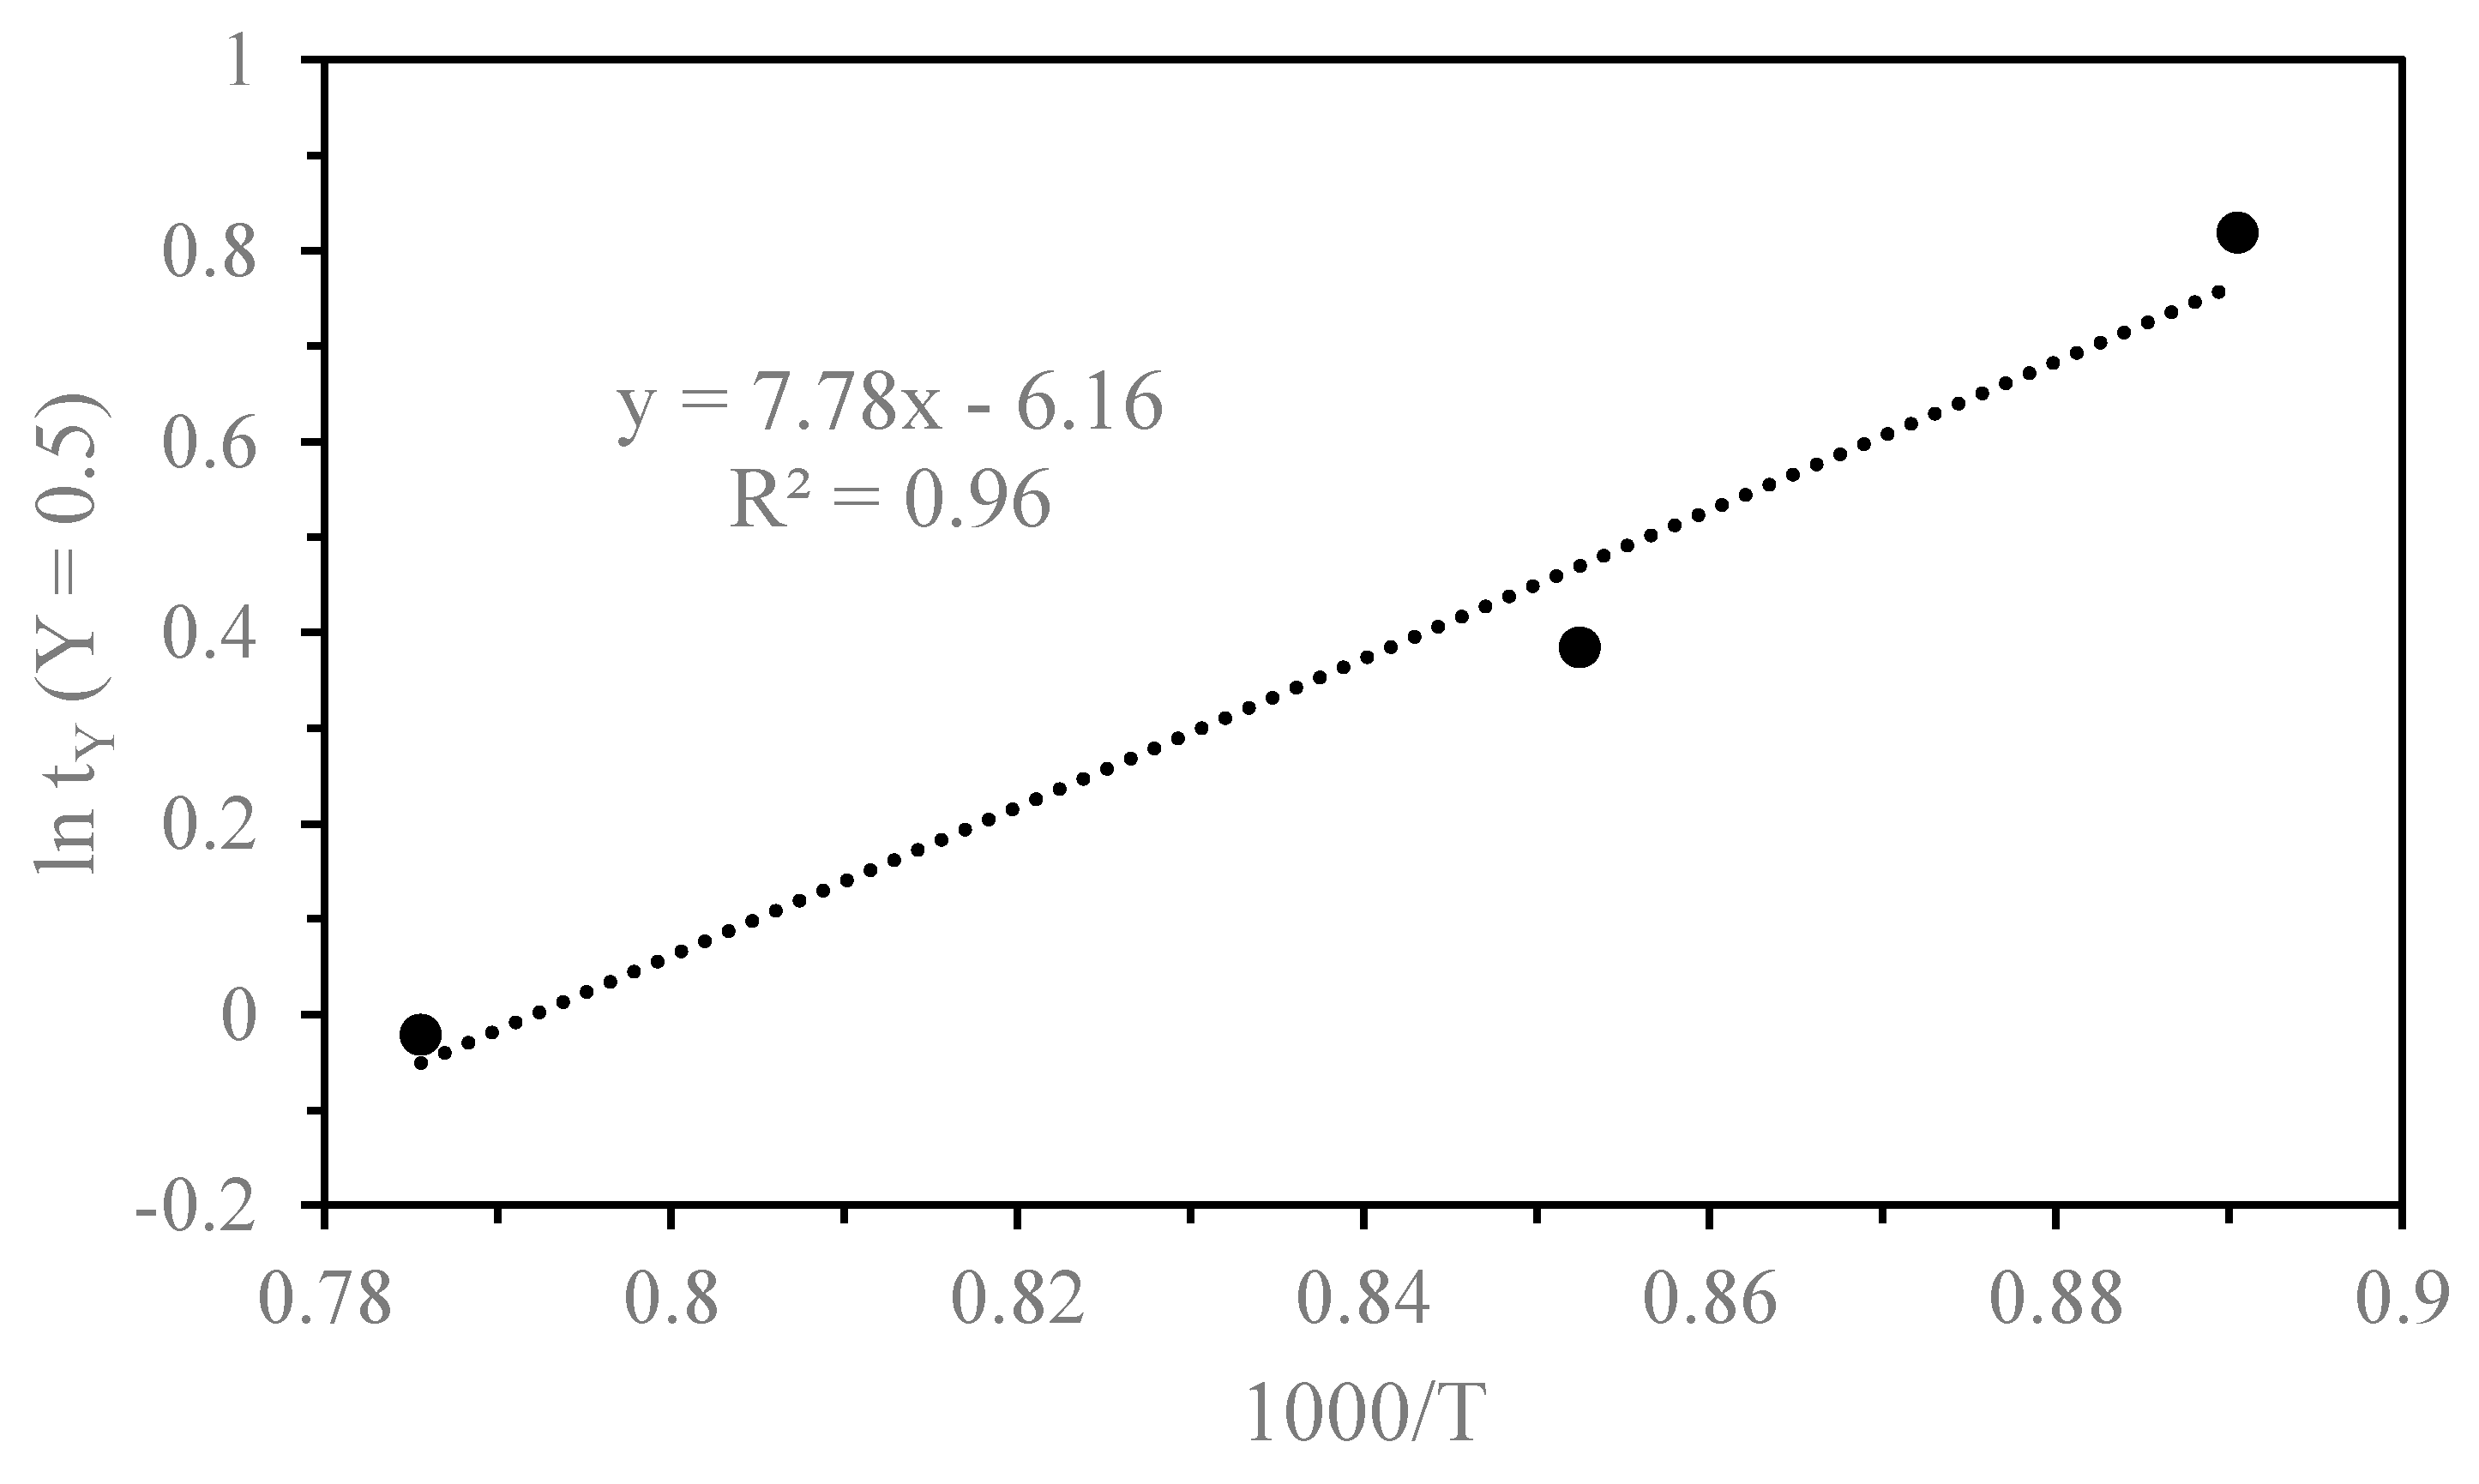
3.2. Kinetics of Thermal Decomposition
4. Conclusions
Author Contributions
Funding
Institutional Review Board Statement
Informed Consent Statement
Data Availability Statement
Conflicts of Interest
References
- Wolfram, O.; Krupp, R.E. Hydrothermal solubility of rhodochrosite, Mn (II) speciation, and equilibrium constants. Geochim. Cosmochim. Acta 1996, 60, 3983–3994. [Google Scholar] [CrossRef]
- Kim, S.T.; Kang, J.O.; Yun, S.T.; O’Neil, J.R.; Mucci, A. Experimental studies of oxygen isotope fractionation between rhodochrosite (MnCO3) and water at low temperatures. Geochim. Cosmochim. Acta 2009, 73, 4400–4408. [Google Scholar] [CrossRef]
- Casaletto, M.P.; Fierro, G. Surprising formation of a rhodochrosite-like (MnCO3) phase on Co-Zn-Mn sintered spinels upon storage at room temperature and ambient air. Appl. Surf. Sci. 2017, 421, 97–108. [Google Scholar] [CrossRef]
- Thackeray, M.M.; Johnson, C.S.; Vaughey, J.T.; Li, N.; Hackney, S.A. Advances in manganese-oxide composite electrodes for lithium-ion batteries. J. Mater. Chem. 2005, 15, 2257–2267. [Google Scholar] [CrossRef]
- Yabuuchi, N.; Kajiyama, M.; Iwatate, J.; Nishikawa, H.; Hitomi, S.; Okuyama, R.; Usui, R.; Yamada, Y.; Komaba, S. P2-type Na(x)[Fe(1/2)Mn(1/2)]O2 made from earth-abundant elements for rechargeable Na batteries. Nat. Mater. 2012, 11, 512–517. [Google Scholar] [CrossRef] [PubMed]
- Venkatesan, T.; Rajeswari, M.; Dong, Z.W.; Ogale, S.B.; Ramesh, R. Manganite-Based Devices: Opportunities, Bottlenecks and Challenges. Philos. Trans. R. Soc. Lond. Ser. A 1998, 356, 1661–1680. [Google Scholar] [CrossRef]
- Edwin Suresh Raj, A.M.; Mallika, C.; Sreedharan, O.M.; Nagaraja, K.S. Manganese oxide–manganese tungstate composite humidity sensors. Mater. Lett. 2002, 53, 316–320. [Google Scholar] [CrossRef]
- Cui, X.; Liu, G.; Lin, Y. Amperometric biosensors based on carbon paste electrodes modified with nanostructured mixed-valence manganese oxides and glucose oxidase. Nanomed. Nanotechnol. 2005, 1, 130–135. [Google Scholar] [CrossRef] [PubMed]
- Kim, K.J.; Park, Y.R. Sol–gel growth and structural and optical investigation of manganese-oxide thin films: Structural transformation by Zn doping. J. Cryst. Growth 2004, 270, 162–167. [Google Scholar] [CrossRef]
- Nakamura, H.; Kohn, K. Magnetoelectric effect of rare earth manganese oxide RMn2O5. Ferroelectrics 1997, 204, 107–114. [Google Scholar] [CrossRef]
- Wang, C.; Guo, G.C.; He, L. Ferroelectricity Driven by the Noncentrosymmetric Magnetic Ordering in Multiferroic TbMn2O5: A First-Principles Study. Phys. Rev. Lett. 2007, 99, 1–4. [Google Scholar] [CrossRef] [PubMed] [Green Version]
- Pereira, M.J.; Lima, M.M.F.; Lima, R.M.F. Calcination and characterization studies of a Brazilian manganese ore tailing. Int. J. Miner. Process. 2014, 131, 26–30. [Google Scholar] [CrossRef] [Green Version]
- Gao, Y.; Olivas-Martinez, M.; Sohn, H.Y.; Kim, H.G.; Kim, C.W. Upgrading of low grade manganese ore by selective reduction of iron oxide and magnetic separation. Metall. Mater. Trans. B 2012, 43, 1465–1475. [Google Scholar] [CrossRef]
- Loofbourow, R.L. Mining Methods and Costs at Granada Gold Mines, Ltd. Rouyn, Quebec; University of Michigan Library: Quebec, QC, Canada, 1933. [Google Scholar]
- Available online: https://www.autlan.com.mx/en/business-units/autlan-manganese/molango-unit/ (accessed on 31 August 2020).
- Kissinger, H.G.; McMurdie, H.F.; Simpson, B.S. Thermal Decomposition of Manganous and Ferrous Carbonates. J. Am. Ceram. Soc. 1955, 24, 168–172. [Google Scholar] [CrossRef]
- Biernacki, L.; Pokrzywnicki, S. The thermal decomposition of manganese carbonate. J. Therm. Anal. Calorim. 1999, 55, 227–232. [Google Scholar] [CrossRef]
- Fazeli, A.R.; Taren, J.; Basavalingu, B.; Bhandage, G.T. Standard thermodynamic data for Rhodochrosite from equilibrium decomposition curve. Proc. Indian Acad. Sci. (Earth Planet. Sci.) 1991, 100, 37–40. [Google Scholar]
- Putnis, A. Introduction to Mineral Sciences; Cambridge University Press: Cambridge, UK, 1992. [Google Scholar]
- Hidalgo, T.; Kuhar, L.; Beinlich, A.; Putnis, A. Kinetics and mineralogical analysis of copper dissolution from a bornite/chalcopyrite composite sample in ferric-chloride and methanesulfonic-acid solutions. Hydrometallurgy 2019, 188, 140–156. [Google Scholar] [CrossRef]
- Jiménez, A.; Prieto, M. Thermal Stability of Ettringite Exposed to Atmosphere: Implications for the Uptake of Harmful Ions by Cement. Environ. Sci. Technol. 2015, 49, 7957–7964. [Google Scholar] [CrossRef] [Green Version]
- Redfern, S.A.T. The kinetics of dehydroxylation of kaolinite. Clay Miner. 1987, 22, 447–456. [Google Scholar] [CrossRef]
- Available online: https://www.netzsch-thermal-analysis.com/en/materials-applications/batteries/manganese-oxide-reduction/ (accessed on 28 August 2020).
- Zhao, Y.; Zhu, G.; Cheng, Z. Thermal analysis and kinetic modeling of manganese oxide ore reduction using biomass straw as reductant. Hydrometallurgy 2010, 105, 96–102. [Google Scholar] [CrossRef]
- Ray, L.F.; Jiří, C.; Godwin, A.A.; Marilla, J.D. Raman spectroscopic study of the uranyl carbonate mineral voglite. J. Raman. Spectrosc. 2008, 39, 374–379. [Google Scholar]
- Zhang, R.H.; Zhao, D.; Huang, M.; Yang, R.J.; Ma, F.X.; Fan, Y.C. Synthesis, crystal structure and photoluminescence properties of a new rare-earth carbonate Na3Eu(CO3)3·6H2O. J. Chil. Chem. Soc. 2017, 62, 3403–3406. [Google Scholar] [CrossRef] [Green Version]
- Grunenwald, A.; Keyser, C.; Sautereau, A.M.; Crubézy, E.; Ludes, B.; Drouet, C. Revisiting carbonate quantification in apatite (bio) minerals: A validated FTIR methodology. J. Archaeol. Sci. 2014, 49, 134–141. [Google Scholar] [CrossRef] [Green Version]
- Hu, H.; Xu, J.Y.; Yang, H.; Liang, J.; Yang, S.; Wu, H. Morphology-controlled hydrothermal synthesis of MnCO3 hierarchical superstructures with Schiff base as stabilizer. Mater. Res. Bull. 2011, 46, 1908–1915. [Google Scholar] [CrossRef]
- Menezes, P.A.; Indra, A.; Bergmann, A.; Chernev, P.; Walter, C.; Dau, H.; Strasser, P.; Driess, M. Uncovering the prominent role of metal ions in octahedral versus tetrahedral sites of cobalt-zinc oxide catalysts for efficient oxidation of water. J. Mater. Chem. 2016, 1, 1–25. [Google Scholar] [CrossRef] [Green Version]
- Ashoka, S.; Chithaiah, P.; Tharamani, C.N.; Chandrappa, G.T. Synthesis and characterisation of microstructural α-Mn2O3 materials. J. Exp. Nanosci. 2010, 5, 285–293. [Google Scholar] [CrossRef]
- Finocchio, E.; Busca, G. Characterization and hydrocarbon oxidation activity of coprecipitated mixed oxides Mn3O4/Al2O3. Catal. Today 2001, 70, 213–225. [Google Scholar] [CrossRef]
- Julien, C.M.; Massot, M.; Poinsignon, C. Lattice vibrations of manganese oxides: Part I. Periodic structures. Spect. Acta A 2004, 60, 689–700. [Google Scholar] [CrossRef]
- Lakshmi, S.V.; Pauline, S.; Vinosel, V.M. Microstructural Characteriztion of Trimanganese Tetra Oxide (Mn3O4) Nanoparticle by Solvothermal Method and Its Dielectric Studies. Int. J. Eng. Sci. Technol. 2014, 3, 123–131. [Google Scholar]
- Ballester, A.; Verdeja, L.F.; Sancho, J. Metalurgia Extractiva, 2nd ed.; Síntesis: Barcelona, Spain, 2000; Volume I. [Google Scholar]
- Levenspiel, O. Ingeniería de las Reacciones Químicas, 2nd ed.; Reverté: Barcelona, Spain, 2002. [Google Scholar]
- Flores, M.U.; Reyes, I.A.; Palacios, E.G.; Patiño, F.; Juárez, J.C.; Reyes, M.; Teja, A.M.; Islas, H.; Gutiérrez, E.J. Kinetic analysis of the thermal decomposition of a synthetic mercury jarosite. Minerals 2019, 9, 200. [Google Scholar] [CrossRef] [Green Version]
- Torrente, M.C.; Galán, M.A. Kinetics of the thermal decomposition of oil shale from Puertollano (Spain). Fuel 2001, 80, 327–334. [Google Scholar] [CrossRef]
- Khachani, M.; Hamidi, A.E.; Kacimi, M.; Halim, M.; Arsalane, S. Kinetic approach of multi-step thermal decomposition processes of iron (III) phosphate dihydrate FePO4·2H2O. Thermochim. Acta 2015, 610, 29–36. [Google Scholar] [CrossRef]
- Ingraham, T.R.; Marier, P. Kinetic studies on the thermal decomposition of calcium carbonate. Can. J. Chem. Eng. 1963, 41, 170–173. [Google Scholar] [CrossRef]
- Kohobhange, S.P.K.; Manoratnea, C.H.; Pitawalab, H.M.T.G.A.; Rajapaksec, R.M.G. Thermal decomposition of calcium carbonate (calcite polymorph) as examined by in-situ high-temperature X-ray powder diffraction. J. Phys. Chem. Solids 2019, 134, 21–28. [Google Scholar]


| Element | wt. % AAS | Compound | wt. % XRF |
|---|---|---|---|
| Mg | 5.21 | MgCO3 | 4.91 |
| Si | without detection | SiO2 | 2.95 |
| Ca | 1.03 | CaCO3 | 0.53 |
| Mn | 87.92 | MnCO3 | 86.89 |
| Fe | 5.79 | FeCO3 | 4.72 |
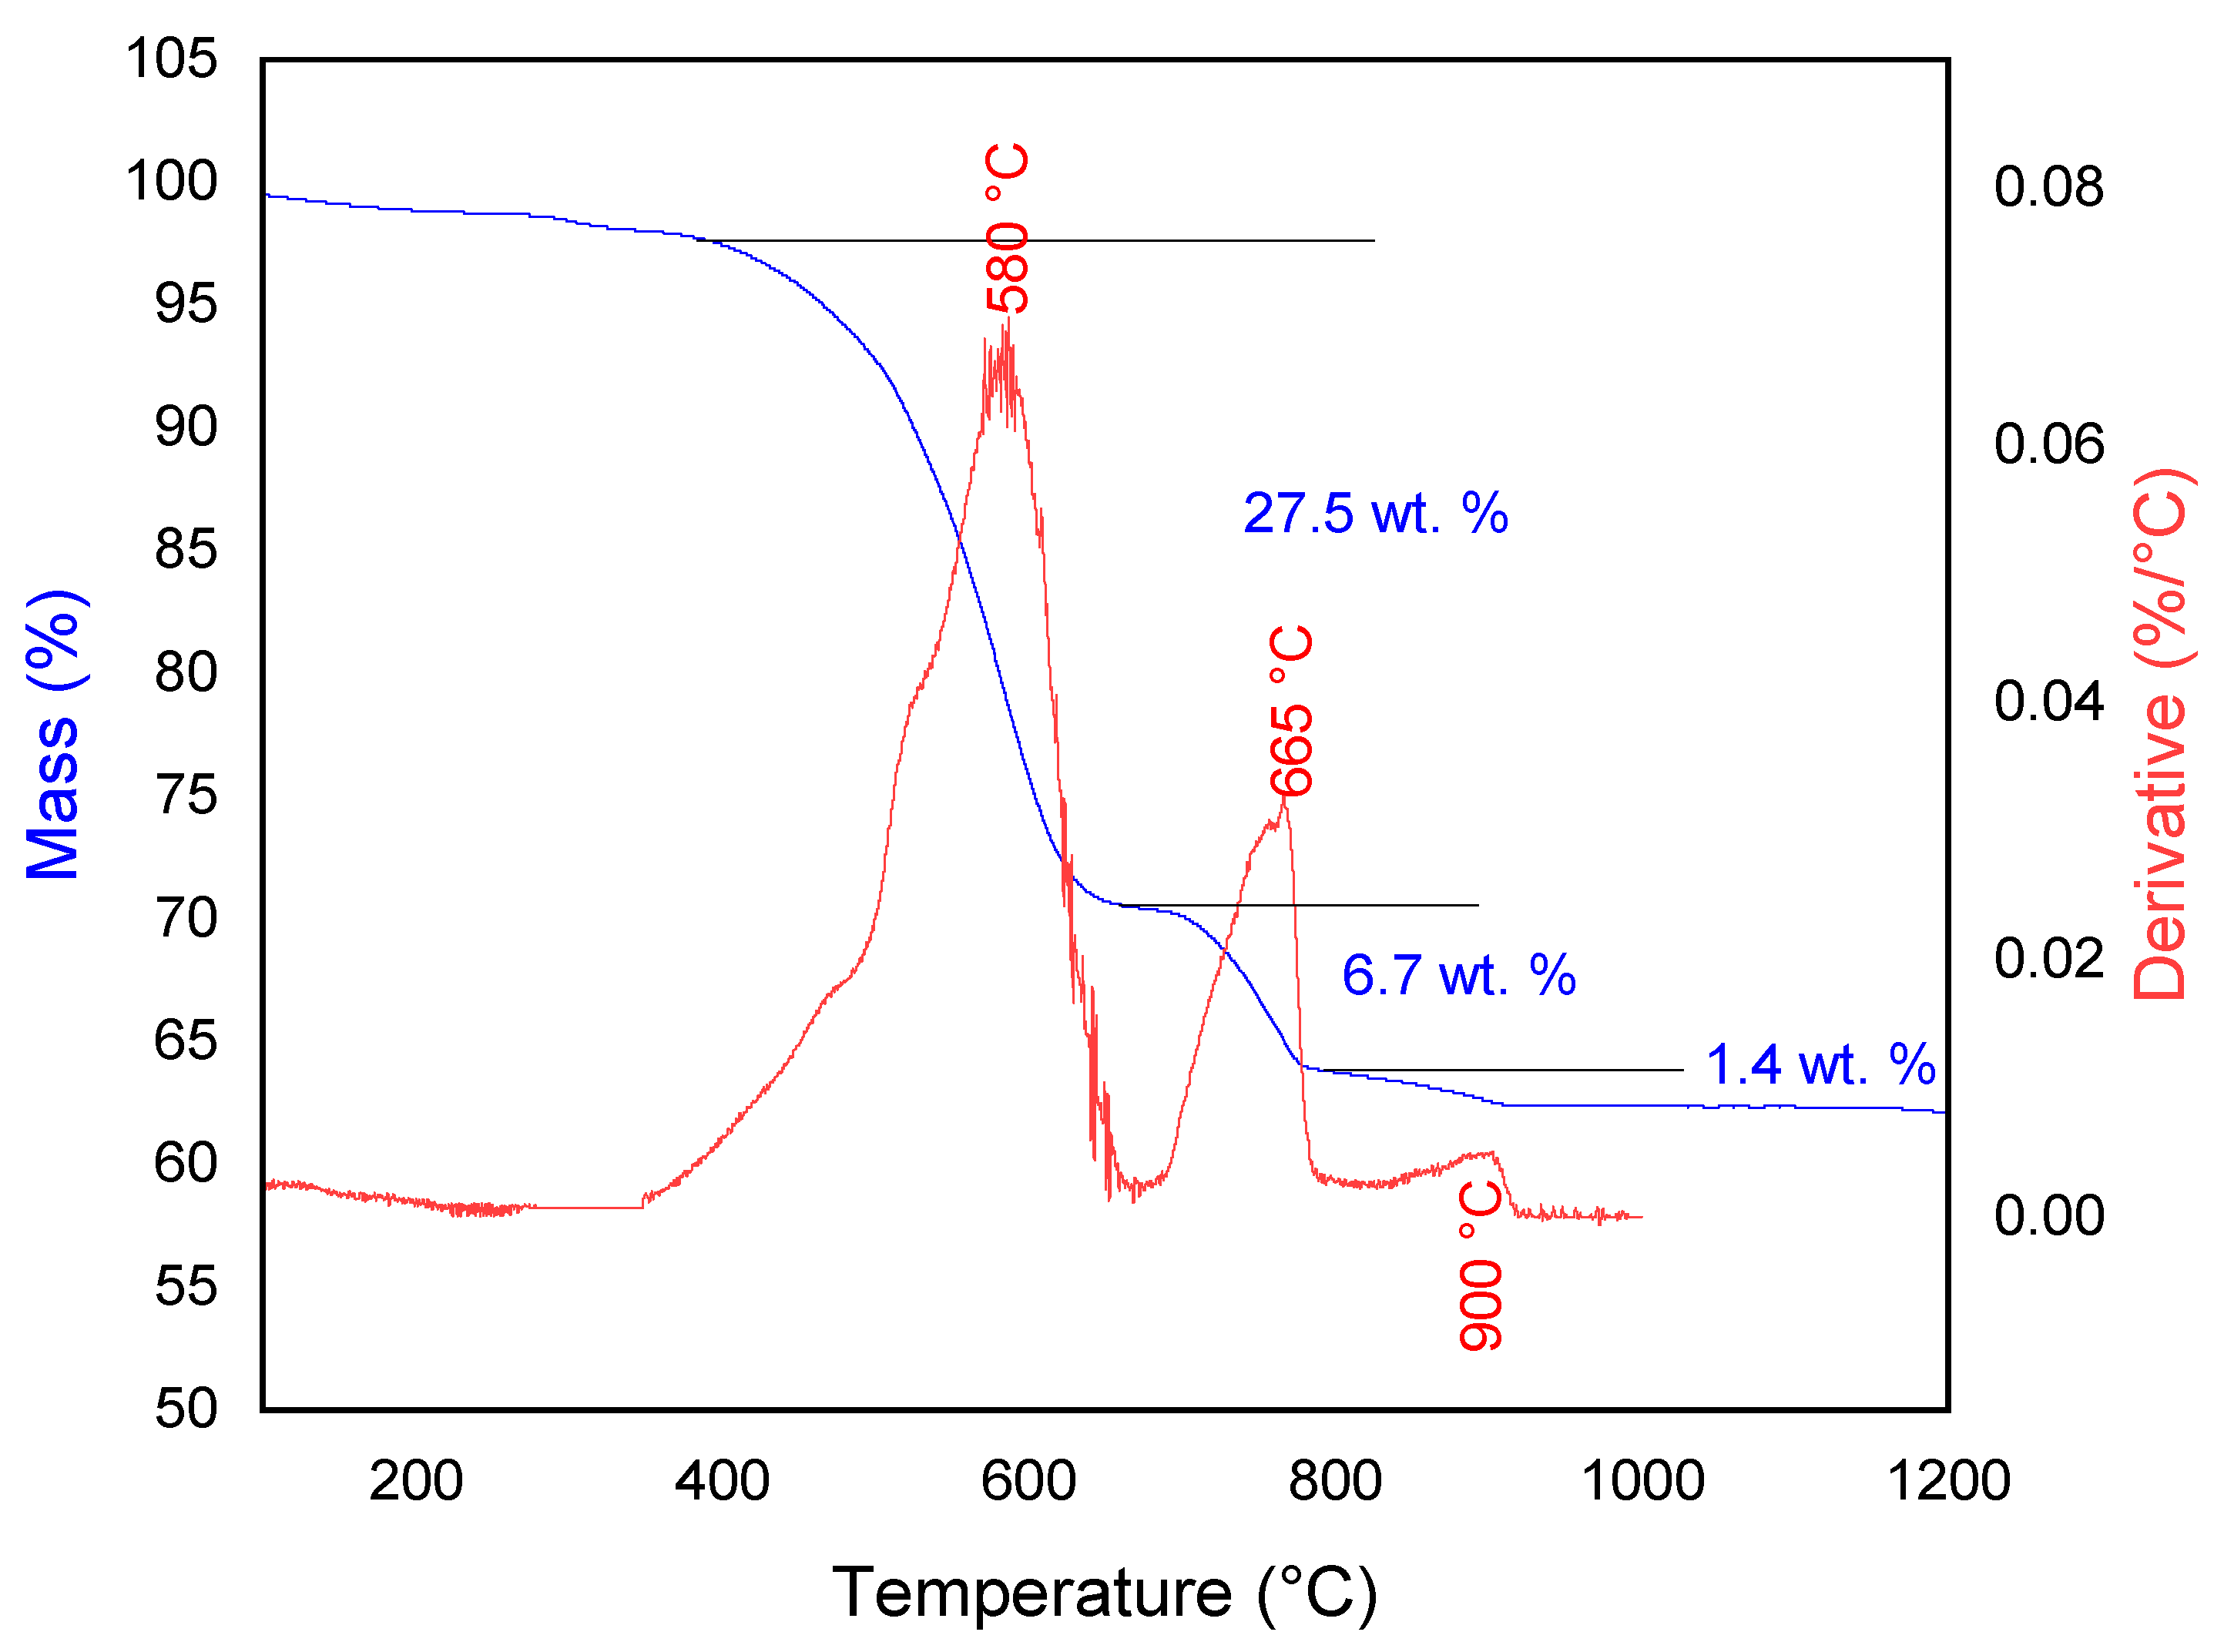
| Stage | T0 | Tf | Reaction |
|---|---|---|---|
| 1 | 350 °C | 660 °C | |
| 2 | 660 °C | 780 °C | |
| 3 | 780 °C | 900 °C |
| Stage | Time to 50%, tY (min) | ln (tY) | Temperature ( °C) | 1000/T (K−1) | Ea |
|---|---|---|---|---|---|
| (kJ∙mol−1) | |||||
| First | 5.181 | 1.644 | 450 | 1.383 | 17.91 |
| 4.766 | 1.561 | 500 | 1.293 | ||
| 4.029 | 1.393 | 550 | 1.215 | ||
| 3.075 | 1.123 | 600 | 1.145 | ||
| Second | 5.240 | 1.656 | 700 | 1.027 | 112.41 |
| 2.976 | 1.089 | 750 | 0.977 | ||
| 1.430 | 0.357 | 800 | 0.931 | ||
| Third | 2.275 | 0.819 | 850 | 0.890 | 64.69 |
| 1.470 | 0.385 | 900 | 0.852 | ||
| 0.982 | −0.020 | 1000 | 0.785 |
Publisher’s Note: MDPI stays neutral with regard to jurisdictional claims in published maps and institutional affiliations. |
© 2020 by the authors. Licensee MDPI, Basel, Switzerland. This article is an open access article distributed under the terms and conditions of the Creative Commons Attribution (CC BY) license (http://creativecommons.org/licenses/by/4.0/).
Share and Cite
Reyes, I.A.; Flores, M.; Palacios, E.G.; Islas, H.; Juárez, J.C.; Reyes, M.; Teja, A.M.; Pérez, C.A. Kinetics of the Thermal Decomposition of Rhodochrosite. Minerals 2021, 11, 34. https://doi.org/10.3390/min11010034
Reyes IA, Flores M, Palacios EG, Islas H, Juárez JC, Reyes M, Teja AM, Pérez CA. Kinetics of the Thermal Decomposition of Rhodochrosite. Minerals. 2021; 11(1):34. https://doi.org/10.3390/min11010034
Chicago/Turabian StyleReyes, Iván A., Mizraim Flores, Elia G. Palacios, Hernán Islas, Julio C. Juárez, Martín Reyes, Aislinn M. Teja, and Cristóbal A. Pérez. 2021. "Kinetics of the Thermal Decomposition of Rhodochrosite" Minerals 11, no. 1: 34. https://doi.org/10.3390/min11010034