Article

Effect of Dodecane-Oleic Acid Collector Mixture on the Evolution of Wetting Film between Air Bubble and Low-Rank Coal

1
National Engineering Research Center of Coal Preparation and Purification, China University of Mining and Technology, Xuzhou 221116, Jiangsu, China
2
School of Chemical Engineering and Technology, China University of Mining and Technology, Xuzhou 221116, Jiangsu, China
*
Author to whom correspondence should be addressed.
Minerals 2021, 11(1), 58; https://doi.org/10.3390/min11010058
Submission received: 13 October 2020 / Revised: 23 December 2020 / Accepted: 7 January 2021 / Published: 10 January 2021
(This article belongs to the Special Issue Flotation Chemistry, Volume II)

Abstract

:
The wetting film evolution process is essential for flotation, especially in bubble–particle attachment. A mixed collector has been proved effective in promoting flotation. In this paper, the effect of a mixed collector (MC) composed by n-dodecane (D) and oleic acid (OA) on wetting film evolution was investigated using the extended Derjagin–Landau–Verwey–Overbeek (EDLVO) theory, the Stefan–Reynolds model, induction time, and zeta potential measurement. The hydrophobic force constant between bubble and coal treated by different collectors was analyzed. The results showed that MC was superior in reducing the induction time and increasing the zeta potential. When bubbles interacted with coal treated by MC, they had relatively low interaction energy, high critical film thickness, and high drainage rate. The order of hydrophobic force constant was no reagent < D < OA < MC. It indicated that the hydrophobic interaction between bubbles and coal particles treated by MC was the strongest because of the synergistic effect of D and OA.

1. Introduction

Wetting film, i.e., thin liquid film, is a common phenomenon in nature, which often occurs when air bubbles and solid particles approach each other in a fluid medium. The evolution of wetting film experiences the process of drainage, thinning, and rupture. Then, the three-phase contact line will form, expand, and relax, and the attachment occurs [1]. Froth flotation is a separation process based on the hydrophobicity difference between minerals. The hydrophobic particles will adhere to bubbles and rise, while the hydrophilic ones will remain in the pulp. The bubble–particle attachment that is dominated by the evolution of wetting film is a prerequisite for flotation [2]. Therefore, the evolution of wetting film between air bubble and particle is closely related to flotation efficiency.
The wetting film between hydrophilic surfaces is stable, and it will reach equilibrium thickness during the drainage process. However, the wetting film between hydrophobic surfaces is unstable, and it will drain faster and rupture spontaneously after reaching the critical thickness [3,4]. Scholars have done much research on the interface chemical properties and related theories of wetting film. Xie et al. studied the factors that influence the wetting film evolution, and discussed the bubble–monolayer interaction, bubble–polymer interaction, and bubble–superhydrophobic surface interaction [5]. They further investigated the influence of salt concentration and depressants on bubble–molybdenite interaction, and found the high salt concentration reduced the repulsive interaction and the polymer depressant weakened the hydrophobic interaction [6]. Huang et al. [3] studied the dynamics of hydrophobic solid surface interacting with the oil droplets in water. Wang et al. [7] discussed the effect of gas enrichment on wetting film, and they found that a gassed system had faster coalescence due to the strong surface force. Besides, there are multiple theories trying to interpret the mechanism of the film evolution. The Derjagin–Landau–Verwey–Overbeek (DLVO) theory was introduced to explain the aggregation and dispersion behavior of colloidal particles [2]. Many scholars have used the extended DLVO (EDLVO) theory to calculate the bubble–particle interaction and particle–particle interaction [4]. Yoon et al. [8] applied the EDLVO theory to define the total interaction energy between air bubbles and particles. The Stokes–Reynolds–Young–Laplace model [9] can well simulate the film thinning process between bubble and solid surface. The Reynolds lubrication theory [3] and Stefan–Reynolds models [10] were used to describe the dynamics of the film drainage process. In the film drainage process, the disjoining pressure determined by Derjaguin and Kussakov [11] was considered the reason for driving the wetting film evolution.
Recently, the effect of surfactant on the wetting film evolution has attracted the attention of some researchers [12,13,14,15,16]. The addition of a surfactant or collector in the flotation system is essential. Collectors in coal flotation are usually hydrocarbon oils, such as kerosene or diesel oil. The adsorption of hydrocarbon oils on the nonpolar region increased the hydrophobicity of coal surface [17], which enhanced the hydrophobic interaction between bubble and coal particles, and accelerated the evolution of wetting film. However, the low-rank coal was rich in oxygen functional groups, which caused the formation of hydration film [18], low surface hydrophobicity, and inefficient reagent adsorption [15]. So, the common oily collectors were not effective in low-rank coal flotation [19]. To solve this problem, mixed collectors or compound reagents have been widely used to improve flotation performance. It was demonstrated that the addition of ionic or nonionic surfactant can enhance the hydrocarbon oil adsorption and increase the hydrophobicity of low-rank coal [20,21,22]. Jena et al. [23] conducted low coal flotation using waste black oil as a collector, which contained a mixture of different oxygen-containing groups. The results showed that waste black oil was more effective than a conventional collector. Sis et al. [24,25] compared the effect of kerosene, pine oil, and tall oil on low-rank coal flotation. They found tall oil was the most effective because it contained more than 40% oleic acid, which can interact with oxygen groups on low-rank coal surface. Xia et al. [26] used the mixture of dodecane and 4-dodecylphenol (DDP) as a collector, and it was indicated that the lignite flotation index of the mixture was better than that of dodecane and DDP alone. Erol et al. [27] studied coal flotation performance by using the mixture of Triton x-100 or Brij-35 with MIBC (Methyl isobutylcarbinol) in various ratios as a collector. The combustible matter recovery was greatly increased by using a mixture of Brij-35 and MIBC. In summary, the researches of mixed collectors in coal flotation were mainly focused on reagent types, adsorption [26], dispersion [28], or molecular structure [18], but there are few studies on the aspect of wetting film evolution between bubble and coal particle.
In this paper, the effect of a mixed collector (MC) composed of n-dodecane (D) and oleic acid (OA) on the wetting film evolution between air bubble and low-rank coal was investigated. XPS measurement was used to analyze the composition of low-rank coal surface. The induction time and zeta potential of the coal particles treated by different collectors were measured. The EDLVO theory was applied to analysis interaction energy between air bubble and low-rank coal, and the Stefan–Reynolds model was used to simulate wetting film evolution process. In addition, the hydrophobic force constant was calculated by establishing an exponent model based on the EDLVO theory and Stefan–Reynolds model.

2. Materials and Methods

2.1. Materials

Oleic acid and n-dodecane were used as carboxylic acid and hydrocarbon oil, respectively, which were both analytically pure and purchased from the Aladdin. A reagent purity test proved that both oleic acid and n-dodecane were of 99% purity, which met the requirements of this test. Based on the previous research work of interfacial tension and flotation results [29], a mixed collector was composed of n-dodecane and oleic acid in the mass ratio of 4:1 in this paper.
The coal sample was taken from the raw coal bunker of Daliuta Mine in Shanxi Province, China. The sample was crushed and grinded. The size fractions of 0.0074–0.125 mm and −0.074 mm were taken for the further induction time and zeta potential measurement, respectively, and the samples were preserved in sealed vessels after the drying process. The industrial analysis results showed that the volatile content and ash content of the sample were 44.74% and 25.82%, respectively.
The element analysis results of the coal sample are shown in Table 1, in which the C content was as high as 75.55%, and the O content was 15.35%. It indicated that the coal sample contains more oxygen-containing functional groups, and there were few inorganic oxides, which was suitable for this mechanism study.

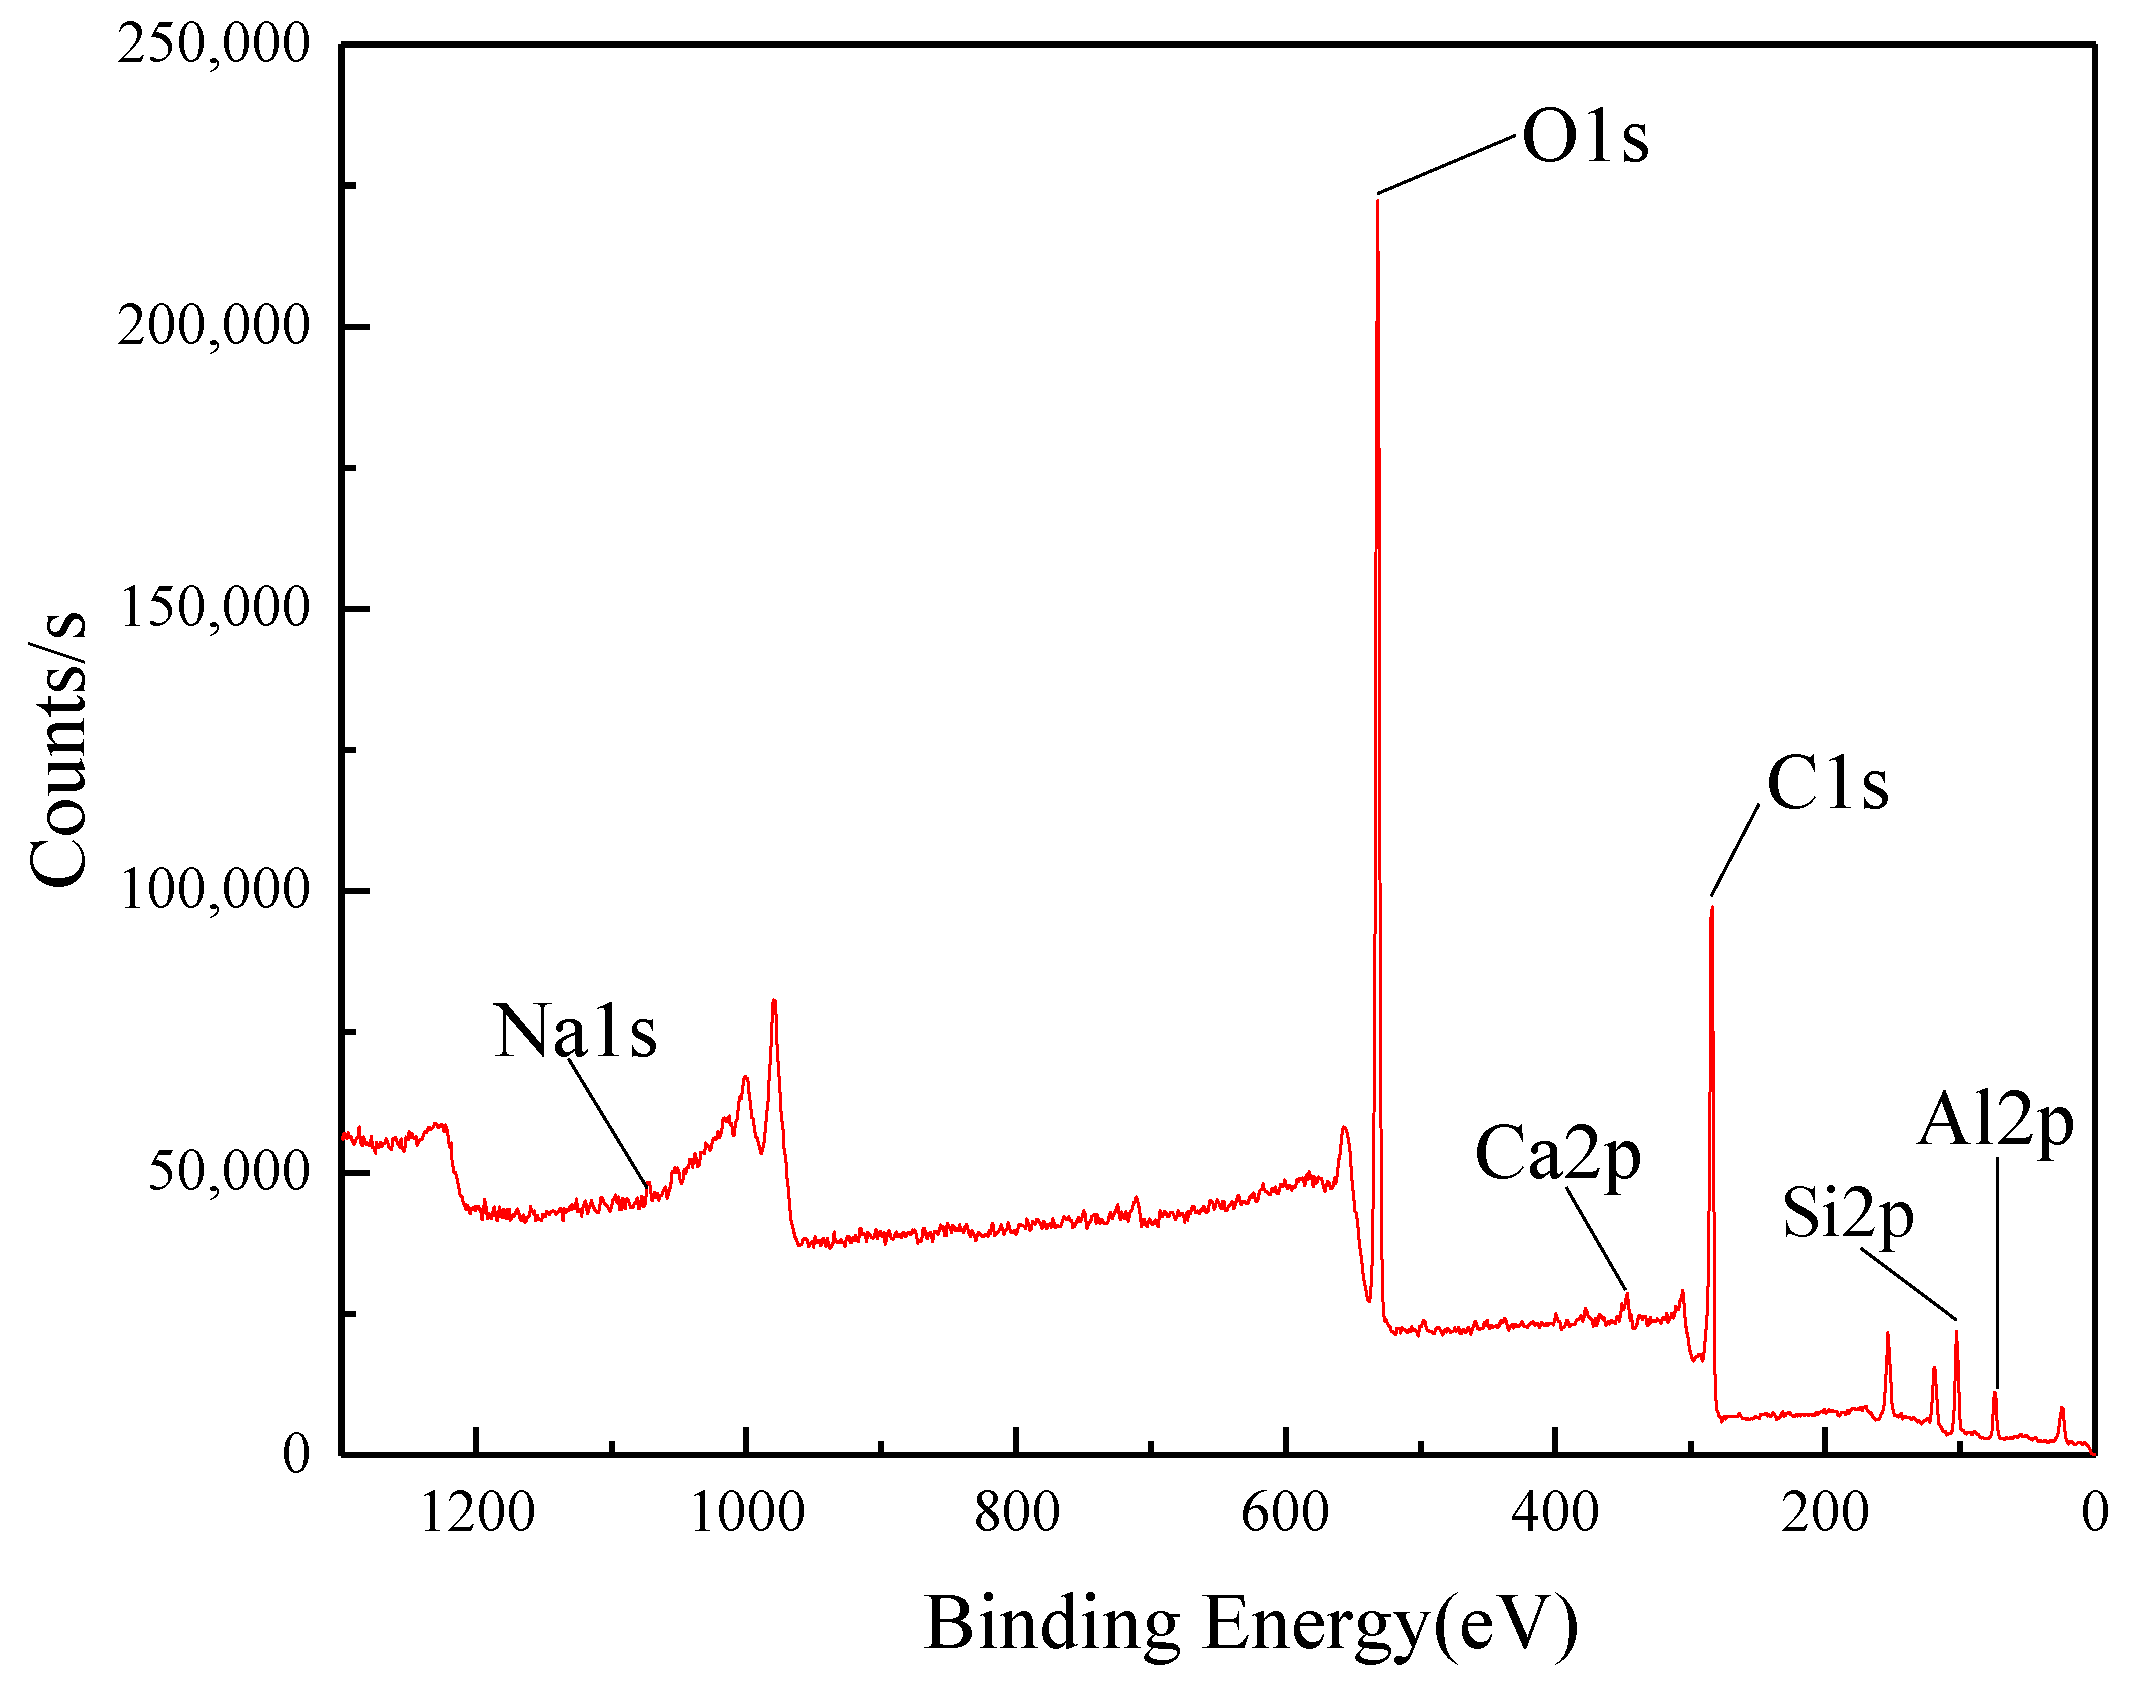
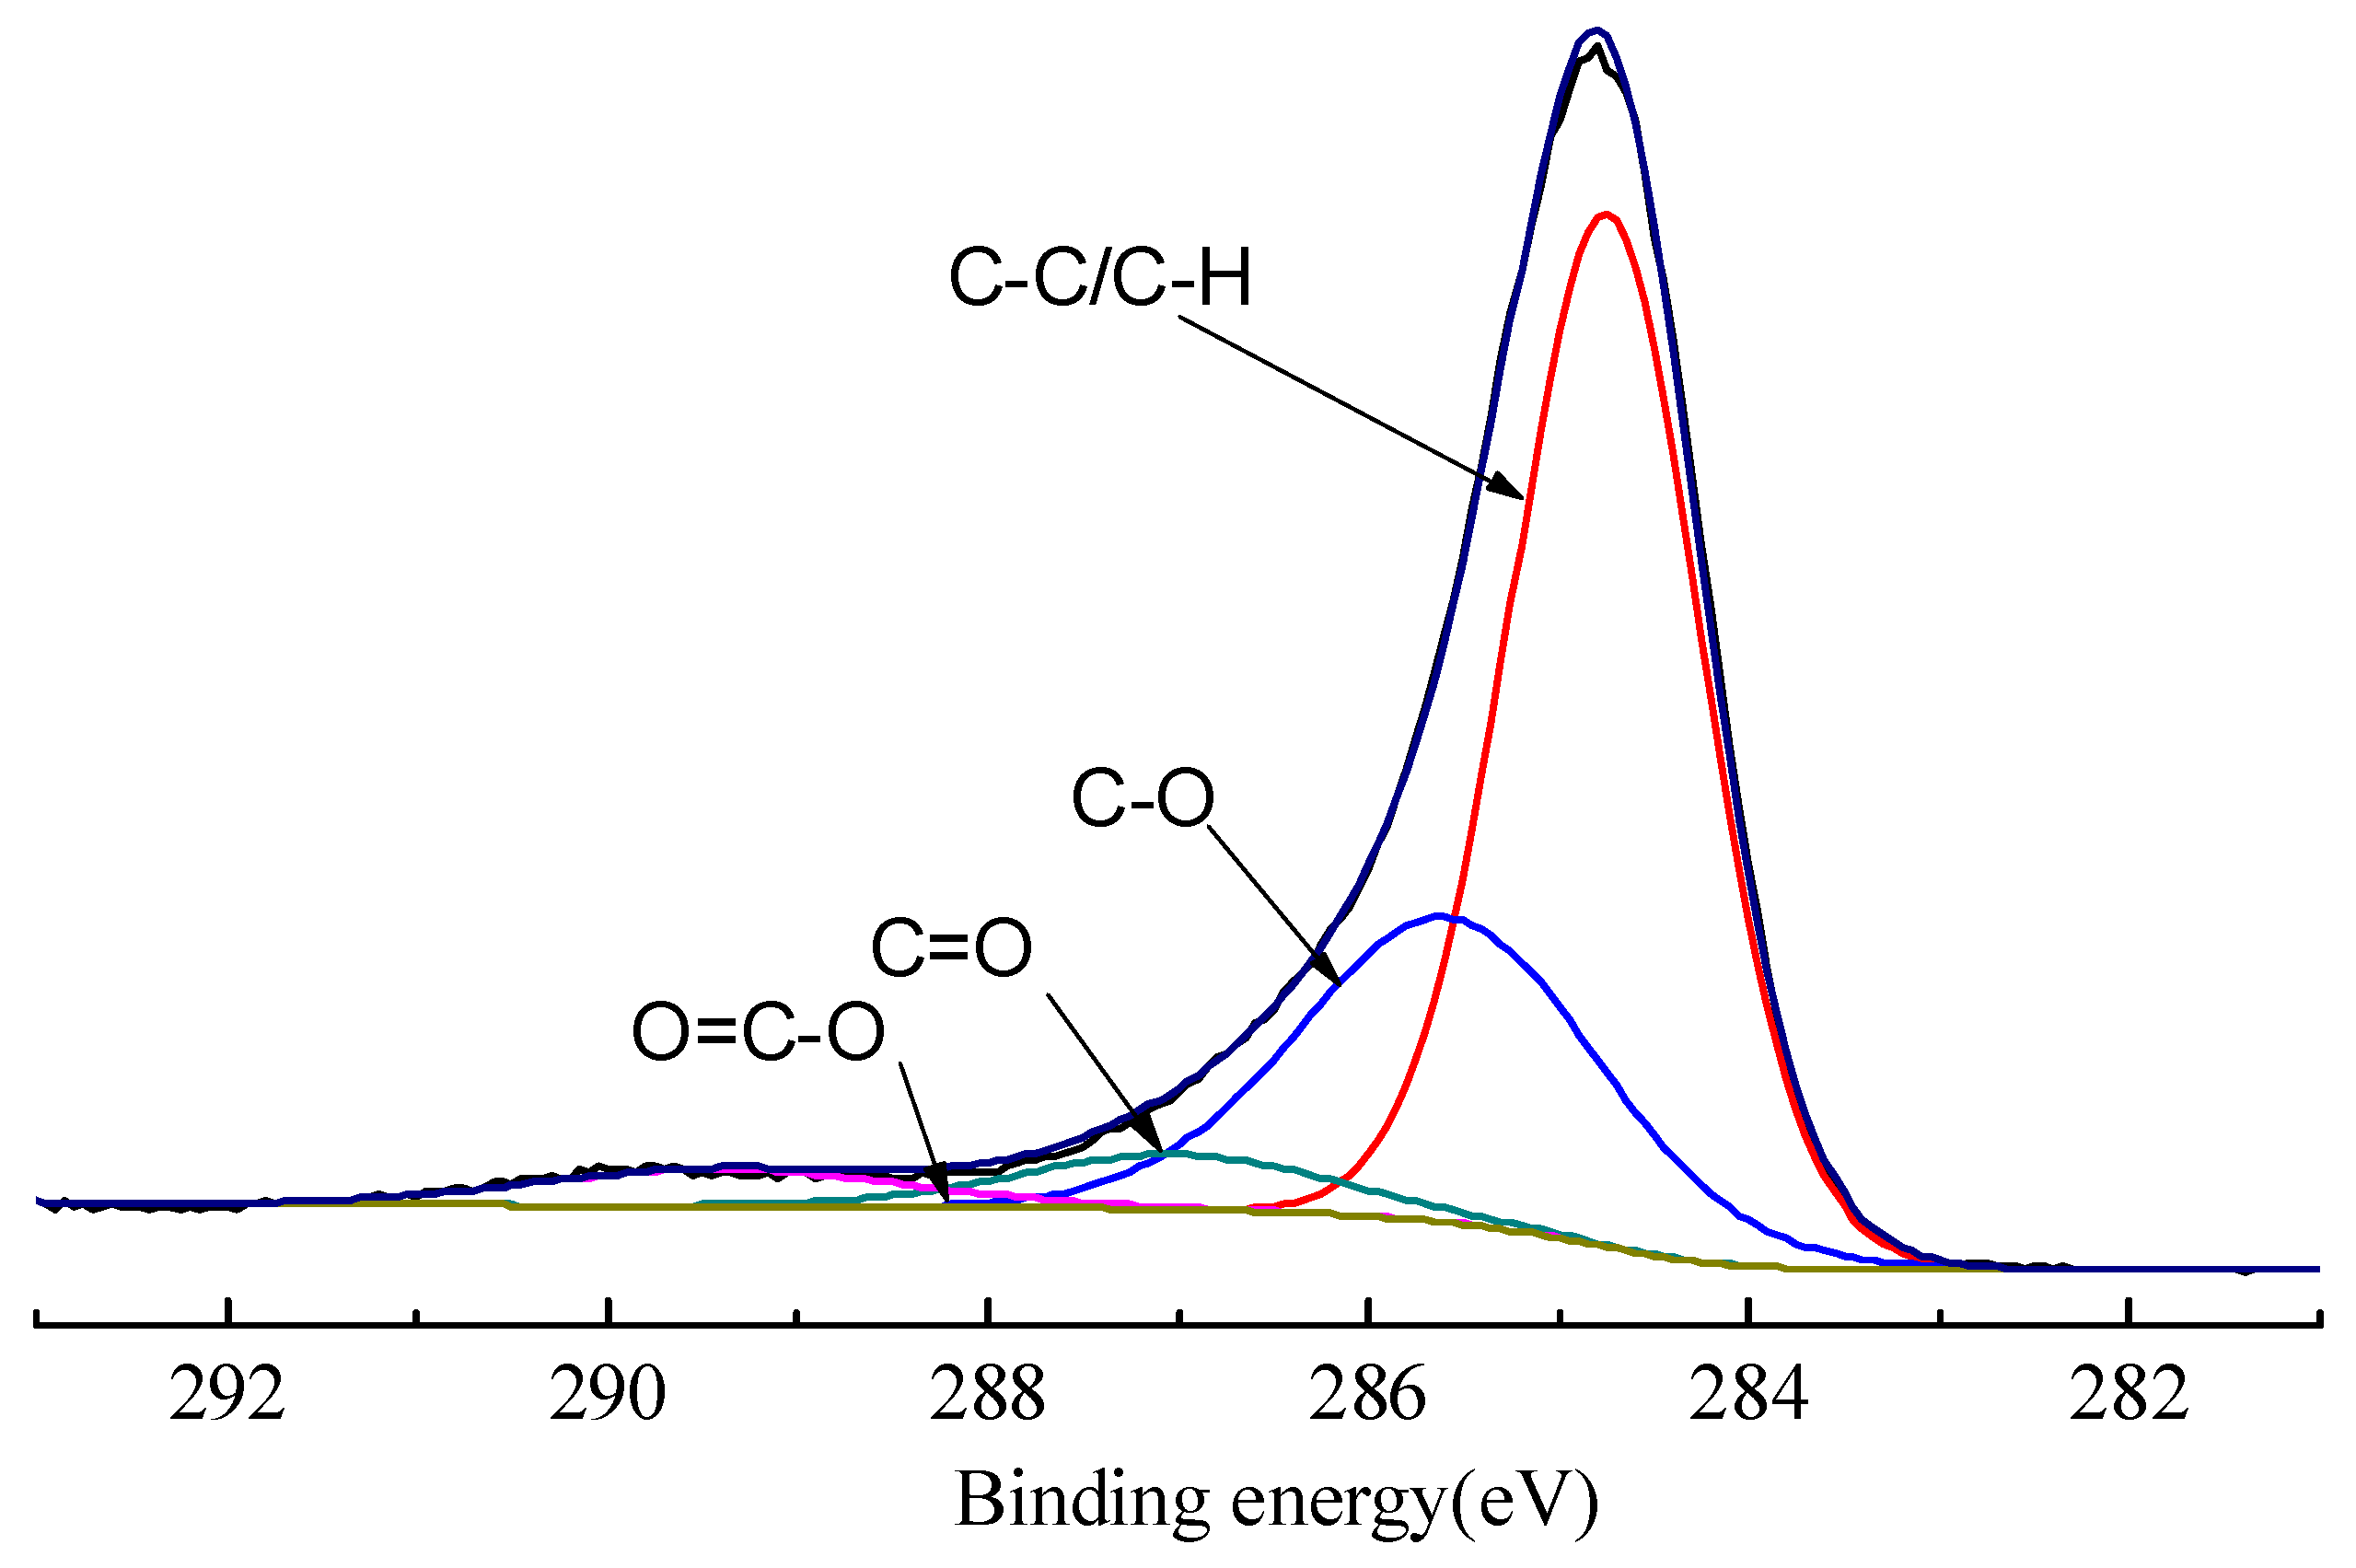
2.2. XPS Measurement

X-ray photoelectron spectroscopy (XPS, ESCALAB 250Xi, Thermo Fisher, Waltham, MA, USA), located in the Advanced Analysis and Computation Center of China University of Mining and Technology, was used to confirm the composition of the sample surface. Monochrome aluminum anode target (Al Kα) with spot size 650 µm was applied as radiation source. Pass energy was set at 20 eV and energy step size at 0.050 eV. To calibrate C1s binding energy, 284.8 eV was set.

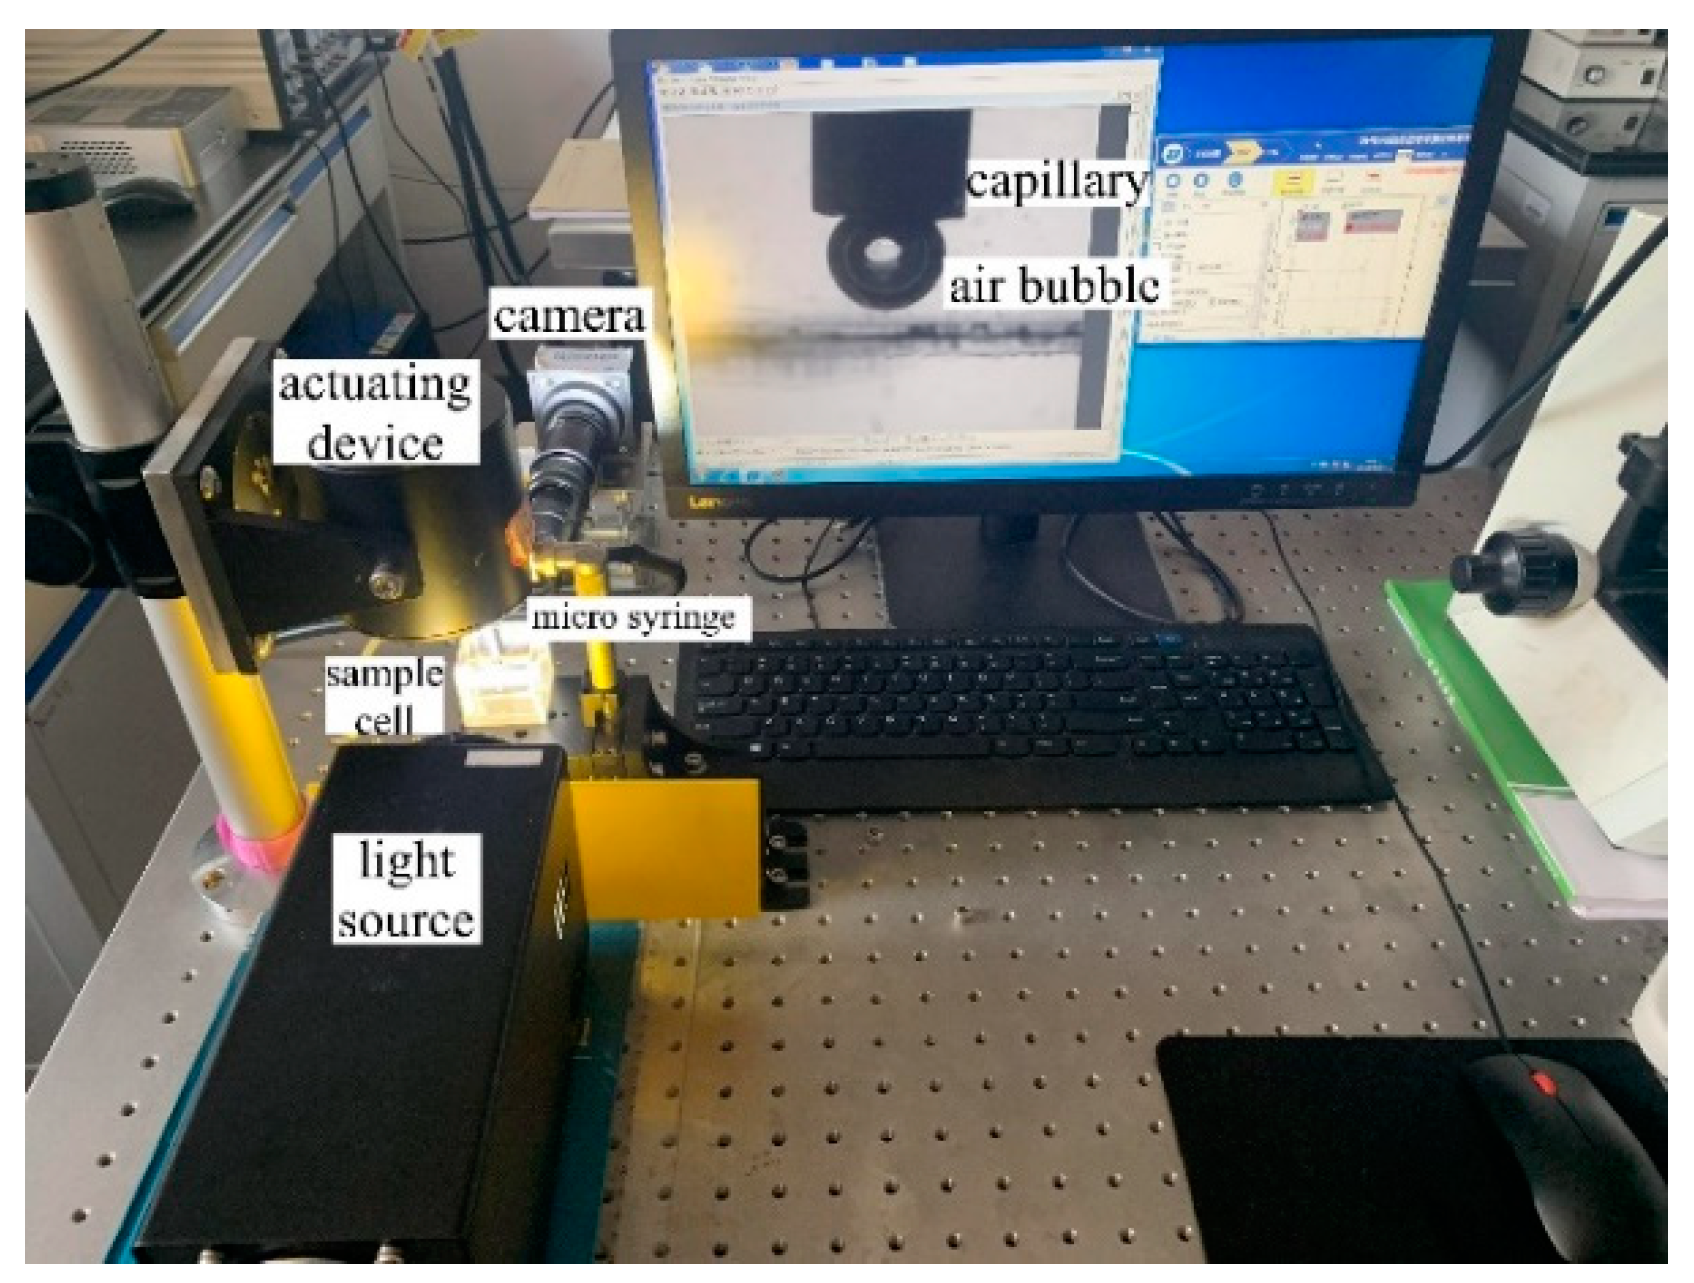
2.3. Induction Time Measurement

A self-assembled induction time measurement device, located in National Engineering Research Center of Coal Preparation and Purification of China University of Mining and Technology, was used to obtain different induction time between air bubble and coal particles treated by different collectors. Figure 1 shows the device for measuring induction time, which consisted of the driving device, the sample cell, the industrial camera, the microsyringe, and the light source. First, the coal sample was weighed to 1 g and divided into four batches, three of which were immersed into the reagents of D, OA, and MC, respectively, and then stirred, filtrated, and dried. Then, each batch was arranged in the bottom of the cell as a flat particles layer with a certain thickness. The cell was filled with ultra-pure water. An air bubble with certain size controlled by the microsyringe was generated and stabilized on the tip of the needle. The bottom of the air bubble was set at an initial distance of 2 mm from the particles layer. Afterwards, the needle with the bubble adhering on the tip moved at a constant velocity of 15 mm/s for 2.5 mm distance to contact the particles layer. The contact time between air bubble and particles layer maintained a certain time. The certain time was set at a series of values between 10 ms to 3000 ms. During this time, the attachment would happen, and the capillary moved upwards back to the initial position. The measuring process was conducted at least 10 times to acquire the appropriate contact time for the attachment that had just occurred. Appropriate contact time was the time that the probability of the attachment occurred was over 50%. The images of the particles layer and air bubble contact process were displayed and recorded in the computer. The induction time experiment was repeated five times for each batch in different position on the particles layer. The mean value of contact time was taken as the final result.

2.4. Zeta Potential Measurement

Zeta potential measurement employed the potentiometric analyzer (ZetaPALS, Brookhaven Instruments, Holtsville, NY, USA). The coal sample was treated by D, OA, and MC, respectively. A total of 0.05 g coal sample was mixed with ultra-pure water into a suspension with 0.1% mass concentration. The suspension was first conditioned for 3 min with a magnetic stirrer, and then kept standing still for 10 h, then the supernatant of 1.5 mL was taken for a zeta potential test. The 10-h standing allowed the settlement of large-sized particles to let the fine particles form the colloid system with the upper suspension [30,31]. The zeta potential measurement was carried out at pH of about 8, mainly because the flotation test of low-rank coal was carried out at this pH. The neutral and weak alkaline environment was the common pH range for coal flotation [32]. The tests were repeated five times at the room temperature of 20 °C, and the average was taken as the final result.

2.5. The Interaction Energy Calculation

The EDLVO theory was employed to study the interaction energy between bubble and low-rank coal treated by different collectors. Presuming the bubble and coal particles were all sphere shaped, the EDLVO theory [28,33,34] can be expressed as follows:
V T = V E + V D + V H
V T is the total interaction energy, which is the function of wetting film thickness; V E is the electrostatic interaction energy; V D is the Van der Waals interaction energy. V H is the hydrophobic interaction energy.
Each term in Equation (1) can be expressed as follows:
V E = ε ε 0 π R b R p R b + R p [ 4 ψ 1 ψ 2 arctan h ( e κ h ) + ( ψ 1 2 + ψ 2 2 ) ln ( 1 e 2 κ h ) ]
V D = R b R p A 132 6 ( R b + R p ) h
V H = R b R p K 132 6 ( R b + R p ) h
R b and R p represent the radius of air bubbles and solid particles, respectively; ε and ε 0 are the dielectric constant in the water medium and vacuum, respectively; κ 1 is the Debye length; ψ 1 . and ψ 2 are stern potentials of particles and air bubbles, respectively. h is the distance between two surfaces, i.e., the wetting film thickness; A 132 is the Hamaker constant; and K 132 is the hydrophobic force constant.
To solve Equation (1), the coal’s zeta potential ψ 1 can be obtained through previous measurement. The radius R p of coal particles was set 50 µm. The air bubble’s stern potential ψ 2 was −50 mV according to multiple literatures [35,36,37,38]. The Hamaker constant A 132 was 1 × 10 20   J [10,12]. The subscripts 1, 2, and 3 represented the coal particles, air bubbles, and water medium, respectively.

2.6. The Wetting Film Drainage Process Calculation

The Stefan–Reynolds model was applied to analyze the kinetic characteristics of the wetting film drainage process when air bubbles interacted with low-rank coal particles treated by different collectors. The disjoining pressure induced by the hydrophobic interaction was considered to be the reason driving the instability of the wetting film [5]. The disjoining pressure is defined as a partial derivative of free enthalpy G , with respect to film thickness h .
Π ( h ) = ( G / h ) μ , A , T
μ is the constant chemical potential, A is the superficial area, and T is the temperature. When G / h < 0 , the wetting film is in a thermodynamic stable condition. According to EDLVO theory, the disjoining pressure can be expressed as the follow equation, whose three terms represent the electrostatic force, the Van der Waals force, and the hydrophobic force, in order, respectively.
= E + D + H
E = ε ε 0 κ 2 2 2 ψ 1 ψ 2 cosh ( κ h ) ψ 1 2 ψ 2 2 s i n h 2 ( κ h )
D = A 132 6 π h 2
H = K 132 6 π h 2
If the bubble and particle are treated as two parallel immobile surfaces [39], the Stefan–Reynolds model is expressed as the following equation:
d h d t = 2 h 3 Δ P 3 η R 2
R is the radius of wetting film which can be approximated to the particle’s radius R p [40]; η is the liquid dynamic viscosity; Δ P is the pressure that drives the wetting film thinning; is the disjoining pressure; and γ is the surface tension.
Δ P = 2 γ R p
Combining Equations (10) and (11), the model of time-dependent wetting film thickness is acquired:
d h d t = 2 h 3 3 η R 2 ( 2 γ R p )
Equation (12) is a typical differential equation. The fourth-order Runge–Kutta formula was employed to solve Equation (12) and obtain curves of time-dependent wetting film thickness between coal particles treated by different collectors and air bubble in the condition of different hydrophobic force constants.

3. Results and Discussion

3.1. XPS Measurement Results

Figure 2 shows the XPS wide sweep spectrum of the raw coal sample. The raw coal absorption peak of O1s is stronger than that of C1s, which indicates a higher oxygen content than carbon. The elements of coal surface are primarily carbon and oxygen. There are also a few other elements, such as silicon, aluminum, calcium, and sodium. The element composition indicates the heterogeneous coal surface containing both organic and inorganic components.
Figure 3 shows the C1s peak fitting spectra of the raw coal sample. The sample has relatively high content C–C bonds and C–H bonds, and the proportion of both is up to 61.74%. The relative content of C–O bonds, C=O bonds, and O=C–O bonds are 28.55%, 5.43%, and 4.28%, respectively, indicating that the coal is rich in oxygen functional groups. The amount and type of the oxygen functional groups of coal surfaces are related to the surface wettability and hydrophobicity, which will deeply affect the wetting film evolution [41,42,43]. The oxygen functional groups are the main reason for the low hydrophobicity of low-rank coal that make it more difficult in wetting film drainage process.

3.2. Induction Time Results

The results of induction time measurement between air bubbles and coal particles treated by different collectors are shown in Table 2. As shown in Table 2, the induction time decreases in the order of no reagent > D > OA > MC. The induction time of untreated coal interacting with air bubble is 1125 ms, while the induction time is 551 ms, 92 ms, and 48 ms for the coal treated by D, OA, and MC, respectively. It is obvious that the induction time decreases greatly after being treated by collectors, and MC shortens the induction time most significantly. Induction time is defined as the time of the whole wetting film evolution process, including the time of film drainage, film rapture, and the time of three-phase contact line forming, expansion, and relaxation [1]. It can be interpreted as the time from collision to attachment between particles and bubbles. It reflects the wetting film evolution process in the perspective of efficiency. In the flotation process, particles have more probability to attach to the bubble and become concentrate product if the induction time is shorter than the contact time. The coal particles treated by MC will be more efficient in the attachment process due to shorter induction.

3.3. Zeta Potential Results

Table 2 presents the results of zeta potential measurement. The order of zeta potential of coal treated by different collectors is: no reagent < D < MC < OA. The zeta potential of low-rank coal without collector treatment is negative in natural pH, and its zeta potential value is the lowest. Zeta potential increases slightly from −23.54 mV to −20.05 mV after the treatment of D. Zeta potential value can reflect the collector adsorption state to some extent [44]. The effect of D increasing the zeta potential value is very limited, because D is a nonpolar reagent which can only adsorb to the hydrophobic sites, and it has little impact on electrical double layer. The low-rank coal treated by OA has the highest zeta potential value, because OA can adsorb on the hydrophobic sites of low-rank coal surface and compress the double electric layer. Moreover, OA can reduce the pH value of the environment. The zeta potential of coal generally increases with the decreasing of the pH value [44]. MC has a significant effect on increasing the zeta potential, which changes it from −23.54 mV to −14.50 mV. The zeta potential value of coal treated by MC is close to, but slightly lower than, OA. The OA, as a component of MC, has lower content, but still played a dominant role in reducing the zeta potential. The effect of D or MC on zeta potential is weaker than OA. Therefore, the effect of MC increasing zeta potential is slightly weaker than OA. The zeta potentials of bubble and coal are both negative in water, so the electrostatic interaction is repulsive between them. A closer value to zero of zeta potential means a lower repulsive effect and relatively higher attractive interaction between particles and bubbles. Therefore, wetting film for two surfaces with low zeta potential absolute value is less stable, and the attachment between bubble and particle is more likely to happen. So, the coal treated by MC and OA should have more unstable wetting films in terms of zeta potential. In addition, the calculation of K 132 in this paper was based on the measured induction time and zeta potential. The standard deviation analysis on these two key parameters was conducted. The standard deviation was calculated as follows:
STDVE = i = 1 5 ( X i X ¯ ) 2 5
where X represents actual measured value, X ¯ represents average value of data, and STDVE represents standard deviation. The results of STDVE are given in Table 2. The results showed that the error of induction time and zeta potential was small, which ensured the accuracy of the subsequent calculation results.

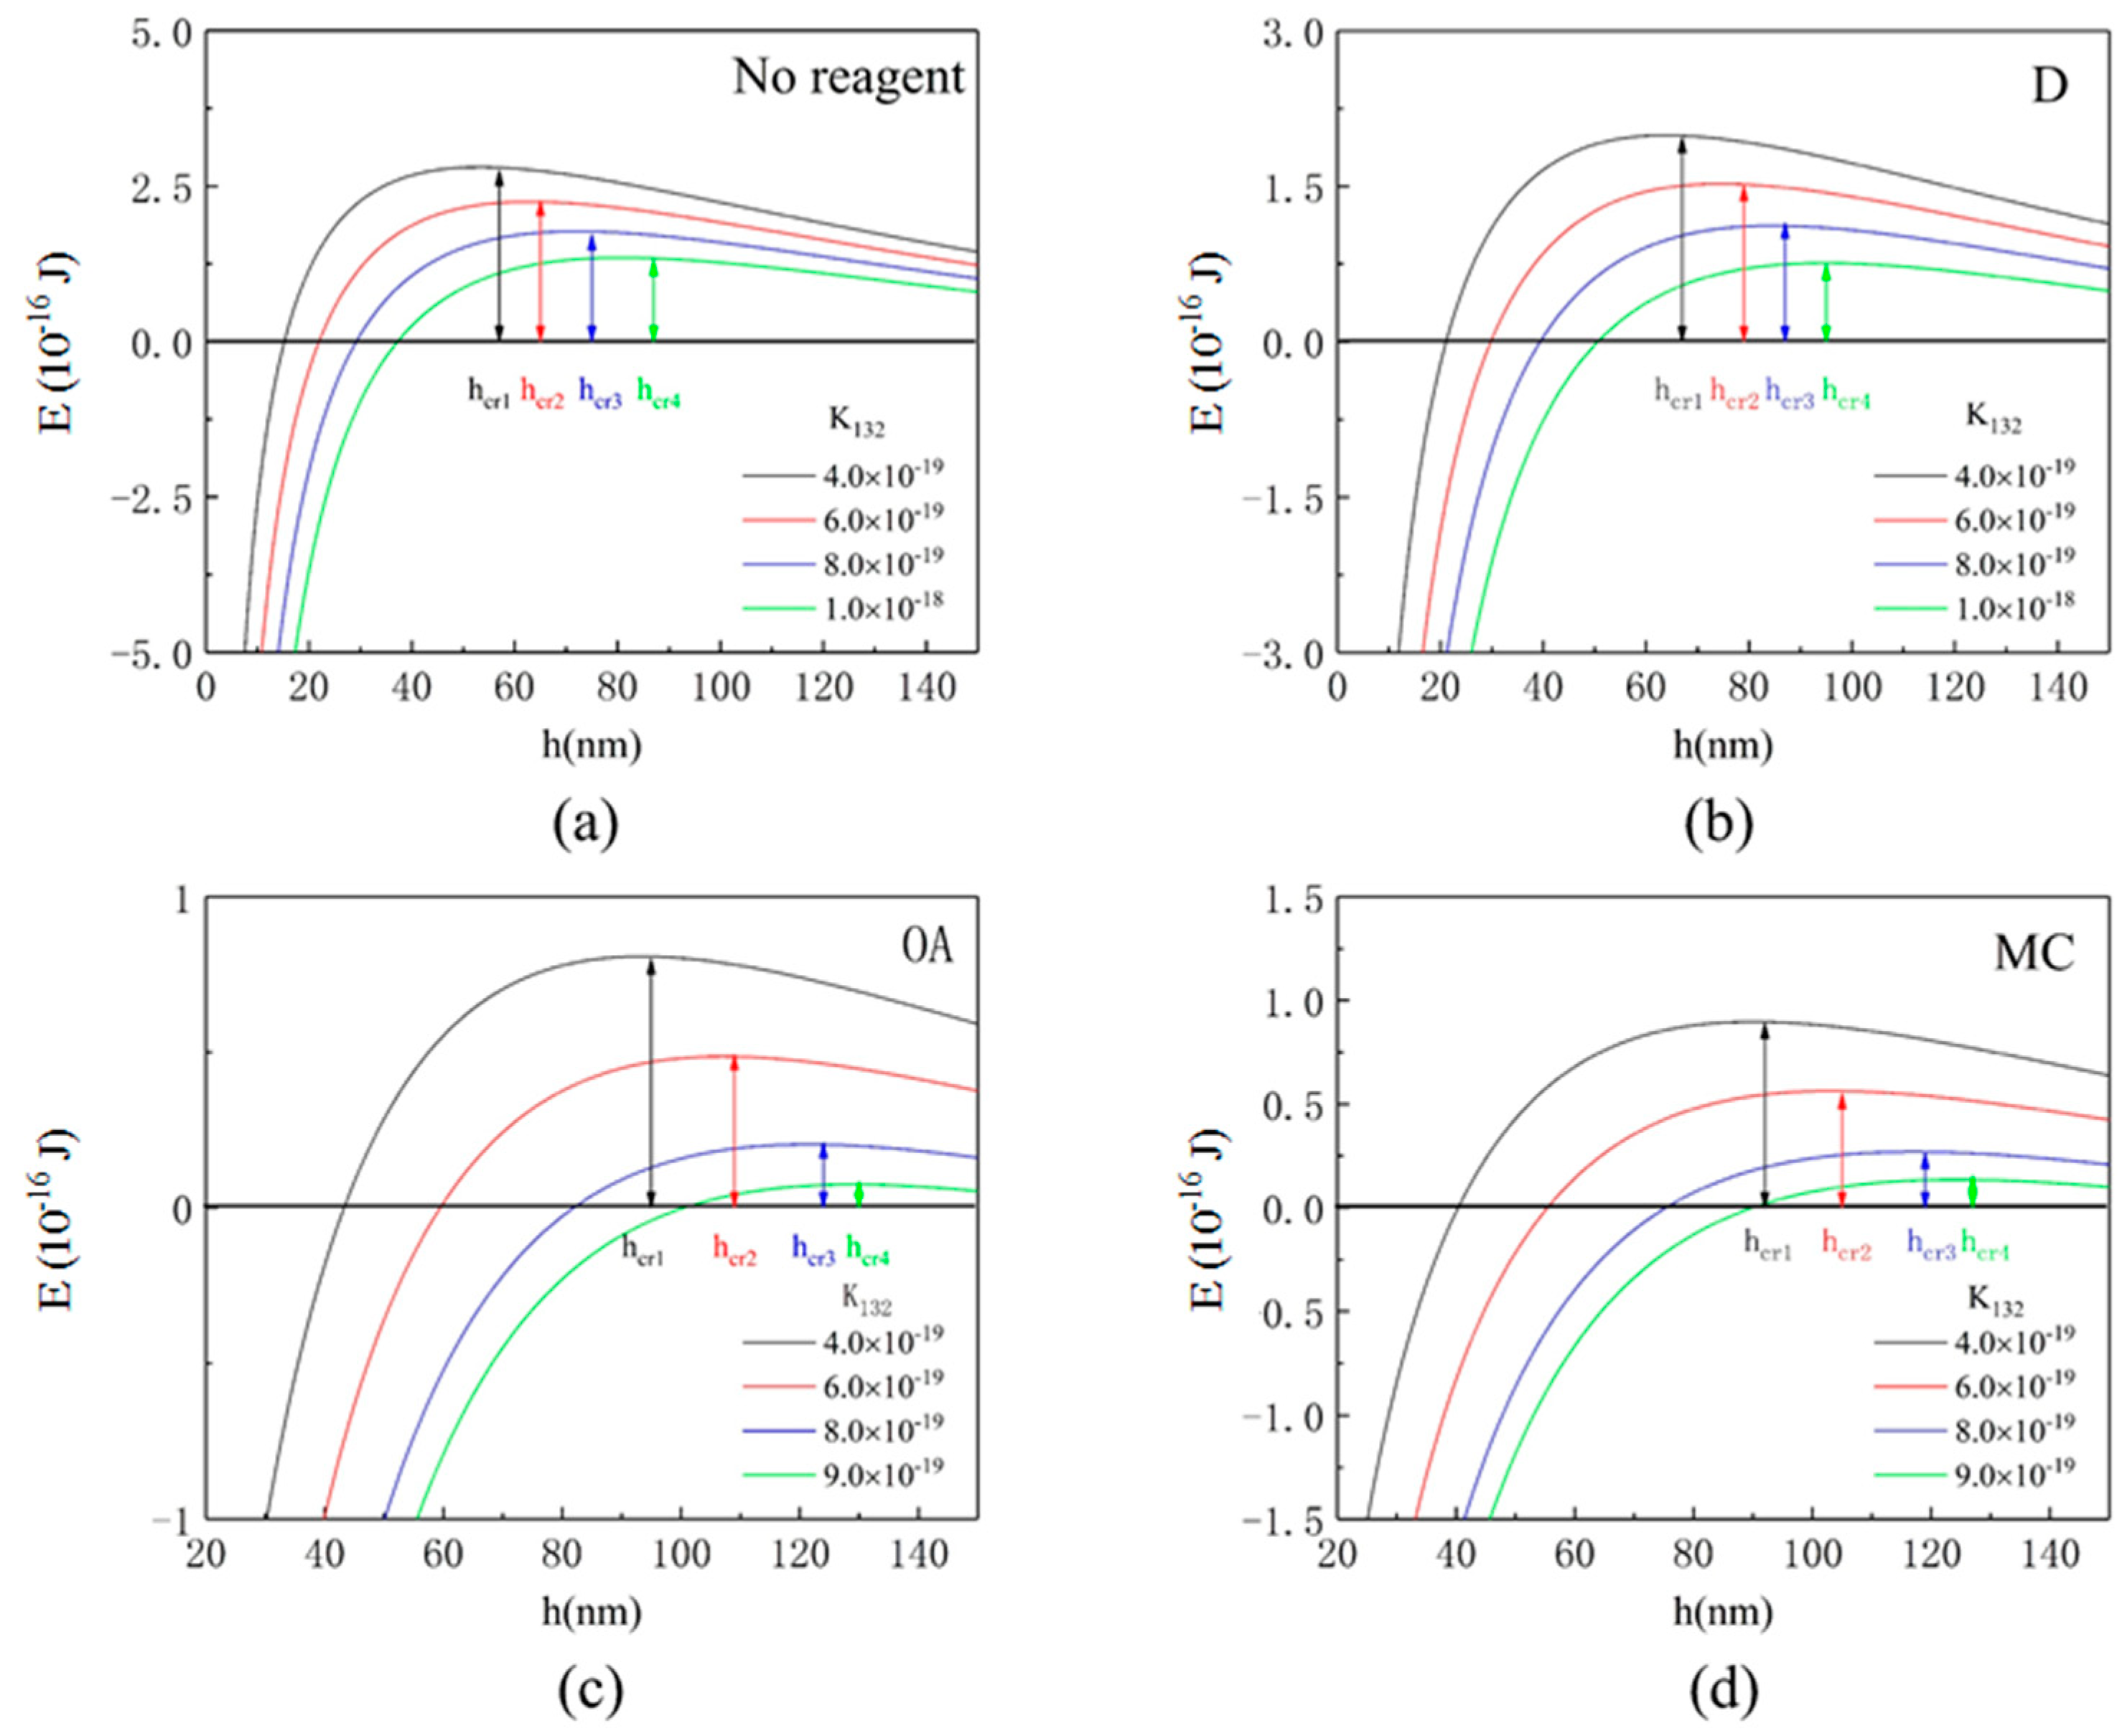
3.4. Interaction Energy Calculation Results

The functional relationship between total interaction energy and the wetting film thickness can be obtained when hydrophobic force constants are set for different values. Figure 4 shows the curve of interaction energy as a function of wetting film thickness between air bubble and coal treated by different collectors. For a certain K 132 value, the total potential energy at film thickness 150 nm is positive, which indicates the interaction is repulsive. When air bubble and coal particle initiates approaching each other, the electrostatic interaction energy acts as repulsive, because both of the surfaces’ potential are negative. The Van der Waals interaction energy and hydrophobic interaction act as attractive. As wetting film thickness h decreased, the interaction energy reached the maximal value at critical wetting film thickness h c r . The maximum energy is referred to as the energy barrier [8]. Compared to the coal treated by no reagent, the coal treated by the collector has a lower energy barrier. OA and MC have relatively low energy barriers. The lowest energy barrier of bare coal is 1.34 × 10 16   J at K 132 value of 1.0 × 10 18 , which is still higher than the highest energy barrier of OA, 0.81 × 10 16   J , and that of MC, 0.89 × 10 16   J , at K 132 value of 4.0 × 10 19 . This means that OA and MC reach the h c r with less energy to overcome. After reaching maximum value, the film ruptures, the interaction energy rapidly declines to negative value, and the interaction become attractive.
As shown in Figure 4, each hydrophobic force constant K 132 corresponds to a critical film thickness h c r . The hydrophobic force constant K 132 and corresponding critical film thickness h c r is listed in Table 3. There is a linear relationship between h c r and K 132 [10], as shown in Figure 5. The h c r increases with the increasing of K 132 , and increases in order of no reagent < D < MC < OA at the same K 132 . The h c r of coal treated by collectors is thicker than the coal without collector treatment. The hcc of coal treated by OA and MC is thicker than D, which indicates the higher hydrophobicity of coal surface treated by OA and MC [45]. The larger hcr value means that the wetting film is easier to rupture and the attachment between air bubble and coal occurs more easily [4].

3.5. The Wetting Film Drainage Calculation Results

Figure 6 shows the curves of time-dependent wetting film thickness under different hydrophobic force constants. Each critical film thickness h c r corresponds to a critical time which is defined as the induction time t b . The drainage rate of film (curve slope) decreases with the time but increases with the hydrophobic force constant. The order of wetting film drainage rate for coal treated by different collectors is: no reagent < D < MC < OA. The drainage rate of OA and MC are close. The kinetics results of the wetting film drainage process are consistent with the interaction energy results. The h c r obtained from Figure 4 corresponds to the theoretical induction time t b . Apparently, thinner h c r corresponds to a shorter induction time and faster thinning rate. The h c r plays a dominant role in wetting film drainage, but K 132 has little effect on thinning rate.
OA markedly increases the zeta potential value of coal particles and weakens the repulsive electrostatic force. Given that the properties of air bubbles and water medium remain constant, drainage rate and induction time reflect the hydrophobicity of the coal particles to some extent. The rich oxygen-containing groups existing on low-rank coal surfaces may form hydrogen bonding with water, causing low surface hydrophobicity [17], which results in slow drainage rate and long induction time. As a type of alkane, D can strongly adsorb to the hydrophobic sites on coal surface and increase the hydrophobicity. So, the drainage rate of coal treated by D is faster than coal without collector treatment. OA molecules possess not only hydrocarbon chins, but also the carboxyl groups. OA interacts with the hydrophilic sites through hydrogen bonding [18], and increases the coal hydrophobicity more than D. MC can implement the synergy of OA and D. It can cover both the hydrophobic and hydrophilic sites on coal surface, resulting in higher hydrophobicity and faster drainage rate. The drainage rate of using OA alone is slightly faster than that of MC. The drainage process is accelerated because of the high concentration of OA spreading from coal surface and wetting film into the medium and then entraining water from the film [46]. However, in the flotation process, OA in high concentration can adsorb to coal and gangue at the same time [47], and lose the selectivity.

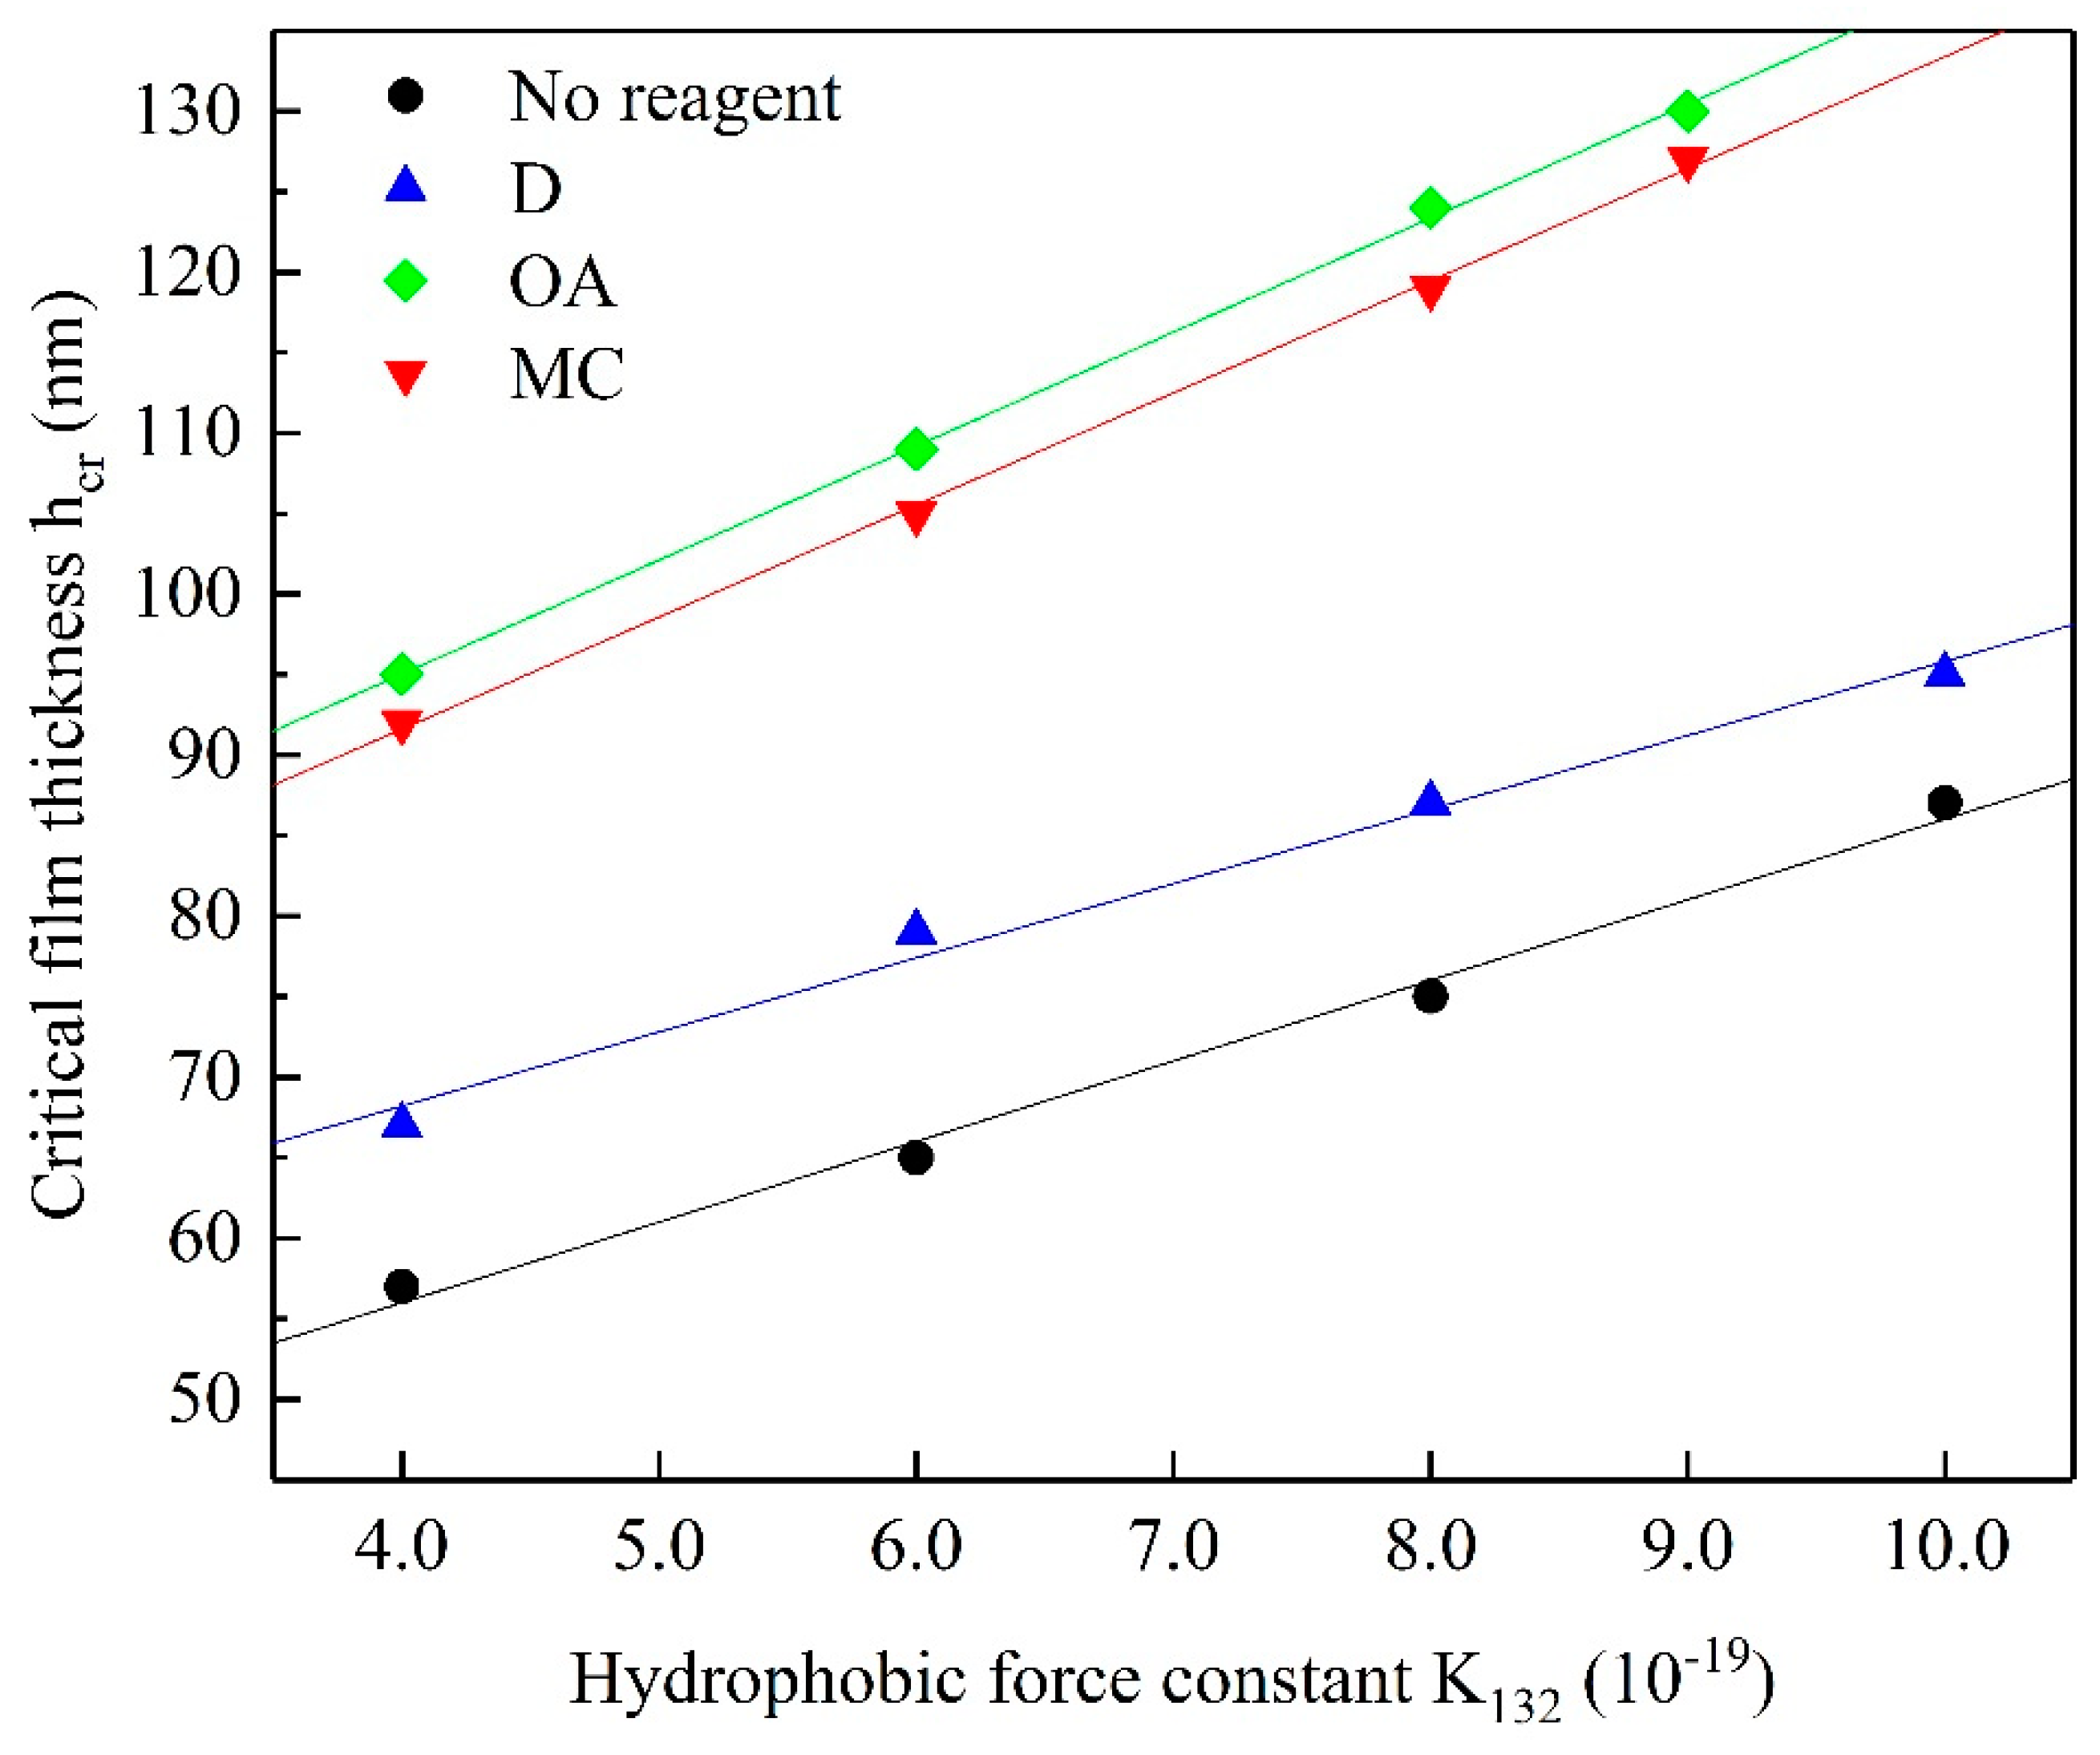
3.6. Back Calculation of Hydrophobic Force Constant

The theoretical induction time t b under different hydrophobic force constants is shown in Table 4. The exponential function was applied to fit the functional relationship between hydrophobic force constant K 132 and calculated induction time t b . The fitting results are shown in Figure 7. Based on the model obtained from the fitting curves, the measured induction time is applied to calculate the hydrophobic force constant of air bubble interacting with coal treated by different collectors. The fitted models and calculated hydrophobic force constant are shown in Table 5. The order of calculated K 132 for different collectors is no reagent < D < OA < MC. Coal treated by MC interacting with air bubble has the maximum K 132 value of 1.34 × 10 18 among all used collectors. The hydrophobic force constant K 132 reflects the hydrophobic interaction degree. Moreover, the K 132 is a decisive parameter for hydrophobic force and disjoining pressure. The greater value of K 132 means the hydrophobic force and disjoining pressure is higher, which indicates the critical wetting film thickness is thicker and the drainage process is faster. The hydrophobic interaction between bubble and coal treated by MC is the strongest. The MC has the most significant impact on hydrophobic interaction and the wetting film evolution process.
The MC collector was the compound reagent of dodecane and oleic acid. The low-rank coal has polar and non-polar regions on the surface. The dodecane is a non-polar reagent and it can be adsorbed on the non-polar region, while the oleic acid, a carboxylic acid collector, can be adsorbed on the polar region. The carboxyl groups of oleic acid interact with the oxygen-containing groups by hydrogen bonding, and the non-polar alkyl chains face outward, improving the hydrophobicity of the polar region [48]. The cooperation of the two components in MC can enhance the hydrophobicity of coal surface. The synergistic effect of the two collectors makes the MC more effective than the single collector. In our previous work, the flotation results using the MC were proved to be better than using D or OA alone [29].

4. Conclusions

The wetting film evolution process between air bubble and coal particles treated by mixed collector (MC) composed of n-dodecane (D) and oleic acid (OA) was investigated. The induction time between bubble and coal particle and zeta potential of coal particle was measured. The interaction energy, wetting film drainage kinetics, and hydrophobic force constant between air bubble and coal particles treated by different collectors was calculated by the extended Derjagin–Landau–Verwey–Overbeek (EDLVO) theory and Stefan–Reynolds model. The main conclusion is as follows:
The induction time of air bubble interacted with coal treated by different collectors was: MC < OA < D < no reagent. MC showed the strongest ability in shortening the induction time. The zeta potential of coal treated by different reagent was: no reagent < D < MC < OA. OA had great ability in increasing zeta potential.
The interaction energy between air bubble and coal particles slowly increased as the film thickness thinned. When film reached critical thickness, the interaction energy reached the maximum. The order of maximum energy of coal treated by different collectors interacting with bubble was: OA < MC < D < no reagent, while the critical film thickness was in the reverse order. With the increase of hydrophobic force constant K 132 , the interaction energy decreased, and the critical film thickness increased.
The drainage rate of film decreased with the time but increased with the K 132 . The order of wetting film thinning rate for coal treated by different collectors was: no reagent < D < MC < OA. The theoretical induction time under different hydrophobic force constant was obtained, and the hydrophobic force constant K 132 was calculated based on K123–induction time relationship. The order of calculated K123 value was: no reagent < D < OA < MC, which indicated that MC had the most significant impact on hydrophobic interaction and the wetting film evolution process. The synergy of OA and D can improve the collector adsorption, increase the coal surface hydrophobicity, and enhance the hydrophobic interaction.

Author Contributions

Y.L.: conceptualization, writing—reviewing and editing; X.S.: data curation, writing—original draft preparation; M.A.: methodology; Z.Y.: visualization, investigation; X.H.: supervision; H.R.: software, validation. All authors have read and agreed to the published version of the manuscript.

Funding

This research was funded by [National Natural Science Foundation of China] grant number [51804306].

Institutional Review Board Statement

Not applicable.

Informed Consent Statement

Not applicable.

Data Availability Statement

Data is contained within the article or supplementary material. The data presented in this study are available in insert article.

Acknowledgments

This work was supported by the National Natural Science Foundation of China (51804306).

Conflicts of Interest

The authors declare that they have no known competing financial interests or personal relationships that could have appeared to influence the work reported in this paper.

References

  1. Albijanic, B.; Ozdemir, O.; Nguyen, A.V.; Bradshaw, D. A review of induction and attachment times of wetting thin films between air bubbles and particles and its relevance in the separation of particles by flotation. Adv. Colloid Interface Sci. 2010, 159, 1–21. [Google Scholar] [CrossRef]
  2. Hubbard, A.; Colloidal Science of Flotation; Anh, V. Nguyen and Hans Joachim Schulze, Marcel Dekker, New York, 2004, 850 pages. Miner. Eng. 2004, 17, 839. [Google Scholar] [CrossRef]
  3. Huang, K.; Yoon, R.-H. Surface Forces in the Thin Liquid Films (TLFs) of Water Confined between n-Alkane Drops and Hydrophobic Gold Surfaces. Langmuir 2019, 35, 15681–15691. [Google Scholar] [CrossRef] [PubMed]
  4. Ralston, J.; Dukhin, S.; Mishchuk, N. Wetting film stability and flotation kinetics. Adv. Colloid Interface Sci. 2002, 95, 145–236. [Google Scholar] [CrossRef]
  5. Xie, L.; Shi, C.; Cui, X.; Zeng, H. Surface Forces and Interaction Mechanisms of Emulsion Drops and Gas Bubbles in Complex Fluids. Langmuir 2017, 33, 3911–3925. [Google Scholar] [CrossRef] [Green Version]
  6. Xie, L.; Wang, J.; Yuan, D.; Shi, C.; Cui, X.; Zhang, H.; Liu, Q.; Liu, Q.; Zeng, H. Interaction Mechanisms between Air Bubble and Molybdenite Surface: Impact of Solution Salinity and Polymer Adsorption. Langmuir 2017, 33, 2353–2361. [Google Scholar] [CrossRef]
  7. Wang, J.; Teo, A.J.T.; Tan, S.H.; Evans, G.M.; Nguyen, N.T.; Nguyen, A.V. Influence of Interfacial Gas Enrichment on Controlled Coalescence of Oil Droplets in Water in Microfluidics. Langmuir 2019, 35, 3615–3623. [Google Scholar] [CrossRef] [Green Version]
  8. Yoon, R.-H. The role of hydrodynamic and surface forces in bubble–particle interaction. Int. J. Miner. Process. 2000, 58, 129–143. [Google Scholar] [CrossRef]
  9. Chan, D.Y.C.; Klaseboer, E.; Manica, R. Film drainage and coalescence between deformable drops and bubbles. Soft Matter 2010, 7, 2235–2264. [Google Scholar] [CrossRef]
  10. Zhou, Y.; Albijanic, B.; Tadesse, B.; Wang, Y.; Yang, J.; Zhu, X. The Stefan-Reynolds Model and the Modified Stefan-Reynolds Model for Studying Bubble-Particle Attachment Interactions in the Context of Flotation. Langmuir 2019, 35, 4278–4286. [Google Scholar] [CrossRef]
  11. Derjaguin, B.; Kussakov, M. Anomalous Properties of Thin Polymolecular Films. 1 V. Acta Physicochim. URSS 1939, 10, 26–45. [Google Scholar]
  12. Wang, S.; Albijanic, B.; Tao, X.; Fan, H. Thin liquid film drainage mechanism between air bubbles and low-rank coal particles in the presence of surfactant. Fuel Process. Technol. 2019, 186, 18–24. [Google Scholar] [CrossRef]
  13. Wang, L. Drainage and rupture of thin foam films in the presence of ionic and non-ionic surfactants. Int. J. Miner. Process. 2012, 102, 58–68. [Google Scholar] [CrossRef]
  14. Kosior, D.; Zawala, J.; Krasowska, M.; Malysa, K. Influence of n-octanol and α-terpineol on thin film stability and bubble attachment to hydrophobic surface. Phys. Chem. Chem. Phys. 2013, 15, 2586–2595. [Google Scholar] [CrossRef]
  15. Dey, S. Enhancement in hydrophobicity of low rank coal by surfactants—A critical overview. Fuel Process. Technol. 2012, 94, 151–158. [Google Scholar] [CrossRef]
  16. Wang, L.; Yoon, R.-H. Role of hydrophobic force in the thinning of foam films containing a nonionic surfactant. Colloids Surf. A Physicochem. Eng. Asp. 2006, 282, 84–91. [Google Scholar] [CrossRef]
  17. Wen, B.; Xia, W.; Sokolovic, J.M. Recent advances in effective collectors for enhancing the flotation of low rank/oxidized coals. Powder Technol. 2017, 319, 1–11. [Google Scholar] [CrossRef]
  18. Gui, X.; Xing, Y.; Wang, T.; Cao, Y.; Miao, Z.; Xu, M. Intensification mechanism of oxidized coal flotation by using oxygen-containing collector α-furanacrylic acid. Powder Technol. 2017, 305, 109–116. [Google Scholar] [CrossRef]
  19. Qu, J.; Tao, X.; He, H.; Zhang, X.; Xu, N.; Zhang, B. Synergistic Effect of Surfactants and a Collector on the Flotation of a Low-Rank Coal. Int. J. Coal Prep. Util. 2015, 35, 14–24. [Google Scholar] [CrossRef]
  20. Chander, S.; Polat, H.; Mohal, B. Flotation and wettability of a low-rank coal in the presence of surfactants. Min. Met. Explor. 1994, 11, 55–61. [Google Scholar] [CrossRef]
  21. Polat, M.; Polat, H.; Chander, S. Physical and chemical interactions in coal flotation. Int. J. Miner. Process. 2003, 72, 199–213. [Google Scholar] [CrossRef] [Green Version]
  22. Polat, H.; Chander, S. Interaction between physical and chemical variables in the flotation of low rank coals. Min. Met. Explor. 1998, 15, 41–47. [Google Scholar] [CrossRef]
  23. Jena, M.; Biswal, S.; Rudramuniyappa, M. Study on flotation characteristics of oxidised Indian high ash sub-bituminous coal. Int. J. Miner. Process. 2008, 87, 42–50. [Google Scholar] [CrossRef]
  24. Sis, H.; Ozbayoglu, G.; Sarikaya, M. Comparison of non-ionic and ionic collectors in the flotation of coal fines. Miner. Eng. 2003, 16, 399–401. [Google Scholar] [CrossRef]
  25. Sis, H.; Ozbayoglu, G.; Sarikaya, M. Utilization of Fine Coal Tailings by Flotation Using Ionic Reagents. Energy Sources 2004, 26, 941–949. [Google Scholar] [CrossRef]
  26. Xia, W.; Ni, C.; Xie, G. Effective Flotation of Lignite Using a Mixture of Dodecane and 4-Dodecylphenol (DDP) as a Collector. Int. J. Coal Prep. Util. 2016, 36, 262–271. [Google Scholar] [CrossRef]
  27. Erol, M.; Colduroglu, C.; Aktas, Z. The effect of reagents and reagent mixtures on froth flotation of coal fines. Int. J. Miner. Process. 2003, 71, 131–145. [Google Scholar] [CrossRef]
  28. Zhang, M.; Liu, Q.; Liu, J. Extended DLVO theory applied to coal slime-water suspensions. J. Cent. South Univ. 2012, 19, 3558–3563. [Google Scholar] [CrossRef]
  29. Liao, Y.; Hao, X.; An, M.; Yang, Z.; Ma, L.; Ren, H. Enhancing low-rank coal flotation using mixed collector of dodecane and oleic acid: Effect of droplet dispersion and its interaction with coal particle. Fuel 2020, 280, 118634. [Google Scholar] [CrossRef]
  30. Yan, G.; Bai, L.; Feng, J.; Zhang, Z. A Comparative Study on the Wettability of Two Coal Samples during Deep Burial Metamorphism. J. Chem. 2020, 2020, 1–7. [Google Scholar] [CrossRef] [Green Version]
  31. Tang, L.; Wang, S.; Li, L.; Qu, J.; Tao, X.; He, H. Exploration on the mechanism of enhancing low-rank coal flotation with cationic surfactant in the presence of oily collector. Fuel 2018, 227, 190–198. [Google Scholar] [CrossRef]
  32. Ulusoy, Æ.; Selma, S.; Cebeci, Y. Investigation of the effect of agglomeration time, pH and various salts on the cleaning of Zonguldak bituminous coal by oil agglomeration. Fuel 2002, 81, 1131–1137. [Google Scholar]
  33. Zou, W.; Zhao, J.; Sun, C. Adsorption of anionic polyacrylamide onto coal and kaolinite calculated from the extended DLVO theory using the van Oss-Chaudhury-Good theory. Polymers 2018, 10, 113. [Google Scholar] [CrossRef] [PubMed] [Green Version]
  34. Piñeres, J.; Barraza, J.M. Energy barrier of aggregates coal particle–bubble through the extended DLVO theory. Int. J. Miner. Process. 2011, 100, 14–20. [Google Scholar] [CrossRef]
  35. Li, C.; Somasundaran, P. Reversal of bubble charge in multivalent inorganic salt solutions—Effect of magnesium. J. Colloid Interface Sci. 1991, 146, 215–218. [Google Scholar] [CrossRef]
  36. Yang, C.; Dabros, T.; Li, D.; Czarnecki, J.; Masliyah, J.H. Measurement of the Zeta Potential of Gas Bubbles in Aqueous Solutions by Microelectrophoresis Method. J. Colloid Interface Sci. 2001, 243, 128–135. [Google Scholar] [CrossRef]
  37. Fan, X.; Zhang, Z.; Li, G.; Rowson, N. Attachment of solid particles to air bubbles in surfactant-free aqueous solutions. Chem. Eng. Sci. 2004, 59, 2639–2645. [Google Scholar] [CrossRef]
  38. Elmahdy, A.M.; Mirnezami, M.; Finch, J.A. Zeta potential of air bubbles in presence of frothers. Int. J. Miner. Process. 2008, 89, 40–43. [Google Scholar] [CrossRef]
  39. Sheludko, A. Thin liquid films. Adv. Colloid Interface Sci. 2002, 1, 391–464. [Google Scholar] [CrossRef]
  40. Attard, P.; Miklavcic, S.J. Effective Spring Constant of Bubbles and Droplets. Langmuir 2001, 17, 8217–8223. [Google Scholar] [CrossRef]
  41. Chau, T.; Bruckard, W.; Koh, P.; Nguyen, A.V. A review of factors that affect contact angle and implications for flotation practice. Adv. Colloid Interface Sci. 2009, 150, 106–115. [Google Scholar] [CrossRef] [PubMed]
  42. Kerisit, S.; Schwenzer, B.; Vijayakumar, M. Effects of Oxygen-Containing Functional Groups on Supercapacitor Performance. J. Phys. Chem. Lett. 2014, 5, 2330–2334. [Google Scholar] [CrossRef] [PubMed]
  43. Pan, L.; Yoon, R.-H. Measurement of hydrophobic forces in thin liquid films of water between bubbles and xanthate-treated gold surfaces. Miner. Eng. 2016, 98, 240–250. [Google Scholar] [CrossRef]
  44. Maršálek, R. The Influence of Surfactants on the Zeta Potential of Coals. Energy Sources Part A Recover. Util. Environ. Eff. 2008, 31, 66–75. [Google Scholar] [CrossRef]
  45. Schulze, H.; Stöckelhuber, K.W.; Wenger, A. The influence of acting forces on the rupture mechanism of wetting films—Nucleation or capillary waves. Colloids Surf. A Physicochem. Eng. Asp. 2001, 192, 61–72. [Google Scholar] [CrossRef]
  46. Kondrat’Ev, S.A.; Moshkin, N.P. Estimate of collecting force of flotation agent. J. Min. Sci. 2015, 51, 150–156. [Google Scholar] [CrossRef]
  47. Shen, L.; Liu, L.; Zhu, J.; Qiao, E. Effect of Oleic Acid on Froth Properties and Reverse Flotation Performance of Thermal Coal. Trans. Indian Inst. Met. 2018, 71, 1841–1846. [Google Scholar] [CrossRef]
  48. Liu, Z.; Xia, Y.; Lai, Q.; An, M.; Liao, Y.; Wang, Y. Adsorption behavior of mixed dodecane/n-valeric acid collectors on low-rank coal surface: Experimental and molecular dynamics simulation study. Colloids Surf. A Physicochem. Eng. Asp. 2019, 583, 123840. [Google Scholar] [CrossRef]
Figure 1. The induction time measurement device.
Minerals 11 00058 g001
Figure 2. XPS survey scan result of coal sample.
Minerals 11 00058 g002
Figure 3. The C1s fitting spectra of coal sample.
Minerals 11 00058 g003
Figure 4. Relationship of interaction energy and film thickness between air bubble and coal treated with (a) no reagent, (b) n-dodecane, (c) oleic acid, and (d) mixed collector.
Minerals 11 00058 g004
Figure 5. The linear relationship between hydrophobic force constant and critical film thickness.
Minerals 11 00058 g005
Figure 6. Wetting film thickness as the function of time in the condition of coal treated by (a) no reagent, (b) n-dodecane, (c) oleic acid, and (d) mixed collector.
Minerals 11 00058 g006
Figure 7. The functional relationship between hydrophobic force constant and induction time.
Minerals 11 00058 g007
Table 1. Ultimate analysis of coal sample.
Ultimate Analysis (%)
CdafHdafOdafNdafSt,d
75.554.9615.351.052.07
Table 2. Results of induction time and zeta potential measurement.
NumberNo ReagentDOAMC
InTZePInTZePInTZePInTZeP
11175−20.57595−19.0865−16.5860−12.66
21065−35.45495−18.39105−10.3655−15.32
31140−19.14535−19.4190−12.8235−14.71
41095−18.93575−22.1995−11.3365−13.97
51150−23.61555−21.18105−18.7625−15.84
AVE1125−23.54551−20.0592−13.9748−14.50
STDVE39.626.1934.411.4114.703.2015.361.11
InT and ZeP represents induction time and zeta potential, respectively, AVE represents average value of data, and STDVE represents standard deviation.
Table 3. The hydrophobic constant and the corresponding wetting film thickness of coal treated with different reagent.
h c r K 132 ( J )
4.0 × 10−196.0 × 10−198.0 × 10−199.0 × 10−191.0 × 10⁻¹⁸
No reagent576575-87
D677987-95
OA95109124130-
MC92105119127-
Table 4. The calculation value of induction time t b corresponding to different hydrophobic force constants.
Induction   Time   t b ( s )
K 132 ( J )
4.0 × 10−196.0 × 10−198.0 × 10−199.0 × 10−191.0 × 10⁻¹⁸
No reagent1.1930.8990.659-0.472
D0.8570.5940.472-0.381
OA0.3840.2670.1820.156-
MC0.4160.2950.2070.168-
Table 5. Hydrophobic force constant between air bubbles and coal particles treated with different reagents.
Reagent Actual Induction   Time   t i n d   ( s ) K 132 - t i n d   Function   Model Calculation   Value   of   K 132   ( J )
No reagent1.125 K 132 = 1.8370 × 10 18 × e 1.2669 t i n d 4.42 × 10⁻¹⁹
D0.551 K 132 = 1.9758 × 10 18 × e 1.8986 t i n d 6.94 × 10⁻¹⁹
OA0.092 K 132 = 1.5337 × 10 18 × e 3.5084 t i n d 1.11 × 10⁻¹⁸
MC0.048 K 132 = 1.5721 × 10 18 × e 3.2817 t i n d 1.34 × 10⁻¹⁸
Publisher’s Note: MDPI stays neutral with regard to jurisdictional claims in published maps and institutional affiliations.

