Article

Formation of Ultramylonites in an Upper Mantle Shear Zone, Erro-Tobbio, Italy

Institut für Geowissenschaften, Goethe-Universität Frankfurt am Main, Altenhöferallee 1, 60438 Frankfurt am Main, Germany
*
Authors to whom correspondence should be addressed.
Minerals 2021, 11(10), 1036; https://doi.org/10.3390/min11101036
Submission received: 25 August 2021 / Revised: 21 September 2021 / Accepted: 22 September 2021 / Published: 24 September 2021

Abstract

:
Deformation in the upper mantle is localized in shear zones. In order to localize strain, weakening has to occur, which can be achieved by a reduction in grain size. In order for grains to remain small and preserve shear zones, phases have to mix. Phase mixing leads to dragging or pinning of grain boundaries which slows down or halts grain growth. Multiple phase mixing processes have been suggested to be important during shear zone evolution. The importance of a phase mixing process depends on the geodynamic setting. This study presents detailed microstructural analysis of spinel bearing shear zones from the Erro-Tobbio peridotite (Italy) that formed during pre-alpine rifting. The first stage of deformation occurred under melt-free conditions, during which clinopyroxene and olivine porphyroclasts dynamically recrystallized. With ongoing extension, silica-undersaturated melt percolated through the shear zones and reacted with the clinopyroxene neoblasts, forming olivine–clinopyroxene layers. Furthermore, the melt reacted with orthopyroxene porphyroclasts, forming fine-grained polymineralic layers (ultramylonites) adjacent to the porphyroclasts. Strain rates in these layers are estimated to be about an order of magnitude faster than within the olivine-rich matrix. This study demonstrates the importance of melt-rock reactions for grain size reduction, phase mixing and strain localization in these shear zones.

1. Introduction

Strain in the upper mantle is inhomogeneously distributed. The deformation is localized in zones of high strain, i.e., shear zones. Shear zones control the deformation of the upper mantle (e.g., [1,2,3]) and are important for plate tectonics (e.g., [4,5]). It is therefore essential to know why, how and when strain localizes.
Initiation of strain localization occurs when certain domains in the upper mantle are weaker than others. Compositional (e.g., presence of melt or fluids), physical (e.g., temperature) and microstructural variations (e.g., grain size, crystallographic preferred orientation (CPO)) in the upper mantle can influence the viscosity (review in [6]). The viscosity of olivine, the volumetrically dominant mineral in the upper mantle, decreases when it incorporates water [7,8,9], and when small fractions (0.03–0.04) of melt are present [10,11,12]. An increase in temperature decreases the strength of olivine and pyroxenes (the main minerals in the upper mantle) (e.g., [1,13,14]). A smaller grain size leads to a decrease in viscosity when deformation occurs by diffusion, or by dislocation-accommodated grain boundary sliding (disGBS) (e.g., [13,14]). When dislocation creep is dominant, a CPO develops. A CPO has an influence on olivine strength, as olivine is viscously anisotropic (e.g., [15,16,17]). During ductile deformation, the pre-existing variations in viscosity can cause the initiation of strain localization, leading to the formation of shear zones in the upper mantle (e.g., [15,18,19]). In addition, at lower temperatures and high stresses, the occurrence of brittle processes (seismic) followed by ductile processes (postseismic creep) leads to strain localization in the upper mantle (e.g., [2,20]).
In order for strain to remain localized with ongoing ductile deformation, a positive feedback process between deformation and weakening has to occur, i.e., strain softening [2]. Strain softening processes can be divided in four classes [2]: thermal softening, geometrical softening, reaction softening and microstructural softening.
Thermal softening originates from shear heating, which is strain-rate dependent [21]. With increasing temperature, the strain rate increases, leading to an increase in temperature, leading to a positive feedback. Recent models show that shear heating is important in the generation of intermediate depth earthquakes (50–300 km) in a narrow temperature interval (600–800 °C) (e.g., [21,22]). However, the models also show that this process can only occur in pre-existing well-mixed fine-grained shear zones. The mixing of phases is necessary in order for other minerals to pin the migrating olivine grain boundary during grain growth occurring under static [23] or dynamic [24] conditions at the elevated temperatures. Otherwise, rapid grain growth in olivine [25] would lead to strain hardening during deformation, negating the strain softening. Large-scale models also show the importance of the positive feedback during shear heating in order to develop large-scale lithospheric faults (e.g., [19]).
Geometrical softening is due to the evolution of an olivine CPO. The strength of the CPO will increase with increasing strain, when strain is accommodated by dislocation creep, leading to a positive feedback (e.g., [17,26]). This process has been suggested as being important for shear localization in an upper mantle shear zone with no large grain size variation [15] and for the reactivation of pre-existing shear zones [16].
Reaction softening is caused by the formation of weak interconnected fine-grained polyphase bands of olivine and other minerals (e.g., olivine-opx, olivine-amphibole) or interconnected bands of a weak mineral (e.g., talc, serpentine) [2]. When the grain size in the polyphase bands is small enough they can deform by diffusion creep and lead to strain softening, which has been observed in natural shear zones (e.g., [27]). The fine grain size in polyphase material can persist due to the pinning process (e.g., [23,24,28]). The viscosity of the polyphase bands is either determined by the mineral that is interconnected in the bands [29] or by a composite rheology (e.g., [30,31]). Reactions in the upper mantle can be caused by the infiltration of fluids or melts or a change in PT conditions (metamorphic reactions). Melts and fluids can preferentially infiltrate in shear zones due to creep cavitation formed during grain boundary sliding [32,33,34], leading to a positive feedback mechanism and strain softening (e.g., [35,36,37,38,39]). The importance of reactions for the evolution of deformation has been determined in natural shear zones, be it metamorphic reactions (e.g., [27]), melt rock reactions (e.g., [40]) or hydration reactions (e.g., [41]).
Microstructural softening occurs when the grain size decreases during dislocation creep due to dynamic recrystallization [24,42] or during brittle deformation. The steady state olivine grain size during dislocation creep depends on stress [43]. However, dislocation creep is a grain size-independent deformation mechanism, and therefore the reduction in grain size will not result in a softening. A softening does occur when there is a change from dislocation creep to a grain size-dependent deformation mechanism. It has been shown in deformation experiments on olivine that disGBS is an important deformation mechanism under upper mantle conditions [13]. This process is grain size-sensitive and a reduction in grain size during deformation would result in softening (e.g., [44,45]). An even larger factor of softening will occur when the deformation process changes to diffusion creep, which has a larger grain size sensitivity. In order to keep the olivine grain size small, it is also important that phase mixing occurs during this softening process (e.g., [14,18,46,47]).
The evolution of microstructures from outside to the center of upper mantle shear zones often shows the evolution from a coarse-grained (millimeter sized) microstructure to a well-mixed fine-grained (tens of microns) microstructure (e.g., [36,48,49,50,51]). It has been shown that the olivine grain size depends on the amount of other minerals present [28,46,47,52], indicating the effectiveness of pinning to inhibit grain growth. Large-scale models show the importance of pinning in preserving shear zones and therefore in the generation of plate tectonics [53,54]. The models, microstructural evolution in mantle shear zones, and several softening processes indicate the importance of grain size reduction and phase mixing processes on shear zone development. Recent studies have focused on phase mixing processes. Reactions (e.g., [27,37,55], grain boundary sliding (e.g., [51,56,57,58]), creep cavitation and nucleation (e.g., [55] and dissolution-precipitation [36] can lead to the mixing of phases.
However, in order to determine which phase mixing processes are important during upper mantle shear zone evolution, shear zones from different geodynamic settings have to be studied in detail. In addition, the effect of the phase mixing process on strain localization is important to quantify. For this purpose, we analyzed the microstructures of the Erro-Tobbio peridotite in the Ligurian Alps, Northwest Italy. The peridotite was exhumed during rifting in Late Carboniferous-Permian times (e.g., [59,60]). The first shear zones occurred during a first melt-free stage of rifting (thinning of the lithosphere by a factor of 2 [61]). After the first stage, ongoing thinning of the lithosphere leads to decompression melting of the asthenosphere and to melt percolation in the shear zones under spinel-facies conditions (e.g., [60,61]). Melts that reached the plagioclase-facies conditions in the Erro-Tobbio peridotites were silica-saturated due to extensive melt-rock reactions (e.g., [59,60]). These melts formed plagioclase-enriched peridotites and gabbro-norite pods (e.g., [60]).
Due to the extensive melt percolation during deformation, the spinel bearing shear zones of the Erro-Tobbio peridotite are ideal to analyze the importance of melt-rock reactions on phase mixing and strain localization. Our detailed microstructural analysis shows the importance of reactions of silica-undersaturated melts with dynamically recrystallized clinopyroxene (cpx) neoblasts and orthopyroxene (opx) porphyroclasts to form fine-grained mixtures of cpx + olivine ± opx ± spinel and mixtures of opx + olivine ± cpx ± spinel, respectively. The opx-rich fine-grained layers interconnect to form ultramylonitic layers on a thin section scale. The strain rate in these layers is estimated to be one order of magnitude faster than in the olivine-rich matrix.

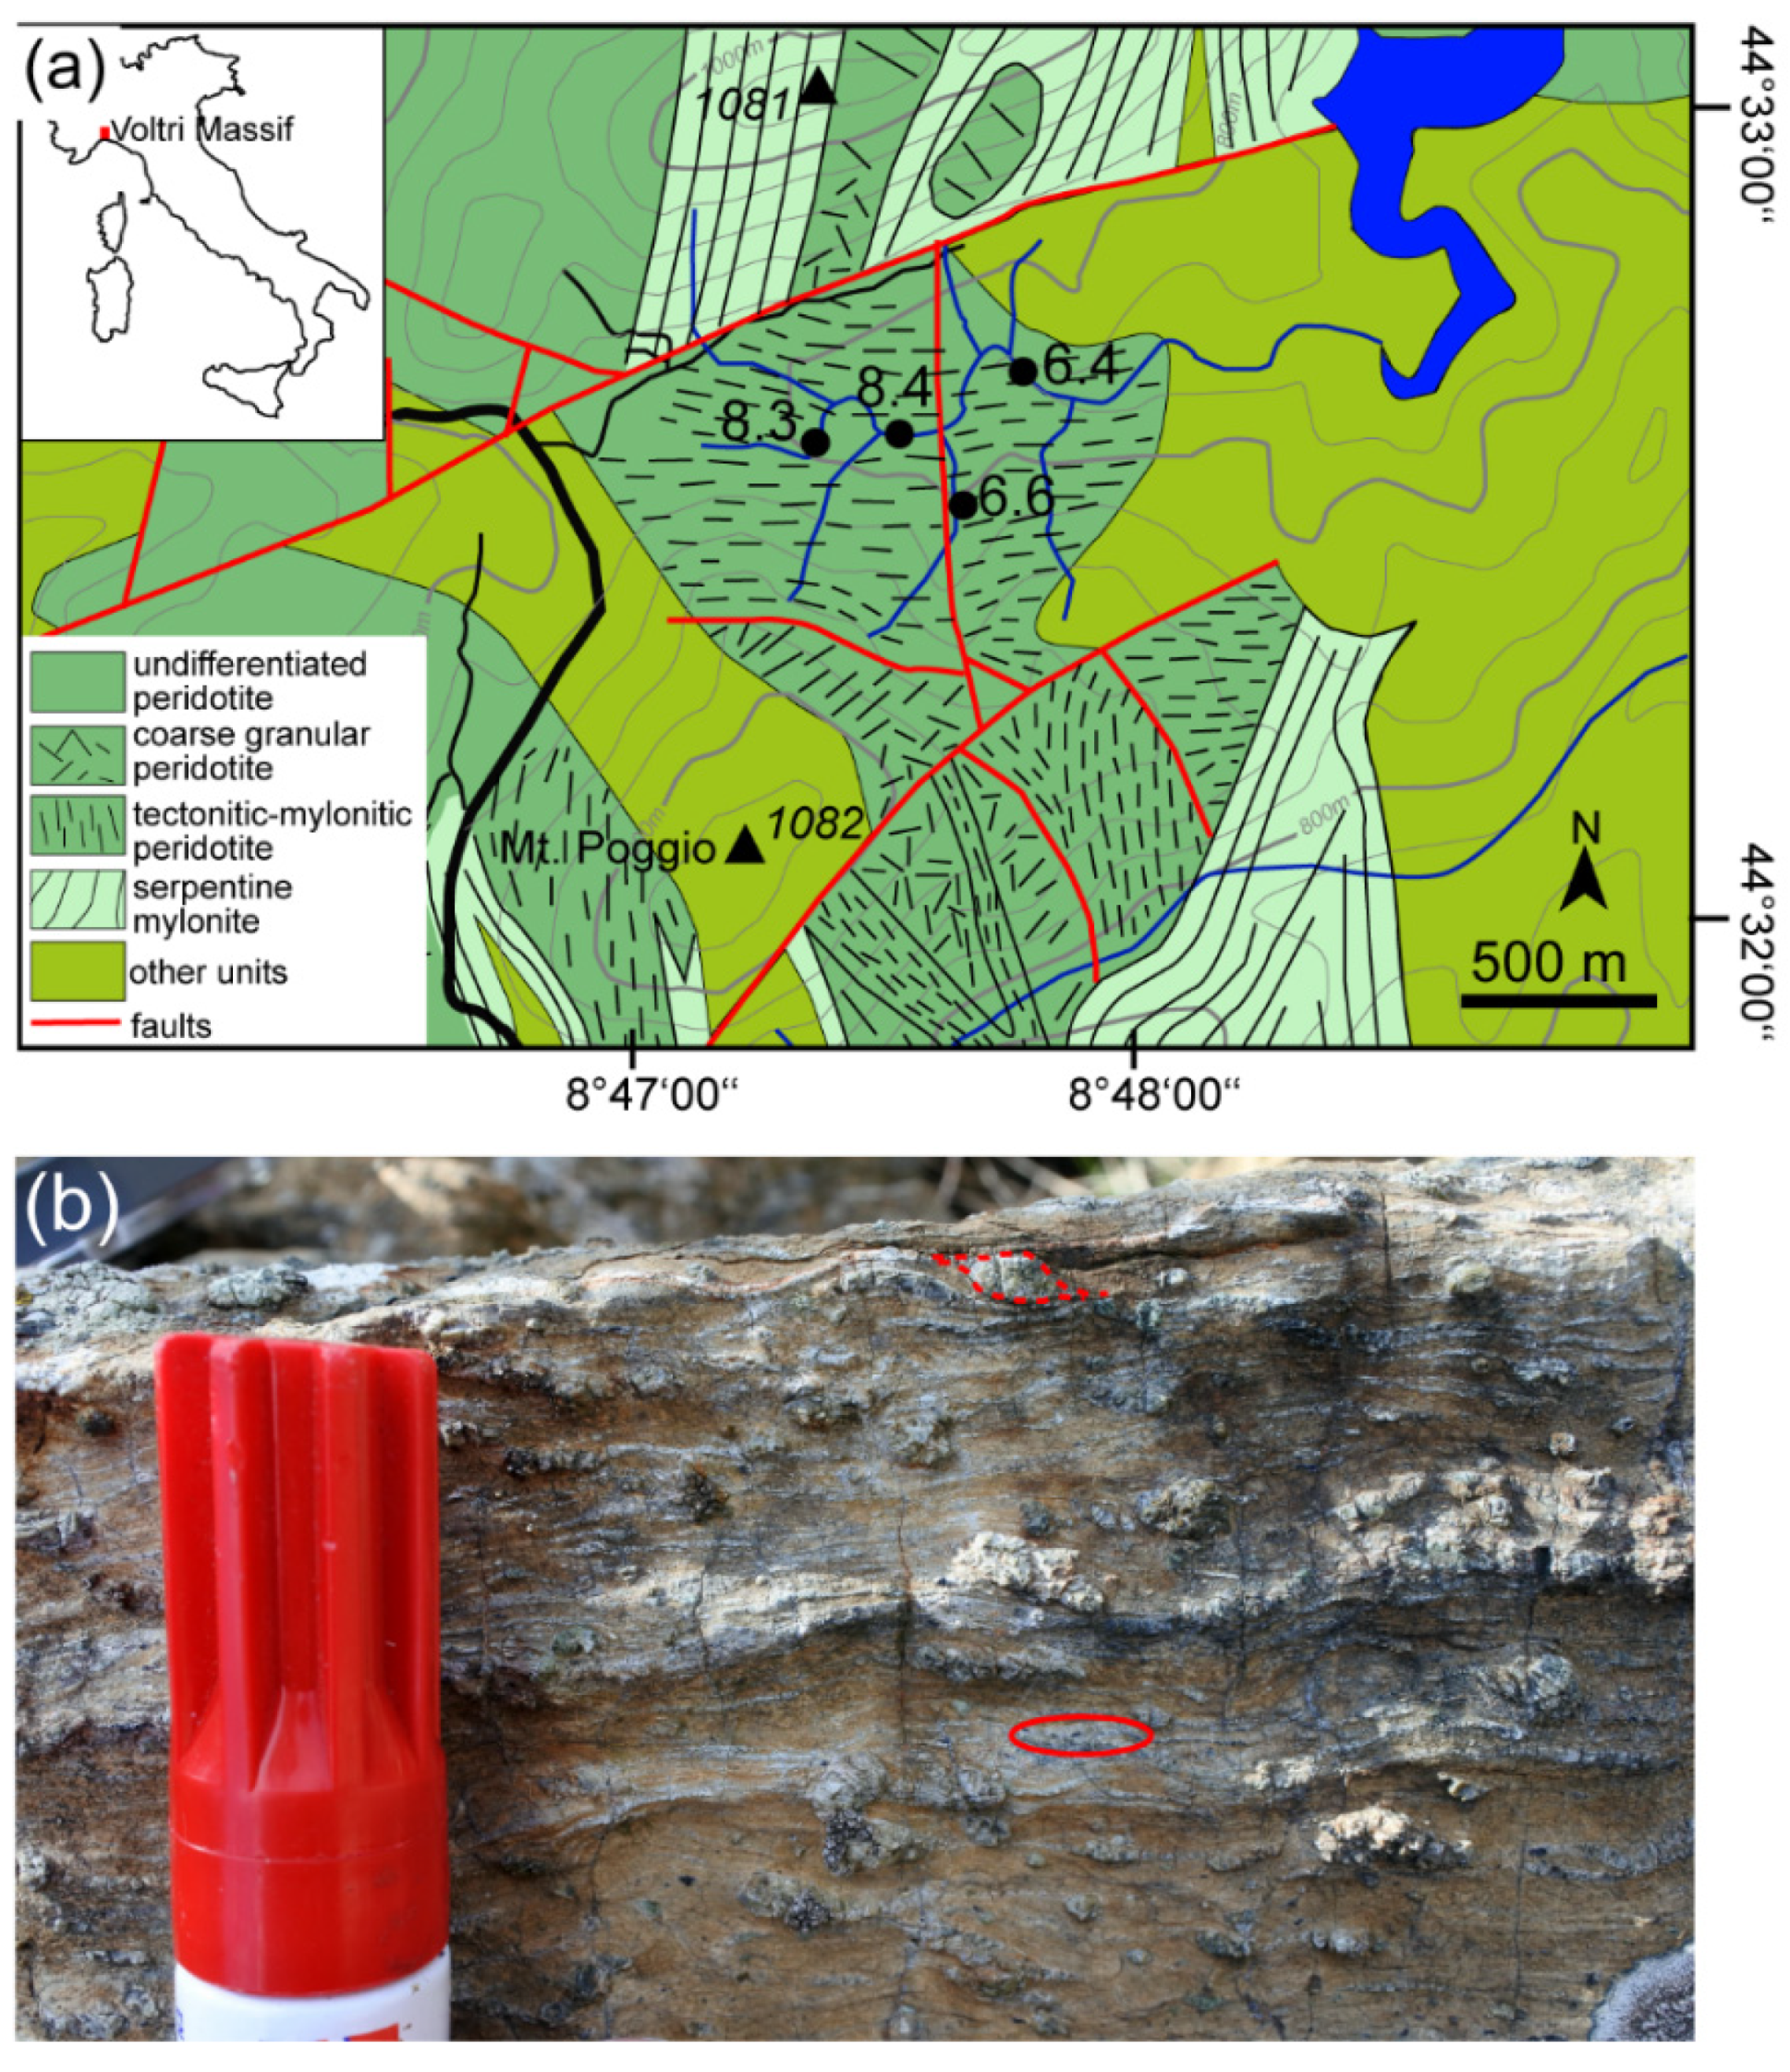
2. Geological Setting

The Erro-Tobbio peridotite is located in the Voltri Massif in the Ligurian Alps, Northwest Italy and is a remnant of the Jurassic Ligurian Tethys [62]. The peridotite exhumed due to extension of the subcontinental lithosphere during Late Carboniferous-Permian times [59]. Ongoing exhumation occurred during the opening of the Tethys in Jurassic times [3].
The exhumation took place along five generations of shear zones, active at progressively decreasing PT conditions from spinel tectonite, plagioclase-, hornblende-, chlorite-bearing peridotite mylonites and serpentine mylonites [41]. Opx and spinel clusters in lithospheric spinel peridotites have been interpreted as being breakdown products from garnet [2]. Spinel tectonites and mylonites occur in kilometer-scale shear zones, were the fine-grained mylonites are superimposed on less-deformed tectonites [61,62]. Temperatures calculated with pyroxene geothermometers give a temperature of 960–970 °C [59] for the spinel tectonites. These shear zones are thought to form during the early melt-free extension of the subcontinental lithosphere (e.g., [62]). As a consequence of this early thinning of the lithosphere, near-adiabatic upwelling of the asthenosphere led to decompression melting and percolation of MORB-type melts during progressive extension [62]. This is evidenced by spinel harzburgites and dunites at several locations that are parallel to the spinel lherzolite tectonites and mylonites, indicating that silica-undersaturated melt is percolated by channeled porous flow along the pre-existing spinel-facies shear zones [61]. Locally, the spinel peridotites are transformed to plagioclase-enriched peridotites (e.g., [61,62]). The high amount of plagioclase (frequently more than 10–15%), indicates that the plagioclase is not metamorphic but formed due to the interstitial crystallization of silica-saturated melt [62]. During ongoing exhumation, deformation occurred in these plagioclase peridotites, forming plagioclase peridotite tectonites and shear zones in the south of Erro-Tobbio (e.g., [41,61]). These shear zones cut the spinel shear zones at a high angle [58]. Geothermometry calculations indicate a temperature of 910–960 °C for the plagioclase tectonites [59].
In the hornblende-bearing mylonites the pyroxene porphyroclasts show a syntectonic breakdown to very fine-grained (2–30 µm) mixtures of olivine + amphibole + clinopyroxene + spinel ± orthopyroxene [38]. The formation of these fine-grained bands and the local occurrence of hornblende porphyroclasts within the olivine matrix indicate pre- and synkinematic infiltration of fluids [38]. The pyroxenes geothermometry calculations give temperatures of 790–880 °C for the amphibole-bearing shear zones [59]. The last stages of exhumation at low temperatures and pressures are indicated by the occurrence of chlorite-bearing (500–800 °C) and serpentine (300–500 °C) mylonites [38].
Following exhumation, subduction took place during the closing of the Jurassic Ligurian Tethys to eclogite-facies conditions during the Alpine collision. Subsequent rapid exhumation within a serpentine subduction channel occurred, preserving the almost unaltered peridotites (e.g., [63]).
All four samples were taken within the tectonite-mylonite peridotite, located to the west of Lake Badana (Figure 1a). In the field, clasts of mainly orthopyroxene are clearly visible, and some show a component of simple shear (Figure 1b). Thin opx-rich layers alternating with olivine-rich layers are observed (Figure 1b). Some of the layers include elongated spinel clasts (Figure 1b).

3. Materials and Methods

Samples were cut perpendicular to the foliation and parallel to the lineation (XZ section). Thin sections were cut and polished to a thickness of ~30 µm. With an optical light microscope, representative microstructures were determined and selected for further analysis.
For electron backscatter diffraction analysis (EBSD) analysis, thin sections were polished for approximately 15 min with colloidal silica. Combined EBSD and energy dispersive X-ray analysis (EDX) were conducted at the Goethe University in Frankfurt (Germany), and the University of Cologne (Germany) on carbon-coated samples. At the Institute of Geoscience in Frankfurt, a JEOL JSM-6490 scanning electron microscope (SEM) was used. Measurement settings for EBSD were an acceleration voltage of 15 kV and a beam current of ~8 nA. For data acquisition, the program Flamenco (Oxford Instruments HKL Channel 5) and a Nordlys camera (Oxford Instruments) were used. At the Institute for Geology and Mineralogy in Cologne, EDX and EBSD measurements were conducted with a Zeiss Sigma 300-VP field emission SEM equipped with a NordlysNano detector (Oxford Instruments). The acceleration voltage was set to 20 kV. For the data acquisition, the program Aztec was used (Oxford Instruments). The step size was adapted to measured grain sizes in order for every grain to have at least 10 measurement points. The total range of step sizes is from 1–2.22 µm. In Cologne, element maps (O, Mg, Al, Si, Ca, Cr, Mn, Fe) were obtained simultaneously.
The EBSD data were cleaned from systematic misindexing of olivine (similar diffraction patterns for orientations rotated 60° around [100]) with Oxford Instruments HKL Channel 5 software. Subsequently, the data were loaded into the MTEX 5.6 extension for MATLAB (e.g., Bachmann et al., 2010) (http://mtex-toolbox.github.io/, accessed on 3 March 2013). All additional data processing and analysis were conducted with MTEX 5.6 (http://mtex-toolbox.github.io/, accessed on 3 March 2013). The MTEX script used for cleaning, grain detection (grain internal misorientation < 15°) and subgrain detection (misorientation angle between subgrains < 15°), deletion of boundary and badly indexed grains, crystallographic and boundary analysis, etc., is available on request from the authors. During grain reconstruction, resulting data were continuously checked against backscattered/forescattered, band contrast images and EDX data if present. The equivalent circular diameter (ECD) was calculated for all grains. EBSD and EDX maps were used to calculate phase abundances by area percentage throughout the text and the figures, phase abundances are given by “%” referring to area %. Grain boundary analysis was accomplished by calculating phase-specific boundary lengths. Phase (e.g., ol-opx) to grain (e.g., ol-ol, opx-opx) boundary percentages were used to determine the “mixing intensity”. Pole figures (lower hemisphere orientation density plots) of the main phases were plotted with MTEX. A minimum number of 100 orientations (one point per grain) was used. ODF calculation was performed with grain mean orientations and a consistent halfwidth of 15°. To be able to compare the orientation density plots, the color coding is consistently depicted from min = 0 mrd (multiple of random distribution) = blue for a random orientation to max = 3 mrd = red. Higher mrd’s than 3 are also colored red. The J-index and M-index were calculated for the CPO, which is a measurement of the strength of a CPO [64,65]. The M-index is 0 for a completely random fabric and 1 for a single crystal fabric.
Microprobe measurements were conducted using a JEOL JXA-8530F Plus microprobe with field emission located at the Institute of Geoscience at the Goethe University Frankfurt. The microprobe is equipped with 5 wavelength-dispersive spectrometers. The acceleration voltage was 15 kV and a beam current of 20 nA was used for 20 s (Al, Cr, Ca, Na, Mn, Fe, Ni), 30 s (K, Ti) or 40 s (Mg, Si) peak and 20 s background measuring time. The spot-size was adjusted to the grain size with minimum spot sizes of 1 µm for small grained neoblasts and maximum 4 µm for porphyroclasts. Microprobe data were used to calculate equilibration temperatures of neoblast assemblages and porphyroclasts. Neoblasts are mostly exsolution free, therefore calculated T estimates are thought to be accurate. In opx porphyroclasts with cpx exsolution lamellae, we calculated temperatures based on the host porphyroclast chemistry, ignoring exsolution lamellae. Temperature estimates are therefore minimum estimates. We used the two pyroxene geothermometer (T2-pyx) and Ca in opx geothermometer (TCa-in-opx) calibrated by [66]. In addition, we used the Al and Cr in the opx (TAl-Cr-in-opx) geothermometer calibrated by [67].

4. Results

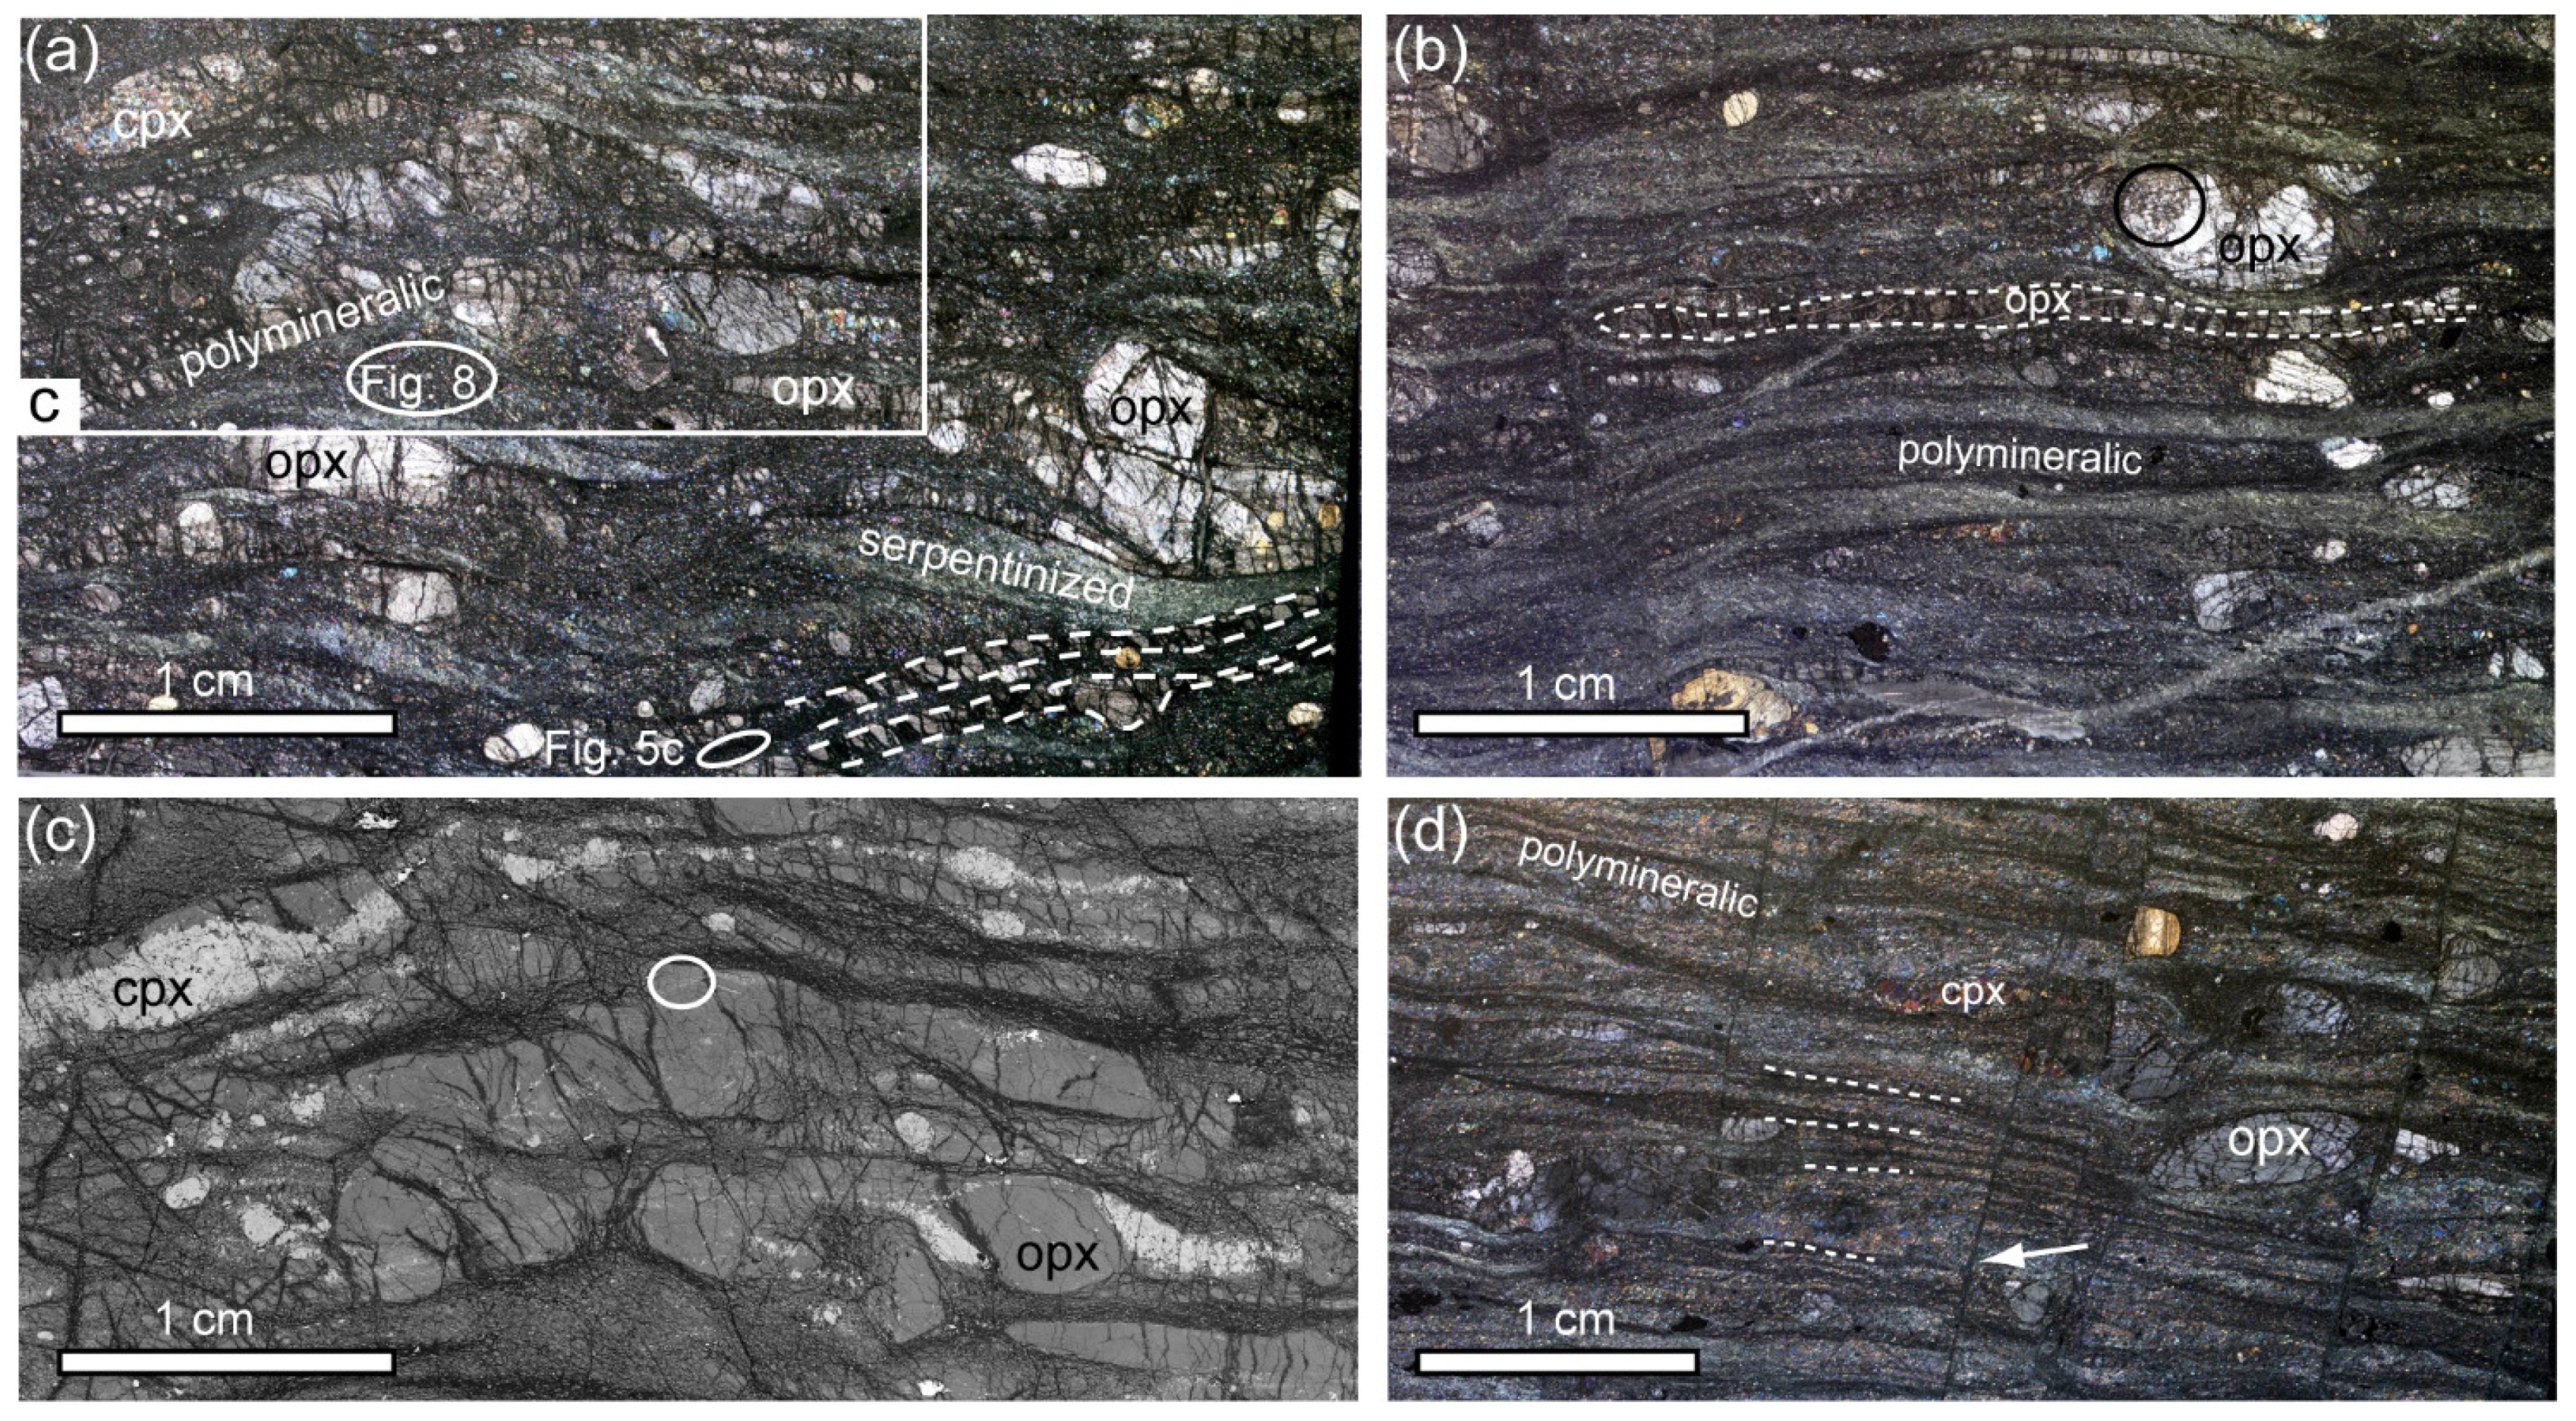
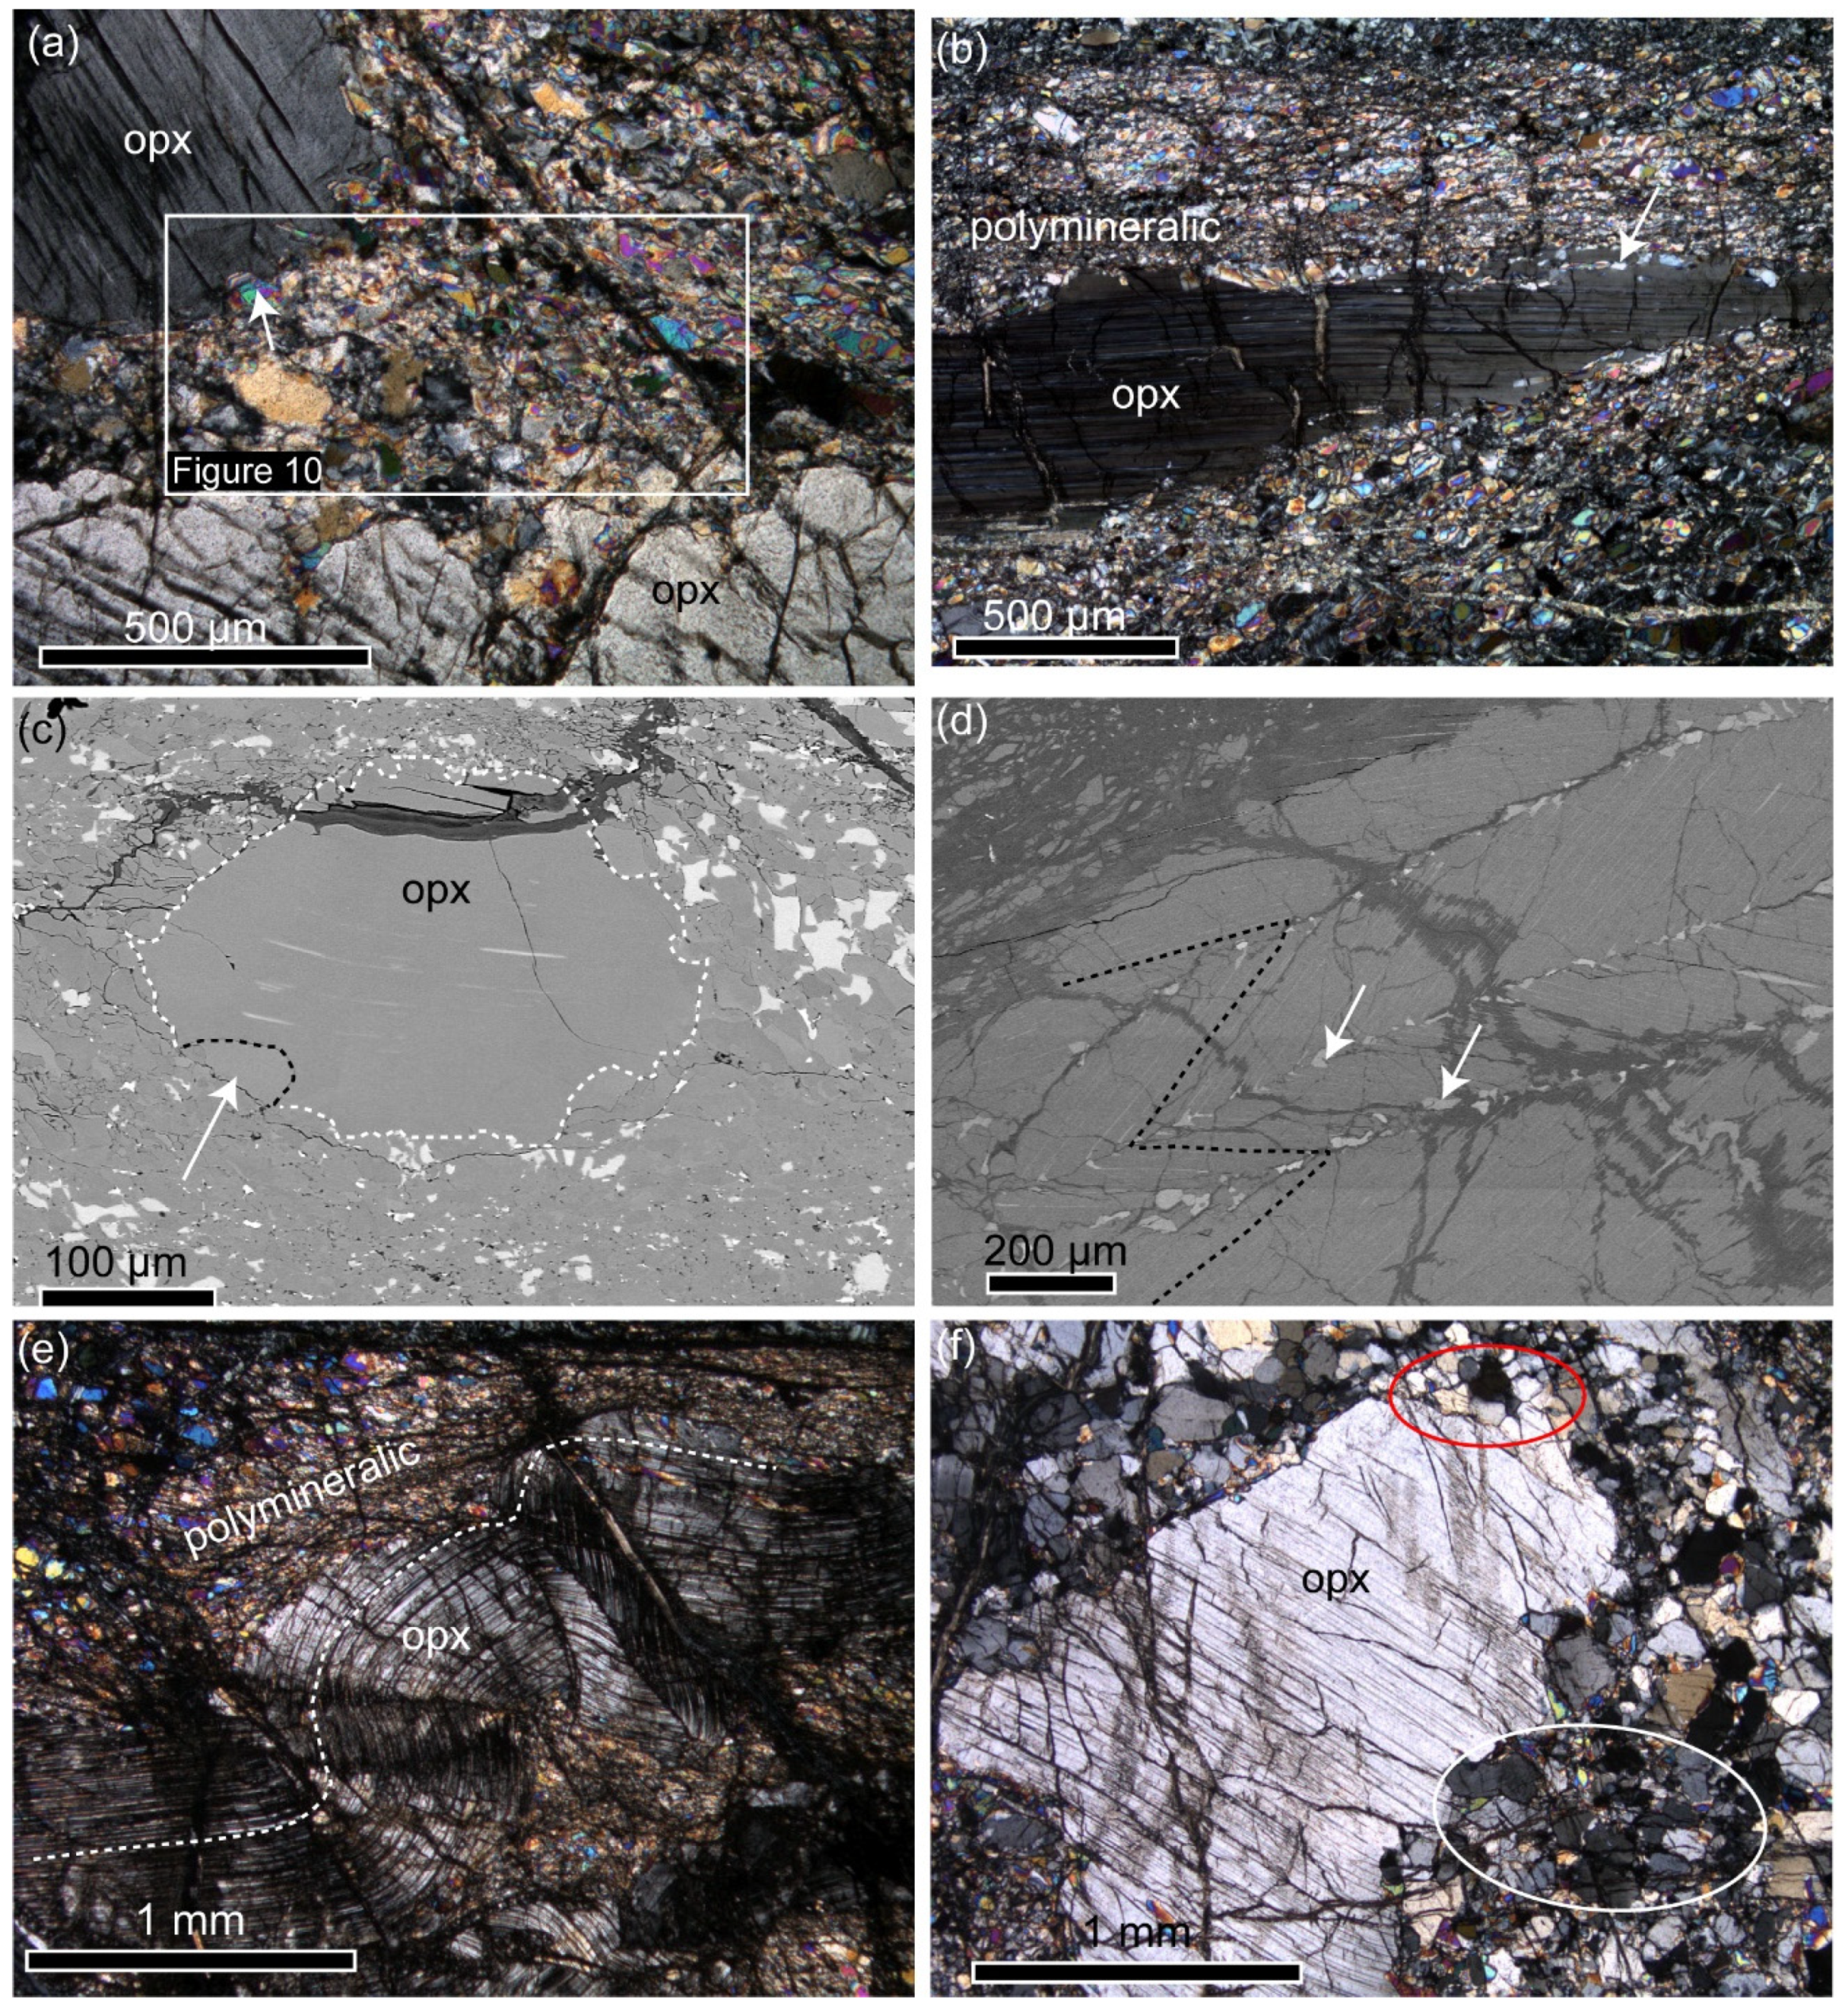
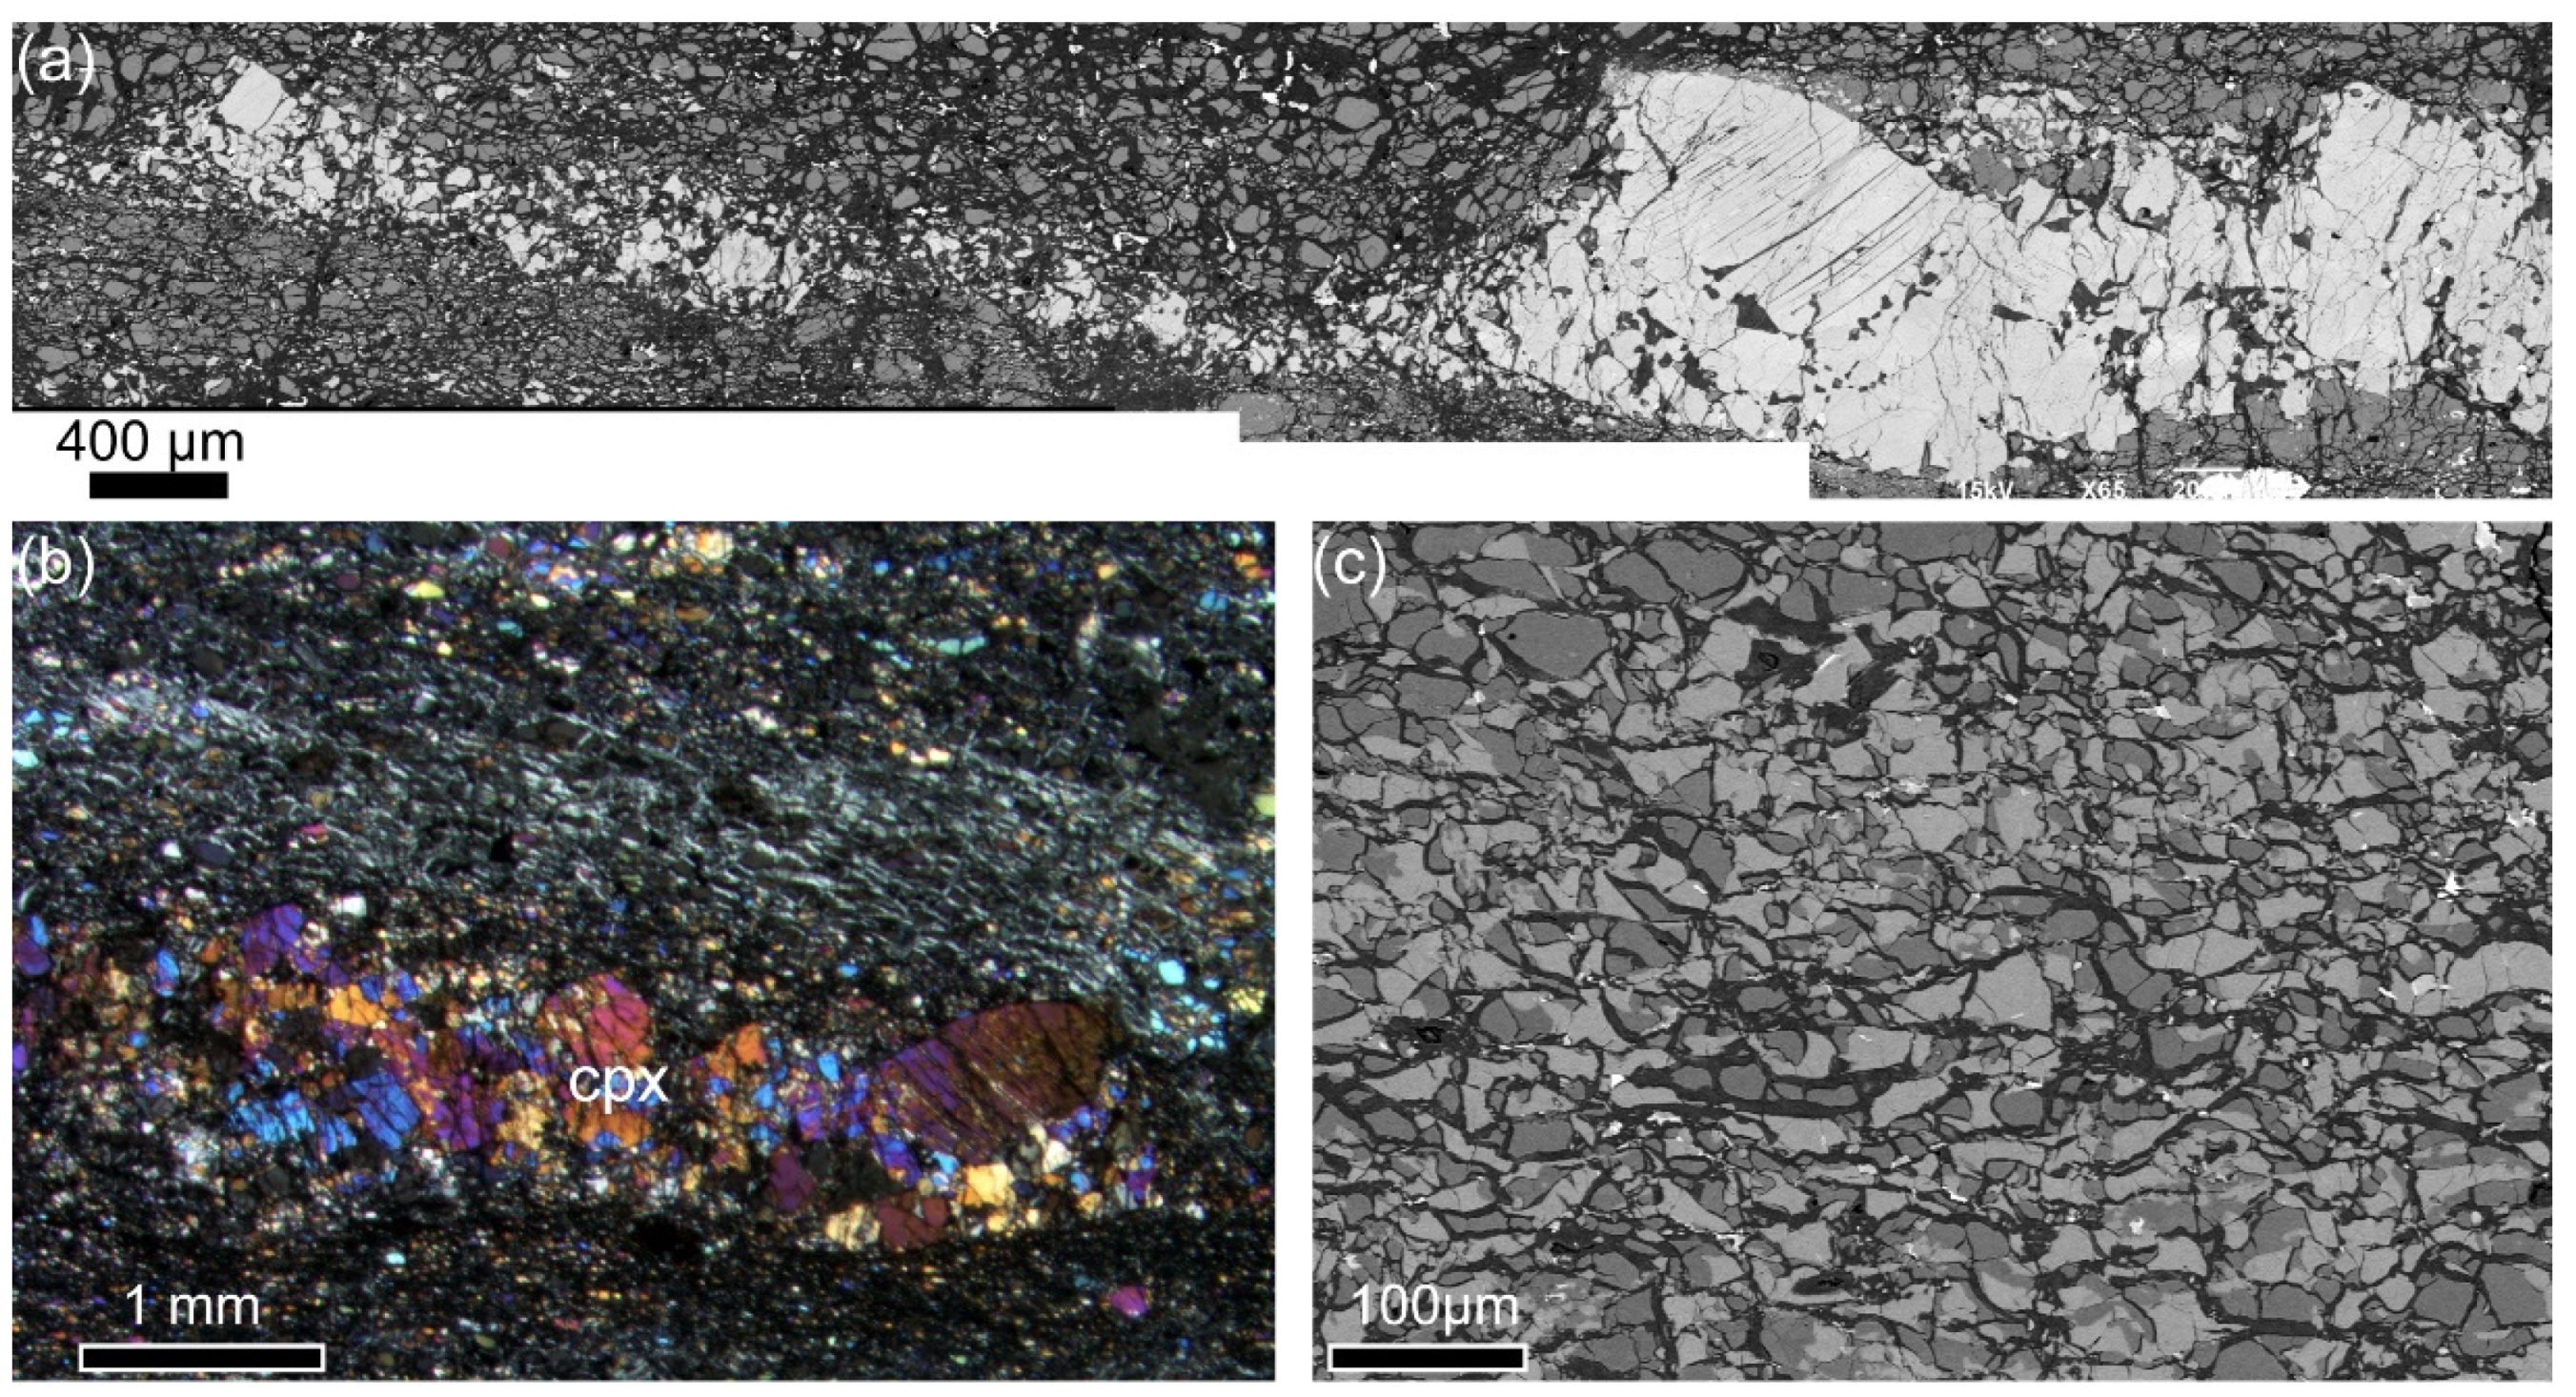
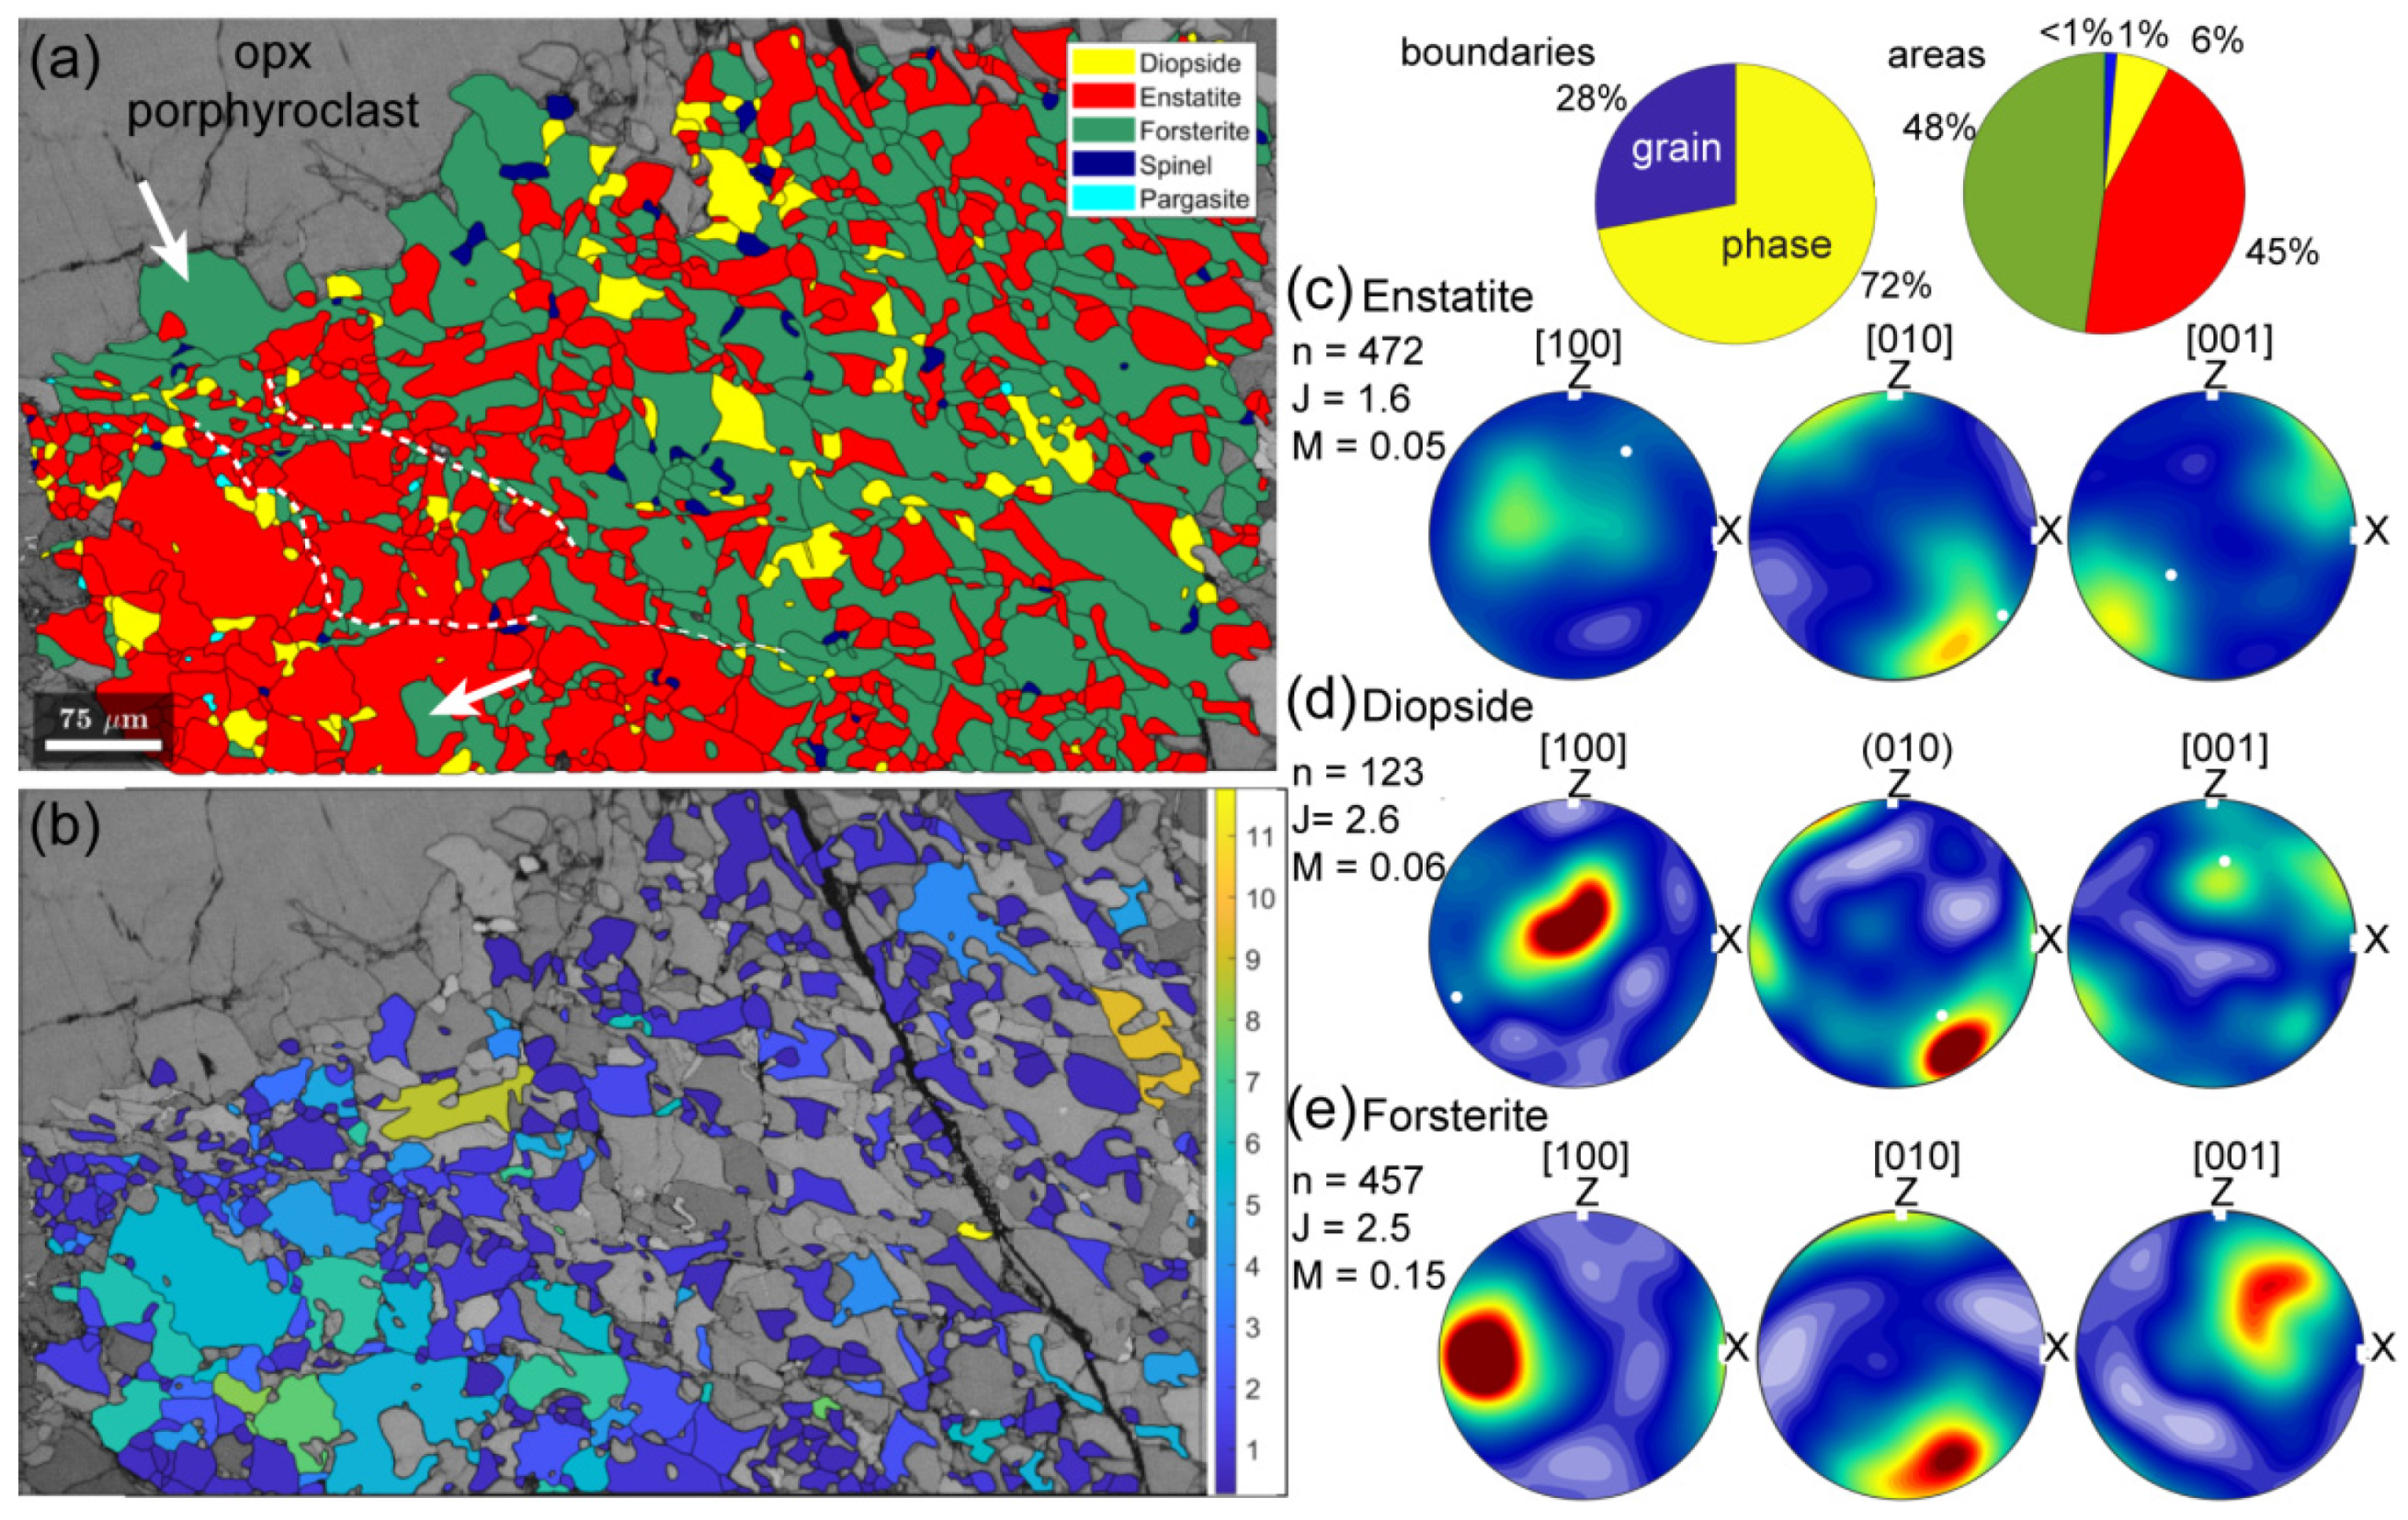
4.1. Sample Description
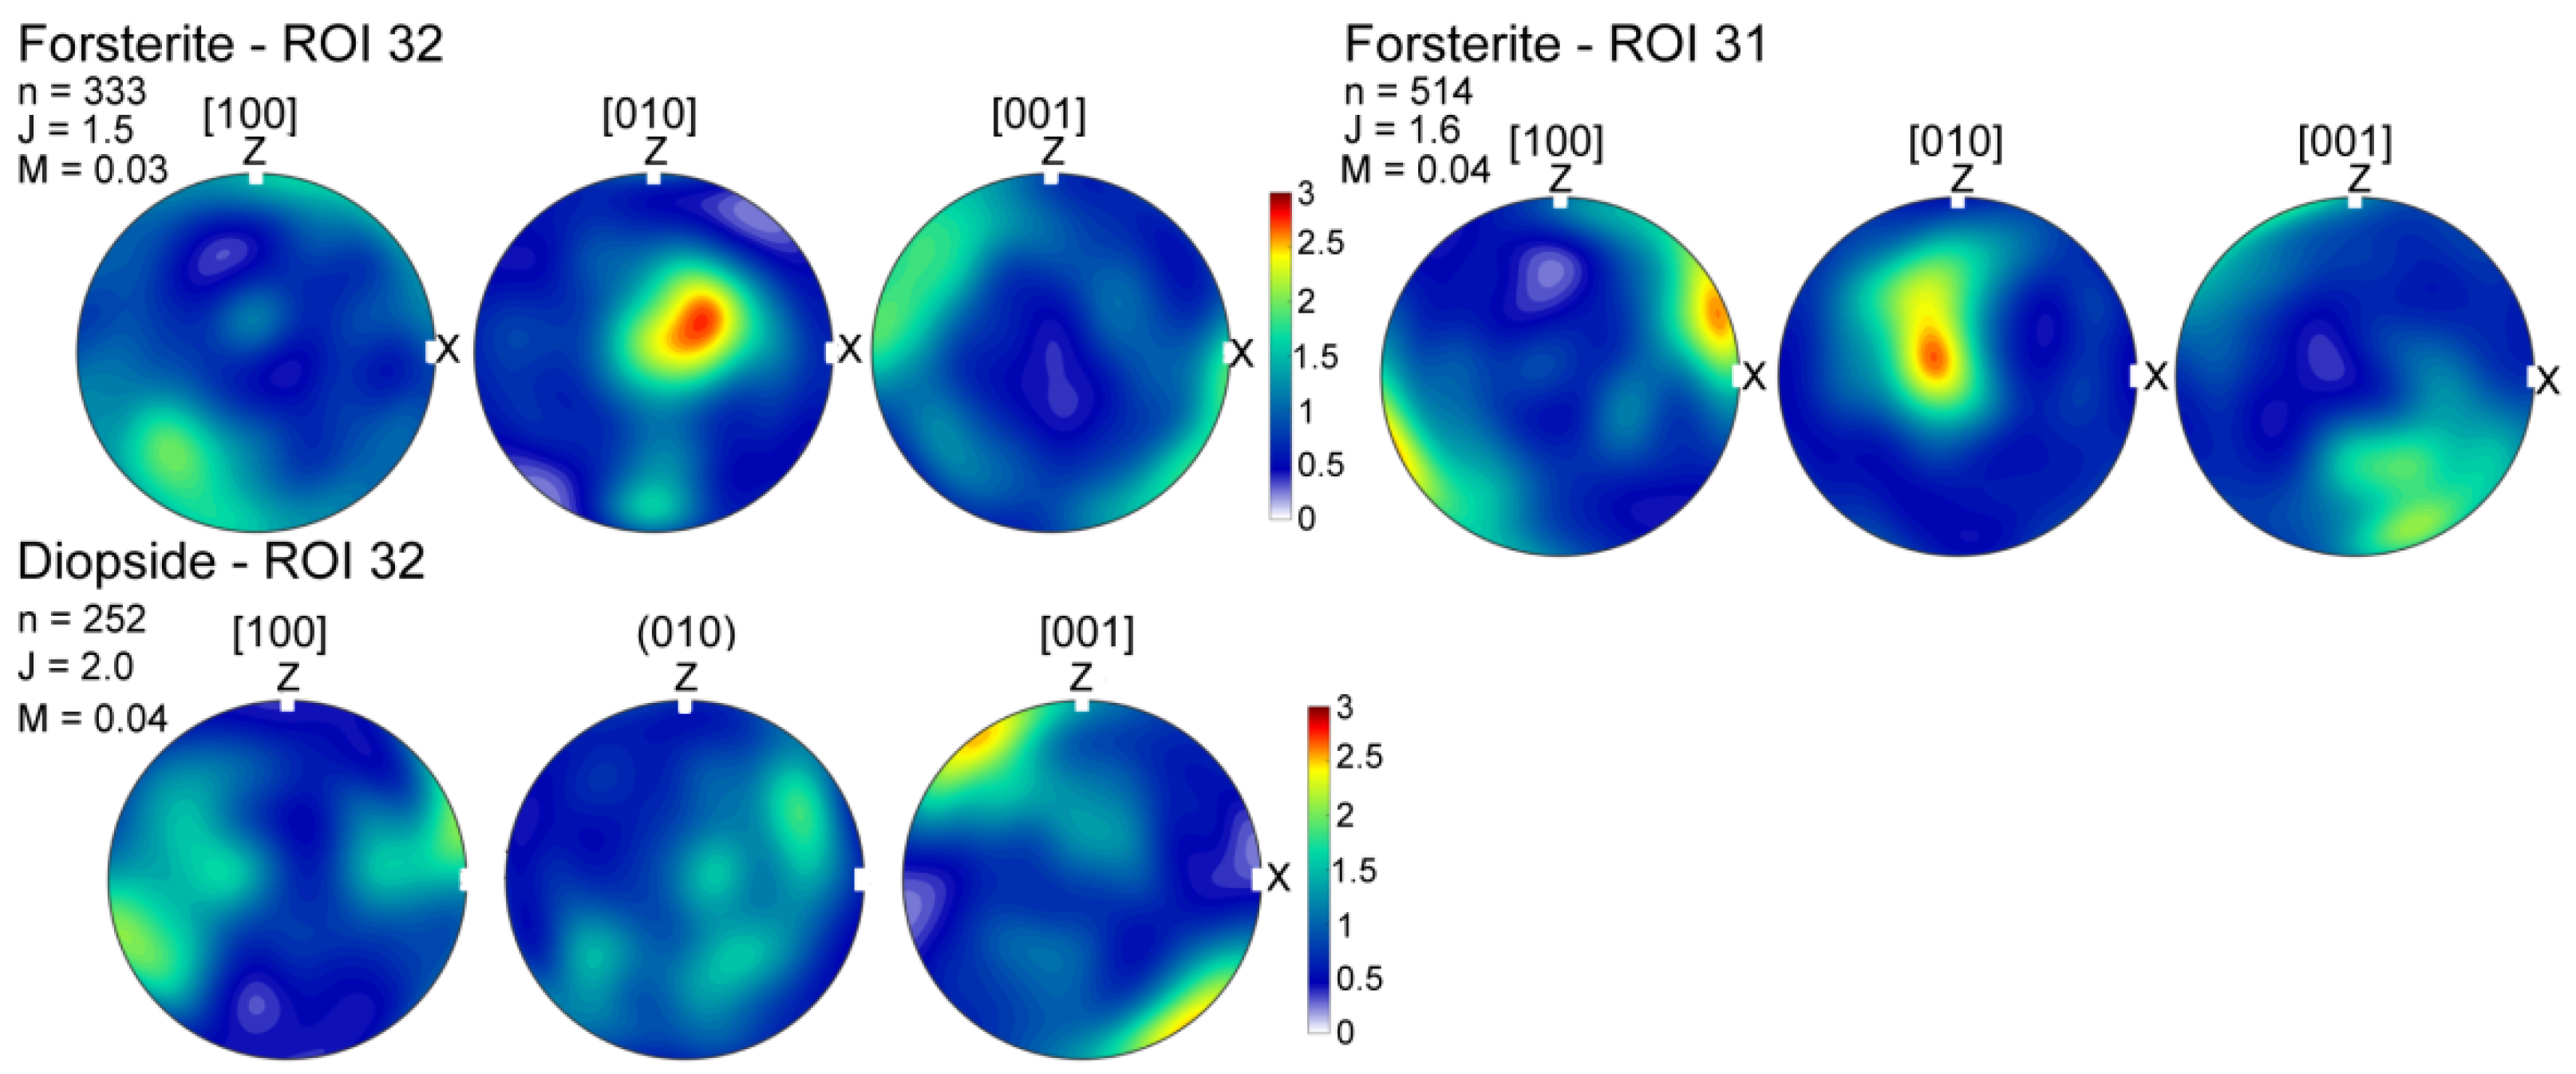
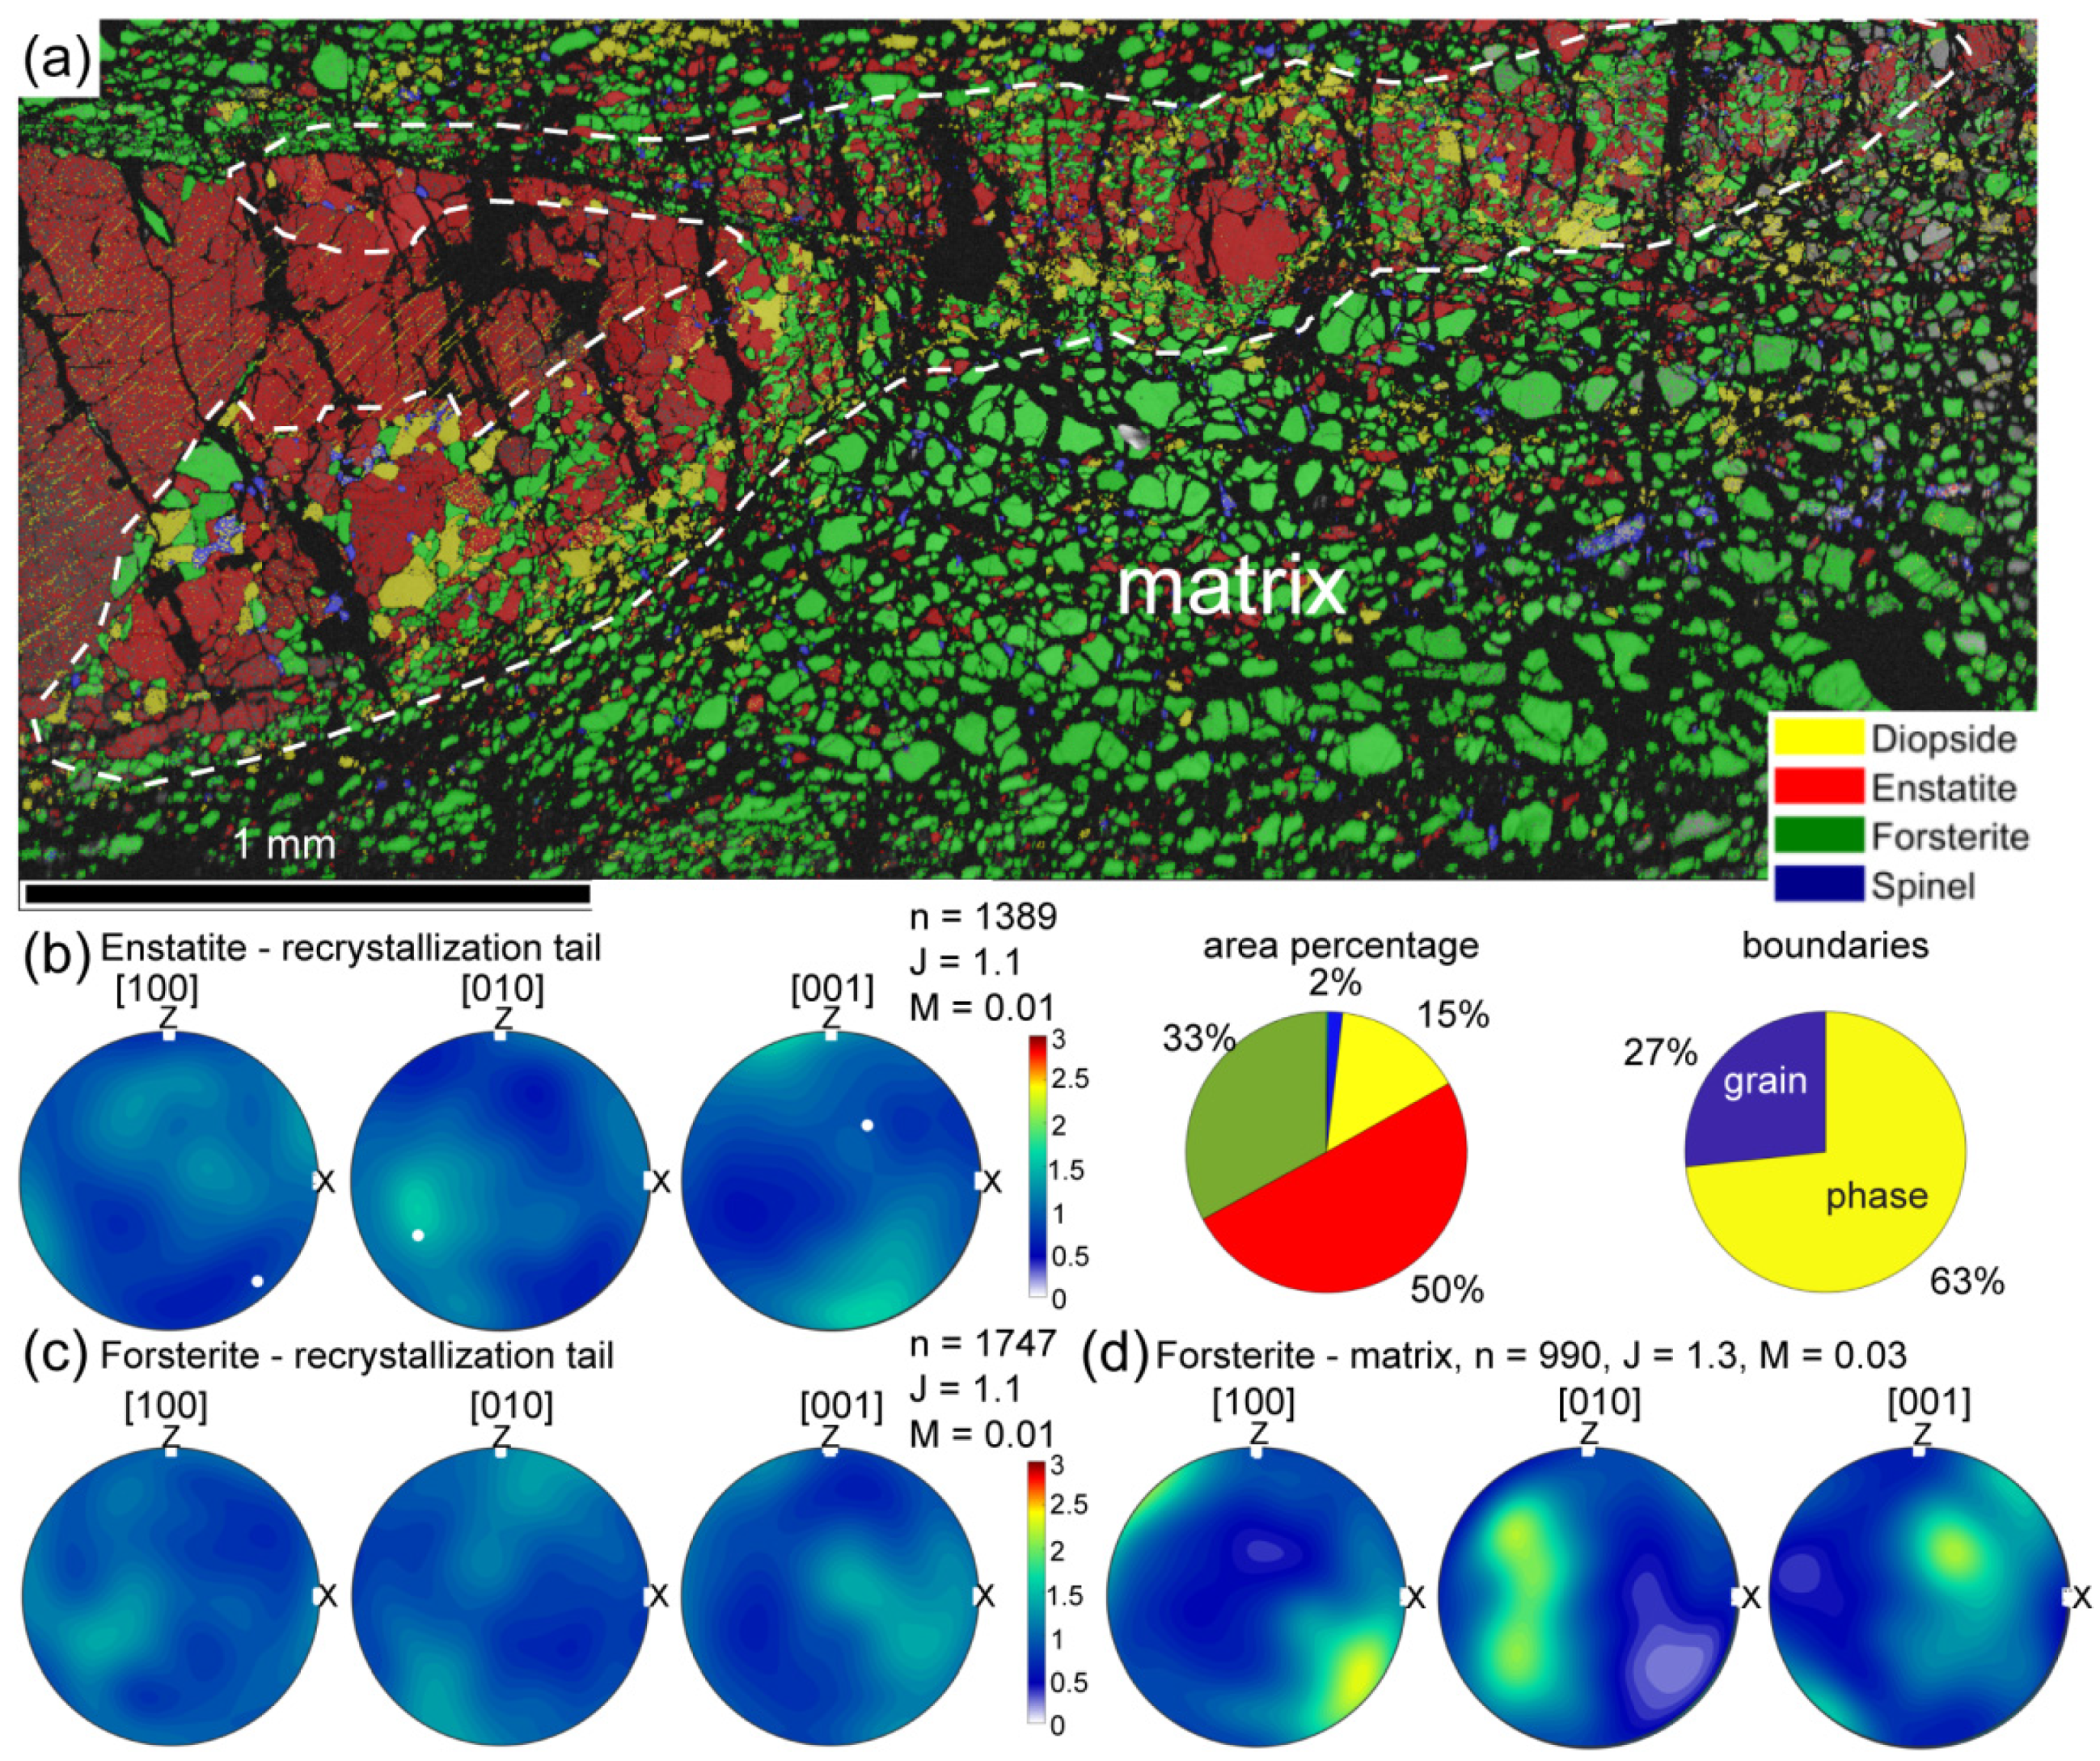
All thin sections show polymineralic (opx + ol + cpx ± spinel) ultramylonite layers with a small grain size (~10 µm) that can cross-cut the whole thin section (Figure 2). Often there are well-preserved domains in between serpentine-filled cracks (Figure 2a, bottom right and Figure 3a,b). Often, fine horizontal cracks go through the layers (Figure 3c). The grains in these layers have a very irregular form (Figure 3d). The sample with the lowest amount of opx porphyroclasts also has the thinnest (down to 200 µm) polymineralic layers (Figure 2d). In the samples with more opx porphyroclasts, the polymineralic layers can be up to 900 µm thick (Figure 2a).
Orthopyroxene clast size ranges from around 0.3 mm up to around 5 mm. Some opx porphyroclasts are elongated and can reach an aspect ratio of up to 20:1 (Figure 2b), however most clasts show small aspect ratios. The porphyroclasts often show undulose extinction. Some porphyroclasts in the samples with small amounts of porphyroclasts (Samples 8.3 and 8.4) show a few subgrains at the border. Some of these porphyroclasts also display some recrystallization at the borders, where dominantly opx occurs (Figure 4g). Some of the opx grains have 120° triple junctions, indicating annealing (Figure 4f). Most opx porphyroclasts show exsolution lamellae of cpx. Some smaller opx porphyroclasts and elongated or folded opx porphyroclasts show a fine-grained polymineralic tail and/or rim (Figure 4a–c,e,f) consisting of olivine, pyroxenes ± spinel. At the border of small opx porphyroclasts and the tips of the elongated opx, olivine grains often occur in embayments (Figure 4a–c). Some opx clasts are kinked and along the kinks small cpx and opx grains occur (Figure 4d).
Clinopyroxene porphyroclasts occur in all samples and range in size from 190 µm to 2.7 mm. Commonly they show opx exsolution lamellae (Figure 5a). Most cpx porphyroclasts show a rim or tail of smaller cpx grains (Figure 5a,b), and further away from the porphyroclast the cpx neoblasts are intermixed with olivine grains (Figure 5b). In some samples these tails are thin and they can extend up to 2 cm to form cpx-rich layers (Figure 2c and Figure 5a). Cpx grains are also prominent in some areas within the olivine-rich matrix (Figure 5c).
Parts of the olivine matrix are highly serpentinized and individual grains are difficult to distinguish under the optical microscope. Where individual grains can be observed the average grain size in the matrix is around 60 µm. No olivine porphyroclasts are observed.
Porphyroclasts of spinel occur in all samples (range in sizes 0.3–1.4 mm); some porphyroclasts form clusters with opx. Some spinel porphyroclasts are stretched (aspect ratios up to 5) in the foliation. Smaller spinel grains occur in the olivine matrix (Figure 5c), and within recrystallized rims and tails of the pyroxene clasts.

4.2. EBSD Data

4.2.1. Clinopyroxene

Two recrystallized cpx porphyroclasts were mapped with EBSD (Table 1, Figure 6 and Figure S1). The mapped areas consist mainly of clinopyroxene (95% and 87%, Figure 6 and Figure S1). The other phases are olivine (4% and 5%), enstatite (<1% and 4%) and spinel (<1% and 5%). These maps consist of 75% and 53% grain boundaries (Table 1), with average cpx grain sizes of 36 µm and 30 µm, respectively. In the map shown in Figure 6, small grains of cpx are observed in between larger cpx grains. These small grains are associated with small opx and spinel grains. Small olivine grains (15 ± 7 µm) occur with cpx in phase mixtures at the border of the recrystallized tail (Figure 6c). The cpx grain size in these phase mixtures is much smaller than the grains close to the porphyroclast border. The cpx CPO is related to the clast orientation (Figure 6d and Figure S1). A few cpx grains show a large internal misorientation up to 8° (Figure 6b). The small cpx grains at the border of the recrystallized area, intermixed with olivine, show no internal misorientations (Figure 6b). The olivine grains show no clear CPO (Figure 6d).
The map of smaller cpx porphyroclasts (Figure 7) shows olivine grains directly at the porphyroclast border, and in contrast to the other two analyzed porphyroclasts, it has a relatively high proportion (63%) of phase boundaries. The phase mixture consists of 66% cpx and 33% olivine, with a small amount of spinel (1%) and opx (<1%). The recrystallized opx grain sizes are smaller (average 11 µm ± 9 µm) for this cpx porphyroclast than for the other two cpx porphyroclasts (Table 1). The grain size is similar to the olivine grain size (10 ± 6 µm, Table 1). The clinopyroxenes show a weak CPO related to the host orientation. No olivine CPO is observed (Figure 7).
In addition to the cpx porphyroclasts, an olivine + cpx matrix domain was analyzed with EBSD (Figure 5c and Figure 8). The cpx- (37%) and olivine (58%)-rich matrix contains small amounts of opx and spinel (both 3%) (Figure 5c). A large amount of serpentine occurs, which makes the boundary and grain size analyses more prone to errors. The map consists of 64% phase boundaries. Both olivine and cpx grain sizes are relatively small (16 ± 8 µm and 15 ± 7 µm, respectively; Table 1). The [001] axes of olivine are oriented parallel to the lineation and the [100] axes are oriented perpendicular to the foliation (Figure 8). The (100) planes of diopside are orientated perpendicular to the lineation and the [001] axes are oriented parallel to the foliation.
A map of the cpx-poor (9%) olivine matrix (73%) was also analyzed (Table 1, Figure 8 and Figure S2), which contains 15% opx. Due to the well-dispersed pyroxene grains, the phase boundaries make up 68% of the total boundaries. The olivine grain size in this matrix is slightly bigger (23 ± 16 µm), but within error, than the olivine grain size of the cpx-rich matrix. The grain sizes of the other minerals are similar (Table 1). The olivine CPO is weak (J-index of 1.6, M-index of 0.04) with the [100] axes parallel to X and [001] axes perpendicular to the foliation (Figure 8).

4.2.2. Orthopyroxene

Three maps of recrystallized opx clasts were measured (Table 1, Figure 9, Figure 10 and Figure S3). The recrystallized tails consist of mainly opx (32–50%) and olivine (33–66%). The clinopyroxene abundance is variable (1–15%, Table 1), and spinel is an accessory phase (1–2%).
The larger opx porphyroclast shows at the lower border a mixture of relatively coarse-grained opx + ol + cpx ± spinel. These larger opx grains have a relatively large misorientation (up to >40°) from the opx porphyroclast orientation. The map shows a thin (~100 µm) polymineralic tail extending from the orthopyroxene porphyroclast. The grain sizes in this band are small (opx: 17 ± 15 µm, olivine: 14 ± 8 µm, cpx: 15 ± 11 µm). None of the minerals show a CPO and the J-index and M-index is small for both opx (J = 1.1, M = 0.01)) and olivine (J = 1.1, M = 0.01) (Figure 9b,c).
The surrounding olivine-rich matrix (83%) has a larger average grain size (45 ± 30 µm, Table 1). Included in the matrix are some (9%) smaller opx grains (27 ± 11 µm), spinel grains (4%, 27 ± 10 µm) and cpx grains (4%, 28 ± 10 µm). The olivine CPO is weak (J-index of 1.3, M-index of 0.03) and shows [100] close to the lineation, [010] close to Y and [001] close to the Z axis (Figure 9d).
The neoblasts adjacent to the small opx porphyroclasts have an inhomogeneous grain size; there are some concentrated lines where very small (~5 µm), mainly orthopyroxene grains occur (Figure 10). Additionally, in these areas pargasite is present, and also visible are embayments of olivine in some larger opx grains of the phase mixture (Figure 10). The phase boundaries are very irregular and lobate. The opx shows a weak CPO (J-index: 1.6, M-index: 0.05), with [001] close to X and [010] perpendicular to the foliation. The orientations of [010] and [001] are close to the porphyroclast orientation (Figure 10). The olivine CPO is relatively weak (J-index: 2.6 and M-index: 0.15), the [100] axes are parallel to X and [010] axes perpendicular to the foliation. Diopside shows a CPO of [100] parallel to Y and (010) perpendicular to the foliation.

4.2.3. Fine-Grained Layers

Four areas were analyzed of different fine-grained polymineralic layers in the thin sections (Table 1). One example is shown (Figure 11); the other three are displayed in the supplementary data (Figures S4–S6). All layers are dominated by olivine (51–76%) followed by opx (16–39%), cpx (4–9%) and spinel (1–3%). Phase boundaries are dominant and have a similar percentage in all four maps (62–67%). The average grain size ranges from 4–12 µm for all phases (Table 1). None of the phases show a CPO in these layers (Figure 11c,d).

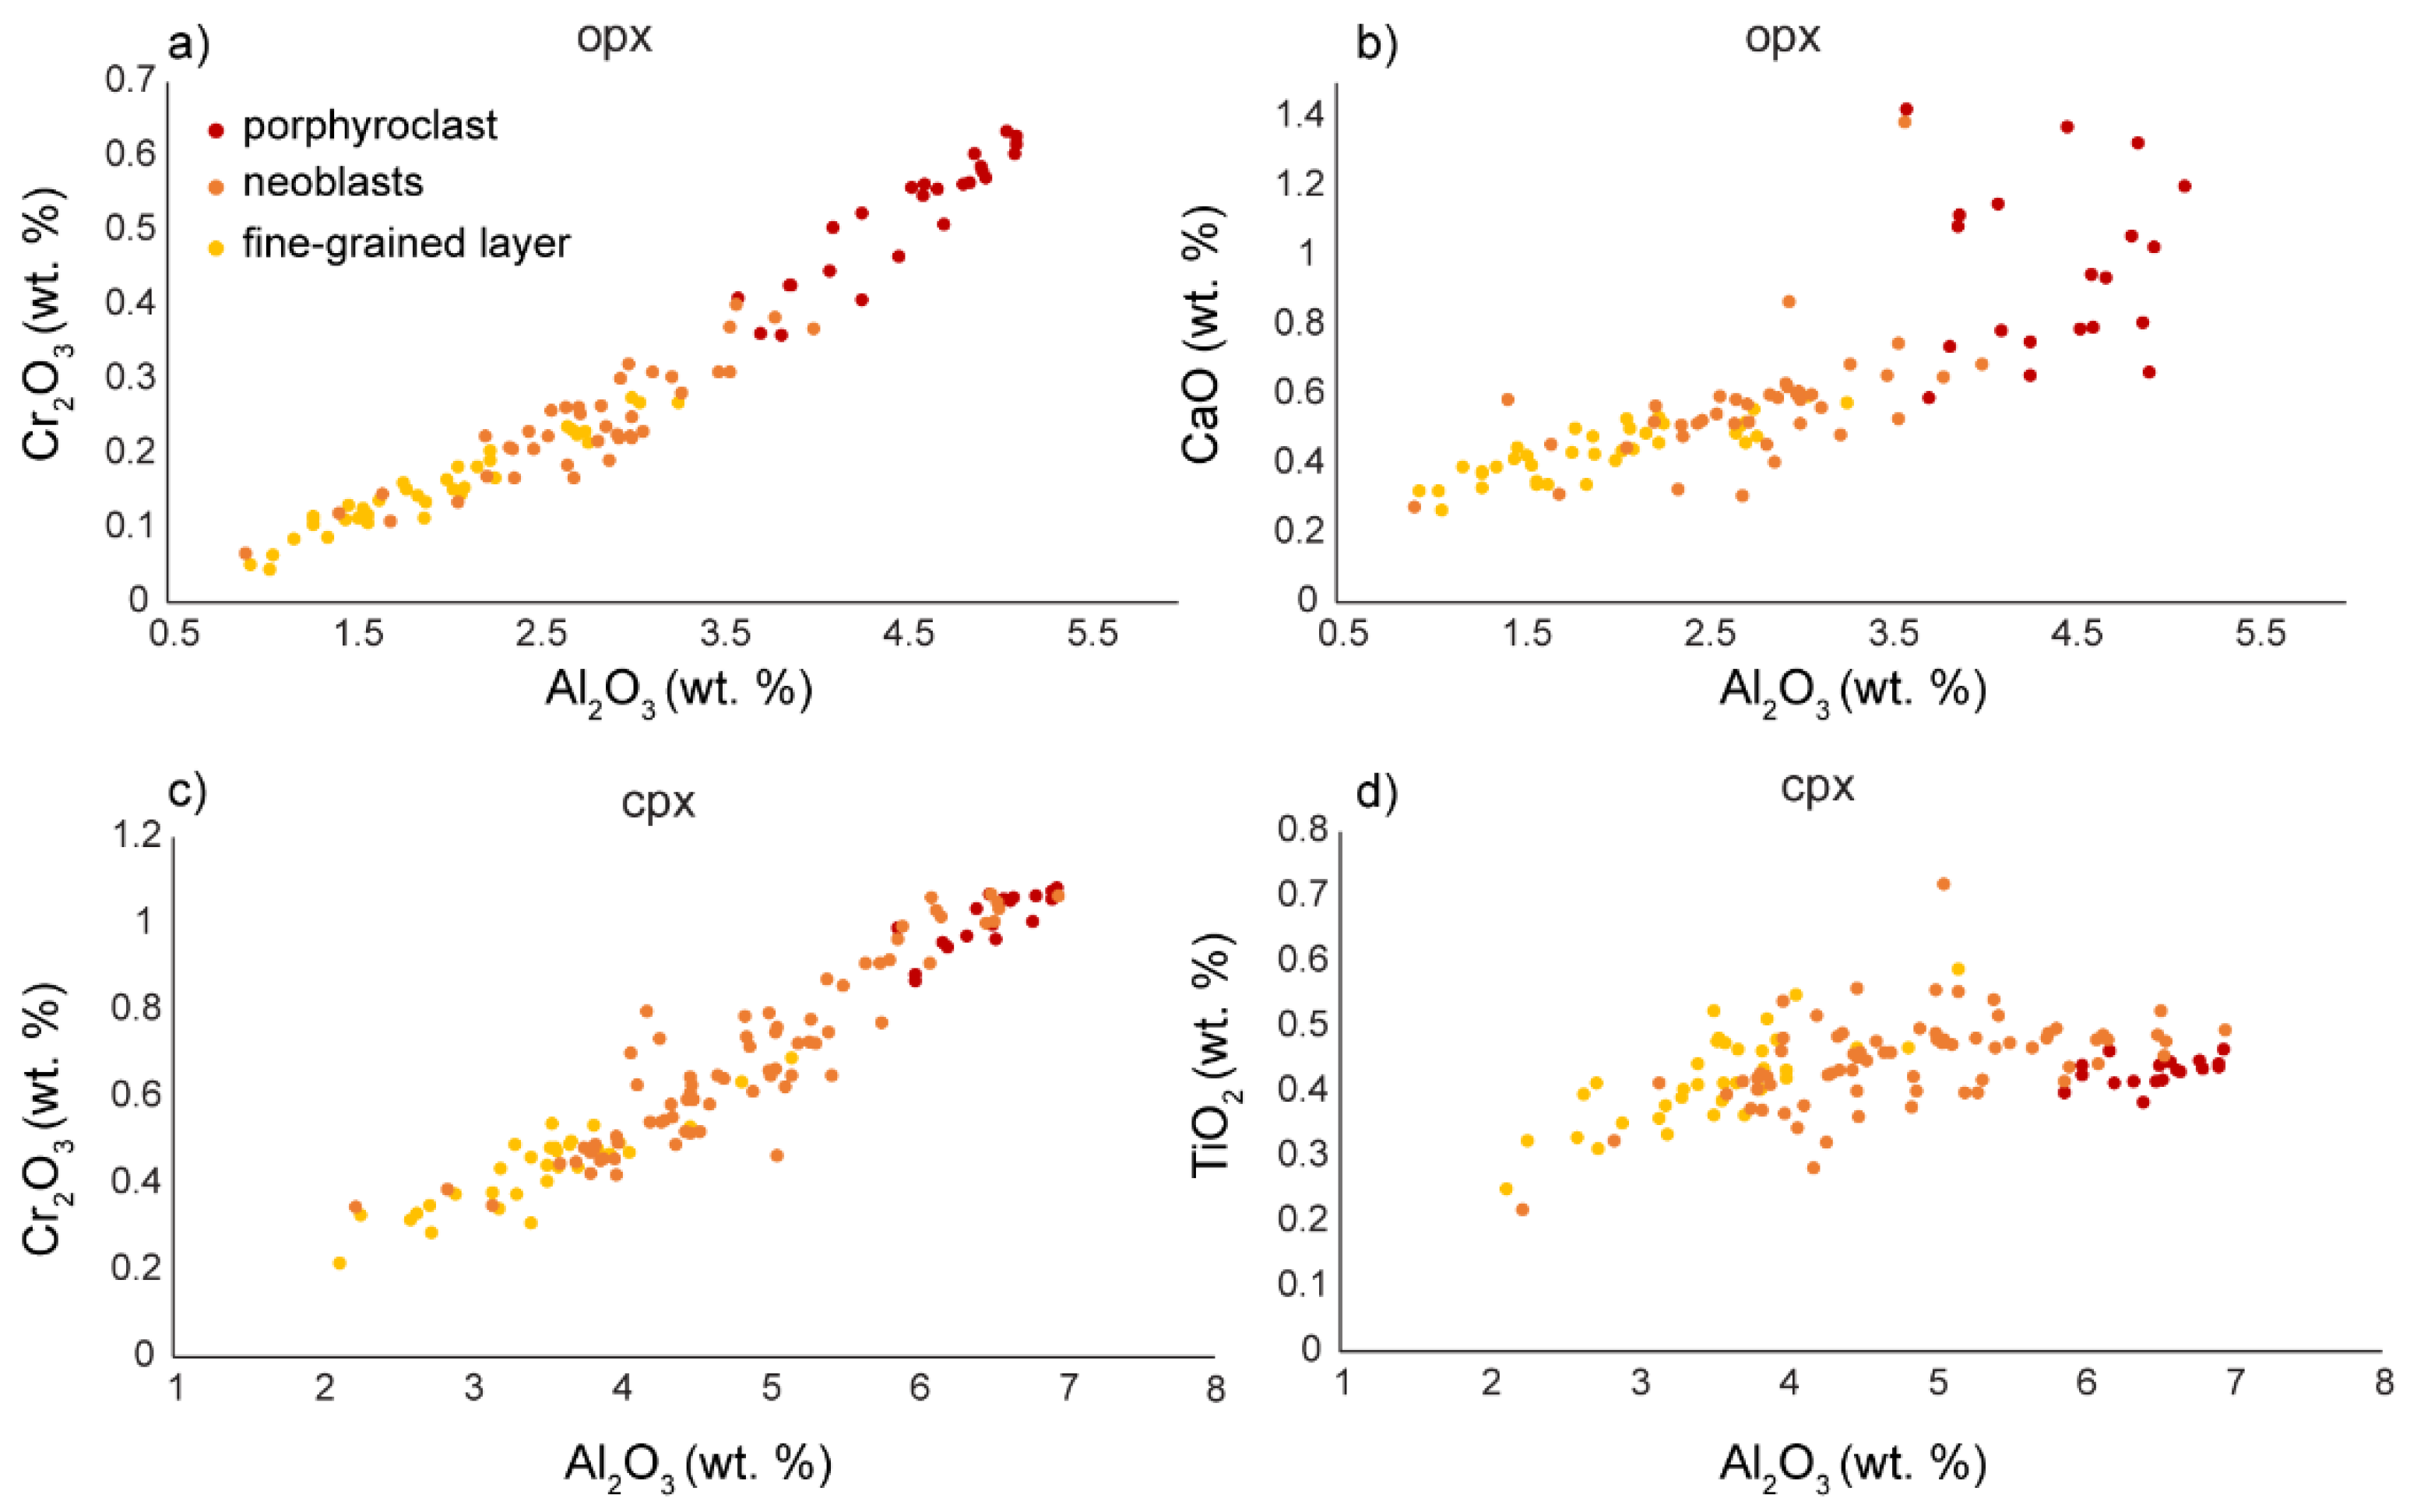
4.3. Chemical Composition and Geothermal Calculations

The chemical data are shown in Table S1. Orthopyroxene shows a correlation between Al2O3 (0.92–5.12 wt.%) and Cr2O3 (0.04–0.63 wt.%), where porphyroclasts have the highest values, and opx neoblasts in the fine-grained layers the lowest (Figure 12a). The neoblasts show values similar to the fine-grained layers and the range goes up to the lowest values of the porphyroclasts (Figure 12a). A similar difference in composition is shown by CaO (range from 0.26–1.42 wt.%), where the opx in the fine-grained layers shows the lowest values and porphyroclasts the highest values of CaO (Figure 12b). In clinopyroxenes there is a correlation between Cr2O3 (range from 0.21–1.08 wt.%) and Al2O3 (range from 2.12–6.95 wt.%), where both decrease from porphyroclasts to fine-grained neoblasts (Figure 12d). The neoblasts have values of both Cr2O3 and Al2O3 spanning the whole range, connecting the fine-grained neoblasts and porphyroclasts (Figure 12c). The values of TiO2 (range from 0.22–0.72 wt.%) show no dependence on the microstructural site (Figure 12d).
The geothermometry calculations give an average temperature for the neoblasts of 884 ± 58 °C (TCa-in-opx), 823 ± 59 °C (TAl-Cr-in-opx) and 853 ± 32 °C (T2pyx) (Table 2). These average values are similar, within error. The porphyroclasts show a distinct higher calculated temperature (TCa-in-opx 1059 ± 95 °C, TAl-Cr in opx: 1022 ± 47 °C). The calculated temperatures from the fine-grained layers are always lower than the neoblast temperatures, but within error (Table 2). The lowest temperatures (775 ± 48 °C) are calculated with the Al-Cr-in-opx geothermometer in the fine-grained layers.

5. Discussion

5.1. Microstructural Evolution

The opx and cpx porphyroclasts both show the formation of smaller recrystallized grains at their borders. The cpx porphyroclasts show mainly cpx neoblasts adjacent to the porphyroclasts, with a small amount of opx neoblasts (4%, Figure 6d). The cpx neoblast CPO is related to the porphyroclast orientation (Figure 6c) and the bigger neoblasts show an internal misorientation (Figure 6b). No olivine embayments are observed in these cpx porphyroclasts (Figure 6 and Figure S1). The lack of olivine embayments and the CPO indicate that the neoblasts were formed by dynamic recrystallization of the cpx porphyroclast. The small opx neoblasts are likely coming from exsolution lamellae from the cpx porphyroclasts.
Further away from the cpx porphyroclasts, in recrystallization tails, and adjacent to smaller cpx porphyroclasts, a mixing of olivine and cpx occurs. The irregular shape of the cpx and olivine grains (Figure 5a and Figure 7a) and the cluster of similar cpx orientations with olivine in between (Figure 7b), suggest that a silica-undersaturated melt percolated through after the dynamic recrystallization stage, dissolving cpx and precipitating olivine. The melt percolation of silica-undersaturated melts occurred during rifting, due to decompression melting of the asthenosphere (Figure 13, [61,62]).
In contrast to the bigger cpx porphyroclasts, opx porphyroclasts show rims and/or tails consisting of opx (32–50%) + olivine (33–66%) + cpx (8–15%) ± spinel (1–2%) (Figure 9 and Figure 10). The occurrence of olivine embayments at the borders of opx porphyroclasts and of some bigger neoblasts (Figure 4b,c, Figure 10e and Figure 11b) and the formation of fine-grained polymineralic rims surrounding folded and elongated opx porphyroclasts indicate that deformation partially occurred in the presence of a silica-undersaturated melt. The melt-rock reaction combined with ongoing deformation led to the formation of fine-grained (average around 15 µm, Table 1) tails adjacent to opx porphyroclasts. Enstatite and forsterite neoblasts next to the big porphyroclasts show no CPO (Figure 9b), indicating that ongoing deformation in these fine-grained layers occurred during diffusion creep. The enstatite neoblasts next to the small opx porphyroclasts show a CPO related to the opx porphyroclast (Figure 10a). In addition, the opx shows some internal misorientation in the bigger neoblasts (Figure 10b), indicating that a combination of dislocation and diffusion creep was active in these layers. This is also indicated by the olivine CPO (Figure 10) that shows an A-type CPO, which is the common slip system in olivine in dry conditions [68].
In contrast to cpx porphyroclasts, most opx porphyroclasts show little evidence for dynamic recrystallization prior to melt percolation. This indicates that in the first stage of rifting, prior to melt percolation, dynamic recrystallization of cpx occurred, and likely olivine porphyroclasts as well (Figure 13). Orthopyroxene porphyroclasts possibly got folded and elongated during these first stages of deformation. With ongoing extension and thinning, decompression melting and infiltration of melt in the shear zones occurred [58]. The silica-undersaturated melt reacted with the dynamically recrystallized cpx tails and the opx porphyroclast. These reactions occurred during deformation and fine-grained mixtures formed at the rims of the porphyroclasts. Ongoing deformation under sub-solidus conditions led to further grain size reduction and interconnected fine-grained layers (Figure 2, Figure 3a and Figure 13) in which deformation could localize. These layers deform by diffusion creep as shown by the lack of CPO of all phases (Figure 11c–e). The layers consist mainly of olivine (51–76%) and opx (16–39%) with a small amount of cpx (4–11%).
The presence of a small amount of amphibole (<1%) in the fine-grained layers (Figure 10a and Figure 11b) indicates possible fluid/melt infiltration in the later stages of deformation. A late stage of deformation is indicated by horizontal cracks localized within the ultramylonite layers (Figure 11a), and some randomly oriented cracks in recrystallization tails (Figure 10a). Along the horizontal cracks, olivine and opx grain boundaries are aligned. In addition, small-sized, mainly opx grains are found along the cracks (Figure 10b and Figure 11a).

5.2. Olivine-Rich Matrix

In order to determine the strain rate contrast between the fine-grained ultramylonite layers and the olivine-rich matrix, the grain size of both is needed. Due to the serpentinization, the olivine grain size of the matrix is difficult to determine. Domains of the matrix that can be analyzed, due to lower amounts of serpentinization, contain relatively high amounts of second phases. Two maps of the matrix that contain second phases (pyroxenes and spinel, totals of 12% and 26%) give grain sizes of 45 ± 30 µm and 23 ± 16 µm, respectively (Table 1). Due to pinning effects, these grain sizes are probably a lower limit of the matrix olivine grain size [47]. The pinning effect can also be high as the phases in the matrix are relatively well-mixed, as indicated by the high amount of phase boundaries compared to grain boundaries (45% and 68%, respectively (Table 1)). Some parts of the matrix consist of well-mixed (64% phase boundaries) olivine (58%) and cpx (37%) (Figure 6c, Table 1). With the lack of a clear host clast, the high amount of cpx in parts of the matrix is difficult to explain. It is possible that it was formed by extensive reactions of undersaturated silica melt with cpx neoblasts. Alternatively, some cpx enrichment in the olivine matrix could have occurred at the later stages of melt infiltration. In these later stages the melt was possibly enriched in silica due to extensive melt-rock reactions (e.g., [61]).
The olivine CPO in this cpx-rich matrix shows a C-type CPO with the [001] axes parallel to the lineation and the [100] axes perpendicular to the foliation [68]. The C-type CPO has been suggested to form when water [69] or melt (e.g., [70]) is present. The olivine CPO in the matrix shows the [100] axes parallel to the lineation and the [001] axes perpendicular to the foliation, which has been classified as the E-type CPO, which is thought to be dominant at water-rich conditions [68]. In contrast, in the recrystallization tail of a small opx, the A-type CPO was observed (Figure 10), which is suggested to be dominant at dry conditions [68]. In a few upper mantle shear zones, a transition from A-type to an E-type CPO has been observed to occur with increasing strain localization (i.e., protomylonites to ultramylonites; e.g., [28,71]). This change in CPO has been suggested to be caused by an increase in water content [71] or a decrease in temperature during strain localization [28]. This transition is the opposite of what is observed in the Erro-Tobbio shear zone, where we find the E-type CPO in the olivine matrix.
In the Ronda shear zone, a detailed study on CPO evolution found different CPO types which are related to water content [33]. During strain localization, water migrates to the ultramylonites, due to water pumping along grain boundaries. The dry CPO type is found in the drained parts of the shear zone whereas the water-rich CPO is found closer to the ultramylonites. The ultramylonites show a dry CPO type as the fluid is further distributed in new grain boundaries. In the Erro-Tobbio shear zone, the difference in dry CPO type in the recrystallized layer (Figure 10) compared to the wet CPO type in the matrix (Figure 9) could possibly be related to the same process as described in [33]. In this case, the fluid is distributed along the new grain boundaries in the finer-grained areas. However, a more detailed study of the CPO in the different areas of the samples has to be conducted to be able to determine the process responsible for the different CPO types in the Erro-Tobbio shear zone. As the fine-grained layers do not show a CPO (Figure 11), no CPO type can be determined for these layers. In addition, the development of a CPO can be complex, and for the Josephine peridotite the A- and E-type were found in different samples with similar water content [72]. Here, the pre-existing CPO played a large role in the CPO evolution [72]. The importance of a pre-existing CPO and geometry of deformation has been shown in a recent study on various natural rock samples [73]. This study shows that any of the CPO types (A- to E-types) can form at very low water content and low stresses [73].
In any case, the olivine CPOs suggest that deformation by dislocation creep or dislocation-accommodated grain boundary sliding (disGBS) occurred in the olivine-rich matrix.

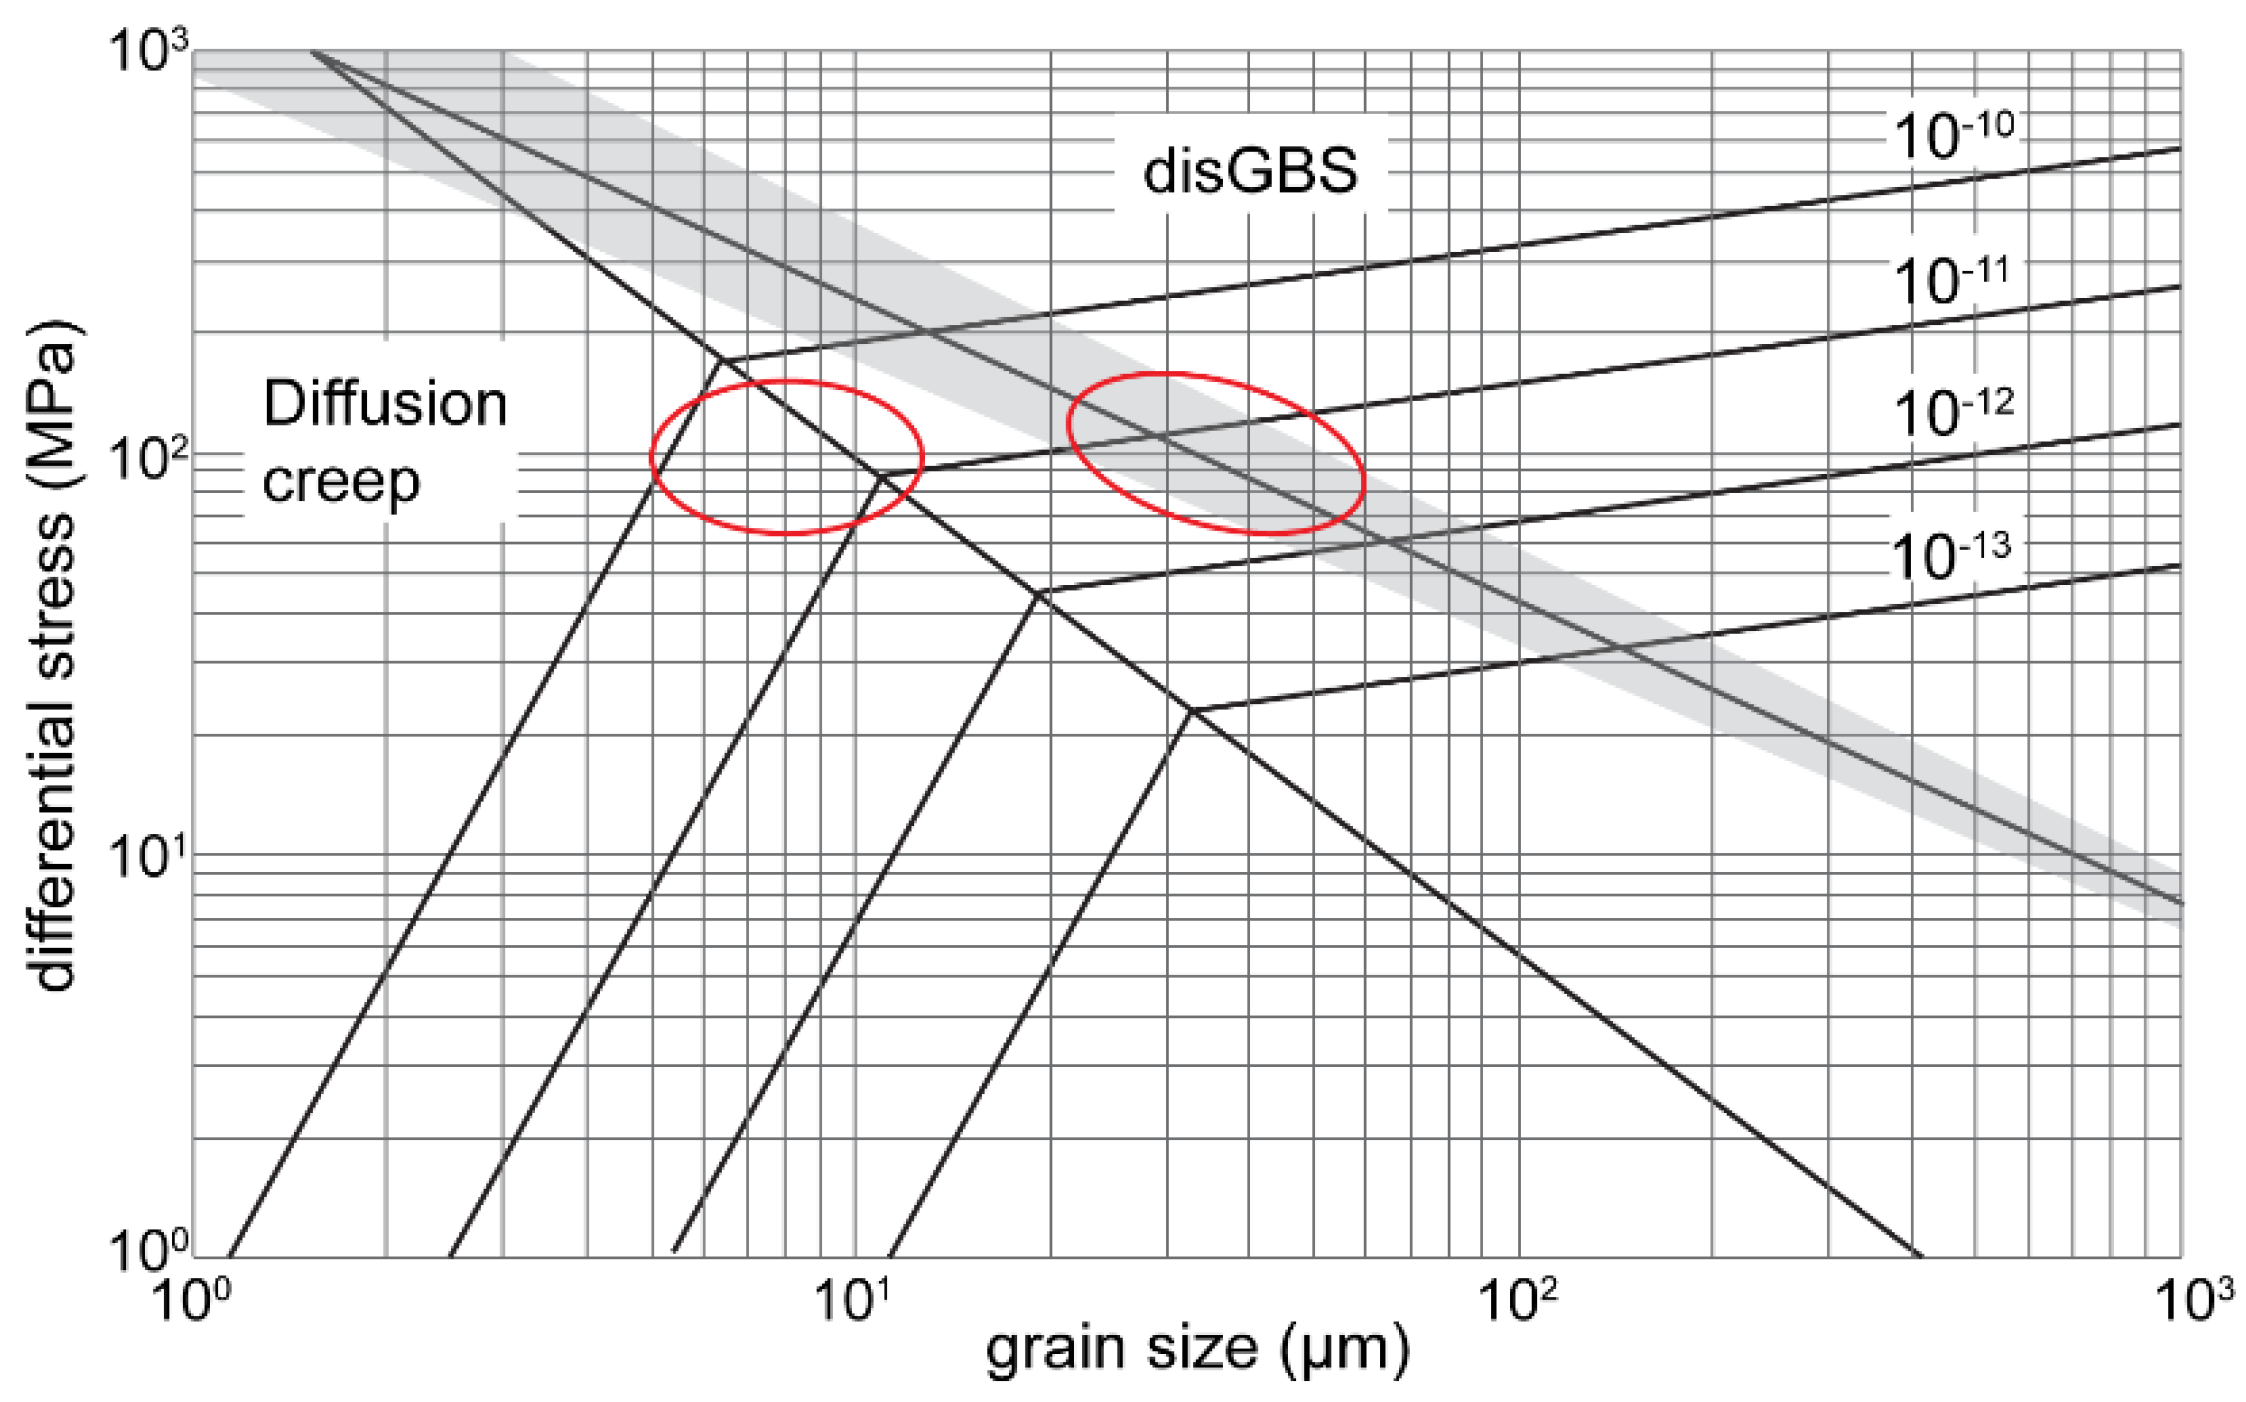
5.3. Strain Localization

The microstructural evolution indicates the importance of melt-rock reactions for grain size reduction and extensive phase mixing in the shear zone. Due to this grain size reduction, the deformation changes from dislocation creep in the matrix to diffusion creep in the ultramylonite layers.
In order to determine the effect of the decrease in grain sizes and change in deformation mechanism on the strain rate, a deformation mechanism map has to be generated. For the deformation mechanism map a deformation temperature is needed, which has been calculated for the porphyroclasts, neoblasts and fine-grained neoblasts (Table 2).
The microprobe data show a clear trend of decreasing Cr2O3 (wt.%), Al2O3 (wt.%) and CaO (wt.%) content from porphyroclasts to fine-grained neoblasts (Figure 12). The scatter in CaO (wt.%) in the opx porphyroclasts is related to small exsolution lamellae of cpx. In the cpx the CaO (wt.%) shows a clear trend with decreasing values from the porphyroclasts to the fine-grained neoblasts (Figure 12). The TiO2 remains at relatively constant values. The geothermometers reflect these trends and show a decrease in calculated temperatures for all three geothermometers, going from porphyroclasts over neoblasts to the fine-grained neoblasts (Table 2). The neoblasts show higher temperatures than the fine-grained neoblasts but they are within error. For the deformation map calculations, we used a deformation temperature of 850 °C. With a stress estimate from the olivine matrix calculated with the paleopiezometer and assuming the stress is similar in both matrix and fine-grained layers, we get a strain rate reduction of about one order of magnitude (Figure 14). The deformation map indicates that the matrix olivine deformed by dislocation creep accommodated by grain boundary sliding (Figure 14). The olivine in the ultramylonite layers deforms at the border between diffusion creep and disGBS (Figure 14). Here we assume a dry olivine flow law, since the importance of disGBS at “wet” conditions has not been determined yet [13]. If we assume wet olivine diffusion and dislocation creep flow laws, both matrix olivine and ultramylonite olivine will fall in the diffusion creep field. Due to grain size dependence of diffusion creep, a strain localization in the ultramylonites will also occur.
The deformation mechanism map only considers the olivine, as it is the dominant phase in both matrix and the fine-grained layers. However, the pyroxenes very likely contribute to the rheology in both the matrix and fine-grained layers. In addition, it has been shown that small melt fractions (0.03–0.04) decrease the viscosity of olivine substantially [10,11,12]. Therefore, the effect on the viscosity of the infiltration of the silica undersaturated is twofold. On one hand the melt infiltration during the evolution of the shear zone weakens the complete shear zone, and on the other hand, locally, the melt-rock reactions lead to the formation of the fine-grained ultramylonite layers. This shows the importance of melt-rock reactions for phase mixing, and in turn for strain weakening (Figure 14). The importance of melt-rock reactions for strain weakening have been observed in other peridotites (e.g., [40]). The observation of the formation of fine-grained layers due to melt percolation is the opposite of what was observed recently in the Finero peridotites in the southern Alps [74]. The peridotite is a metasomatized mantle section originating in a supra-subduction environment [74]. These authors observed that the percolation of hydrous melts favored olivine grain growth and deformation by dissolution and precipitation. This led to homogenously distributed deformation. Even though pargasite and phlogopite were recrystallized, this recrystallization did not lead to a weakening. This contrasting behavior illustrates the importance of the melt composition and their interaction with the peridotites. In a ridge setting where the asthenosphere melts due to decompression melting, Si-undersaturated melts will percolate the peridotites leading to the melt-rock reactions and strain weakening observed in, for instance, the Erro-Tobbio and Othris peridotite [40].

Supplementary Materials

The following are available online at https://www.mdpi.com/article/10.3390/min11101036/s1, Figure S1: EBSD data of a recrystallized cpx porphyroclast, Figure S2: EBSD maps of the olivine matrix, Figure S3: EBSD data of a recrystallized opx porphyroclast, Figures S4–S6: EBSD data of fine-grained layers, Table S1: Microprobe data of pyroxenes.

Author Contributions

Conceptualization, J.L. and S.T.; methodology, J.L. and S.T.; validation, J.L., S.T.; formal analysis, J.L., S.T.; investigation, J.L., S.T.; data curation, S.T.; writing—original draft preparation, J.L.; writing—review and editing, J.L., S.T.; visualization, J.L.; supervision, J.L.; project administration, J.L.; funding acquisition, J.L. All authors have read and agreed to the published version of the manuscript.

Funding

This research was funded by the Deutsche Forschungsgemeinschaft, grant number LI 2888/2-1.

Acknowledgments

We would like to thank Maria Bladt and Nils Prawitz for making the thin sections. Marina Kemperle is thanked for her help with the EBSD analysis in Cologne. Thanks also goes to Catharina Heckel for helping with the microprobe analysis. We would like to thank Giovanni Piccardo for discussing his research on the Erro-Tobbio peridotite. We would like to thank three anonymous reviewers for their constructive comments that improved the manuscript.

Conflicts of Interest

The authors declare no conflict of interest. The funders had no role in the design of the study; in the collection, analyses, or interpretation of data; in the writing of the manuscript, or in the decision to publish the results.

References

  1. Bürgmann, R.; Dresen, G. Rheology of the Lower Crust and Upper Mantle: Evidence from Rock Mechanics, Geodesy, and Field Observations. Annu. Rev. Earth Planet. Sci. 2008, 36, 531–567. [Google Scholar] [CrossRef] [Green Version]
  2. Drury, M.R.; Vissers, R.L.M.; Wal, D.; Hoogerduijn Strating, E.H. Shear localisation in upper mantle peridotites. Pure Appl. Geophys. 1991, 137, 439–460. [Google Scholar] [CrossRef]
  3. Vissers, R.L.M.; Drury, M.R.; Hoogerduijn Strating, E.H.; Spiers, C.J.; van der Wal, D. Mantle shear zones and their effect on lithosphere strength during continental breakup. Tectonophysics 1995, 249, 155–171. [Google Scholar] [CrossRef]
  4. Bercovici, D. The generation of plate tectonics from mantle convection. Earth Planet. Sci. Lett. 2003, 205, 107–121. [Google Scholar] [CrossRef]
  5. Tackley, P.J. Mantle convection and plate tectonics: Toward an integrated physical and chemical theory. Science 2000, 288, 2002–2007. [Google Scholar] [CrossRef] [PubMed]
  6. Tommasi, A.; Vauchez, A. Heterogeneity and anisotropy in the lithospheric mantle. Tectonophysics 2015, 661, 11–37. [Google Scholar] [CrossRef]
  7. Mei, S.; Kohlstedt, D.L. Influence of water on plastic deformation of olivine aggregates 1. Diffusion creep regime. J. Geophys. Res. Solid Earth 2000, 105, 21457–21469. [Google Scholar] [CrossRef]
  8. Mei, S.; Kohlstedt, D.L. Influence of water on plastic deformation of olivine aggregates 2. Dislocation creep regime. J. Geophys. Res. Solid Earth 2000, 105, 21471–21481. [Google Scholar] [CrossRef]
  9. Tasaka, M.; Zimmerman, M.E.; Kohlstedt, D.L. Evolution of the rheological and microstructural properties of olivine aggregates during dislocation creep under hydrous conditions. J. Geophys. Res. Solid Earth 2015, 121, 92–113. [Google Scholar] [CrossRef] [Green Version]
  10. Hirth, G.; Kohlstedt, D.L. Experimental constraints on the dynamics of the partially molten upper mantle: 2. Deformation in the dislocation creep regime. J. Geophys. Res. 1995, 100, 15411–15449. [Google Scholar] [CrossRef]
  11. Hirth, G.; Kohlstedt, D.L. Experimental constraints on the dynamics of the partially molten upper mantle: Deformation in the diffusion creep regime. J. Geophys. Res. 1995, 100, 1981–2001. [Google Scholar] [CrossRef]
  12. Zimmerman, M.E.; Kohlstedt, D.L. Rheological Properties of Partially Molten Lherzolite. J. Petrol. 2004, 45, 275–298. [Google Scholar] [CrossRef] [Green Version]
  13. Hansen, L.N.; Zimmerman, M.E.; Kohlstedt, D.L. Grain boundary sliding in San Carlos olivine: Flow law parameters and crystallographic-preferred orientation. J. Geophys. Res. 2011, 116, 1–16. [Google Scholar] [CrossRef]
  14. Hirth, G.; Kohlstedt, D.L. Rheology of the upper mantle and the mantle wedge: A view from the experimentalists. In Inside the Subduction Factory; Eiler, J., Ed.; Geophysical Monograph; American Geophysical Union: Washington, DC, USA, 2003; Volume 138, pp. 83–105. [Google Scholar]
  15. Skemer, P.; Warren, J.M.; Hansen, L.N.; Hirth, G.; Kelemen, P.B. The influence of water and LPO on the initiation and evolution of mantle shear zones. Earth Planet. Sci. Lett. 2013, 375, 222–233. [Google Scholar] [CrossRef]
  16. Tommasi, A.; Knoll, M.; Vauchez, A.; Signorelli, J.W.; Thoraval, C.; Logé, R. Structural reactivation in plate tectonics controlled by olivine crystal anisotropy. Nat. Geosci. 2009, 2, 423–427. [Google Scholar] [CrossRef]
  17. Hansen, L.N.; Zimmerman, M.E.; Kohlstedt, D.L. Laboratory measurements of the viscous anisotropy of olivine aggregates. Nature 2012, 492, 415–418. [Google Scholar] [CrossRef]
  18. Dijkstra, A.H.; Drury, M.R.; Frijhoff, R.M. Microstructures and lattice fabrics in the Hilti mantle section (Oman Ophiolite): Evidence for shear localization and melt weakening in the crust–mantle transition zone? J. Geophys. Res. 2002, 107, 1–18. [Google Scholar] [CrossRef]
  19. Regenauer-Lieb, K.; Yuen, D. Positive feedback of interacting ductile faults from coupling of equation of state, rheology and thermal-mechanics. Phys. Earth Planet. Inter. 2004, 142, 113–135. [Google Scholar] [CrossRef]
  20. Matysiak, A.K.; Trepmann, C.A. Crystal-plastic deformation and recrystallization of peridotite controlled by the seismic cycle. Tectonophysics 2012, 530–531, 111–127. [Google Scholar] [CrossRef]
  21. Kelemen, P.B.; Hirth, G. A periodic shear-heating mechanism for intermediate-depth earthquakes in the mantle. Nature 2007, 446, 787–790. [Google Scholar] [CrossRef]
  22. Thielmann, M.; Rozel, A.; Kaus, B.J.P.; Ricard, Y. Intermediate-depth earthquake generation and shear zone formation caused by grain size reduction and shear heating. Geology 2015, 43, 791–794. [Google Scholar] [CrossRef]
  23. Evans, B.; Renner, J.; Hirth, G. A few remarks on the kinetics of static grain growth in rocks. Int. J. Earth Sci. 2001, 90, 88–103. [Google Scholar] [CrossRef]
  24. Drury, M.R.; Urai, J.L. Deformation-related recrystallization processes. Tectonophysics 1990, 172, 235–253. [Google Scholar] [CrossRef]
  25. Karato, S. Grain growth kinetics in olivine aggregates. Tectonophysics 1989, 168, 255–273. [Google Scholar] [CrossRef]
  26. Bystricky, M.; Kunze, K.; Burlini, L.; Burg, J.-P. High Shear Strain of Olivine Aggregates: Rheological and Seismic Consequences. Science 2000, 290, 1564–1567. [Google Scholar] [CrossRef] [Green Version]
  27. Newman, J.; Lamb, W.M.; Drury, M.R.; Vissers, R.L.M. Deformation processes in a peridotite shear zone: Reaction-softening by an H2O-deficient, continuous net transfer reaction. Tectonophysics 1999, 303, 193–222. [Google Scholar] [CrossRef]
  28. Linckens, J.; Herwegh, M.; Müntener, O.; Mercolli, I. Evolution of a polymineralic mantle shear zone and the role of second phases in the localization of deformation. J. Geophys. Res. 2011, 116, 1–21. [Google Scholar] [CrossRef]
  29. Handy, M. Flow laws for rocks containing two non-linear viscous phases: A phenomenological approach. J. Struct. Geol. 1994, 16, 287–301. [Google Scholar] [CrossRef]
  30. Ji, S.; Zhao, P.; Xia, B. Flow laws of multiphase materials and rocks from end-member flow laws. Tectonophysics 2003, 370, 129–145. [Google Scholar] [CrossRef]
  31. Tasaka, M.; Hiraga, T.; Zimmerman, M.E. Influence of mineral fraction on the rheological properties of forsterite + enstatite during grain-size-sensitive creep: 2. Deformation experiments. J. Geophys. Res. Solid Earth 2013, 118, 3991–4012. [Google Scholar] [CrossRef]
  32. Fusseis, F.; Regenauer-Lieb, K.; Liu, J.; Hough, R.M.; De Carlo, F. Creep cavitation can establish a dynamic granular fluid pump in ductile shear zones. Nature 2009, 459, 974–977. [Google Scholar] [CrossRef] [PubMed]
  33. Précigout, J.; Prigent, C.; Palasse, L.; Pochon, A. Water pumping in mantle shear zones. Nat. Commun. 2017, 8. [Google Scholar] [CrossRef] [PubMed]
  34. Précigout, J.; Stünitz, H.; Villeneuve, J. Excess water storage induced by viscous strain localization during high-pressure shear experiment. Sci. Rep. 2019, 9. [Google Scholar] [CrossRef] [PubMed] [Green Version]
  35. Downes, H. Shear zones in the upper mantle − Relation between geochemical enrichment and deformation in mantle peridotites. Geology 1990, 18, 374–377. [Google Scholar] [CrossRef]
  36. Hidas, K.; Tommasi, A.; Garrido, C.J.; Padrón-navarta, J.A.; Mainprice, D. Fluid-assisted strain localization in peridotites during emplacement of the shallow subcontinental lithospheric mantle. Lithos 2016, 262, 636–650. [Google Scholar] [CrossRef]
  37. Kaczmarek, M.-A.; Müntener, O. Juxtaposition of melt impregnation and high-temperature shear zones in the upper mantle; field and petrological constraints from the Lanzo peridotite (Northern Italy). J. Petrol. 2008, 49, 2187–2220. [Google Scholar] [CrossRef]
  38. Mei, S.; Bai, W.; Hiraga, T.; Kohlstedt, D.L. Influence of melt on the creep behavior of olivine-basalt aggregates under hydrous conditions. Earth Planet. Sci. Lett. 2002, 201, 491–507. [Google Scholar] [CrossRef]
  39. Holtzman, B.K.; Kohlstedt, D.L.; Zimmerman, M.E.; Heidelbach, F.; Hiraga, T.; Hustoft, J. Melt segregation and strain partitioning: Implications for seismic anisotropy and mantle flow. Science 2003, 301, 1227–1230. [Google Scholar] [CrossRef] [Green Version]
  40. Dijkstra, A.H.; Drury, M.R.; Vissers, R.L.M.; Newman, J. On the role of melt-rock reaction in mantle shear zone formation in the Othris Peridotite Massif (Greece). J. Struct. Geol. 2002, 24, 1431–1450. [Google Scholar] [CrossRef]
  41. Hoogerduijn Strating, E.; Rampone, E.; Piccardo, G.; Drury, M.R.; Vissers, R.L. Subsolidus emplacement of mantle peridotites during incipient oceanic rifting and opening of the Mesozoic Tethys (Voltri Massif, NW Italy). J. Petrol. 1993, 34, 901–927. [Google Scholar] [CrossRef]
  42. Urai, J.L.; Spiers, C.J.; Zwart, H.J.; Lister, G.S. Weakening of rock salt by water during long-term creep. Nature 1986, 324, 554–557. [Google Scholar] [CrossRef] [PubMed]
  43. Van der Wal, D.; Chopra, P.; Drury, M.R.; Fitz Gerald, J.D. Relationships between dynamically recrystallized grain size and deformation conditions in experimentally deformed olivine rocks. Geophys. Res. Lett. 1993, 20, 1479–1482. [Google Scholar] [CrossRef]
  44. Précigout, J.; Gueydan, F. Mantle weakening and strain localization: Implications for the long-term strength of the continental lithosphere. Geology 2009, 37, 147–150. [Google Scholar] [CrossRef] [Green Version]
  45. Précigout, J.; Gueydan, F.; Gapais, D.; Garrido, C.; Essaifi, A. Strain localisation in the subcontinental mantle—A ductile alternative to the brittle mantle. Tectonophysics 2007, 445, 318–336. [Google Scholar] [CrossRef]
  46. Hansen, L.N.; Warren, J.M. Quantifying the effect of pyroxene on deformation of peridotite in a natural shear zone. J. Geophys. Res. B Solid Earth 2015, 120, 2717–2738. [Google Scholar] [CrossRef] [Green Version]
  47. Linckens, J.; Herwegh, M.; Müntener, O. Small quantity but large effect—How minor phases control strain localization in upper mantle shear zones. Tectonophysics 2015, 643, 26–43. [Google Scholar] [CrossRef]
  48. Jaroslow, G.E.; Hirth, G.; Dick, H.J.B. Abyssal peridotite mylonites: Implications for grain-size sensitive flow and strain localization in the oceanic lithosphere. Tectonophysics 1996, 256, 17–37. [Google Scholar] [CrossRef]
  49. Platt, J.P. Rheology of two-phase systems: A microphysical and observational approach. J. Struct. Geol. 2015, 77, 213–227. [Google Scholar] [CrossRef] [Green Version]
  50. Skemer, P.; Warren, J.M.; Kelemen, P.B.; Hirth, G. Microstructural and rheological evolution of a mantle shear zone. J. Petrol. 2010, 51, 43–53. [Google Scholar] [CrossRef] [Green Version]
  51. Warren, J.M.; Hirth, G. Grain size sensitive deformation mechanisms in naturally deformed peridotites. Earth Planet. Sci. Lett. 2006, 248, 438–450. [Google Scholar] [CrossRef]
  52. Tasaka, M.; Hiraga, T. Influence of mineral fraction on the rheological properties of forsterite + enstatite during grain-size-sensitive creep: 1. Grain size and grain growth laws. J. Geophys. Res. Solid Earth 2013, 118, 3970–3990. [Google Scholar] [CrossRef]
  53. Bercovici, D.; Ricard, Y. Generation of plate tectonics with two-phase grain-damage and pinning: Source-sink model and toroidal flow. Earth Planet. Sci. Lett. 2013, 365, 275–288. [Google Scholar] [CrossRef]
  54. Bercovici, D.; Ricard, Y. Plate tectonics, damage and inheritance. Nature 2014, 508, 513–516. [Google Scholar] [CrossRef] [PubMed]
  55. Précigout, J.; Stünitz, H. Evidence of phase nucleation during olivine diffusion creep: A new perspective for mantle strain localisation. Earth Planet. Sci. Lett. 2016, 455, 94–105. [Google Scholar] [CrossRef] [Green Version]
  56. Ashby, M.F.; Verrall, R.A. Diffusion-accommodated flow and superplasticity. Acta Metall. 1973, 21, 149–163. [Google Scholar] [CrossRef]
  57. Farla, R.J.M.; Karato, S.-I.; Cai, Z. Role of orthopyroxene in rheological weakening of the lithosphere via dynamic recrystallization. Proc. Natl. Acad. Sci. USA 2013, 110, 16355–16360. [Google Scholar] [CrossRef] [Green Version]
  58. Linckens, J.; Bruijn, R.H.C.; Skemer, P. Dynamic recrystallization and phase mixing in experimentally deformed peridotite. Earth Planet. Sci. Lett. 2014, 388, 134–142. [Google Scholar] [CrossRef]
  59. Rampone, E.; Romairone, A.; Abouchami, W.; Piccardo, G.B.; Hofmann, A.W. Chronology, petrology and isotope geochemistry of the Erro-Tobbio peridotites (Ligurian Alps, Italy): Records of Late Palaeozoic lithospheric extension. J. Petrol. 2005, 46, 799–827. [Google Scholar] [CrossRef] [Green Version]
  60. Piccardo, G.B.; Padovano, M.; Guarnieri, L. The Ligurian Tethys: Mantle processes and geodynamics. Earth-Sci. Rev. 2014, 138, 409–434. [Google Scholar] [CrossRef]
  61. Padovano, M.; Piccardo, G.B.; Vissers, R.L.M. Tectonic and magmatic evolution of the mantle lithosphere during the rifting stages of a fossil slow—Ultraslow spreading basin: Insights from the Erro–Tobbio peridotite (Voltri Massif, NW Italy). Geol. Soc. 2014, 413, 205–238. [Google Scholar] [CrossRef]
  62. Piccardo, G.B.; Vissers, R.L.M. The pre-oceanic evolution of the Erro-Tobbio peridotite (Voltri Massif, Ligurian Alps, Italy). J. Geodyn. 2007, 43, 417–449. [Google Scholar] [CrossRef]
  63. Piccardo, G.B. Subduction of a fossil slow-ultraslow spreading ocean: A petrology-constrained geodynamic model based on the Voltri Massif, Ligurian Alps, Northwest Italy. Int. Geol. Rev. 2013, 55, 787–803. [Google Scholar] [CrossRef]
  64. Bunge, H.-J. Texture Analysis in Materials Science; Butterworths: London, UK, 1982. [Google Scholar]
  65. Skemer, P.; Katayama, I.; Jiang, Z.; Karato, S. The misorientation index: Development of a new method for calculating the strength of lattice-preferred orientation. Tectonophysics 2005, 411, 157–167. [Google Scholar] [CrossRef]
  66. Brey, G.P.; Koehler, T. Geothermobarometry in four-phase lherzolites II. New thermobarometers, and practical assessment of existing thermobarometers. J. Petrol. 1990, 31, 1353–1378. [Google Scholar] [CrossRef]
  67. Witt-Eickschen, G.; Seck, H.A. Solubility of Ca and Al in orthopyroxene from spinel peridotite: An improved version of an empirical geothermometer. Contrib. to Mineral. Petrol. 1991, 106, 431–439. [Google Scholar] [CrossRef]
  68. Karato, S.; Jung, H.; Katayama, I.; Skemer, P. Geodynamic significance of seismic anisotropy of the upper mantle: New insights from laboratory studies. Annu. Rev. Earth Planet. Sci. 2008, 36, 59–95. [Google Scholar] [CrossRef] [Green Version]
  69. Jung, H.; Karato, S. Water-induced fabric transitions in olivine. Science 2001, 293, 1460–1463. [Google Scholar] [CrossRef] [PubMed] [Green Version]
  70. Tommasi, A.; Vauchez, A.; Godard, M.; Belley, F. Deformation and melt transport in a highly depleted peridotite massif from the Canadian Cordillera: Implications to seismic anisotropy above subduction zones. Earth Planet. Sci. Lett. 2006, 252, 245–259. [Google Scholar] [CrossRef]
  71. Park, M.; Jung, H. Microstructural evolution of the Yugu peridotites in the Gyeonggi Massif, Korea: Implications for olivine fabric transition in mantle shear zones. Tectonophysics 2017, 709, 55–68. [Google Scholar] [CrossRef]
  72. Kumamoto, K.M.; Warren, J.M.; Hansen, L.N. Evolution of the Josephine Peridotite Shear Zones: 2. Influences on Olivine Cpo Evolution. J. Geophys. Res. Solid Earth 2019, 124, 12763–12781. [Google Scholar] [CrossRef]
  73. Bernard, R.E.; Behr, W.M.; Becker, T.W.; Young, D.J. Relationships Between Olivine CPO and Deformation Parameters in Naturally Deformed Rocks and Implications for Mantle Seismic Anisotropy. Geochem. Geophys. Geosystems 2019, 20, 3469–3494. [Google Scholar] [CrossRef] [Green Version]
  74. Tommasi, A.; Langone, A.; Padrón-Navarta, J.A.; Zanetti, A.; Vauchez, A. Hydrous melts weaken the mantle, crystallization of pargasite and phlogopite does not: Insights from a petrostructural study of the Finero peridotites, southern Alps. Earth Planet. Sci. Lett. 2017, 477, 59–72. [Google Scholar] [CrossRef]
Figure 1. (a) Geological map of the field area with sample locations (black circles) modified after [41,61]. (b) Field photo of the spinel-bearing mylonites (location of Sample 6.4). In the red circle is a trail of elongated spinel. The dotted red line is a sigma opx porphyroclast indicating sinistral shear.
Minerals 11 01036 g001
Figure 2. Overview of the thin sections. (a) Optical microscope image of Sample 6.6 under crossed polarized light. Opx porphyroclasts and some cpx porphyroclasts are visible, within an olivine-rich matrix. There are several fine-grained polymineralic layers visible (dashed white lines). Some of the opx porphyroclasts are elongated. Indicated is the location of Figure 5c (white ellipse) and the olivine matrix analyzed with EBSD displayed in Figure 8 (white ellipse); also indicated is the location of (c). (b) Optical microscope image of Sample 8.4 under crossed polarized light. The sample is similar to Sample 6.6 but shows fewer opx porphyroclasts and an increasing amount of fine-grained polymineralic layers. Some opx porphyroclasts are elongated as shown by the stippled line. Some opx porphyroclasts are recrystallized (black circle). (c) Part of (a) as backscatter electron (BSE) image. The bright phase is cpx, the medium gray is olivine/opx and the dark is serpentine. The polymineralic layers contain cpx as indicated in the white circle. All the cpx porphyroclasts show tails of smaller, cpx ± olivine neoblasts. (d) Optical microscope image of Sample 8.3 under crossed polarized light. Thin dark layers parallel (dashed lines) to the olivine matrix are fine-grained polymineralic layers. The sample also shows later stage vertical fractures that offset these thin layers (white arrow).
Minerals 11 01036 g002
Figure 3. (a) Optical microscope image with crossed polarized light of a polymineralic fine-grained layer (ultramylonite) within the olivine-dominant matrix. Location of (b) is indicated. (b) Backscatter electron (BSE) image of part of the fine-grained polymineralic layer. Visible are fine-grained cpx grains (lightest gray) and opx + ol grains within the layer. Gray values for opx and ol are very similar. In addition, in this image cpx grains are visible within the olivine matrix (arrows). (c) Optical microscope image of part of a fine-grained layer with horizontal cracks (dashed red line). (d) BSE image of a fine-grained layer. Darkest grains are opx, gray is olivine and light gray is cpx. Dashed lines show thin elongated opx grains on the border of olivine grains.
Minerals 11 01036 g003
Figure 4. Orthopyroxene porphyroclasts. (a) Optical microscope image under crossed polarized light of an orthopyroxene porphyroclast with olivine embayments (arrow). Indicated is the location of the EBSD map of Figure 10. (b) Optical microscope image under crossed polarized light of an elongated opx porphyroclasts surrounded by fine-grained polymineralic layers. The porphyroclast shows embayments of olivine (arrow). (c) BSE image of an opx porphyroclast (dashed white line) showing cpx exsolution lamellae and olivine embayment (arrow). The porphyroclast is located in a fine-grained polymineralic (opx + ol + cpx + spinel) matrix. (d) BSE image of a kinked opx porphyroclast (black dashed line traces a cpx exsolution lamellae) with small cpx (white arrows) on the kinks and grains at the border. (e) Folded opx porphyroclasts with cpx exsolution lamellae and a fine-grained polymineralic rim. (f) Orthopyroxene porphyroclast surrounded by relatively coarse grains of opx (compared to (e)). Some opx grains show close to 120° interfacial angles at triple junctions (red circle). The area in the white circle includes, besides opx, smaller grains of olivine, cpx and spinel.
Minerals 11 01036 g004
Figure 5. (a) BSE image of recrystallized cpx porphyroclasts adjacent to the porphyroclast cpx neoblasts, and further away a tail of cpx + olivine. (b) Optical microscope image with crossed polarizers of a recrystallized cpx layer. (c) BSE image of cpx and olivine grains in the matrix (ROI 32).
Minerals 11 01036 g005
Figure 6. (a) Band contrast image of a recrystallized cpx porphyroclast (ROI12). The red circle shows an area with fine-grained layers in between larger grains. (b) Grain orientation spread (GOS) map of diopside, displaying the internal misorientation of the grains. (c) Phase map. The red circle shows mixed olivine and cpx domains at the border of the clast. (d) Clinopyroxene and olivine CPO.
Minerals 11 01036 g006
Figure 7. (a) BSE image of a cpx porphyroclast with recrystallized tail of olivine and cpx neoblasts. (b) Diopside orientation map of the recrystallization tail (ROI33). White arrows show one grain of diopside with irregular boundaries and olivine in between. (c) Phase map of the same area as in (b). The CPOs of clinopyroxene and olivine are also shown.
Minerals 11 01036 g007
Figure 8. Forsterite and diopside CPO of the matrix displayed in Figure 6c (ROI32) and of the olivine matrix (ROI31).
Minerals 11 01036 g008
Figure 9. (a) Phase map of an opx porphyroclast with a recrystallization tail (dashed line) within the olivine matrix; also indicated are the area percentages of the phases and the amount of grain and phase boundaries of the recrystallization tail (ROI25). (b) Pole figure of enstatite orientations in the recrystallization tail. The white dot shows the orientation of the opx porphyroclast. (c) Pole figure of forsterite orientations in the recrystallization tail. (d) Pole figure of forsterite orientations in the matrix.
Minerals 11 01036 g009
Figure 10. (a) Phase map of a recrystallization tail of an opx porphyroclast (ROI20), located at the top left of the map. The white arrows indicate an olivine embayments in the opx porphyroclast and an opx neoblast. The white dashed lines follow cracks along which small grains are visible. Shown at the top right are the grain and phase boundary percentages and area percentages. (b) Band contrast image and the grain orientation spread (GOS) in each enstatite grain. (ce) CPO of enstatite, diopside and forsterite.
Minerals 11 01036 g010
Figure 11. (a) Band contrast image of a fine-grained layer (ROI19). Cracks, parallel to the layer, go through the fine-grained part of the layer (dashed white line). There are more cracks parallel to this layer. (b) Phase map of the fine-grained layer. At the top is an olivine-rich layer with small grains of other phases on the grain boundaries. The grain shapes are very irregular in the fine-grained layer. Bigger opx grains at the right of the map show embayments of olivine (white arrows). (ce) CPO of forsterite, diopside and enstatite.
Minerals 11 01036 g011
Figure 12. (a) Cr2O3 (wt.%) vs. Al2O3 (wt.%) in opx; (b) CaO vs. Al2O3 in opx; (c) Cr2O3 (wt.%) vs. Al2O3 (wt.%) in cpx; (d) TiO2 (wt.%) vs. Al2O3 (wt.%) in cpx. Red symbols are porphyroclast, orange symbols are neoblasts and yellow symbols are grains in fine-grained layers.
Minerals 11 01036 g012
Figure 13. Sketches of the rifting (modified after [61]) in the left panels, and the corresponding microstructural evolution in the spinel shear zones of the Erro-Tobbio peridotite (locations indicated with the red circle and ellipses) in the right panel. The white arrows indicate the movement directions of the lithosphere and asthenosphere. The microstructures show the evolution from the undeformed peridotite with large grains of olivine (green), opx (red) and cpx (yellow). During the first stage of thinning, cpx and olivine recrystallize, whereas opx porphyroclasts elongate or remain equigranular. During ongoing thinning melt infiltrates, reacts with the dynamically recrystallized cpx grains and opx porphyroclasts, forming cpx+ol fine-grained layers and opx + ol + cpx fine-grained layers.
Minerals 11 01036 g013
Figure 14. Olivine deformation mechanism map at 850 °C, showing in light gray the paleopiezometer [43]. The red circle on the right shows the average olivine grain sizes of the matrix (23–45 µm, Table 1) and the corresponding differential stresses calculated with the paleopiezometer. The left circle shows the range of average olivine grain sizes in the ultramylonite layers (5–12 µm, Table 1). Diffusion creep flow law from [14] and the disGBS flow law from [13].
Minerals 11 01036 g014
Table 1. Area percentages and grain sizes (µm), with the standard deviation, of all analyzed phases. The last column shows the proportion of phase boundaries (PB) of the total boundary length as a percentage.
Map
Name
TypeOlivineOpxCpxSpinelPargasitePB
AreaGrain
Size
AreaGrain
Size
AreaGrain
Size
AreaGrain
Size
AreaGrain
Size
ROI 12cpx rxs515 ± 7419 ± 128730 ± 41518 ± 20 47
ROI 16cpx rxs418 ± 11<118 ± 89536 ± 42<116 ± 6 25
ROI 33cpx rxs with ol3310 ± 61 6611 ± 9<1 63
ROI 32olivine + cpx5816 ± 8312 ± 43715 ± 739 ± 4 64
ROI 20small opx rxs4816 ± 124515 ± 12612 ± 819 ± 3 72
ROI 24small opx rxs6612 ± 83212 ± 1018 ± 3 61
ROI 25large opx rxs3314 ± 85017 ± 151515 ± 11210 ± 5 73
ROI 25Olivine8845 ± 30727 ± 11328 ± 10227 ± 10 45
ROI 31Olivine7323 ± 161517 ± 9917 ± 9210 ± 5 68
ROI 13Ultramylonite6212 ± 72912 ± 7911 ± 5 67
ROI 14Ultramylonite765 ± 4164 ± 364 ± 213 ± 1<1 52
ROI 19Ultramylonite5111 ± 73910 ± 879 ± 538 ± 9<17 ± 266
ROI 23Ultramylonite759 ± 6 218 ± 4 47 ± 4 52
Table 2. Results of geothermometry calculations for porphyroclasts, neoblasts and neoblasts in fine-grained layers. “n” indicates how many porphyroclasts or different areas in the thin section were measured and in brackets the total number of measurements is given. The temperatures are the averages in °C with their standard deviation.
nTCa-in-opxTAl-Cr-in-opxnT2-pyx
porphyroclasts4 (24)1059 ± 951022 ± 47
neoblasts6 (50)884 ± 58823 ± 596 (19)853 ± 32
fine-grained6 (29)846 ± 38775 ± 485 (14)843 ± 30
Publisher’s Note: MDPI stays neutral with regard to jurisdictional claims in published maps and institutional affiliations.

