Article

Modelling of the Chemical Halo of Dust Pollution Migration in Loparite Ore Tailings Storage Facilities

by
Eugenia Krasavtseva
1,2,
Victoria Maksimova
1,2,
Dmitriy Makarov
2,* and
Eugeniy Potorochin
2
1
Laboratory of Nature-Inspired Technologies and Environmental Safety of the Arctic, Kola Science Centre, Russian Academy of Sciences, Apatity 184209, Russia
2
Kola Science Centre, Institute of North Industrial Ecology Problems, Russian Academy of Sciences, Apatity 184209, Russia
*
Author to whom correspondence should be addressed.
Minerals 2021, 11(10), 1077; https://doi.org/10.3390/min11101077
Submission received: 10 September 2021 / Revised: 27 September 2021 / Accepted: 27 September 2021 / Published: 30 September 2021
(This article belongs to the Section Environmental Mineralogy and Biogeochemistry)

Abstract

:
The article presents a study of the environmental impact of dusting tailing dumps of rare-metal ore dressing in the Murmansk region of Russia. The purpose of the study was to establish patterns in the atmochemical halo migration of the dust pollution of loparite ore dressing tailings. The geotechnical characteristics and material composition of the tailings material have been investigated. Potentially dusty areas identified. Models of dispersion of inorganic dust under different meteorological scenarios are constructed: at low wind load, normal and unfavorable meteorological conditions. The modeling of the spread of pollutants in the area exposed to dust at the storage site was carried out in the program for modeling atmospheric pollution Ecolog-4.60. Calculation of the dispersion of inorganic dust containing 20–70% SiO2 showed that the atmochemical halo of tailings dust pollution spreads over tens of kilometers, and already at a wind speed of about 8 m/s, the concentration of suspended solids at the border of the enterprise sanitary protection zone exceeds the maximum one-time maximum permissible concentration is 3–3.3 times, and under unfavorable meteorological conditions—Dusting reaches the boundaries of the residential area (inhabited locality Revda), located in the north-west of the enterprise, and exceeds the MPCm.o. 1.5 times.

1. Introduction

In the process of mining and concentration of ores, in particular rare-metal ores, a huge amount of waste is generated, the bulk of which is ground ore concentration tailings stored at dedicated storage facilities [1,2,3,4,5]. When in active operation, which can be on the scale of decades, the tailings storage facility surface can reach several square kilometers and is virtually devoid of vegetation. Fluctuations in air temperature, humidity, and wind speeds lead to dust formation on the surface. The susceptibility of tailing dumps to wind erosion increases due to the artificially modified terrain, poor surface vegetation growth, and insufficient reclamation efforts [6]. The problem of air pollution not only at the global, but at the regional and local levels and its negative impact on the state of ecosystems and human health is a serious problem throughout the world [7,8,9,10].
High concentrations of solid particles have a multifactorial effect on the processes of acidification and eutrophication of ecosystems [11], the emergence of respiratory and cardiovascular diseases risk in humans [12], on various meteorological processes, precipitation and regional climate [13,14,15,16]. Long-term human exposure to portable particulate matter is currently associated with a wide range of potential health risks.
The effects of dust particles on living organisms differ in particle size. Thus, exposure to PM 10 particles is associated with respiratory diseases [17], including chronic obstructive pulmonary disease and other pathological conditions of the human respiratory system [18]; exposure to PM 2.5 particles has been associated with anemia [19]. According to existing epidemiological studies, the effect of PM 2.5–10 particles is systemic, has a biological effect on the immune response, exhibits cytotoxicity and potential mutagenicity in relation to body cells, and is also associated by researchers with cardiovascular diseases, asthma, hypertension, stroke [20,21].
Disposal of waste generated during the operation of rare earth deposits is the reason for the increase in the concentration of REEs in the environment, especially in the areas of active mining operations [22,23].
Recently, a significant number of studies have been devoted to the pollution and distribution of rare-earth elements (REE) in water bodies [24,25,26] and soils [27,28,29,30], however, the number of studies on the concentration of REE-containing solid particles in the air is limited. Research is mainly focused on the transfer of REEs in atmospheric dust to the surface of the oceans [31,32] and the content of REEs in particulate matter in cities [33,34,35].
The main methods for studying dust emissions and the spread of pollutants at present are field measurements [6], physical approaches, computer modeling of scattering and particle transport flows [36], and their combinations. Computational fluid dynamics (CFD) is widely used in dust transport calculations. The use of CFD makes it possible to obtain the values of the concentrations of pollutants taking into account the relief, the presence of buildings, local aerodynamics and turbulence [37]. The article by Schulz et al. [38] presents a modified numerical approach to modeling dust emission during loading and unloading operations with bulk materials. A feature of the approach is the combination of the discrete element method (DEM) to describe the motion of particles with the CFD method to simulate the gas-dust phase. The work by Kontos et al. [39] is devoted to the creation of an accurate regional dust modeling system in the Central Middle East (CME) using a combination of the Natural Emission MOdel (NEMO) natural emission model, the Weather Research and Forecasting (WRF) meteorological model and the Comprehensive Air quality Model with extensions (CAMx) chemical transport model.
The first work on modeling dust transfer on the Kola Peninsula began in the 1980s, when the scattering fluxes of elements from the apatite-nepheline tailing dump were calculated using numerical modeling methods based on the author’s models and computer programs, in which the equations describing the processes of aerothermogasdynamics were solved finite-difference methods on non-uniform rectangular grids [40,41].
In the article by Amosov et al. [42], the calculation of the transfer of multi-dispersed dust from the tailing dump of apatite-nepheline ores at different heights of the beach was carried out using a CFD model. Later, in the work by Amosov and Baklanov [43], a new methodological approach was introduced to assess the vertical flow of the tailings dust mass, based on the “DEAD” scheme [44] and processing the results of a two-dimensional CFD model of the dusting area. Using the COMSOL program in the article by Amosov et al. [45], an assessment was carried out by numerical modeling of atmospheric pollution levels depending on the discrete location of dusty areas of the apatite-nepheline tailing dump area closest to the city and the wind flow velocity. The process of spreading dust pollution is modeled by numerically solving the convective-diffusion equation for the transfer of an admixture, taking into account the sedimentation rate.
In our work, the unified program for calculating atmospheric pollution “Ecolog” (version 4), developed by “Integral”, is used to calculate surface dust concentrations. The program implements the techniques [45,46,47,48] used in Russia to conduct environmental impact assessment.
The aim of the study is modelling of the chemical halo of dust pollution migration in loparite ore tailings storage facilities.
The objectives of the study are: to investigate the loparite ore dressing tailings, to identify potentially dusty areas of the tailing dump, to build a model for dispersing inorganic dust under different meteorological scenarios.

2. Materials and Methods

We studied the loparite ore dressing tailings from the surface layer (not deeper than 8 cm) in a decommissioned area of a mining tailings storage facility. The operation’s saleable product (loparite concentrate) is a complex commodity used as a mineral feed in the production of tantalum, niobium, REE of the cerium group, and titanium [49].
Sampling of the dressing tailings and soils at key locations was carried out in the summer (in august) of 2020 by the staff of the Institute of Industrial Ecology of the North, Kola Science Centre, Russian Academy of Sciences (INEP KSC RAS) (Figure 1).
Sieve analysis was carried out using a sieve impact analyzer AC–200U. with a set of sieves (mesh 1, 0.5, 0.25, 0.1, 0.071 mm). The content of fine particles was determined using a laser diffraction particle size analyzer LS13320 (Beckman Coulter) in combination with PLDI technology (recording the differential intensity of polarized light).
Over twenty tail samples have been analyzed. Each sample was dried to constant weight, and weighed portions were taken by quartering, which were transferred to analysis. A 200 mg sample of the ground was subjected to open acid decomposition with a mixture of HNO3, HF, HCl in glass-carbon crucibles. After decomposition, the solutions were transferred into polypropylene 50- or 100-mL tubes, which were filled to the mark with a 2% HNO3 solution. A 2% HNO3 solution was also used to dilute the solutions.
Analysis was performed using an ELAN 9000 DRC-e inductively coupled plasma mass spectrometer (by Perkin Elmer, Waltham, MA, USA). To calibrate the instrument, was used the standard solutions ICP-MS Calibration Standard IV-STOCK-21 and IV-STOCK-29 (by Inorganic Ventures, Christiansburg, VA, USA) with a mass concentration of the measured elements of 10 mg/dm3. The measurement error did not exceed 0.5% at p = 0.95 [50].
The mineral composition of the tailings was studied by powder X-ray diffraction using a DRON-2.0 instrument (Cu-Kα radiation).
Based on the bulk tailings and soils chemistry analysis, the enrichment factor (EF) was calculated as the ratio of the target element Ci concentration to its content in the parent rock CP: EF = Ci/CP [51,52]. Gross content of the element in the C horizon of the region’s native soils was taken as the background value [52]. In the absence of background values, the comparison was based on the clarke content of the element in the earth’s crust, determined for acid (SiO2 > 60%) rocks as described in Vinogradov [53].
EF values were interpreted as suggested by Sakan et al. [54] into seven classes in Table 1.
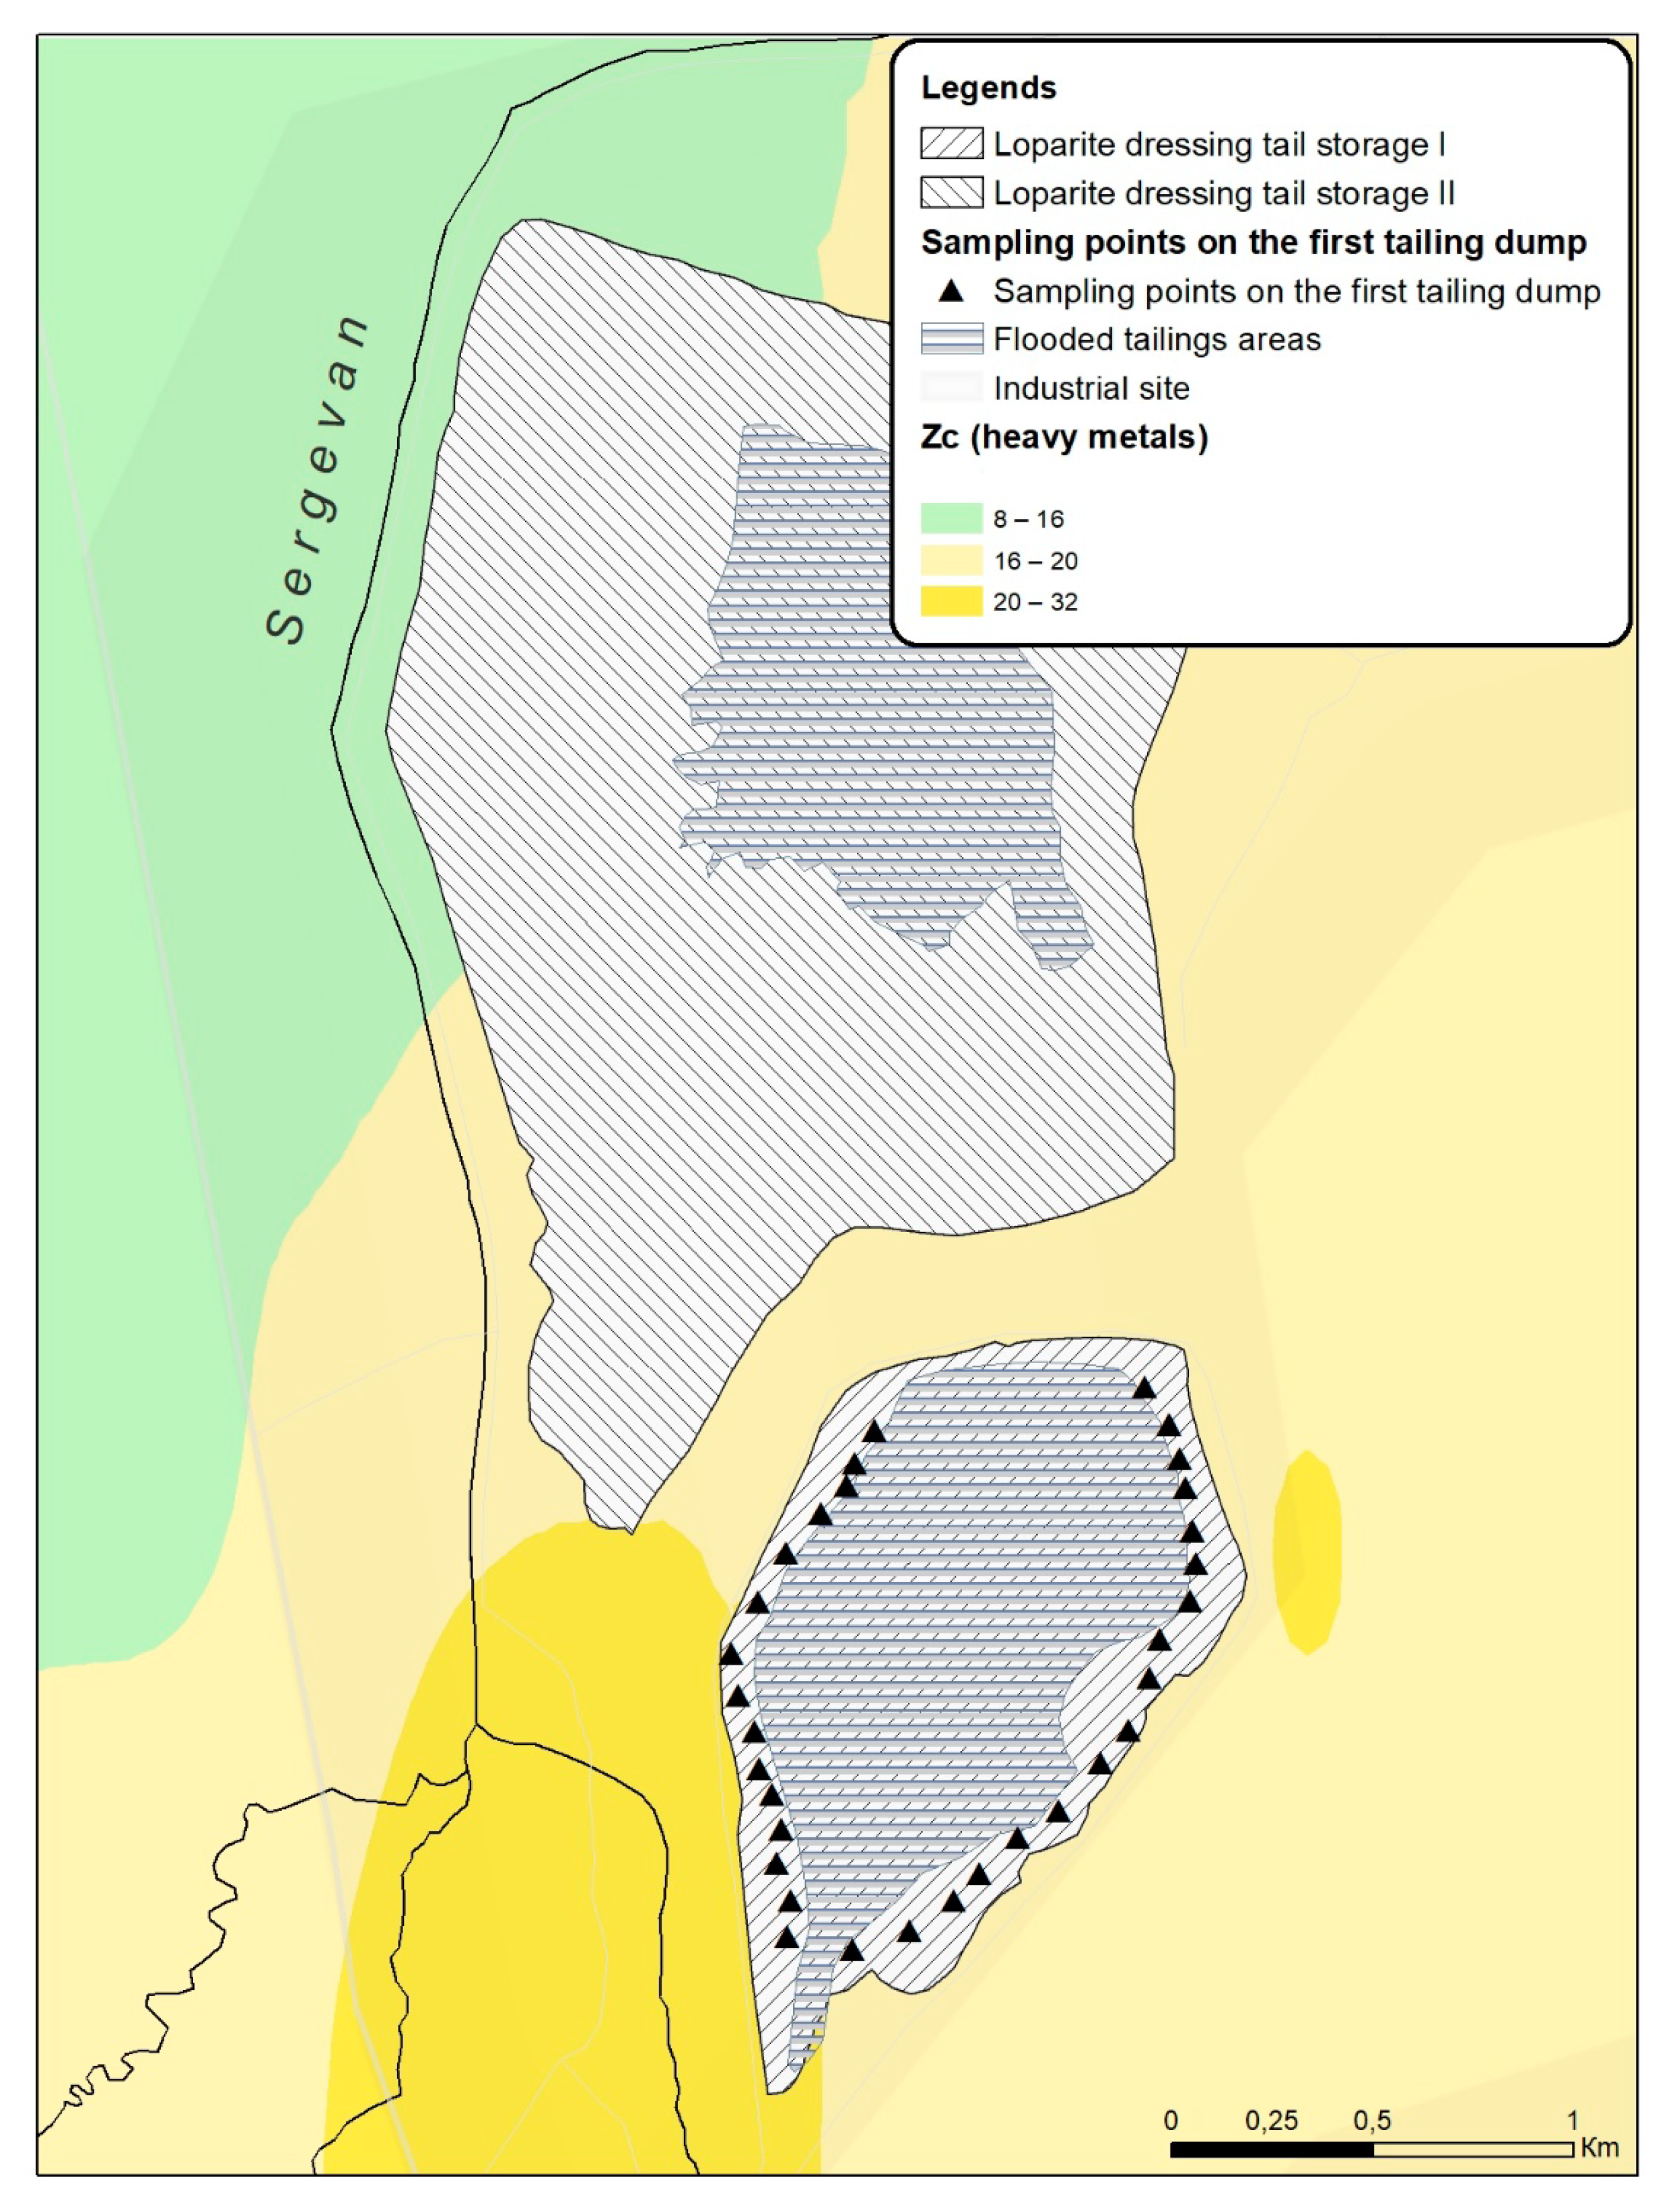
Zones of active dusting were established on the basis of data obtained after determining the engineering-geological characteristics of the material of the tailings (ArcGIS 10 program).
Meteorological data were received at the official request to the Department of Hydrometeorology and Environmental Monitoring. The rate of dust emission from the sites was calculated using the “Mining Works” program, version 1.30.11 of 08/10/2019, which implements a number of techniques [47,55].
The total dust emission is determined by the formula:
M = 86.4·Qdust·Sot·K2·K7·(365 − Tc)·(1 − h)·10−6 t/year
Blade height = 10 m
Wind speed = 5 m/s Qdust = 3.7 mg/m2·s
Wind speed = 8 m/s Qdust = 14.3 mg/m2·s
Wind speed = 10 m/s Qdust = 26.7 mg/m2·s
Sot = 41,200 m2—dump area.
K2 = 0.20—coefficient taking into account the moisture content of the material (moisture content: 9.1–10%).
K7 = 0.1—coefficient taking into account the efficiency of blowing off dust from the surface of the dump. Elapsed time since decommissioning: more than three years.
Tc = 186—the average annual number of days with stable snow cover or precipitation in the form of rain.
h = 0.000—efficiency of dust suppression.
Qdust—one-off emission per unit area.
The maximum one-time dust emission is determined by the formula:
G = Qdust·S·K2·K7·(1 − h)·10−3 g/s
To graphically display the patterns of migration of the atmochemical halo of dust pollution from tailings, a calculation was made of the complete dispersion of inorganic dust containing 20–70% SiO2 and a particle size of less than 100 microns in the surface layer of the atmosphere using standardized techniques and software (UPRZA “Ecolog” version 4.60), implementing MPR-2017 “Methods for calculating the dispersion of emissions of harmful (polluting) substances into the atmospheric air” (approved by order of the Ministry of Natural Resources of Russia dated 6 June 2017 No. 273), as described in [56].
The calculation was carried out for various meteorological conditions:
(1)
low wind load, at which the wind speed does not exceed 5 m/s;
(2)
normal meteorological conditions under which the wind speed does not exceed 8 m/s;
(3)
unfavorable meteorological conditions under which the wind speed exceeds 10 m/s.
For the calculation, we used the data of meteorological characteristics of the tailing dump area (data from the Lovozero meteorological station: No. according to the WMO (World Meteorological Organization) classification 22127, coordinates 68.0048528, 35.0269568. Source of information on actual weather [57]. Information the actual weather is received from the international exchange data server, NOAA, Asheville, NC, USA, in SYNOP and METAR formats).

3. Results and Discussion

Loparite ore dressing tailings were partially studied in [58]. Heterogeneity was found of the material composition and of the content of valuable components, and the likelihood was shown of loose tailings dusting in dry windy weather conditions.
Sieve analysis of the tailings indicated the predominant fractions are 0.1–0.5 mm, which is about 70% of the total weight of the tailings (Figure 2). The average content of the PM 10 fraction in the tailings was 2.38%. The coefficient of variation of the share of this fraction (0.8) indicates a heterogeneous grain size distribution of the studied samples.
Mass percentage of the chemical composition of the tailings: SiO2-48.08, TiO2-1.1, Al2O3-22.47, Fe2O3-5.3, FeO-0.66, MnO-0.23, CaO-1.63, MgO-0.45, K2O-4.24, Na2O-13.33, P2O5-0.79, SrO-0.33, F-0.08, SO3-0.08. Thus, the loparite ore dressing tailings are inorganic dust containing 20–70% SiO2, belonging to the III hazard class [59,60].
The total content of some elements in the tailings is shown in Table 2.
By X-ray phase analysis, the dominant phases were identified (listed in descending order): nepheline, microcline, aegirine, albite, sodalite (Figure 3). Minor impurities of loparite, analcime, natrolite were also found.
Moisture content measurements of the tailings samples were mapped in ArcGIS 10 (Figure 4). Areas with a moisture content of less than 10% were selected as sources of dust entering the atmosphere.
Figure 5 shows a relationship between maximum one-off emission (g/s) of inorganic dust containing 20–70% of SiO2 during a dusting event at the tailings storage facility and wind speed and humidity, with a clear increase in dust input into the atmosphere at wind speeds higher than 5 m/s.
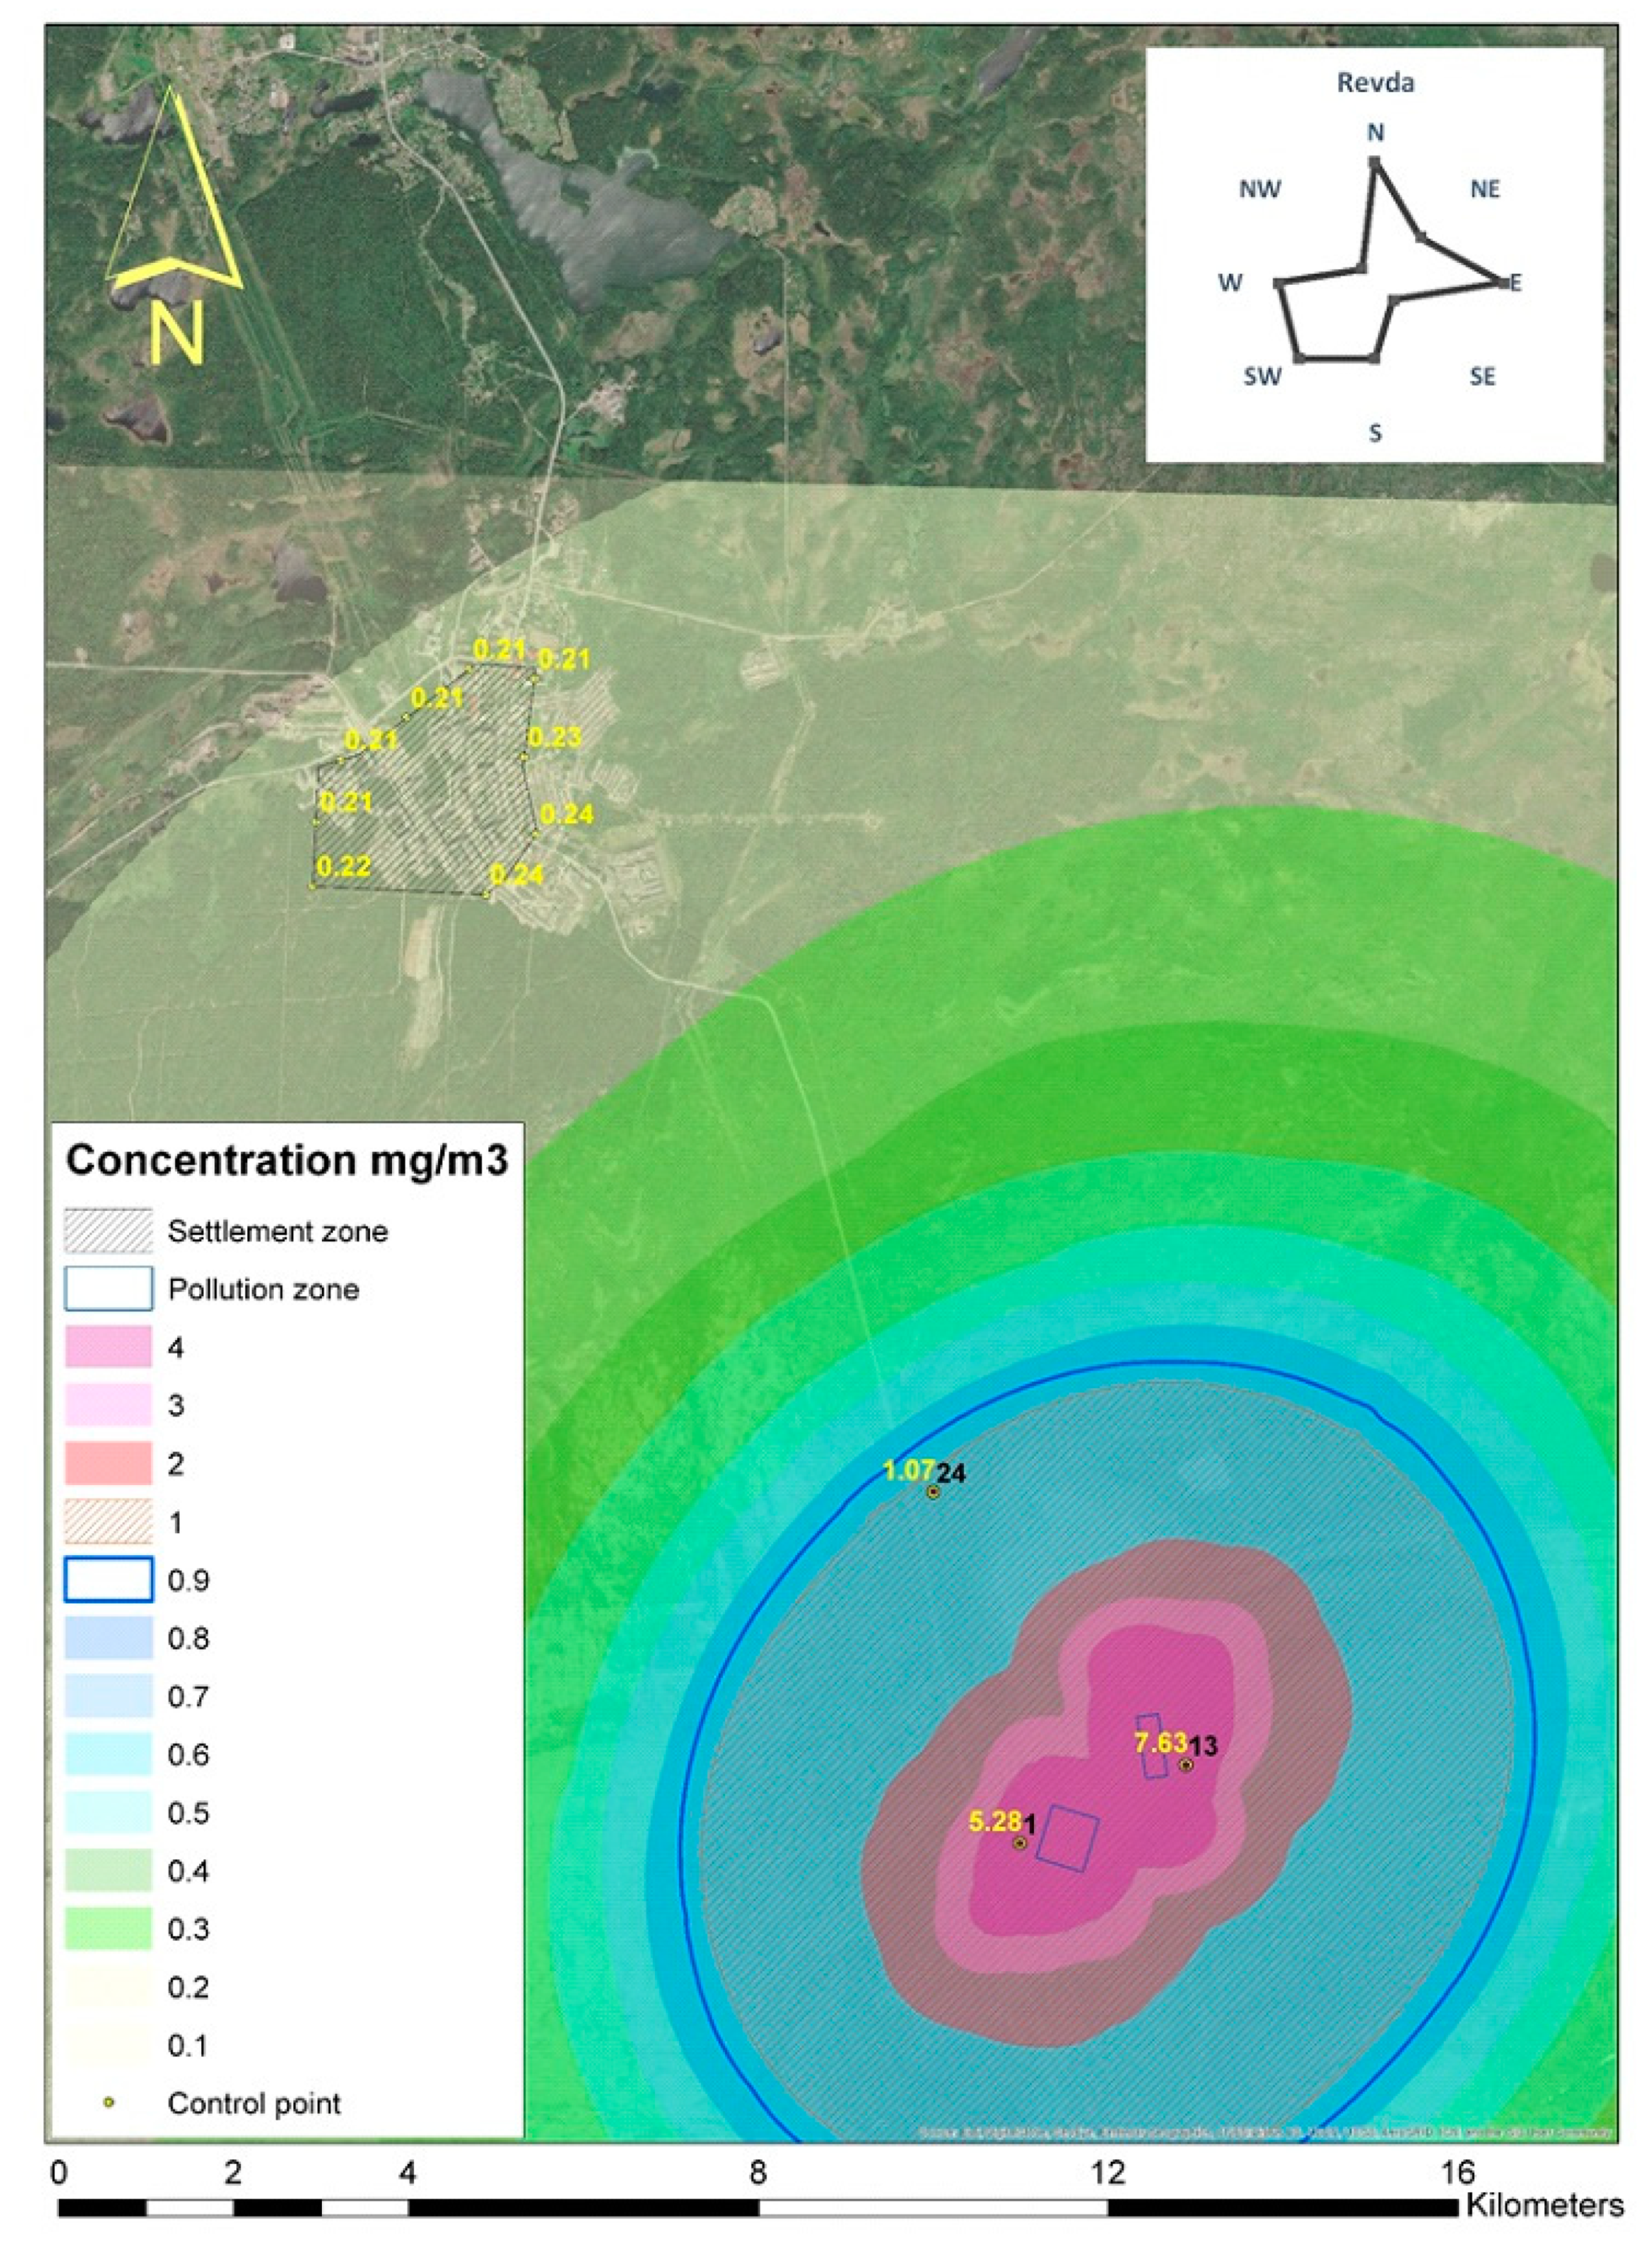
Inorganic dust containing 20–70% SiO2 was studied. Graphical results of calculating the tailings inorganic dust complete dispersion in the surface atmosphere for various meteorological conditions, using the software product UPRZA “Ecolog” 4.60, are presented in Figure 6, Figure 7 and Figure 8. The schemes also present the results of calculating the surface inorganic dust concentrations in different parts of the inhabited locality Revda, located in the north-west of the enterprise.
Analysis of the results of calculating the dispersion of inorganic dust containing 20–70% SiO2 in the surface atmosphere of the region showed that at a low wind load (5 m/s), the surface concentration of suspended solids at the sanitary protection zone (SPZ) border exceeds the maximum one-time maximum permissible concentration (MPCm. o. = 0.3 mg/m3 [61]) 2–2.5 times.
The dimensions of the SPZ for the storage of loparite ore dressing tailings are established in accordance with [61]. The enterprise considered in this work, according to the sanitary classification, belongs to class I (4.1.3.6 Mining and processing plants) and the size of the SPZ for all production facilities of the enterprise is 1 km [61].
The concentration of inorganic dust from tailings in the territory of the settlement Revda does not exceed the MPCm.o.
Under normal meteorological conditions (8 m/s), the concentration of tailings dust at the boundary of the SPZ exceeds the MPCm.o. 5–8 times, and in the southeastern part of the residential area of the inhabited locality Revda, the concentration of tailings dust approaches the threshold value, but does not exceed it yet.
In case of unfavorable meteorological conditions on the territory of the loparite ore dressing waste storage, the intensity of the tailing dump unsecured surface dusting increases. At the same time, the concentration of suspended solids at the SPZ border exceeds the MPCm.o. in 13–14 times, and in the residential area of the inhabited locality Revda, the excess reaches 1.5 times.
In accordance with the hygienic standard SanPiN 1.2.3685-21, which regulates the maximum permissible concentration of pollutants in the atmospheric air of settlements, MPCm.o. for inorganic dust containing 20–70% SiO2 is 0.3 mg/m3 [59,62].
According to the obtained meteorological data, wind gusts with a speed of more than 10 m/s were recorded for 19 days, during which no precipitation was observed, out of 92 summer days in 2020.
To test the model, we compared the obtained atmochemical halo of tailings dust pollution with the results of soil samples taken along the perimeter of the tailings dump analysis. The results of dispersion modeling fit well with the results of ground geo-chemical survey (Figure 9).
In more detail, our studies of chemical pollution of soils and plants in the zone of influence of the tailing dump were described in article [63]. Geochemical series (in mg/kg) of heavy metals and REEs in the loparite ore dressing tails and collected soil samples have the following form:
  • Concentration tailings: Mn > Sr > Ce > La > Nd > Pr > Sm
  • Location 1: Mn > Sr > Ce > La > Nd > Pr > Sm
  • Location 13: Mn > Sr > Ce > Nd > La > Pr > Sm
  • Location 24: Mn > Sr > Ce > La > Nd > Pr > Sm
Calculated enrichment factor for the tails and soils presented on Figure 10.
According to the above classification [54], loparite ore dressing tailings are characterized by moderately severe enrichment according to Ce (8.6), moderate enrichment Sr (3.12), minor enrichment Zn, Pr, La, Nd, Mn and Sm, EF values are 2.86, 2.83, 2.66, 2.30, 2.25 and 1.38 respectively. Soil samples taken in the direction coinciding with the most frequently repeated wind directions (points No. 1 and 13—southwest and southeast) are also enriched in rare earth elements of the light group and heavy metals that are part of the tailings thickening of loparite ores (Sr, Zn, Mn). Samples taken in the direction with the least repeatability of winds are characterized by correspondingly enrichment factor lower values for key elements. Noteworthy is the lack of relationship between the “wind rose” and the content of Pb and Cd in soils. This allows us to conclude that other sources of input make a significant contribution to the pollution with these soil elements. As known, major sources of soil contamination by metals: metal mining, smelting, energy and fuel production, industrial activities, solid waste disposal, sludge application, vehicular exhaust, and wastewater irrigation [64,65,66,67,68].
In the works of foreign colleagues who studied soil pollution around the enterprises of the rare-earth industry, abnormally high concentrations of elements that make up the mined ores were also noted in comparison with the background concentrations [69,70].

4. Conclusions

We studied loparite ores dressing tailings from an early area of the storage facility, decommissioned 35 years ago. The material of the tailings is mainly composed of nepheline, microcline, aegirine; impurities of loparite, analcime, natrolite were also found. The average content of light REEs—cerium, lanthanum, neodymium—is 0.09%, 0.02%, and 0.001%, respectively.
Laboratory studies of the tailings engineering and geological characteristics have shown that the high content of finely dispersed tailings fractions in the surface layer of the tailing dump is the main reason for the intense open beaches dusting, due to rapid drying under the influence of the sun and wind, and easily become suspended even at low wind intensity.
Calculation of the inorganic dust containing 20–70% SiO2 dispersion showed that the atmochemical halo of tailings dust pollution spreads over tens of kilometers. At a wind speed of about 8 m/s, the concentration of suspended solids at the enterprise SPZ border exceeds the MPCm.o. 3–3.3 times. Under unfavorable meteorological conditions—with a wind speed of 10 m/s or more—dusting reaches the boundaries of the residential area of the inhabited locality Revda, located in the north-west of the enterprise, and exceeds the MPCm.o. 1.5 times.
The resulting distribution maps of inorganic dust was verified by chemical analysis of the collected soil samples. Our results indicate that dusting from the surface of the loparite ore dressing tailings storage facility makes a significant contribution to both atmospheric and general environmental pollution.

Author Contributions

Conceptualization, E.K., V.M. and D.M.; methodology, E.K. and V.M.; software, E.P.; investigation, E.K., V.M., D.M.; writing—original draft preparation, E.K., V.M. and D.M.; writing—review and editing, E.K., V.M. and D.M.; funding acquisition, D.M. All authors have read and agreed to the published version of the manuscript.

Funding

This research was funded by Russian government grant No. 0226-2019-0047 and 0226-2019-0011. The research was financially supported by the Russian Foundation for Basic Research (projects No. 18-05-60142 Arctic and No. 19-05-50065 Microcosm) and by the Kolarctic CBC 2014-2020 programme, project no. KO1030 “Supporting Environmental Economic and Social Impacts of Mining Activity.”

Data Availability Statement

Not applicable.

Acknowledgments

The authors are grateful to A. V. Timokhin, A. A. Goryachev for help in sampling; to E.A. Selivanova-for X-ray phase analysis of samples; to the collective of the INEP Center for Collective Use of the KSC RAS-for the analysis of solutions and tailing material.

Conflicts of Interest

The authors declare no conflict of interest.

References

  1. Edahbi, M.; Plante, B.; Benzaazoua, M. Environmental challenges and identification of the knowledge gaps associated with REE mine wastes management. J. Clean. Prod. 2019, 212, 1232–1241. [Google Scholar] [CrossRef]
  2. Buikema, N.; Zwissler, B.; Seagren, E.; Oommen, T.; Vitton, S. Stabilisation of iron mine tailings through biocalcification. Environ. Geotech. 2018, 5, 94–106. [Google Scholar] [CrossRef]
  3. Loredo, J.; Soto, J.; Álvarez, R.; Ordóñez, A. Atmospheric Monitoring at Abandoned Mercury Mine Sites in Asturias (NW Spain). Environ. Monit. Assess. 2006, 130, 201–214. [Google Scholar] [CrossRef] [PubMed]
  4. Corriveau, M.; Jamieson, H.; Parsons, M.; Campbell, J.; Lanzirotti, A. Direct characterization of airborne particles associated with arsenic-rich mine tailings: Particle size, mineralogy and texture. Appl. Geochem. 2011, 26, 1639–1648. [Google Scholar] [CrossRef]
  5. Lilic, N.; Cvjetic, A.; Knezevic, D.; Milisavljevic, V.; Pantelic, U. Dust and noise environmental impact assessment and control in Serbian mining practice. Minerals 2018, 8, 34. [Google Scholar] [CrossRef] [Green Version]
  6. Stovern, M.; Guzmán, H.; Rine, K.; Felix, O.; King, M.; Ela, W.; Betterton, E.; Sáez, A. Windblown Dust Deposition Forecasting and Spread of Contamination around Mine Tailings. Atmosphere 2016, 7, 16. [Google Scholar] [CrossRef] [PubMed] [Green Version]
  7. Castillo, S.; Alastuey, A.; Cuevas, E.; Querol, X.; Avila, A. Quantifying Dry and Wet Deposition Fluxes in Two Regions of Contrasting African Influence: The NE Iberian Peninsula and the Canary Islands. Atmosphere 2017, 8, 86. [Google Scholar] [CrossRef] [Green Version]
  8. Keresztesi, Á.; Birsan, M.; Nita, I.; Bodor, Z.; Szép, R. Assessing the neutralisation, wet deposition and source contributions of the precipitation chemistry over Europe during 2000–2017. Environ. Sci. Eur. 2019, 31, 50. [Google Scholar] [CrossRef] [Green Version]
  9. Szép, R.; Mateescu, E.; Niță, I.; Birsan, M.; Bodor, Z.; Keresztesi, Á. Effects of the Eastern Carpathians on atmospheric circulations and precipitation chemistry from 2006 to 2016 at four monitoring stations (Eastern Carpathians, Romania). Atmos. Res. 2018, 214, 311–328. [Google Scholar] [CrossRef]
  10. Bodor, Z.; Bodor, K.; Keresztesi, Á.; Szép, R. Major air pollutants seasonal variation analysis and long-range transport of PM10 in an urban environment with specific climate condition in Transylvania (Romania). Environ. Sci. Pollut. Res. 2020, 27, 38181–38199. [Google Scholar] [CrossRef]
  11. Gašparac, G.; Jeričević, A.; Kumar, P.; Grisogono, B. Regional-scale modelling for the assessment of atmospheric particulate matter concentrations at rural background locations in Europe. Atmos. Chem. Phys. 2020, 20, 6395–6415. [Google Scholar] [CrossRef]
  12. Wang, J.; Xie, X.; Fang, C. Temporal and Spatial Distribution Characteristics of Atmospheric Particulate Matter (PM10 and PM2.5) in Changchun and Analysis of Its Influencing Factors. Atmosphere 2019, 10, 651. [Google Scholar] [CrossRef] [Green Version]
  13. Tu, X.; Lu, Y.; Yao, R.; Zhu, J. Air Quality in Ningbo and Transport Trajectory Characteristics of Primary Pollutants in Autumn and Winter. Atmosphere 2019, 10, 120. [Google Scholar] [CrossRef] [Green Version]
  14. Muhammad, F.K.; Naila, Y.; Farrukh, C.; Imran, S. Temporal variability and characterization of aerosols across the Pakistan region during the winter fog periods. Atmosphere 2016, 7, 67. [Google Scholar] [CrossRef] [Green Version]
  15. Yang, W.; Wang, G.; Bi, C. Analysis of Long-Range Transport Effects on PM2.5 during a Short Severe Haze in Beijing, China. Aerosol Air Qual. Res. 2017, 17, 1610–1622. [Google Scholar] [CrossRef]
  16. Wu, D.; Zhang, F.; Ge, X.; Yang, M.; Xia, J.; Liu, G.; Li, F. Chemical and Light Extinction Characteristics of Atmospheric Aerosols in Suburban Nanjing, China. Atmosphere 2017, 8, 149. [Google Scholar] [CrossRef] [Green Version]
  17. Cao, L.M.; Zhou, Y.; Zhang, Z.; Sun, W.W.; Mu, G.; Chen, W.H. Impacts of airborne particulate matter and its components on respiratory system health. Chin. J. Prev. Med. 2016, 50, 1114–1118. [Google Scholar]
  18. Krewski, D.; Jerrett, M.; Burnett, R.T.; Ma, R.; Hughes, E.; Shi, Y.; Turner, M.C.; Thurston, G.; Calle, E.E.; Thun, M.J.; et al. Extended follow-up and spatial analysis of the American Cancer Society study linking particulate air pollution and mortality. Res. Rep. Health Eff. Inst. 2009, 140, 5–114, discussion 115–136. [Google Scholar]
  19. Mehta, U.; Dey, S.; Chowdhury, S.; Ghosh, S.; Hart, J.; Kurpad, A. The Association Between Ambient PM2.5 Exposure and Anemia Outcomes Among Children Under Five Years of Age in India. Environ. Epidemiol. 2021, 5, e125. [Google Scholar] [CrossRef] [PubMed]
  20. Brook, R.; Rajagopalan, S.; Pope, C.; Brook, J.; Bhatnagar, A.; Diez-Roux, A.; Holguin, F.; Hong, Y.; Luepker, R.; Mittleman, M.; et al. Particulate Matter Air Pollution and Cardiovascular Disease. Circulation 2010, 121, 2331–2378. [Google Scholar] [CrossRef] [PubMed] [Green Version]
  21. Thompson, J. Airborne Particulate Matter. J. Occup. Environ. Med. 2018, 60, 392–423. [Google Scholar] [CrossRef]
  22. Huang, X.; Deng, H.; Zheng, C.; Cao, G. Hydrogeochemical signatures and evolution of groundwater impacted by the Bayan Obo tailing pond in northwest China. Sci. Total Environ. 2016, 543, 357–372. [Google Scholar] [CrossRef]
  23. Schreiber, A.; Marx, J.; Zapp, P.; Hake, J.; Voßenkaul, D.; Friedrich, B. Environmental Impacts of Rare Earth Mining and Separation Based on Eudialyte: A New European Way. Resources 2016, 5, 32. [Google Scholar] [CrossRef] [Green Version]
  24. Cánovas, C.; Basallote, M.; Macías, F. Distribution and availability of rare earth elements and trace elements in the estuarine waters of the Ría of Huelva (SW Spain). Environ. Pollut. 2020, 267, 115506. [Google Scholar] [CrossRef]
  25. Tang, S.; Zheng, C.; Chen, M.; Du, W.; Xu, X. Geobiochemistry characteristics of rare earth elements in soil and ground water: A case study in Baotou, China. Sci. Rep. 2020, 10, 11740. [Google Scholar] [CrossRef]
  26. Antonina, A.; Shazili, N.; Kamaruzzaman, B.; Ong, M.; Rosnan, Y.; Sharifah, F. Geochemistry of the Rare Earth Elements (REE) Distribution in Terengganu Coastal Waters: A Study Case from Redang Island Marine Sediment. Open J. Mar. Sci. 2013, 03, 154–159. [Google Scholar] [CrossRef] [Green Version]
  27. Fabijańczyk, P.; Zawadzki, J. Complementary Use of Magnetometric Measurements for Geochemical Investigation of Light REE Concentration in Anthropogenically Polluted Soils. Minerals 2021, 11, 457. [Google Scholar] [CrossRef]
  28. Zhou, J.; Wang, X.; Nie, L.; McKinley, J.; Liu, H.; Zhang, B.; Han, Z. Geochemical background and dispersion pattern of the world’s largest REE deposit of Bayan Obo, China. J. Geochem. Explor. 2020, 215, 106545. [Google Scholar] [CrossRef]
  29. Ferreira, M.; Fontes, M.; Bellato, C.; Marques Neto, J.; Lima, H.; Fendorf, S. Geochemical signatures and natural background values of rare earth elements in soils of Brazilian Amazon. Environ. Pollut. 2021, 277, 116743. [Google Scholar] [CrossRef] [PubMed]
  30. Barbieri, M.; Andrei, F.; Nigro, A.; Vitale, S.; Sappa, G. The relationship between the concentration of rare earth elements in landfill soil and their distribution in the parent material: A case study from Cerreto, Roccasecca, Central Italy. J. Geochem. Explor. 2020, 213, 106492. [Google Scholar] [CrossRef]
  31. Aghnatios, C.; Losno, R.; Dulac, F. A fine fraction of soil used as an aerosol analogue during the DUNE experiment: Sequential solubility in water, decreasing pH step-by-step. Biogeosciences 2014, 11, 4627–4633. [Google Scholar] [CrossRef]
  32. Suresh, K.; Singh, U.; Kumar, A.; Karri, D.; Peketi, A.; Ramaswamy, V. Provenance tracing of long-range transported dust over the Northeastern Arabian Sea during the southwest monsoon. Atmos. Res. 2021, 250, 105377. [Google Scholar] [CrossRef]
  33. Tang, Y.; Han, G. Investigation of sources of atmospheric dust in Guiyang City, southwest China using rare earth element patterns. J. Earth Syst. Sci. 2019, 129, 18. [Google Scholar] [CrossRef]
  34. Gaberšek, M.; Gosar, M. Meltwater chemistry and characteristics of particulate matter deposited in snow as indicators of anthropogenic influences in an urban area. Environ. Geochem. Health 2020, 43, 2583–2595. [Google Scholar] [CrossRef] [PubMed]
  35. Zhou, H.; Chun, X.; Lü, C.; He, J.; Du, D. Geochemical characteristics of rare earth elements in windowsill dust in Baotou, China: Influence of the smelting industry on levels and composition. Environ. Sci. Process. Impacts 2020, 22, 2398–2405. [Google Scholar] [CrossRef] [PubMed]
  36. Stovern, M.; Felix, O.; Csavina, J.; Rine, K.; Russell, M.; Jones, R.; King, M.; Betterton, E.; Sáez, A. Simulation of windblown dust transport from a mine tailings impoundment using a computational fluid dynamics model. Aeolian Res. 2014, 14, 75–83. [Google Scholar] [CrossRef] [Green Version]
  37. Holmes, N.; Morawska, L. A review of dispersion modelling and its application to the dispersion of particles: An overview of different dispersion models available. Atmos. Environ. 2006, 40, 5902–5928. [Google Scholar] [CrossRef] [Green Version]
  38. Schulz, D.; Schwindt, N.; Schmidt, E.; Jasevičius, R.; Kruggel-Emden, H. Investigation of the dust release from bulk material undergoing various mechanical processes using a coupled DEM/CFD approach. Powder Technol. 2019, 355, 37–56. [Google Scholar] [CrossRef]
  39. Kontos, S.; Kakosimos, K.; Liora, N.; Poupkou, A.; Melas, D. Towards a regional dust modeling system in the central Middle East: Evaluation, uncertainties and recommendations. Atmos. Environ. 2021, 246, 118160. [Google Scholar] [CrossRef]
  40. Baklanov, A.; Rigina, O. Environmental modeling of dusting from the mining and concentration sites in the Kola Peninsula, Northwest Russia. In The XI World Clear Air and Environment Congress; IUAPPA-NACA: Durban, South Africa, 1998; Volume 1, 4F-3, pp. 1–18. [Google Scholar]
  41. Baklanov, A. Numerical Modeling in Mine Aerology; Kola branch of the USSR Academy of Sciences: Apatity, Russia, 1988; 200p. (In Russian) [Google Scholar]
  42. Amosov, P.V.; Baklanov, A.A.; Masloboev, V.A.; Mazuhkina, S.I. CFD-model development of dust transfer at a tailings dump. In Proceedings of the 4th International Conference on Hazardous and Industrial Waste Management—CRETE-2014, Chania, Greece, 2–5 September 2014; Sessions s25/5. Technical University of Crete: Chania, Greece, 2014; p. 9. [Google Scholar]
  43. Amosov, P.V.; Baklanov, A.A. Estimation of the vertical flow of dust mass at the tailing dump based on the DEAD scheme. Probl. Subsurf. Use 2015, 3, 80–85. (In Russian) [Google Scholar]
  44. Westphal, D.; Toon, O.; Carlson, T. A Case Study of Mobilization and Transport of Saharan Dust. J. Atmos. Sci. 1988, 45, 2145–2175. [Google Scholar] [CrossRef] [Green Version]
  45. Amosov, P.; Baklanov, A.; Makarov, D.; Masloboev, V. Estimating air pollution levels by numerical simulation depending on wind flow speed and dust source area. Izv. Vyss. uchebnykh Zaved. Gorn. zhurnal 2020, 80–89. (In Russian) [Google Scholar] [CrossRef]
  46. Guidelines on the Calculation, Regulation and Control of Polluting Emissions into the Atmospheric Air. Russian Scientific Research Institute of Atmospheric Air Protection (SRI-Atmosphere), St. Petersburg. 2012. Available online: https://files.stroyinf.ru/Data1/46/46202/index.htm (accessed on 29 September 2021). (In Russian).
  47. Order of the Government of the Russian Federation No. 1316-r. On Approving the List of Pollutants, Which Are Subject to State Regulation Measures in the Field of Environmental Protection. Available online: https://docs.cntd.ru/document/420286994 (accessed on 10 May 2019). (In Russian).
  48. Order No. 273. On Approval of Methods for Calculating the Dispersion of Emissions of Harmful (Polluting) Substances in the Air. Ministry of Natural Resources and Environment of the Russian Federation, Moscow. 2017. Available online: https://cdnimg.rg.ru/pril/143/84/68/47734.pdf (accessed on 29 September 2021). (In Russian).
  49. Tverdov, A.A. Rare metals of the Lovozero massif. Rare Earths Mag. 2016, 3, 164–169. (In Russian) [Google Scholar]
  50. Krasavtseva, E.; Maksimova, V.; Makarov, D. Conditions affecting the release of heavy and rare earth metals from the mine tailings Kola Subarctic. Toxics 2021, 9, 163. [Google Scholar] [CrossRef] [PubMed]
  51. Kabata-Pendias, A. Trace Elements in Soils and Plants; CRC Press: Boca Raton, FL, USA, 2011; 548p. [Google Scholar]
  52. Nikonov, V.V.; Lukina, N.V.; Bezel’, V.S.; Bel’sky, E.A.; Bespalov, A.Y.; Golovchenko, A.V.; Dobrovol’skaya, T.G.; Dobrovol’sky, V.V.; Zukert, N.V.; Isaeva, L.G.; et al. Kola Science Centre Scattered Elements in Boreal Forests; Nauka: Moscow, Russia, 2004; 616p. (In Russian) [Google Scholar]
  53. Vinogradov, A. Average contents of chemical elements in the main types of igneous rocks of the earth’s crust. Geochemistry 1962, 7, 555–571. (In Russian) [Google Scholar]
  54. Sakan, S.M.; Djordjevi, D.S.; Manojovic, D.D.; Plic, P.S. Assessment of heavy metal pollutants accumulation in the Tisza river sediments. J. Environ. Manag. 2009, 90, 3382–3390. [Google Scholar] [CrossRef] [PubMed]
  55. Order of the State Committee for Ecology of Russia. Methodology for Calculating Harmful Emissions (Discharges) for a Complex of Equipment for Open Pit Mining (Based on Specific Indicators). Ministry of Fuel and Energy of the Russian Federation, Lyubertsy. 1999. Available online: http://gost.donses.ru/Data1/59/59758/index.htm (accessed on 29 September 2021). (In Russian).
  56. Methodological Guide for Calculating Emissions from Fugitive Sources in the Building Materials Industry; ZAO Nipiotstrom: Novorossiysk, Russia, 2000; 28p. (In Russian)
  57. World Weather. Available online: https://rp5.ru/ (accessed on 29 September 2021). (In Russian).
  58. Goryachev, A.A.; Laschuk, V.V.; Krasavtseva, E.A.; Alfertyev, N.L.; Makarov, D.V. Geoecological assessment of the current state of tailing dumps of different ages at the Karnasurt mine. Proc. Fersman Sci. Sess. GI KSC RAS 2020, 17, 128–132. (In Russian) [Google Scholar] [CrossRef]
  59. Resolution of the Chief State Sanitary Doctor of the Russian Federation. Sanitary Regulations and Norms No. 1.2.3685-21. Sanitary and Epidemiological Requirements for the Maintenance of Urban and Rural Areas, for Water Bodies, Drinking Water and Drinking Water Supply, Atmospheric Air, Soils, Living Quarters, Operation of Industrial, Public Premises, Organizations and the Implementation of Sanitary and Anti-Epidemic (Preventive) Measures. 2021. Available online: https://docs.cntd.ru/document/573536177?marker=7DI0K8 (accessed on 29 September 2021). (In Russian).
  60. Resolution of the Chief State Sanitary Doctor of the Russian Federation. Sanitary Regulations and Norms No. 2.2.1/2.1.1.1200-03. Sanitary Protection Zones and Sanitary Classification Enterprises, Structures and Other Objects. 2008. Available online: https://docs.cntd.ru/document/902065388?section=text (accessed on 29 September 2021). (In Russian).
  61. Order of the Ministry of Natural Resources of Russia (Ministry of Natural Resources and Environment of the Russian Federation) No. 536. On Approval of the Criteria for Classifying Waste as I-V hazard Classes in Terms of the Degree of Negative Impact on the Environment. 2015. Available online: https://docs.cntd.ru/document/420240163?section=text (accessed on 29 September 2021). (In Russian).
  62. Serdyutskaya, L.F. Technogenic ecology. Mathematical and Cartographic Modeling; URSS: Moscow, Russian, 2009; 226p. (In Russian) [Google Scholar]
  63. Krasavtseva, E.A.; Maksimova, V.V.; Gorbacheva, T.T.; Makarov, D.V.; Alfertyev, N.L. Evaluation of soils and plants chemical pollution within the area affected by storages of loparite ore processing waste. Mine Surv. Subsurf. Use 2021, 112, 52–58. (In Russian) [Google Scholar]
  64. Ahmadipour, F.; Bahramifar, N.; Mahmood Ghasempouri, S. Fractionation and mobility of cadmium and lead in soils of Amol area in Iran, using the modified BCR sequential extraction method. Chem. Speciat. Bioavailab. 2014, 26, 31–36. [Google Scholar] [CrossRef]
  65. Qin, F.; Wei, C.; Zhong, S.; Huang, X.; Pang, W.; Jiang, X. Soil heavy metal(loid)s and risk assessment in vicinity of a coal mining area from southwest Guizhou, China. J. Cent. South Univ. 2016, 23, 2205–2213. [Google Scholar] [CrossRef]
  66. Kowalska, J.; Mazurek, R.; Gąsiorek, M.; Setlak, M.; Zaleski, T.; Waroszewski, J. Soil pollution indices conditioned by medieval metallurgical activity—A case study from Krakow (Poland). Environ. Pollut. 2016, 218, 1023–1036. [Google Scholar] [CrossRef] [PubMed]
  67. Baran, A.; Antonkiewicz, J. Phytotoxicity and extractability of heavy metals from industrial wastes. Environ. Prot. Eng. 2017, 43, 143–155. [Google Scholar] [CrossRef]
  68. Wieczorek, J.; Baran, A.; Urbański, K.; Mazurek, R.; Klimowicz-Pawlas, A. Assessment of the pollution and ecological risk of lead and cadmium in soils. Environ. Geochem. Health 2018, 40, 2325–2342. [Google Scholar] [CrossRef] [PubMed]
  69. Wang, L.; Liang, T. Geochemical fractions of rare earth elements in soil around a mine tailing in Baotou. China Sci. Rep. 2015, 5, 12483. [Google Scholar] [CrossRef] [Green Version]
  70. Wang, L.; Liang, T. Anomalous abundance and redistribution patterns of rare earth elements in soils of a mining area in Inner Mongolia, China. Environ. Sci. Pollut. Res. 2016, 23, 11330–11338. [Google Scholar] [CrossRef] [PubMed]
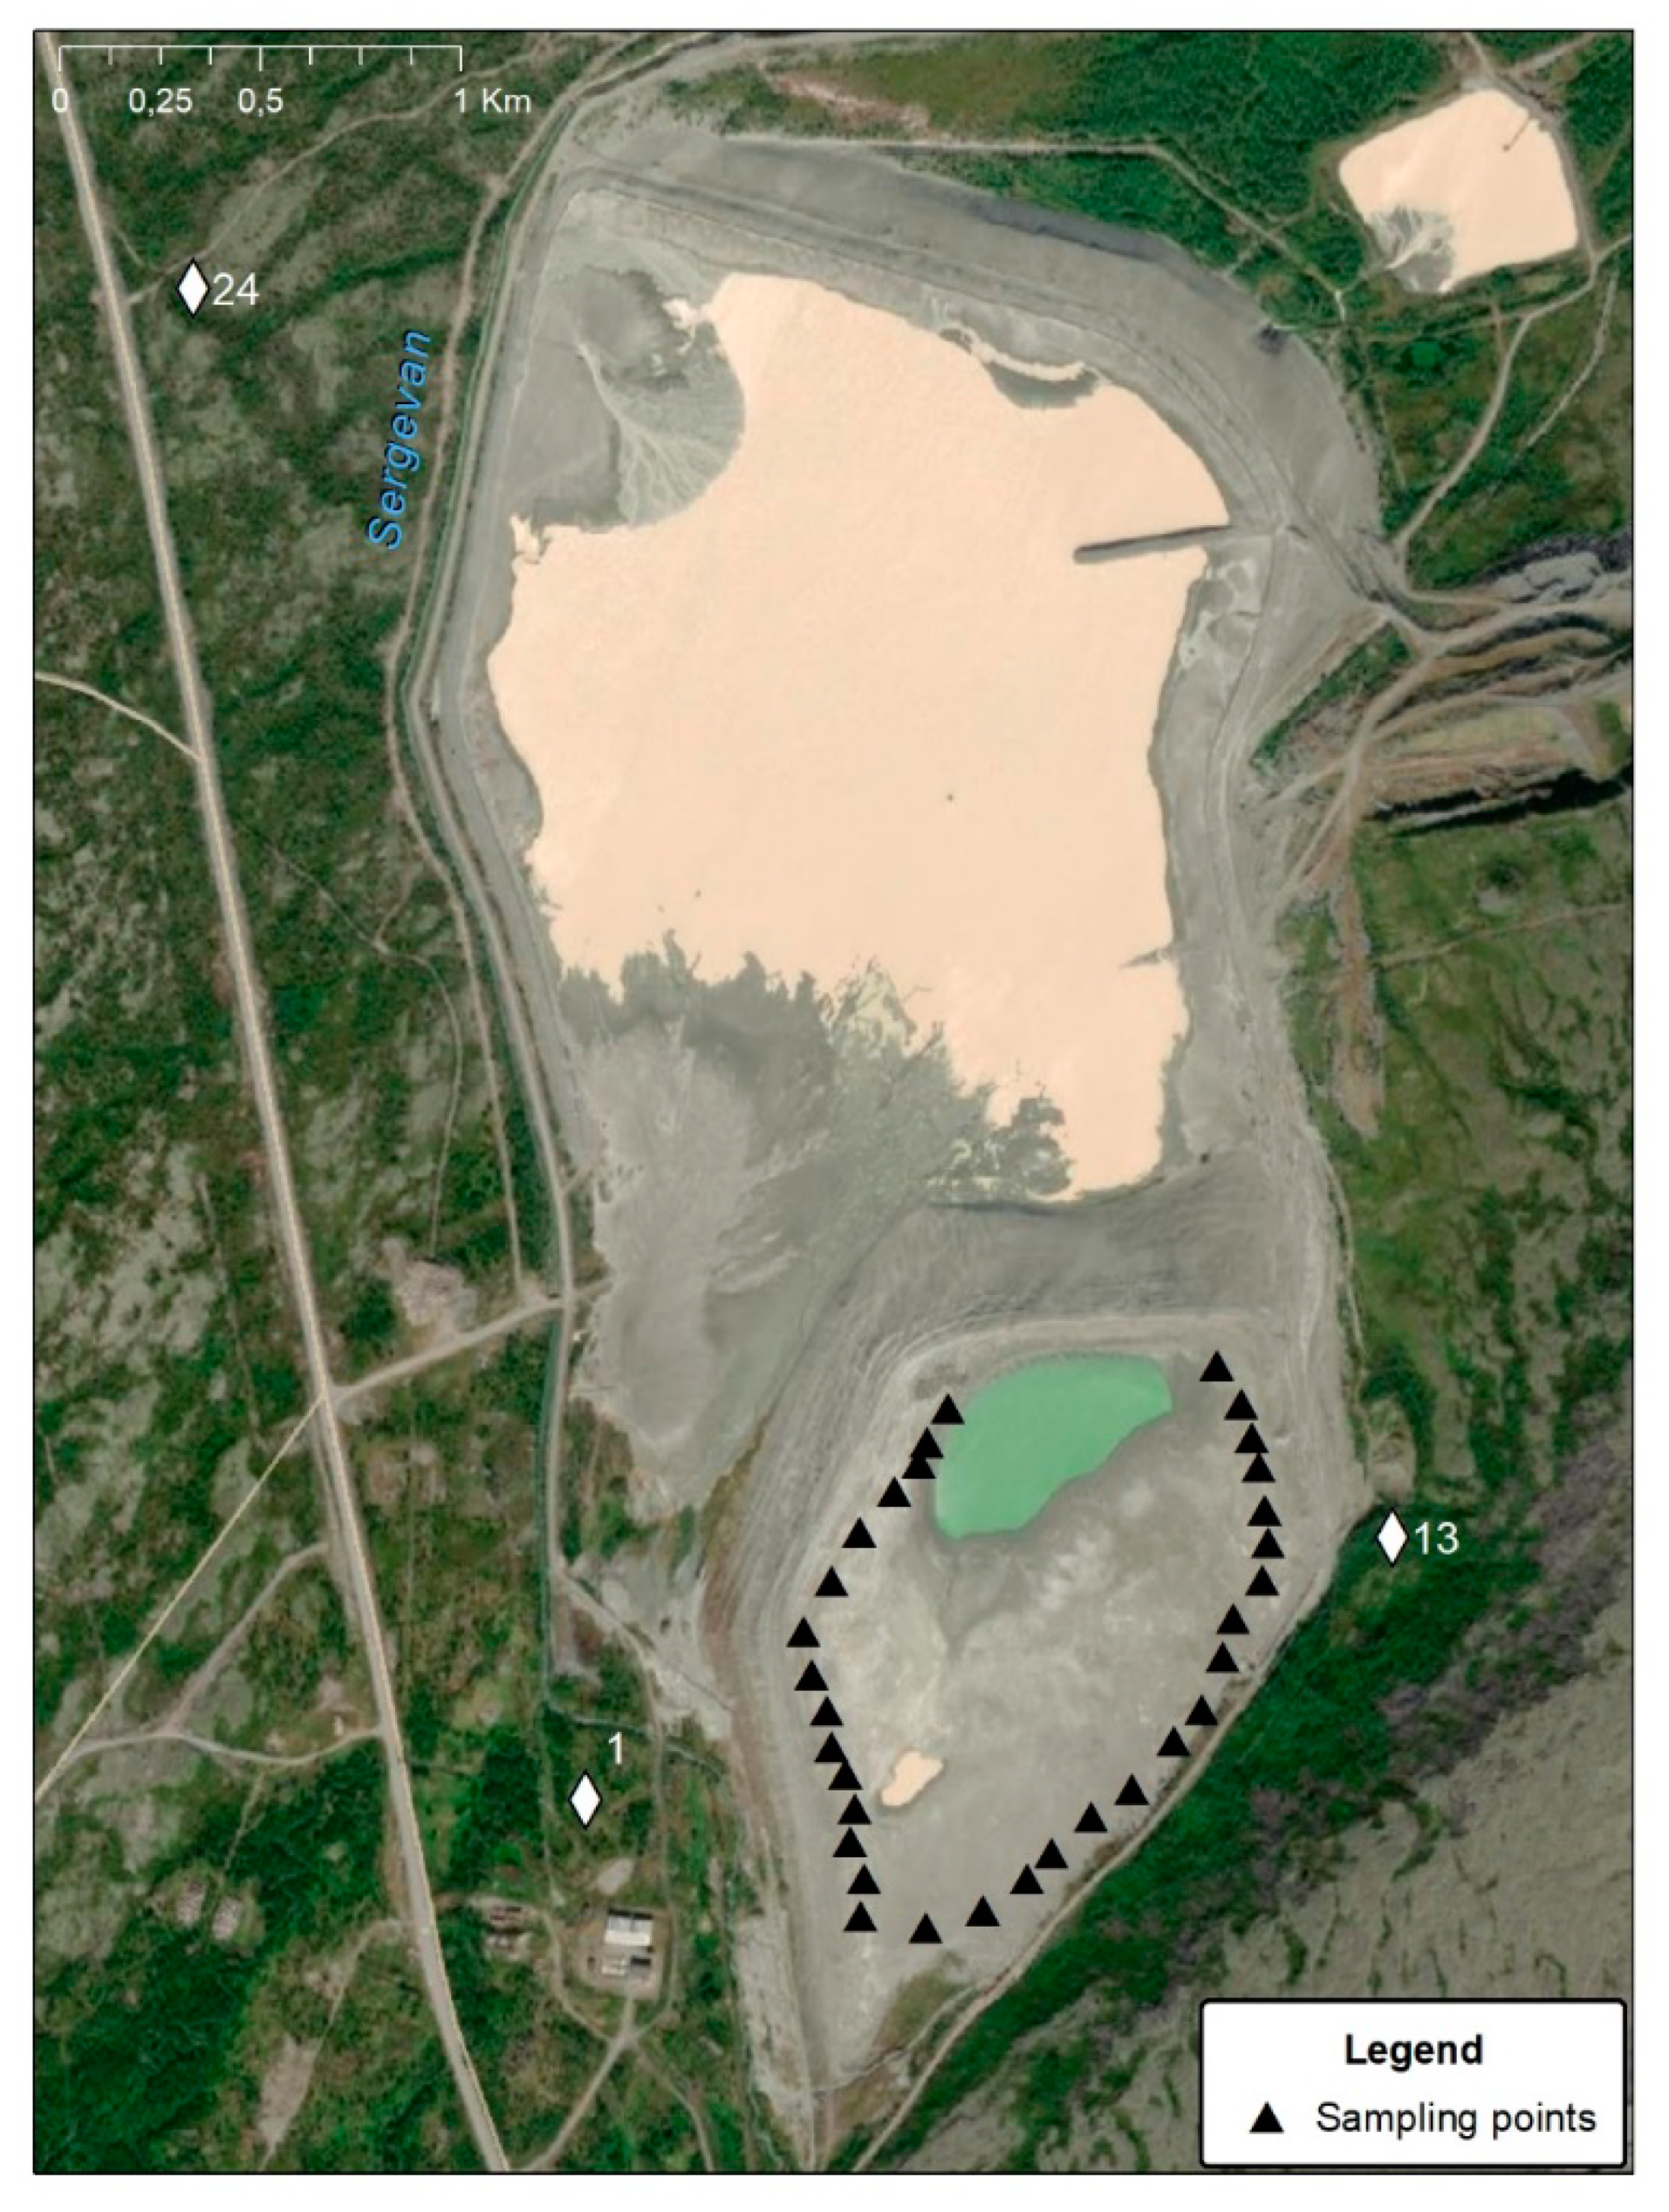
Figure 1. Sampling map-scheme of loparite ore dressing tailings (white rhombuses indicate soil sampling points).
Minerals 11 01077 g001
Figure 2. Granulometric composition of loparite ore dressing tailings.
Minerals 11 01077 g002
Figure 3. Diffraction pattern of loparite dressing tails. Reflexes: 1—nepheline, 2—aegirine, 3—microcline, 4—sodalite, 5 —loparite, 6—analcime, 7—albite, 8—natrolite.
Minerals 11 01077 g003
Figure 4. Diagram of moisture distribution of loparite ore dressing tailings obtained by radial extrapolation (ArcGIS 10) of a certain moisture content of selected tailings samples (indicated by circles).
Minerals 11 01077 g004
Figure 5. Dependence of maximum single emission (g/s) of inorganic dust 20–70% SiO2 during tailings dusts on wind speed and humidity.
Minerals 11 01077 g005
Figure 6. Scheme of dispersion of inorganic dust, contained 20–70% SiO2 (low wind load, 5 m/s).
Minerals 11 01077 g006
Figure 7. Scheme of dispersion of inorganic dust, contained 20–70% SiO2 (normal meteorological conditions, 8 m/s).
Minerals 11 01077 g007
Figure 8. Scheme of dispersion of inorganic dust, contained 20–70% SiO2 (unfavorable meteorological conditions, 10 m/s).
Minerals 11 01077 g008
Figure 9. The results of ground geochemical survey.
Minerals 11 01077 g009
Figure 10. Ranking of the loparite dressing tailings and soils elements by enrichment factor relative to background/clarke values.
Minerals 11 01077 g010
Table 1. Enrichment factor EFi.
EFi ValueEnrichment Level
<1no enrichment
1–3minor enrichment
3–5moderate enrichment
5–10moderately severe enrichment
10–25severe enrichment
25–50very severe enrichment
>50extremely severe enrichment
Table 2. The total content of some elements in the loparite ore dressing tails.
ElementContain, mg/kgElementContain, %
Cu5.36 ± 0.46Nb0.09 ± 0.01
Zn171 ± 15.68Mn0.01 ± 0.001
La160 ± 10.74Al7.86 ± 0.08
Pr33.9 ± 4.02Fe3.00 ± 0.02
Nd106 ± 9.65Zr0.21 ± 0.02
Th16.5 ± 1.75Sr0.09 ± 0.01
Ta75 ± 2.64Ce0.09 ± 0.01
Publisher’s Note: MDPI stays neutral with regard to jurisdictional claims in published maps and institutional affiliations.