Article

Investigating the Mineral Composition of Peat by Combining FTIR-ATR and Multivariate Analysis

by
Antonio Martínez Cortizas
1,*,
Lourdes López-Merino
2,
Noemí Silva-Sánchez
3,
Jenny K Sjöström
4 and
Malin E Kylander
4
1
CRETUS, EcoPast (GI-1553), Facultade de Bioloxía, Universidade de Santiago de Compostela, E-15782 Santiago de Compostela, Spain
2
ENVIROVEG, Unidad de Botánica, Facultad de Farmacia, Universidad Complutense de Madrid, E-28040 Madrid, Spain
3
INCIPIT-CSIC, E-15702 Santiago de Compostela, Spain
4
Department of Geological Sciences, Bolin Centre for Climate Research, Stockholm University, SE-10691 Stockholm, Sweden
*
Author to whom correspondence should be addressed.
Minerals 2021, 11(10), 1084; https://doi.org/10.3390/min11101084
Submission received: 4 September 2021 / Revised: 27 September 2021 / Accepted: 28 September 2021 / Published: 2 October 2021

Abstract

:
The mineral content of peat has received little attention until the last few decades, when peat cores have been increasingly used to study past dust deposition. Paleodust deposition is commonly reconstructed through elemental datasets, which are used to infer deposition rates, storminess patterns, mineral composition, source identification, and fertilization effects. To date, only a few studies have directly analyzed the mineralogy (by XRD and SEM) and particle size of peat mineral matter, and the conducted studies have usually been constrained by the need to remove a large amount of organic matter, which risks altering the mineral component. One alternative is to use quick, nondestructive techniques, such as FTIR-ATR, that require little sample preparation. In this study, we analyzed by FTIR-ATR both the bulk peat and ash fractions of a sequence taken in a minerogenic mire that covered a wide inorganic matter content range (6%–57%). Aided by principal component analysis on transposed IR spectral data, we were able to identify the main minerals in bulk peat and ash, quartz, mica (likely muscovite), K feldspar (likely microcline), and plagioclase (likely anorthite), which are consistent with the local geology of the mire catchment. Changes in mineral composition during the last ca. 2800 years were coeval with previously reconstructed environmental changes using the same core. Our results suggest that FTIR-ATR has great potential to investigate peat mineral matter and the processes that drive its compositional change.

1. Introduction

Peat is composed of up to 99% organic matter (dry mass), and its organic component has been given most scientific attention. However, during the last decades, the inorganic, mineral content of peat has been increasingly studied. This is mainly due to the growing interest in using peat records to trace sources of atmospheric dust [1,2,3,4], to determine the role of fresh minerals as potential fertilizers (through chemical weathering) in oligotrophic peatlands [5], or to reconstruct changes in storminess during the Holocene [6,7,8,9].
Due to the considerable limitations imposed by the large amount of organic matter in peat (e.g., [10]), direct characterization of the mineral matter by grain size analysis, XRD analysis, or SEM analysis is not routine [2,10,11,12,13]. This is one of the reasons why in many investigations the mineralogical composition has been approached through indirect approximations such as elemental analysis (e.g., [14]). One alternative approach is to use infrared spectroscopy, a quick, nondestructive, and affordable technique that can provide information on both organic [15,16,17,18,19,20,21] and inorganic [22,23,24,25,26,27,28]) components simultaneously, which is of great value for environmental studies [29]. Attenuated total reflectance Fourier-transform infrared spectroscopy (FTIR-ATR) in particular, is adequate for this purpose, as it requires a minimum of processing. FTIR-ATR has also been successfully applied in combination with multivariate analysis (MVA) to quantify different mineral phases in rocks [25,30,31,32]) and sediments [33,34,35,36,37].
In recent years, FTIR analysis of bulk peat has demonstrated its potential for obtaining paleoenvironmental proxies of peat decomposition (e.g., [21,38,39,40,41,42]), which, in turn, can be linked with climate and vegetation change. However, the potential of FTIR analysis of peat to infer peat mineral properties remains unexplored. This approach is of interest for deciphering past changes in mineral sources due to climate driven processes or, depending on the mineral source area of the peatland, other small-scale conditions at basin scale. In the present study, we conducted FTIR-ATR analysis on bulk peat and ash samples of a core obtained from a minerogenic mire in northwest Spain that spans the last ca. 2800 years. The core was particularly suited for testing the sensitivity of FTIR-ATR analyses on bulk peat vis-à-vis ashed samples, in order to identify the mineralogical composition because there was a large variation in ash (i.e., mineral matter) content, from 6% to 57%. We aimed to (i) combine FTIR-ATR and MVA to investigate the changes in mineralogy of the peat mineral matter, (ii) determine whether peat and ash samples would provide consistent results in terms of changes in mineralogical composition, and (iii) establish whether changes in the mineral composition correlated with environmental changes previously reconstructed in the same core. To our knowledge, the combination of FTIR-ATR and MVA approaches proposed here has not been applied before in studies of peat mineral matter.

2. Materials and Methods

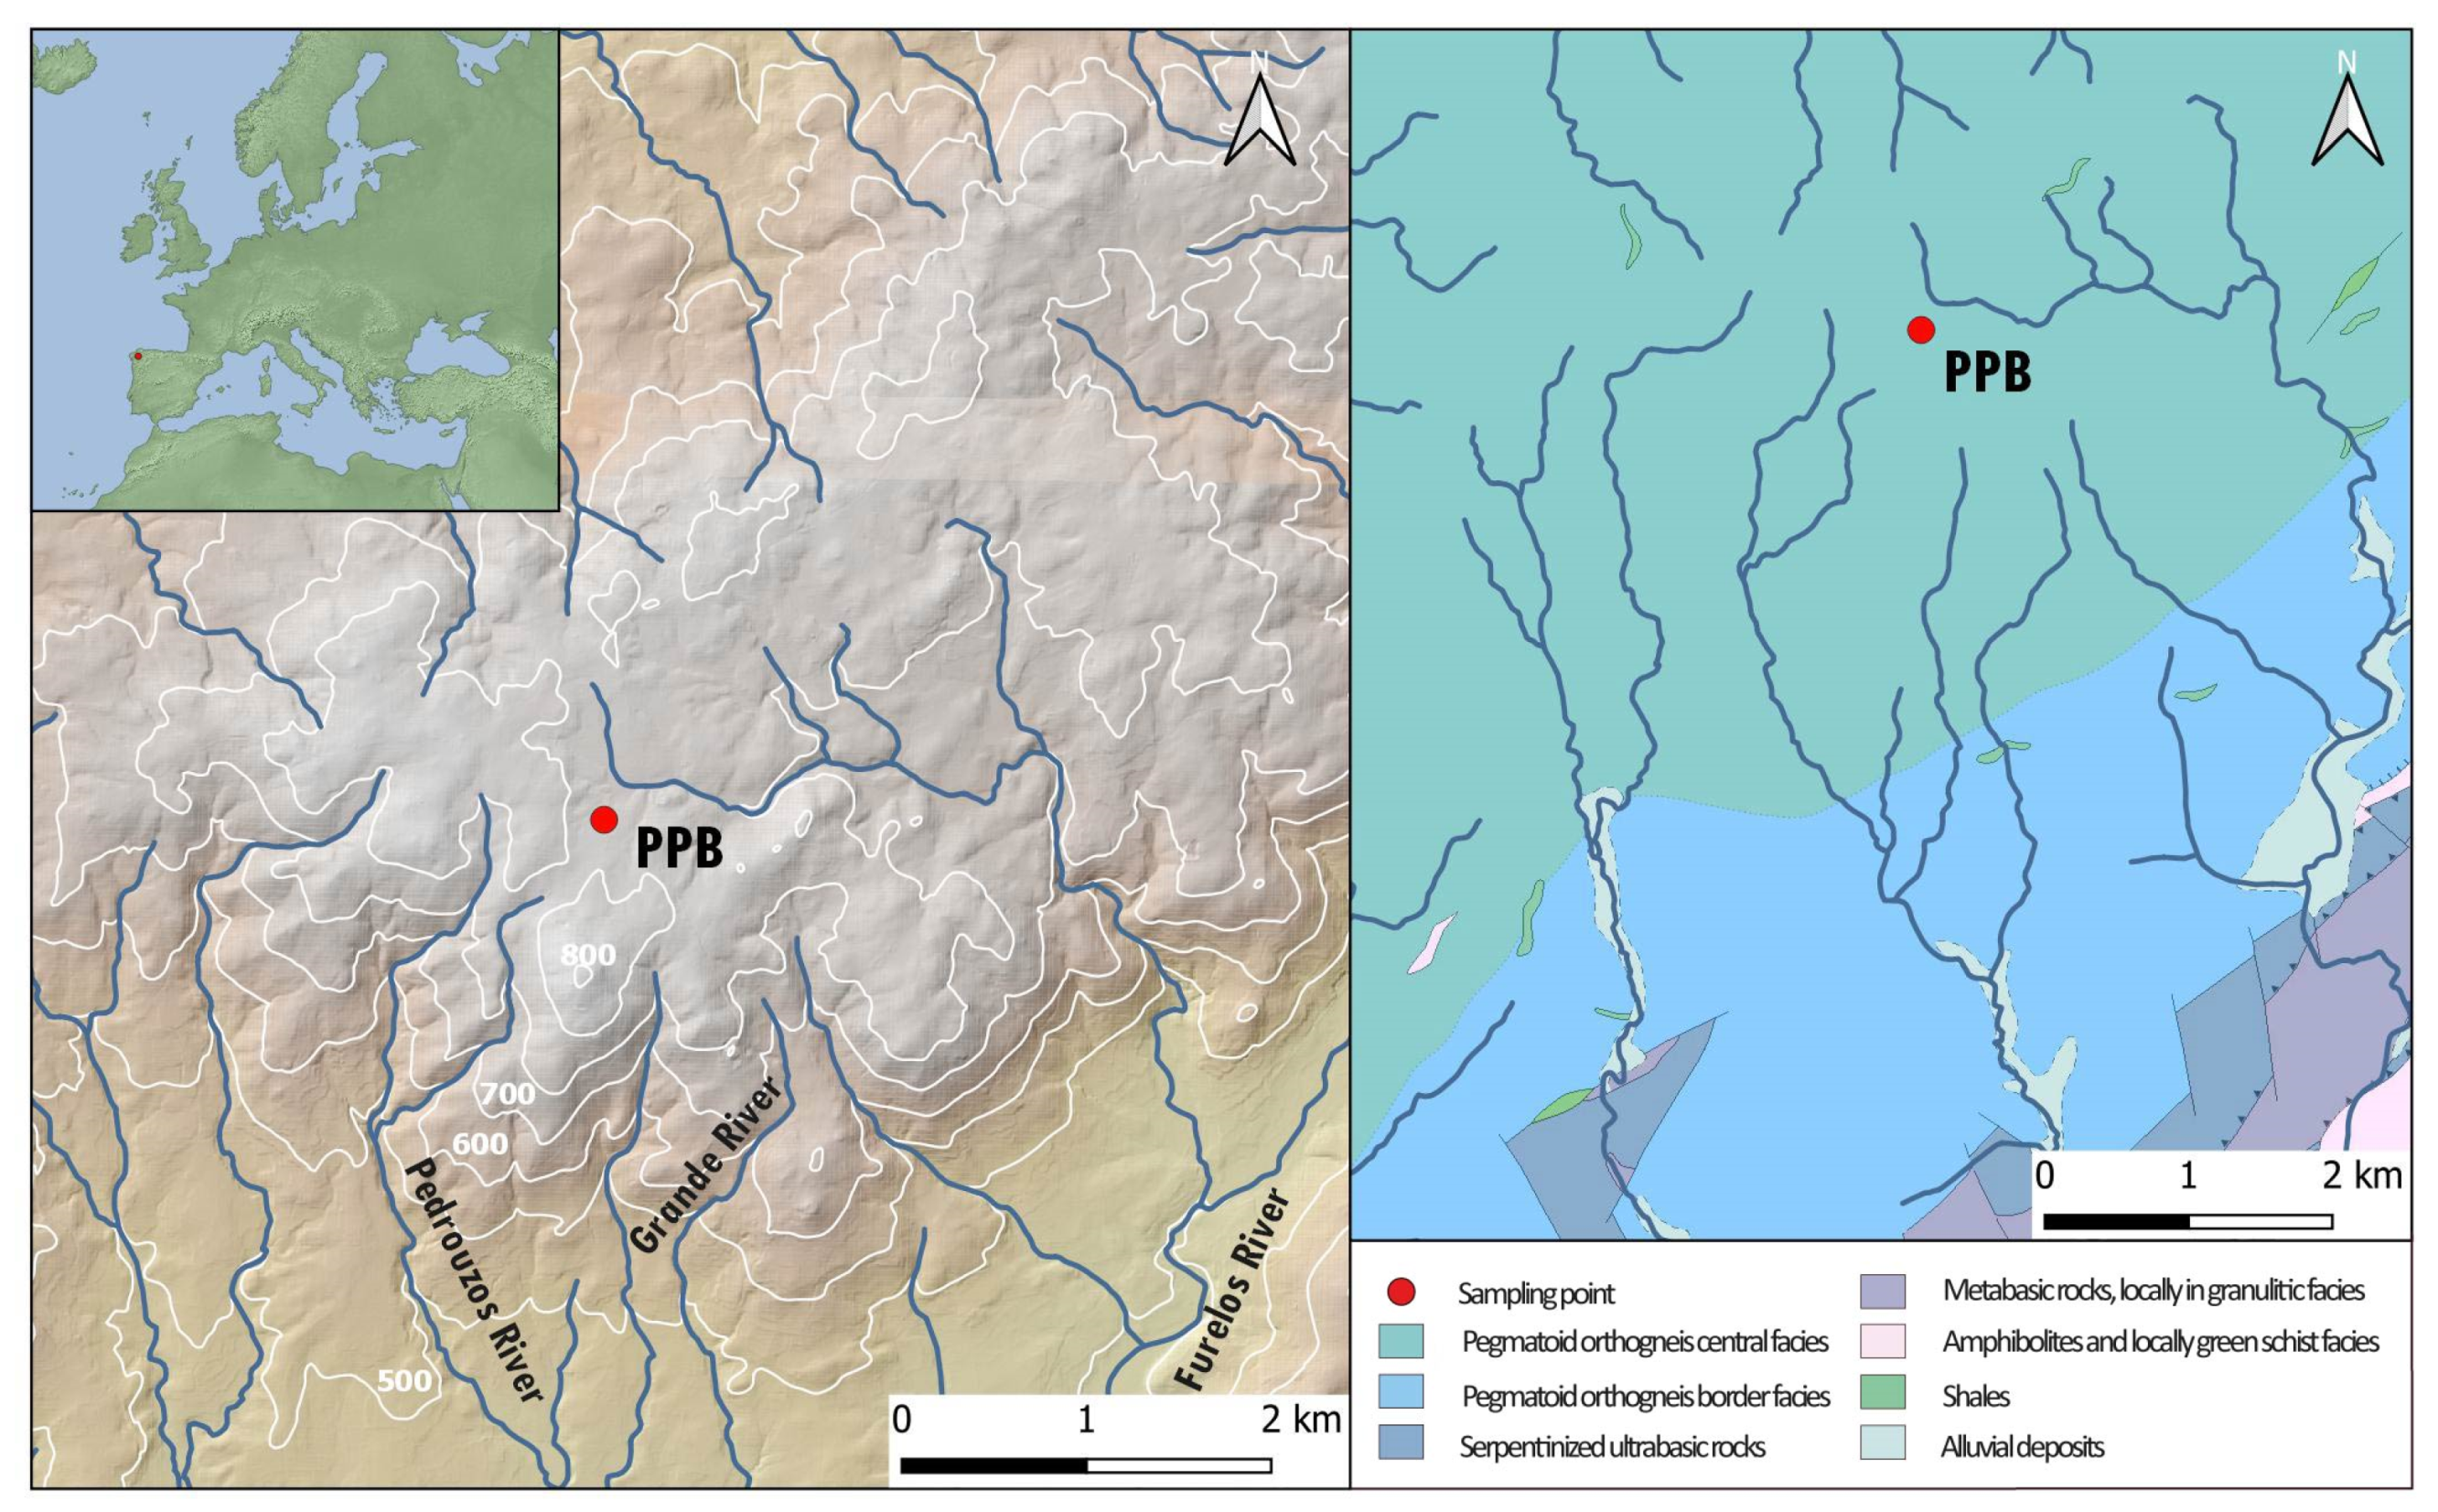
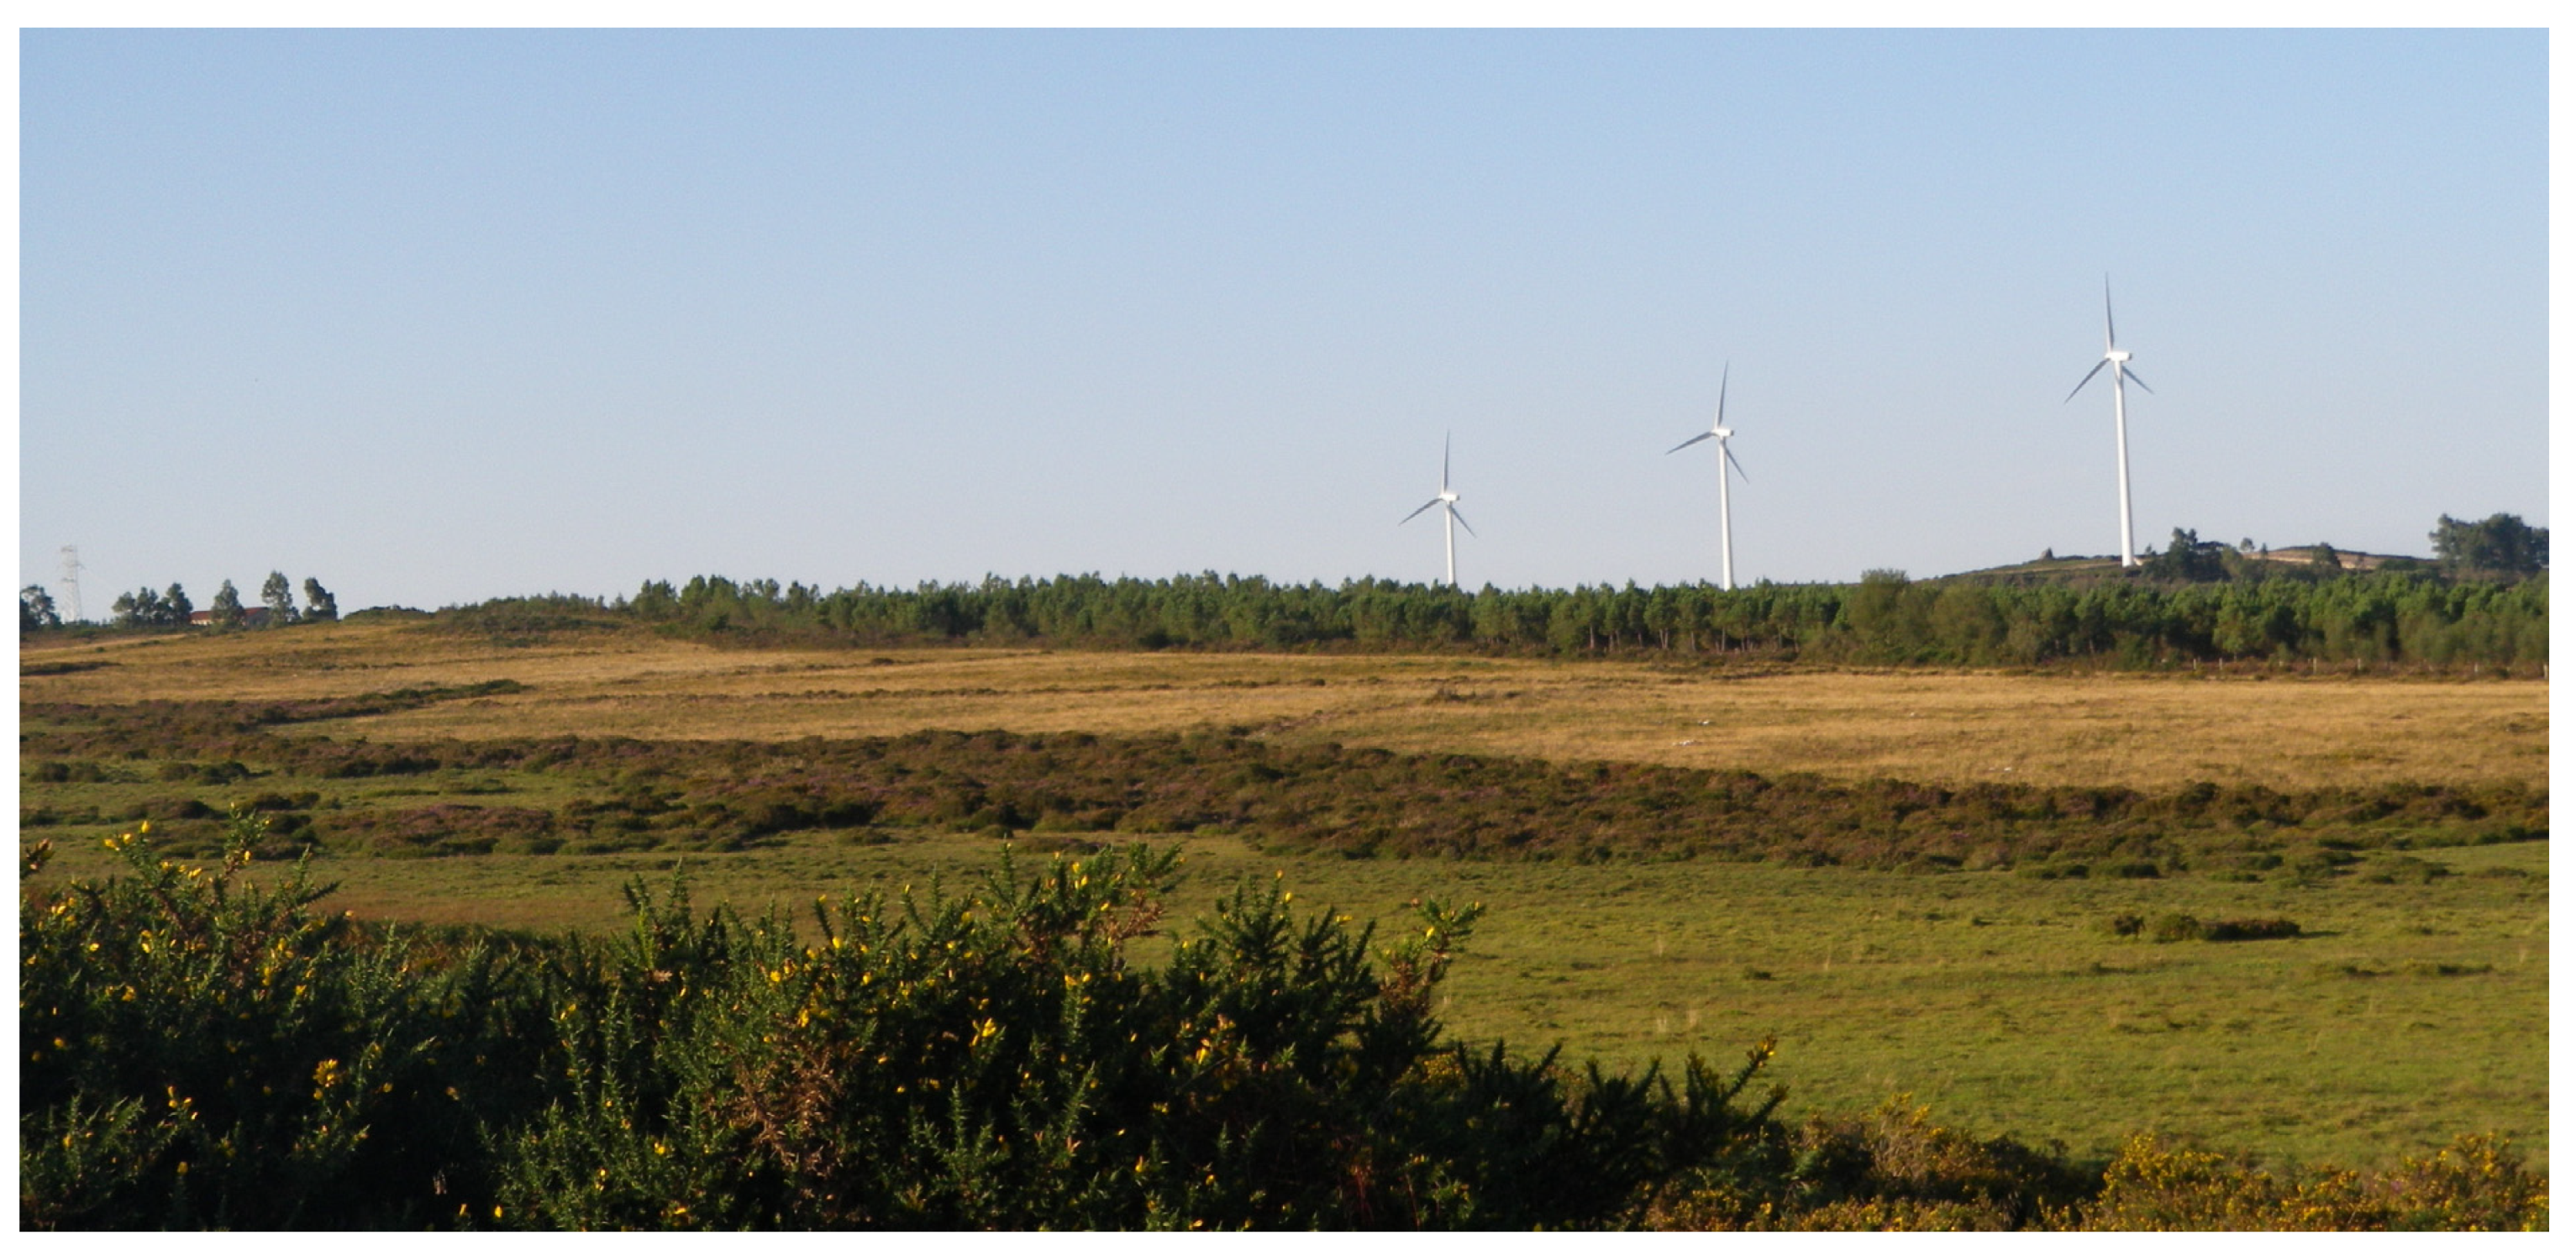
2.1. Location and Sampling

Cruz do Bocelo (42°59′N; 8°01′W) is a minerogenic mire located at 730 m a.s.l. on the western side of the O Bocelo range (Melide, Northwest Spain; Figure 1, Figure A1). The mire overlies a homogeneous geological substratum formed by an orthogneiss of granitic composition, but igneous basic and ultrabasic rocks are also present to the southeast, at a distance of about 5 km. The present climate is temperate and humid, with an average annual temperature of 12 °C and annual precipitation of 1800 mm.
Present land use consists of an association of pastures, horticultural crops, and scrubland (Ulex, Erica and Cytisus species). The surrounding forests are dominated by Pinus pinaster and Eucalyptus globulus afforestation; Betula is also present together with scattered patches of Quercus robur and Castanea sativa. The mire is used for grazing cattle and has been cut at its outer limit by the construction of a road built to install a wind farm. The surface vegetation of the mire is mainly composed of Sphagnum mosses, Carex, Drosera, and Juncaceae species, with heathers (Calluna vulgaris, Erica tetralix) and gorse (Ulex spp.) occupying the drier and more degraded areas.
The peat core (named PPB, 140 cm) was collected in 2007 using a Waardenar corer for the upper 1 m and a Russian corer for the sediments below 1 m depth [43] (see Appendix A for a brief description of the core stratigraphy). The bottommost 10 cm of the sediment was composed of a mixture of granitic gravel and sand and was not considered in this study (i.e., only peat samples were considered). The extracted peat sections were protected in plastic guttering and stored under cold conditions (4 °C) prior to laboratory analyses. At the laboratory, the core was subsampled into 2 cm-thick slices. Samples were dried at 105 °C and milled to very fine powder prior to analysis, and subsamples were ashed at about 500 °C for 5 h. We were aware that some minerals can undergo transformations or even collapse (e.g., kaolinite) at this temperature, as indicated in previous investigations [10,41]. In a recent investigation, Sjöström et al. [10] set up a testing scheme to evaluate different methods for removing the organic matter of peat with the purpose of studying the mineral component by XRD. They concluded that combustion at about 500 °C was the most efficient method and enabled the recovery of the main dust minerals, even though some of these minerals, such as clay minerals, underwent phase changes. Ashing can also result in the neoformation of some minerals [10,44,45] after the release of elements hosted in the organic matter, but, as is shown below, in our study, we did not identify them in the ash—if formed, they were in very low amounts.

2.2. FTIR-ATR Analyses

Spectra were collected for bulk peat and ash (finely milled) by attenuated total reflectance FTIR spectroscopy using an Agilent Technologies Cary 630. Spectra were acquired in the midinfrared region (4000–400 cm−1) at a resolution of 4 cm−1 by averaging 200 scans per sample. Between samples, the equipment was thoroughly cleaned, and a new background was collected. Average, standard deviation, and second derivatives of spectra, as well as peak identification and quantification, were computed using the {andurinha} R package [47]. Assignment of vibrations to compounds and minerals was based on the literature (for example, [21,25,48]) and was performed by including reference spectra of the main minerals common to the (granitic) geology of the study area. The reference spectra were obtained from the RRUFF database (http://rruff.geo.arizona.edu/ accessed on 25 January 2021) and also processed with {andurinha} to identify the relevant peaks (Table A1).

2.3. Statistical Analysis

Factor analysis by principal components (PCA) was conducted using the spectral infrared data (IR), in correlation mode, and with varimax rotation. Although PCA is usually applied to direct matrices [49], in this investigation, it was applied to whole spectrum transposed data matrix (i.e., wavenumbers in rows, samples in columns), as in a previous publication [50]. Using this approach, each sample spectrum was decomposed into several principal component (Cp) spectra (scores for the wavenumbers). Thus, factor scores enabled the identification of the constituents responsible for each Cp, with positive/negative values indicating higher/lower than average absorbance. Score peaks representing high absorbances within specific spectral bands were then related to the typical vibration of a given compound/mineral component. Loadings were assigned to samples, the squares of which (i.e., partial communalities) represented the proportion of the sample’s spectral variance accounted for by each component. Ideally, the scores of each Cp represented the spectrum of a particular compound/mineral in a sample, and the variations with depth/age of the partial communalities were related to the changes in the abundance of those compounds/minerals.
To aid in the assignment of vibrations to specific minerals, we also included in the PCA reference spectra for quartz, microcline, orthoclase, albite, anorthite, muscovite, and biotite obtained from the RRUFF database (http://rruff.geo.arizona.edu/ (accessed on 10 August 2021)). These spectra were used to guide the interpretation of the Cp peaks in the components’ scores. Spectra were herein also identified using {andurinha} (Table A1). When mentioned, correlation is given as Pearson correlation coefficient.
We also performed a hierarchical cluster analysis (HCA) using the partial communalities of the identified mineral phases as variables. This test enabled grouping samples with similar spectral signatures (i.e., similar mineralogical composition) through the evaluation of the dendrogram of cluster distances.

2.4. Data from Previous Studies

Loss on ignition (LOI), dry bulk density (BD), and major element (Si, Al, K, and Ca) concentrations in the peat samples were described and discussed in [43]. They were used here as proxies for organic matter and mineral matter content in the peat core to assist in the evaluation of the IR data. The results were plotted against age using the previously published age/depth model [43]. All ages are given as calibrated years before present (calibrated years before present, cal yr BP).

3. Results

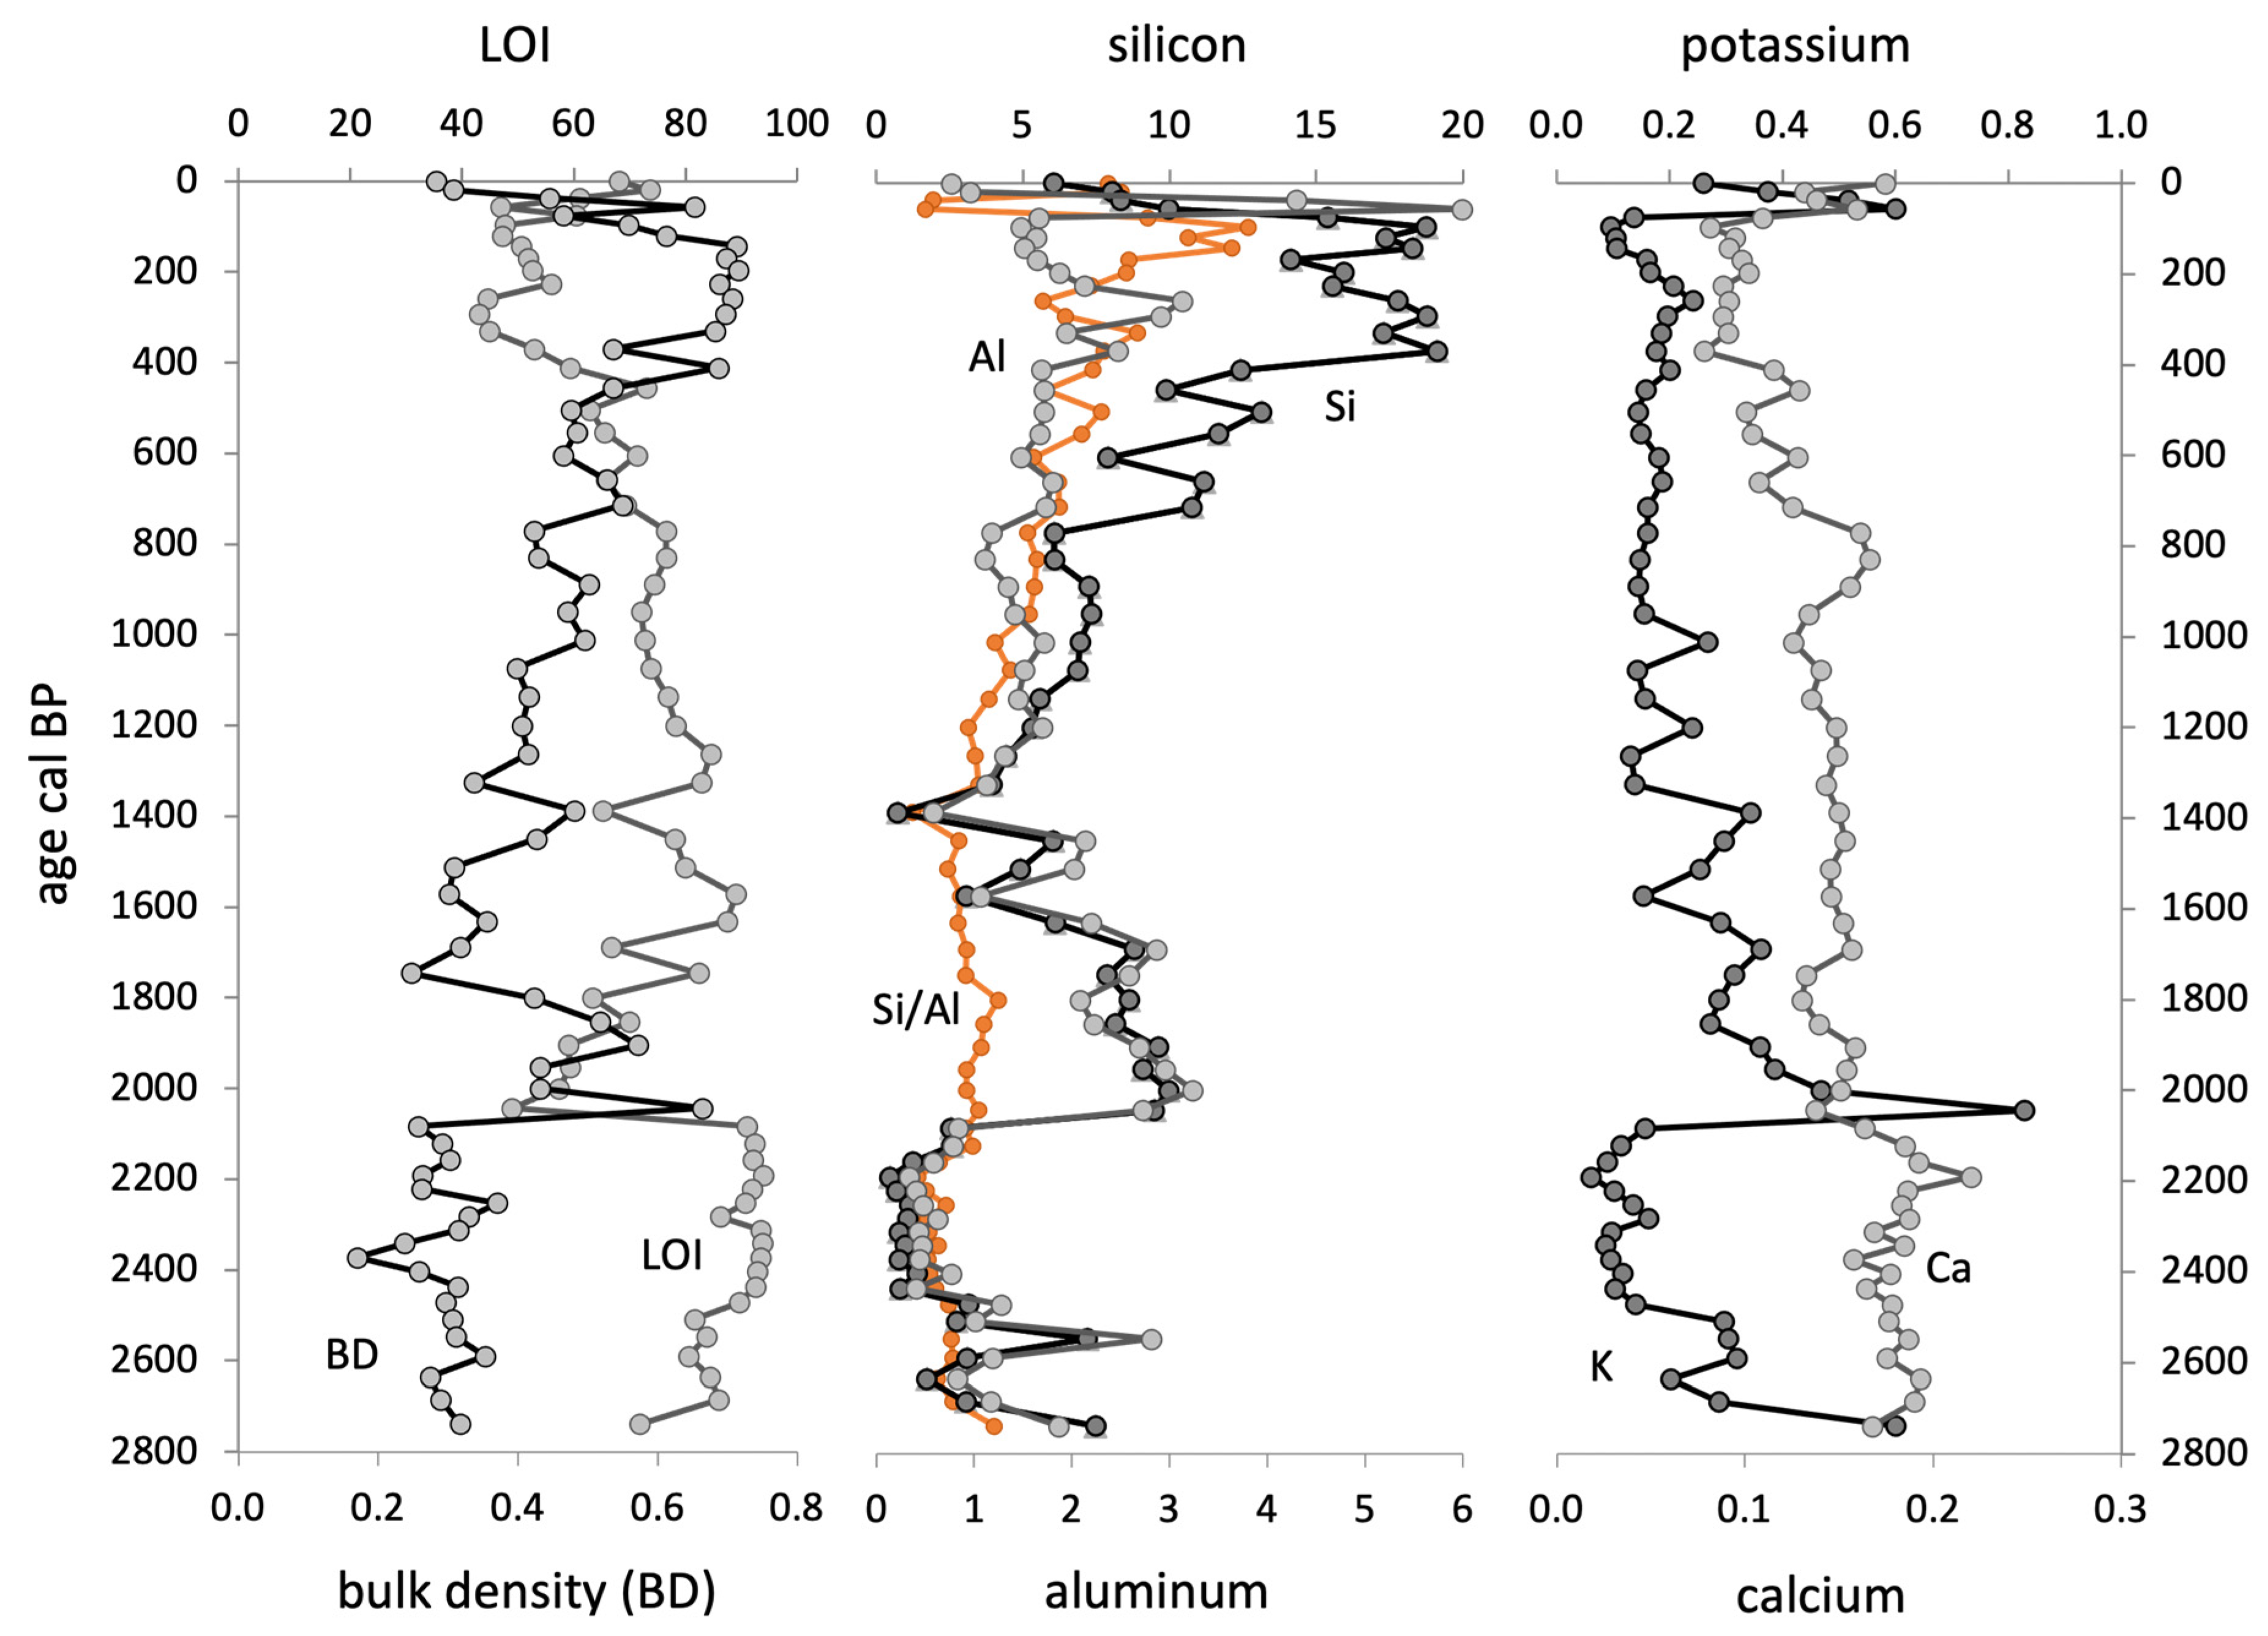
3.1. Peat Composition
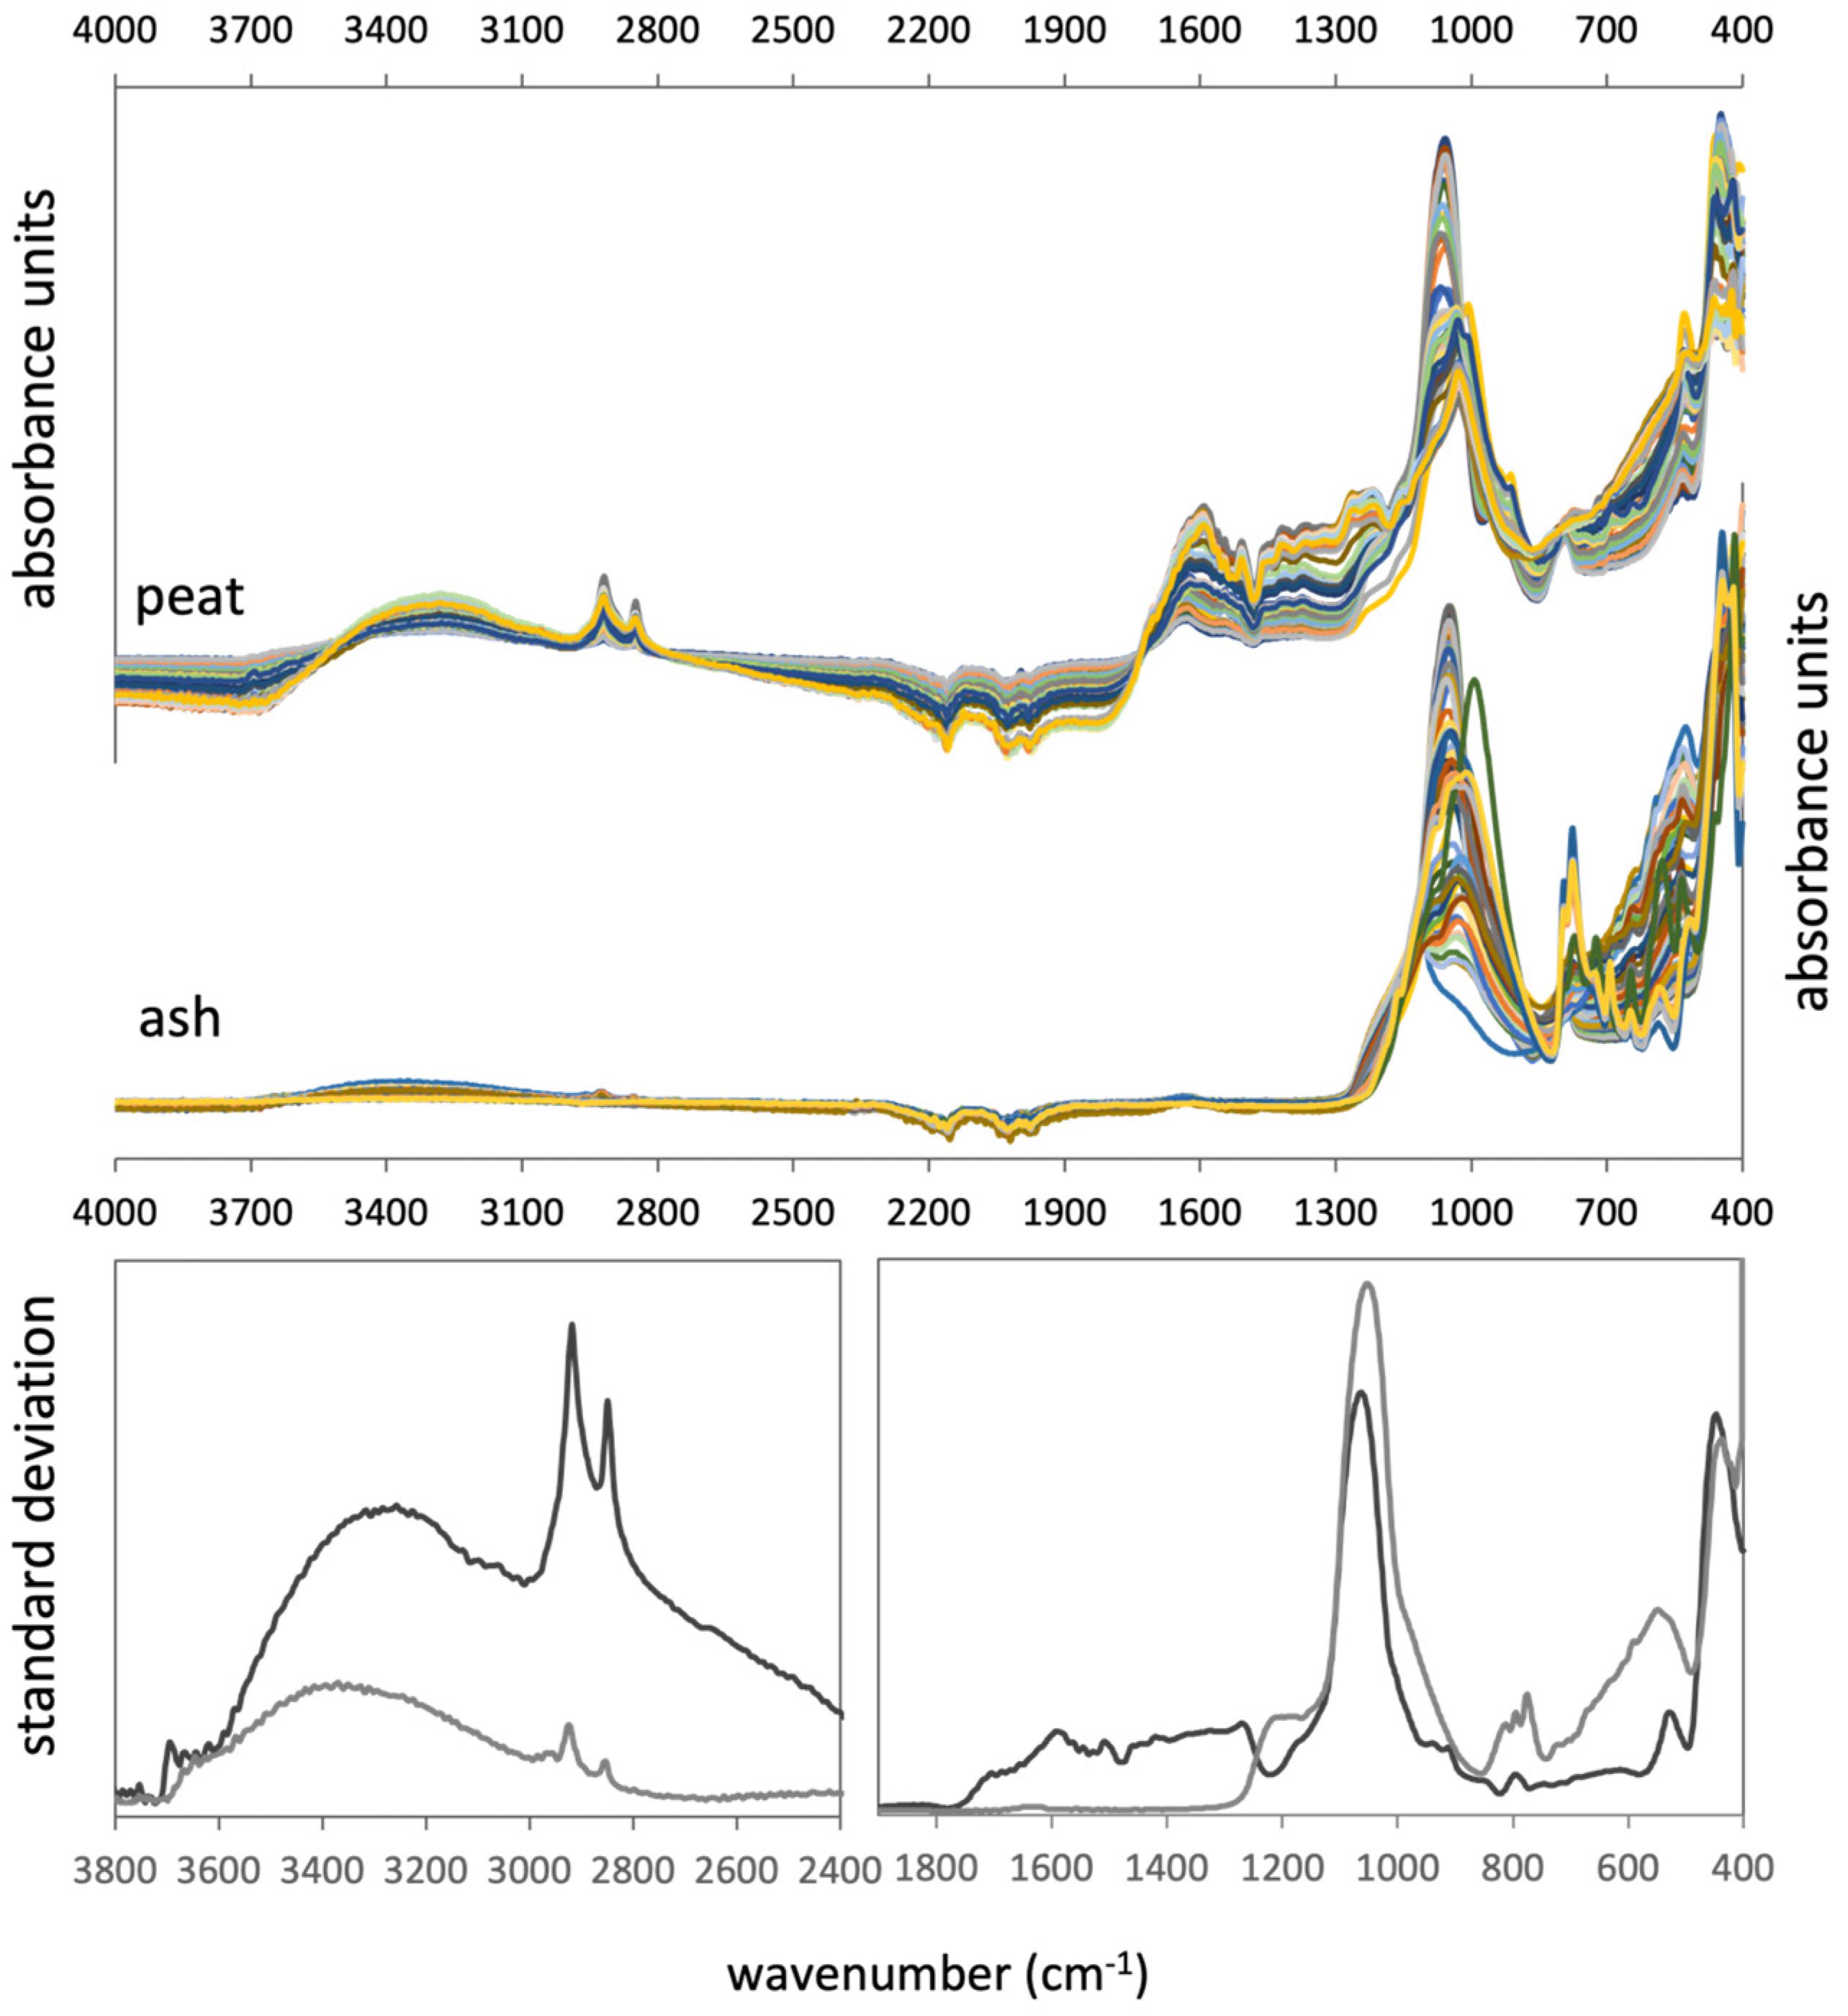
The LOI values range from 6 to 94%, with the highest values observed in samples older than ca. 2080 cal yr BP, ranging from 72% to 94% (Figure A2). Around 2080 cal yr BP, LOI values decrease abruptly to 49% and then recover progressively to a local maximum (89%) by ca. 1570 cal yr BP. After ca. 1570 cal yr BP, values continuously decrease in three steps: from ca. 1570 to ca. 770, from ca. 770 to ca. 450, and from ca. 450 to ca. 100 cal yr BP. LOI values increase again during the last 100 years. The BD record is opposite to that of the LOI (r − 0.88).
Silicon and Al concentrations show quite similar variations (r 0.96) in samples older than ca. 1200 cal yr BP, which are opposite to those shown by LOI (r −0.83 and −0.78, respectively) (Figure A2). After ca. 1200 cal yr BP, they decouple, with Si increasing and Al showing lower variation. Potassium shows the lowest values in samples older than ca. 2080 cal yr BP, increases abruptly by this time (up to 0.8%) and then decreases almost continuously until the last 100 years, when it increases again (Figure A2). The Ca record of concentrations is highly correlated (r 0.79) to the LOI.

3.2. FTIR

The spectra of the bulk peat and ashed samples, as well as their standard deviation spectra, are depicted in Figure 2. The peat spectra are dominated by vibrations typical of organic compounds: high absorbance in the regions 3400–3200 cm−1, 3000–2800 cm−1, 1800–800 cm−1 and <600 cm−1, characteristic of polysaccharide, aliphatics, lignin and other aromatics, and nitrogen compounds and organic acids, as recently synthesized for a peat core from a boreal peatland ([21] and references therein). The standard deviation spectra show that variability between samples is larger for the OH region (3400–3200 cm−1), aliphatics (2920 and 2850 cm−1), aromatics (1600–1400 cm−1), and polysaccharides (1100–1000 cm−1). The region <600 cm−1 also has high variability (i.e., standard deviation), but this may represent vibrations of both organic and inorganic components. The standard deviation spectra also point to some small variation in clay content (absorptions at 3700–3600 cm−1), possibly kaolinite.
The spectra of the ash samples show large absorbance in the 1200–1000 cm−1 region, at 798 and 777 cm−1, and in the <600 cm−1 region (Figure 2). All these vibrations are also characteristic of silicate mineral phases [25]. Apart from these, the standard deviation spectrum suggests the presence of organic compounds, attested by the aliphatic vibrations at 2920 and 2850 cm−1. It is interesting to note that the peaks at 3700–3600 cm−1 were not clearly seen in the ash samples.
The average second derivative spectra of the peat and ash samples can be seen in Figure 3. The bulk peat and ash share many absorptions, most of them corresponding to silicate mineral phases (see below), but those between 1740 and 1200 cm−1, representing organic functional moieties (i.e., organic acids, aromatics, N-compounds, aliphatics) are most specific to the bulk peat samples. Peaks at 1005 and 911 cm−1 are also more prominent in bulk peat than in the ash and may correspond to kaolinite (Figure 3).

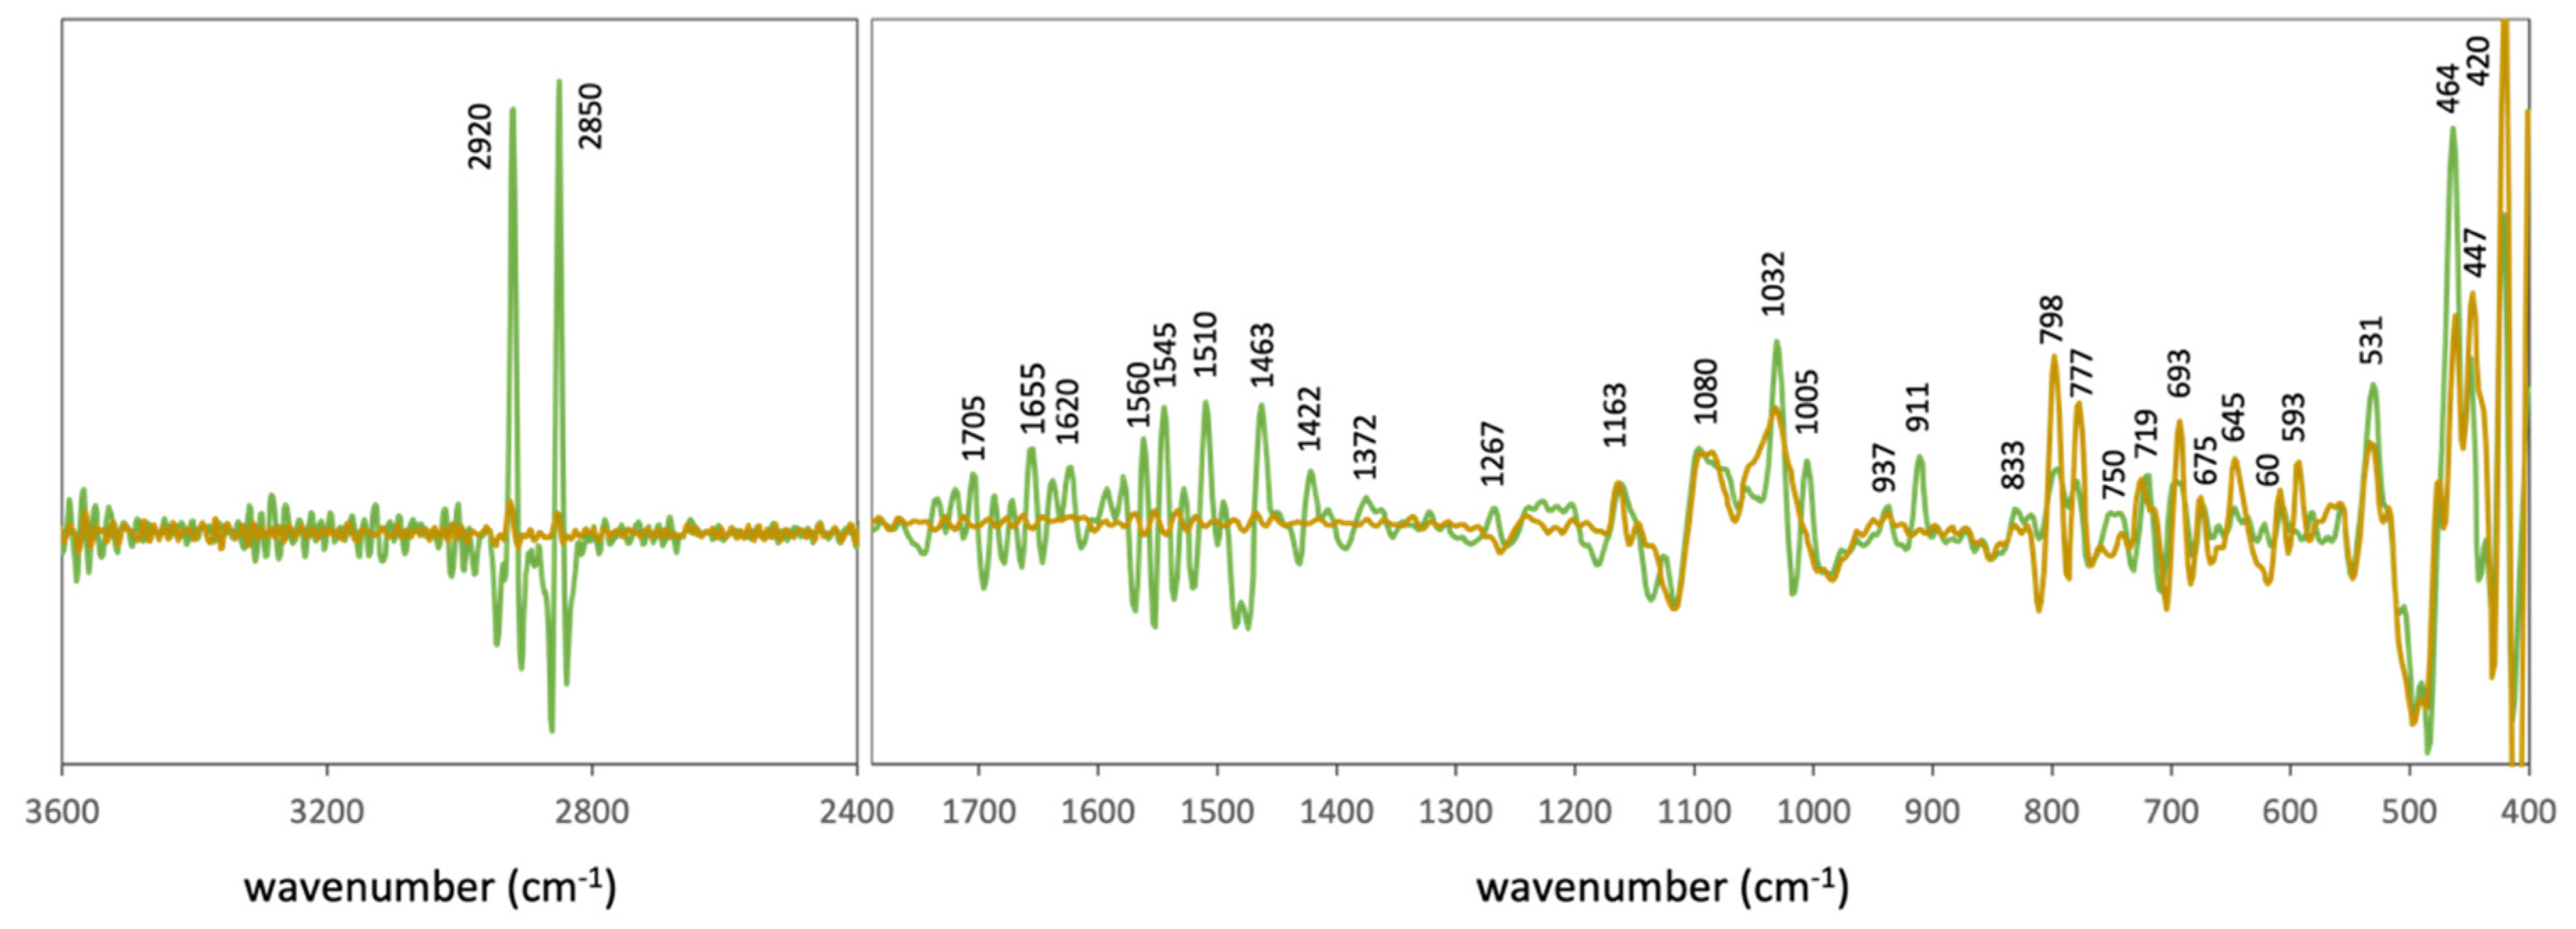
3.3. Principal Component Analysis: IR Signals

PCA was performed separately for peat and ash samples using their complete IR spectra. Both PCAs extracted five principal components (coded pCp for bulk peat and aCp for ash samples), which accounted for almost all (>99%) of the spectral variance in both cases. Thus, the spectral information of the samples was captured by the PCA models. The loadings of the principal components for the reference minerals are shown in Table 1, and the spectrum of the scores of each component is shown in Figure 4 together with the spectrum of the reference mineral they most likely represent.
The first principal component of the peat, pCp1, shows low loadings for the reference minerals (Table 1), and the spectrum of scores shows all the typical vibrations of the organic compounds already described (Figure 4). Thus, pCp1 seems to reflect the organic matter content of the peat. This interpretation is supported by the high correlation between the pCp1 loadings of the samples and LOI (r 0.90, Table A2).
In the ash samples, component aCp5 shows bands peaking at 1110 cm−1 and 520 cm−1 that may correspond both to organic (lignocellulosic) compounds and inorganic (silicate) phases. Although low, the loadings of this component are highly correlated (r 0.92, nonlinear) to those of pCp1 and thus also to peat LOI (r 0.91), which suggests that aCp5 is also related to organic compounds.
Components pCp2 and aCp3 show large loadings (>0.84) for microcline, orthoclase, and albite (Table 1), pointing to a feldspar signal. The records of scores of pCp2 and aCp3 are almost identical and match better with the microcline reference spectrum (Figure 4), thus suggesting that these two components account for K-feldspar content. pCp2 is negatively correlated to LOI and Ca and positively correlated to BD, Si, Al, and K (Table A2).
Components pCp3 and aCp2 show large loadings (>0.75) for biotite and muscovite (Table 1) and are thus related to the abundance of mica. The pCp3 and aCp2 score spectra are almost indistinguishable, and the muscovite reference spectrum fits better with the scores’ spectra (Figure 4). pCp3 is significantly correlated to K concentrations in peat (Table A2).
Components pCp4 and aCp1 show large loadings only for quartz (Table 1) and thus reflect the content of this mineral in the peat and ash. The quartz reference spectrum fits nicely with the spectrum of scores of this component (Figure 4). pCp4 is highly and negatively correlated to LOI and Ca concentrations but positively correlated to Si concentration and BD (Table A2).
Components pCp5 and aCp4 show high loadings only for anorthite (Table 1), and their scores’ spectra fit rather well with the anorthite reference spectrum (Figure 4), thus suggesting that both components reflect the abundance of Ca-rich plagioclase. Although a correlation to Ca concentrations was expected, pCp5 did not have a significant correlation with this element. In the PPB core, Ca concentrations are highly correlated to LOI and pCp1 (Table A2), indicating that most of the Ca was hosted in the plant remains, in line with previous peat studies (e.g., [51]).
As already mentioned, some minerals loaded highly in the same component (microcline, orthoclase, and albite in pCp2 and aCp3 and muscovite and biotite in pCp3 and aCp2; Table 1) because their spectra largely overlap. This is also likely to be the reason for the fact that all minerals had a significant part of their variance (loadings 0.3–0.53, around 10%–28% spectral variance) allocated into another component.

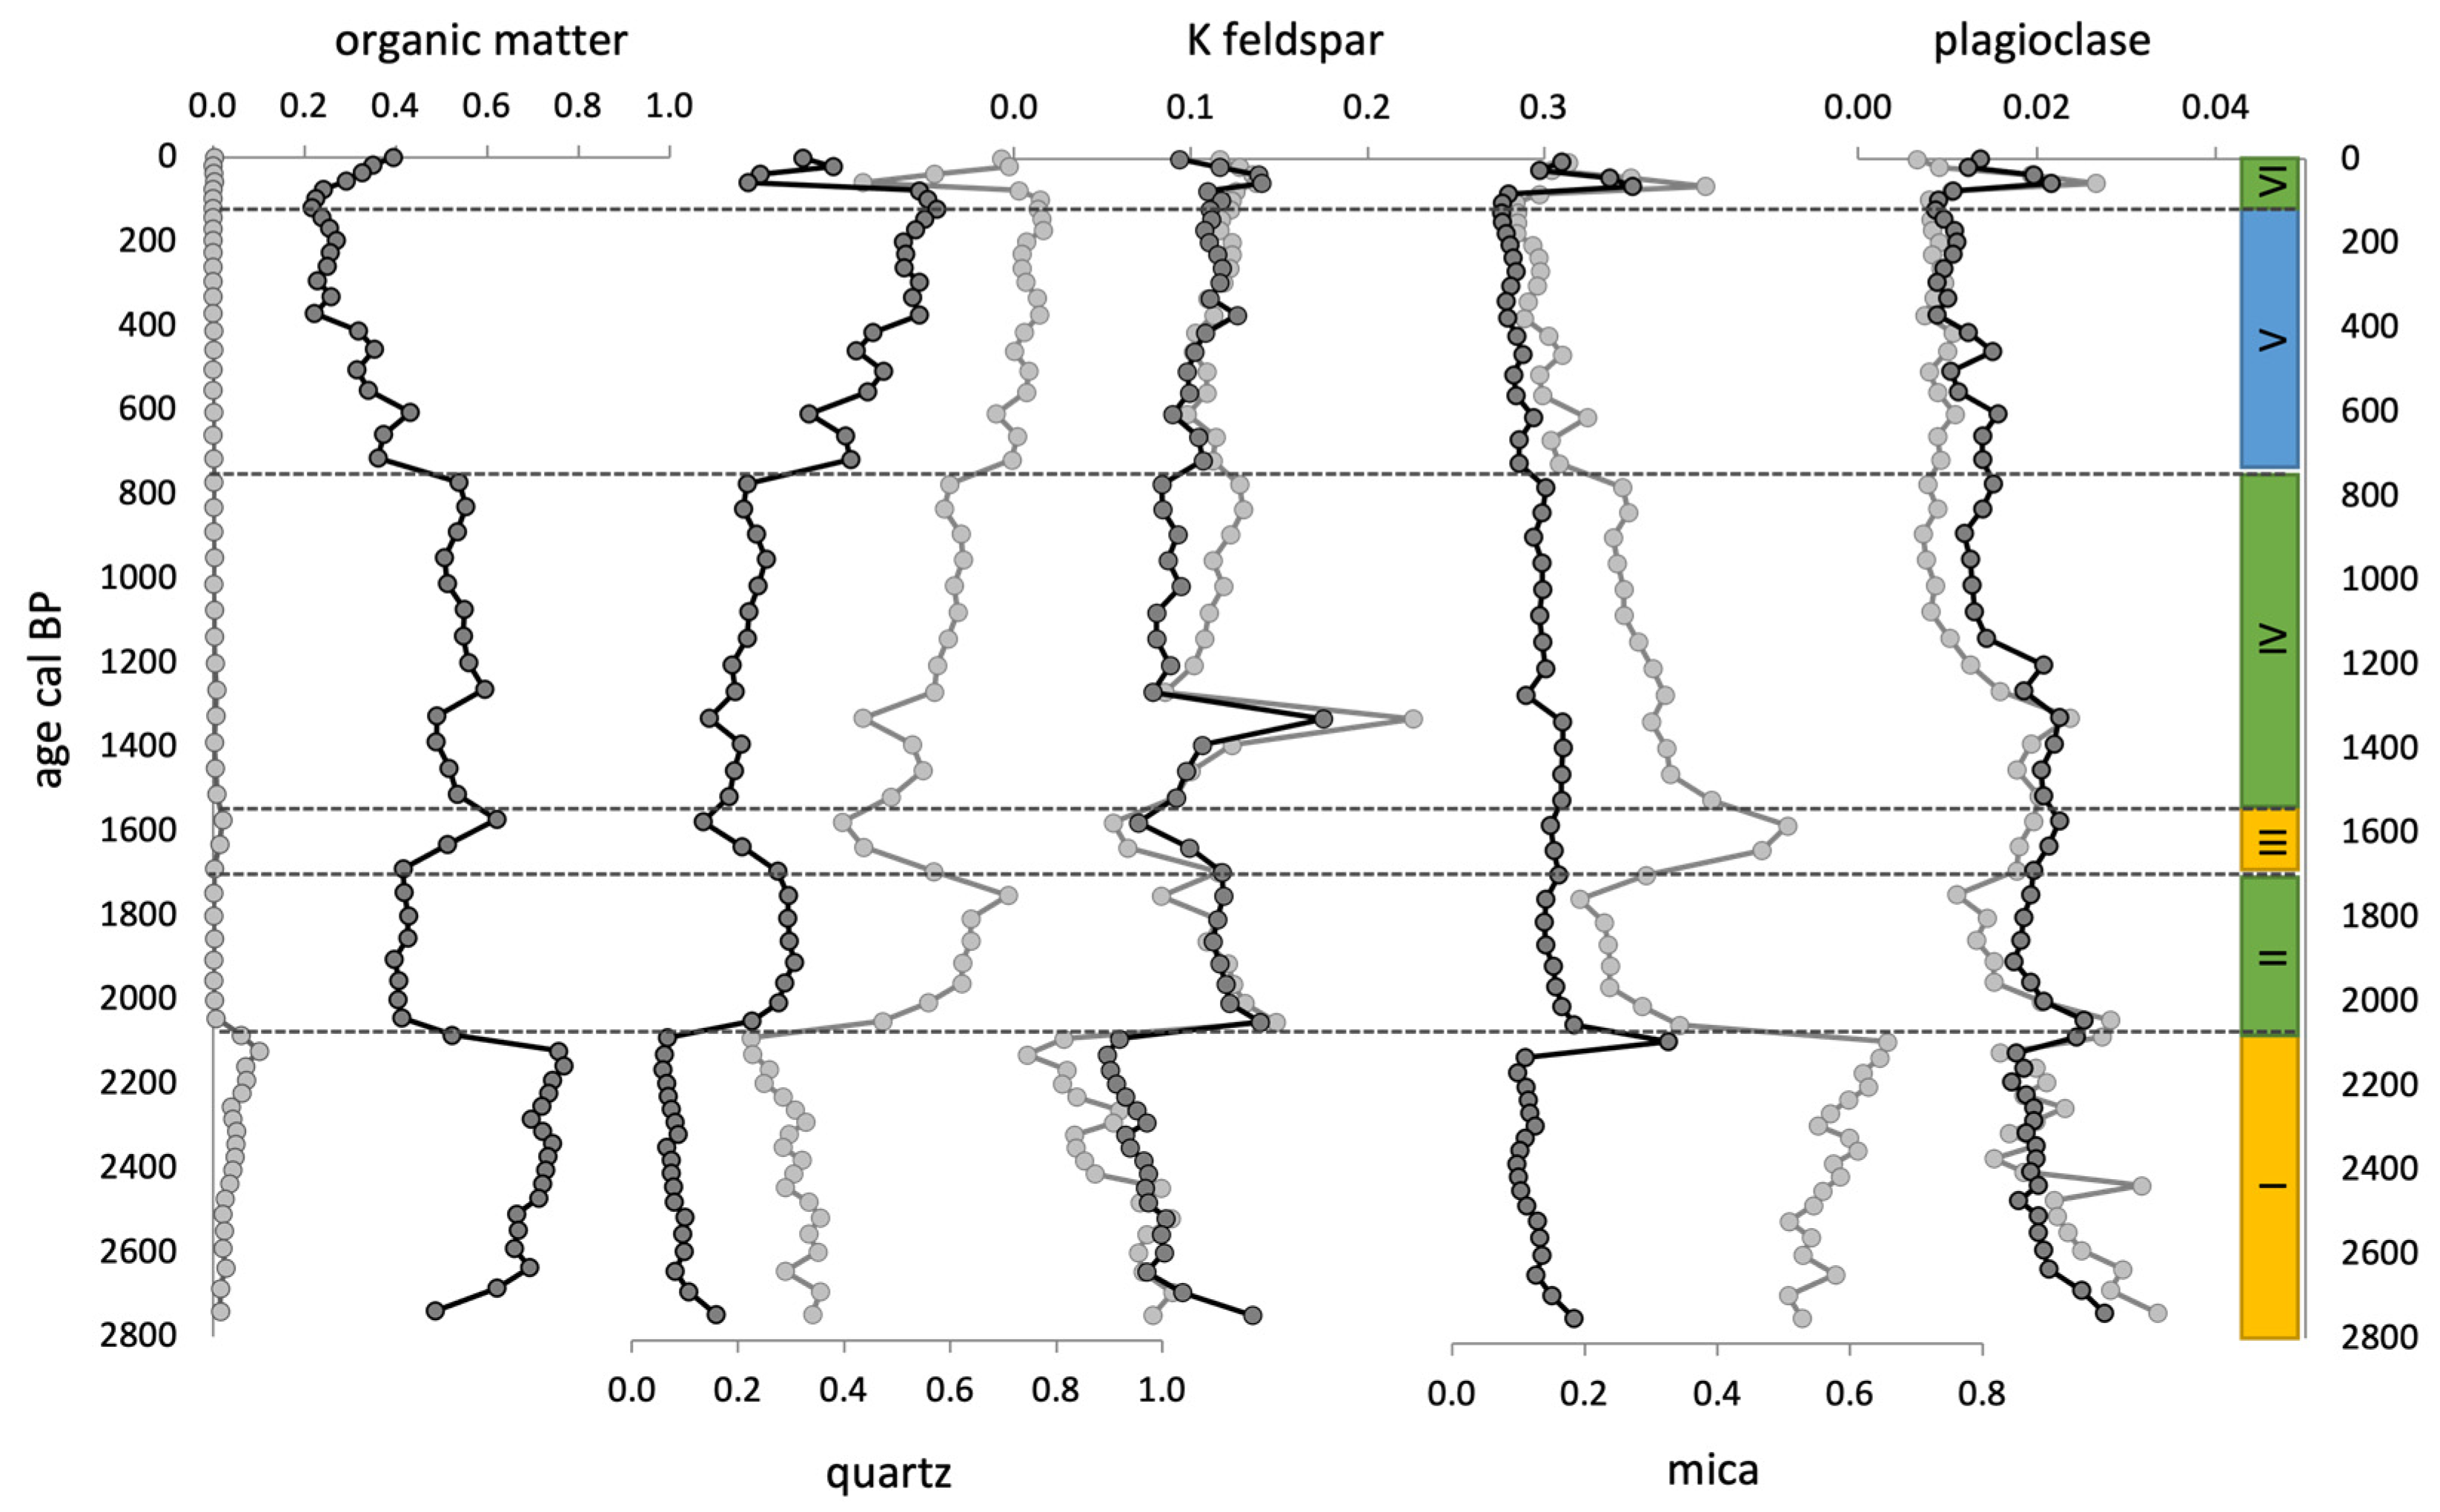
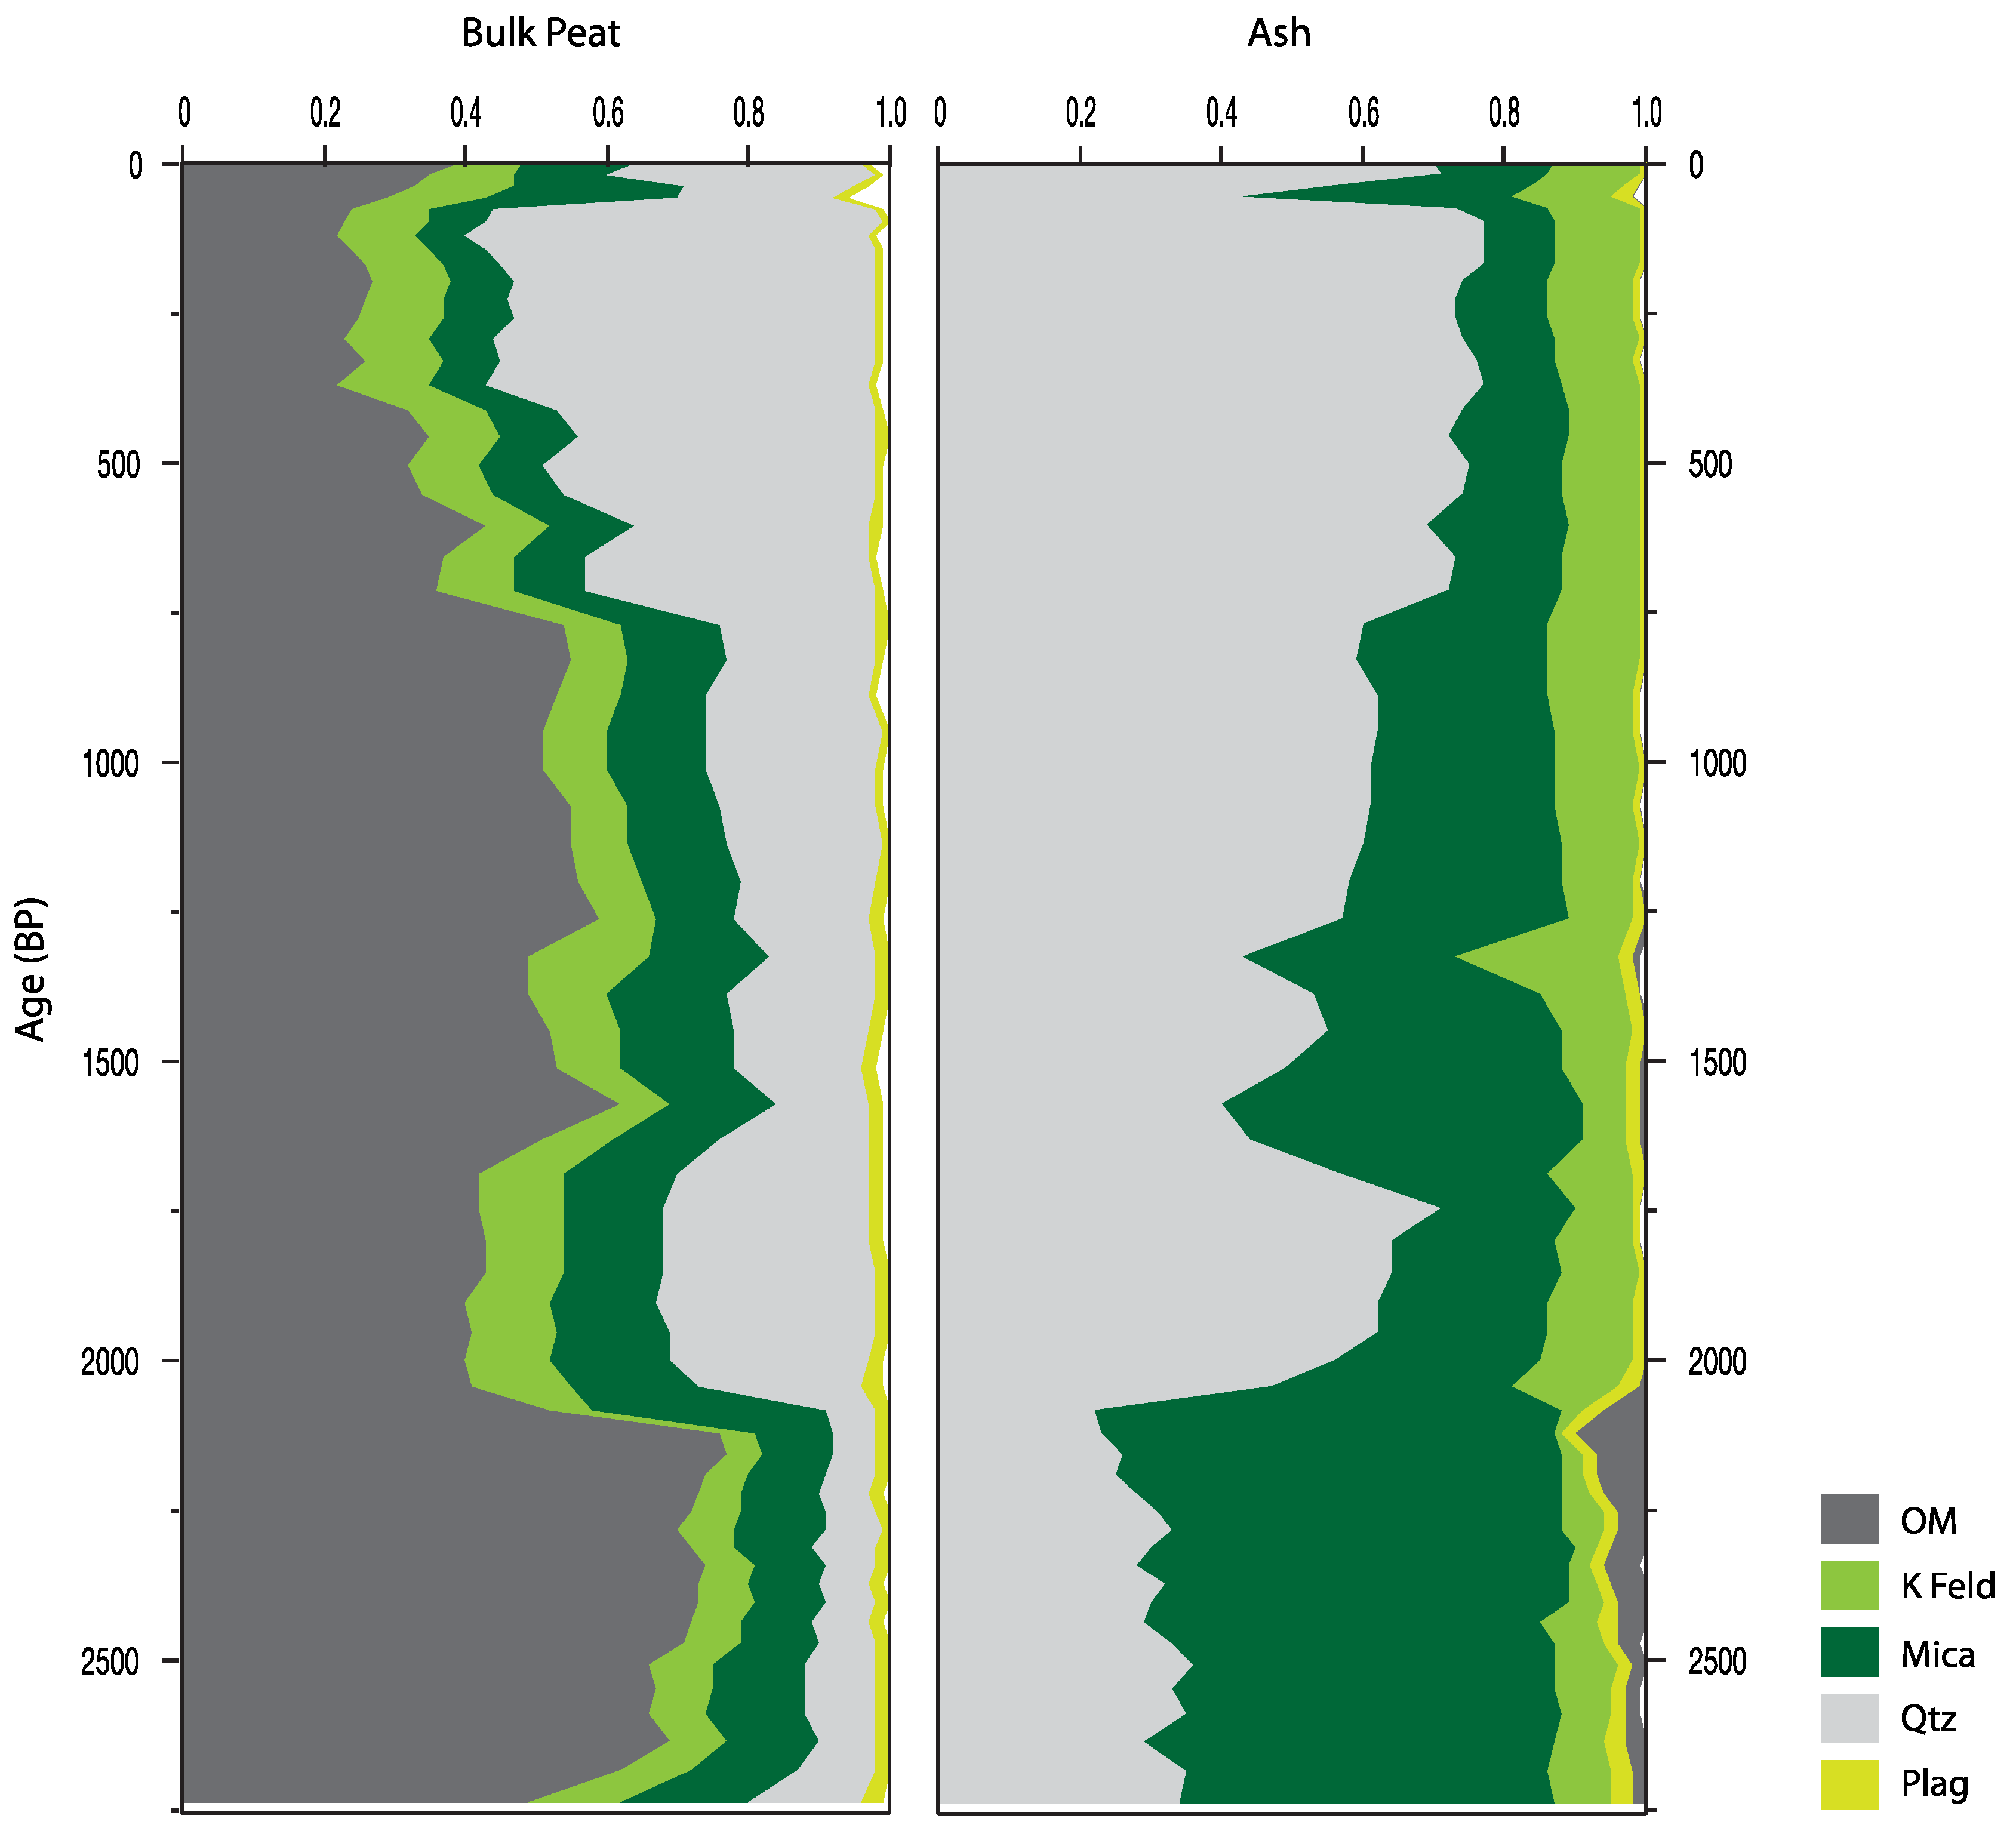
3.4. Changes is Mineral Composition through Time

The chronology of changes in the IR signals identified is represented in Figure 5 and Figure A3. The most relevant aspect of the records is the consistent picture of changes reflected by both the peat and the ash (organic matter: pCp1–aCp5 r 0.93; quartz: pCp2–aCp1 r 0.97; K feldspar: pCp2–aCp3 r 0.85; plagioclase: pCp5–aCp4 r 0.87). Mica is the exception, as it shows differences between the peat and ash (pCp4–aCp2 r 0.37) in the section with higher organic matter content and older than ca. 2080 years (Figure 5). Both records are quite similar for the last ca. 2080 years (r 0.84), except for the excursion at ca. 1600 cal yr BP.
Figure 5 shows that the main change in the composition of the peat occurred by ca. 2080 years ago, when mica decreased abruptly and quartz and K feldspar increased. Between ca. 1700 and ca. 1200 cal yr BP, the K feldspar remained elevated, but quartz decreased. After ca. 1200 cal yr BP, quartz content continuously increased, and K feldspar content remained almost stable. As indicated above, by ca. 1200 cal yr BP, the Al and Si concentrations decoupled, and in fact, the IR quartz signal in the bulk peat (pCp4) was highly correlated (r 0.84) to the Si/Al ratio (Figure A2), suggesting that the decoupling was due to the increase in quartz fluxes to the mire. By ca. 770 cal yr BP, quartz increased sharply again, followed by a more gradual increase until ca. 100 cal yr BP, when an abrupt decrease occurred (Figure 5).
The mica record of the ash shows that the content was highest in samples older than ca. 2080, when a sharp decrease occurred lasting until ca. 1700 cal yr BP. Between ca. 1700 and ca. 1570 cal yr BP, mica content increased abruptly, but it continuously decreased after that (in two steps, ca. 1570–770 cal yr BP and ca. 770–100 cal yr BP) (Figure 5). Mica content peaked again in the last 100 years. Changes in plagioclase content, both in bulk peat and ash, are somewhat similar to those of mica in ash but with more attenuated variations.
The HCA performed on the ash records indicates that samples could be grouped into three major compositional groups (Figure 5): group 1, mica (average partial communality 0.75 ± 0.03) > quartz (0.56 ± 0.05) > K feldspar (0.23 ± 0.06) > plagioclase (0.15 ± 0.02); group 2, quartz (0.75 ± 0.04) > mica (0.52 ± 0.04) > K feldspar (0.36 ± 0.05) > plagioclase (0.12 ± 0.02); group 3, quartz (0.86 ± 0.01) > mica (0.37 ± 0.04) and K feldspar (0.34 ± 0.02) > plagioclase (0.09 ± 0.01).

4. Discussion

The large similarity between the spectra of the reference minerals and the records of scores of the principal components strongly suggests that the PCA model based on the IR signal was highly efficient in capturing the main mineralogical composition of the bulk peat and ash samples. As expected, our results show that the organic matter signal dominates in the peat samples (Figure 5 and Figure A3). The partial communalities of quartz and mica are higher in the ash than in the peat samples, while those of K feldspars and plagioclase are quite similar. Our results suggest that high (>80%) organic matter peat content may interfere in the identification and quantification of mica, which may be a limitation when applying FTIR-ATR to ombrotrophic peat. While the partial communalities are likely related to the abundance of the mineral phases identified, calibrations with mixtures of peat and minerals would be required for a proper quantification.
Although it seems to be a minor component, the presence of clay is also suggested in bulk peat samples by absorptions at 3700–3600 cm−1 and at 1005 and 911 cm−1, most probably due to kaolinite [25]. Kaolinite is an abundant neoformation product resulting from the weathering of granitic materials in the area [52]. This signal was not present in the ash samples because kaolinite collapses at temperatures above 500 °C (the ashing temperature used in our study). It is also interesting to note that this temperature seems not to have been totally efficient in the elimination of the organic matter, in line with previous investigations [10].
Apart from clay minerals, we did not find any significant signal of other secondary phases, as the bulk peat IR signal was almost exclusively dominated by primary minerals. We cannot, however, completely rule out their presence in small amounts, neither in the ash nor the peat samples we analyzed. Secondary minerals can form upon ashing [44,45], but we did not detect a significant signal that could be related to these phases. In ombrotrophic peat, there is also the concern of distinguishing salts formed during ashing from authigenic minerals [10,53], and this is a line of research worth following.
The three main major mineral compositional groups identified in the bulk peat and ash show a consistent chronology of changes in the PPB core, except for the bottom section (older than ca. 2080 cal yr BP). The variations in the predominance of these groups enable to identify six periods (Figure 5): I (>ca. 2080 cal yr BP), the mica signal (i.e., relative abundance) dominates over quartz, K feldspars and plagioclase; II (ca. 2080–1700 cal yr BP), quartz dominates over mica, K feldspar and plagioclase; III (ca. 1700–1570 cal yr BP) samples show a similar composition to I; IV (ca. 1550–770 cal yr BP) mineral composition is similar to that of II; in Phase V (ca. 770–100 cal yr BP) quartz becomes even more abundant; and in VI (ca. 100–60 cal yr BP) mineral composition returns briefly to that of periods II and IV.
The abrupt transition that occurred between Phase I and II, from mica-dominated to quartz-dominated mineralogy, coincides with the most intense environmental change detected in the PPB record [43]. Palynological data suggest an intense deforestation of the mesophilous (i.e., alder) forests and an increase in indicators of local soil erosion at the onset of the Roman period (erosion phase E3, 2040–1690 cal yr BP, in [43]). The tipping point in forest cover was accompanied not only by increased erosion in the catchment but by hydrological changes in the mire itself, producing changes in the processes (i.e., runoff) and fluxes of mineral matter to the mire. Two other severe erosion phases detected in PPB also coincided with significant transitions in mineralogical composition (erosion phases E4 and E5, 1510–1390 cal yr BP and 710–660 cal yr BP, in [43]). Thus, the changes in mineralogical composition that show a steady increase in quartz content may indicate the progressive erosion of deeper (i.e., B horizons and granitic saprolites) and more evolved soil layers, enriched in quartz and depleted in mica, mediated by deforestation and loss of soil cover.

5. Conclusions

Our results show that the combination of FTIR-ATR and PCA on transposed matrix enabled the identification of the main minerals present in the PPB peats (i.e., quartz, mica, K felspar, and plagioclase). Bulk peat and ash provided consistent results in terms of variation of the mineral composition of the samples, with the only exception being mica in sections with high OM content. Therefore, it seems that high organic matter (>80%) content interferes in mica identification and quantification. In addition, we detected three major mineralogical associations, which defined up to six periods of change in the mineralogy of the mineral matter of the peat. These periods were found to be coeval with changes in other environmental proxies previously reconstructed and related to catchment soil erosion.
We conclude that FTIR-ATR has great potential for investigating the changes in peat mineral matter composition and the environmental processes that drive them (e.g., catchment soil erosion, changes in dust sources, storminess, etc.). Future developments may involve (i) application to ombrotrophic peat, which is a challenge by itself because of ombrotrophic peat’s low mineral matter content; (ii) distinguishing between neoformed minerals (upon ashing) and authigenic minerals, in ombrotrophic peat in particular; (iii) performing calibrations using mixtures of peat and reference minerals; and iv) comparing FTIR-ATR with other spectroscopy techniques such as DRIFT (e.g., [54]), among other avenues.

Author Contributions

Conceptualization, A.M.C., L.L.-M., N.S.-S., J.K.S. and M.E.K.; methodology, A.M.C. and N.S.-S.; investigation, A.M.C., L.L.-M., N.S.-S., J.K.S. and M.E.K.; writing—original draft preparation, A.M.C.; writing—review and editing, A.M.C., L.L.-M., N.S.-S., J.K.S. and M.E.K. All authors have read and agreed to the published version of the manuscript.

Funding

This research was funded by the grant Grupos de Referencia Competitiva (ED431C 2021/32) of Xunta de Galicia. L.L.M was supported by the Madrid Talent Attraction Program (Programa de Atracción de Talento de la Comunidad de Madrid, modalidad 1, 2019-T1/AMB-12782).

Data Availability Statement

In the event of publication, the IR data used in this manuscript (standardized absorbances of the selected peaks) will be available at the Bolin Center database repository (https://bolin.su.se/data/martinez-cortizas-2021-cruz-do-bocelo accessed on 25 January 2021).

Conflicts of Interest

The authors declare no conflict of interest. The funders had no role in the design of the study; in the collection, analyses, or interpretation of data; in the writing of the manuscript, or in the decision to publish the results.

Appendix A

Stratigraphy of the PPB Core
As indicated in Materials and Methods, the PPB core was recovered in 2017 at the Cruz do Bocelo peatland (photograph below) to a maximum depth of 140 cm. The core stratigraphy was quite homogeneous: hemic–fibric peat up to 130 cm, with slightly more decomposed (hemic–sapric) peat at 40–50 cm. The bottommost 10 cm of the core was composed of gravel and sands resulting from the weathering of the orthogneiss. Abundant wood fragments were found at the contact between the peat and the mineral sediment, along with a well-preserved hazelnut.
Figure A1. Photograph of the Cruz do Bocelo mire, in which we took the peat core analyzed in this study.
Minerals 11 01084 g0a1
Table A1. Relevant wavenumbers obtained from the second derivative spectra of the reference minerals using the {andurinha} R package.
MineralRelevant Wavenumbers (cm−1)
quartz116510851060798779695518455440431
microcline1137109010511010986768729647608580535466447417
orthoclase11311057971792770729716641574540425
albite115910941032995975788760744723649585529475462417
anorthite113910941019988924893757729684665622565537485468432
muscovite362010681031975911745641617524455440
biotite995958904813639589457430
vermiculite1012999977639617490466
Table A2. Correlation between the extracted principal components in bulk peat (pCp1 to pCp5) and the peat properties (LOI, BD, and major elements’ concentrations).
CorrelationpCp1pCp2pCp3pCp4pCp5
LOI0.90−0.740.06−0.810.48
BD−0.800.54−0.230.80−0.58
Al−0.590.670.370.37−0.03
Si−0.920.62−0.300.94−0.69
K−0.240.610.61−0.040.47
Ca0.87−0.580.31−0.900.66
Figure A2. Chronology of the changes in loss on ignition (LOI, in percentage); bulk density (BD g cm−3); Si, Al, K, and Ca concentrations (in percentage); and Si/Al ratio in the PPB peat core.
Minerals 11 01084 g0a2
Figure A3. Fractionation of the IR communalities of the peat and ashed samples, showing their relative composition. OM: organic matter; K feld: K feldspar; Mic: mica; Qtz: quartz; Plag: plagioclase.
Minerals 11 01084 g0a3

References

  1. Kylander, M.E.; Bindler, R.; Martínez Cortizas, A.; Gallagher, K.; Mörth, C.C.; Rauch, S. A novel geochemical approach to paleorecords of dut deposition and effective humidity: 8500 years of peat accumulation at Store Mosse (the ‘Great Bog’), Sweden. Quat. Sc. Rev. 2013, 69, 69–82. [Google Scholar] [CrossRef]
  2. Vanneste, H.; De Vleeschouwer, F.; Bertrand, S.; Martínez-Cortizas, A.; Vanderstraeten, A.; Mattielli, N.; Coronato, A.; Piotrowska, N.; Jerandel, C.; Le Roux, G. Elevated dust deposition in Tierra del Fuego (Chile) resulting from Neoglacial Darwin Cordillera glacier fluctuations. J. Quat. Sci. 2016, 31, 713–722. [Google Scholar] [CrossRef]
  3. Martínez Cortizas, A.; López-Costas, O.; Orme, L.; Mighall, T.; Kylander, M.E.; Bindler, R.; Gallego Sala, A. Holocene atmospheric dust deposition in NW Spain. Holocene 2020, 30, 507–518. [Google Scholar] [CrossRef]
  4. Sjöström, J.K.; Martínez Cortizas, A.; Hansson, S.V.; Silva Sánchez, N.; Bindler, R.; Rydberg, J.; Mörth, C.-M.; Ryberg, E.E.; Kylander, M. Paleodust deposition and peat accumulation rates–bog size matters. Chem. Geol. 2020, 554, 119795. [Google Scholar] [CrossRef]
  5. Kylander, M.; Martínez-Cortizas, A.; Bindler, R.; Kaal, J.; Sjöström, J.K.; Hansson, S.V.; Silva-Sánchez, N.; Greenwood, S.; Gallagher, K.; Rydberg, J.; et al. Mineral dust as a driver of carbon accumulation in northern latitudes. Sci. Rep. 2018, 8, 6876. [Google Scholar] [CrossRef]
  6. Björck, S.; Clemmensen, L.B. Aeolian sediment in raised bog deposits, Halland, SW Sweden: A new proxy record of Holocene Winter storminess variation in southern Scandinavia? Holocene 2004, 14, 677–688. [Google Scholar] [CrossRef]
  7. De Jong, R.; Björck, S.; Björckman, L.; Clemmenses, L.B. Storminess variation during the last 6500 years as reconstructed from an ombrotrophic peat bog in Halland, southwest Sweden. J. Quat. Sci. 2006, 21, 905–919. [Google Scholar] [CrossRef]
  8. Orme, L.; Davies, S.J.; Duller, G.A.T. Reconstructed centennial variability of Late Holocene storminess from Cors Fochno, Wales, UK. J. Quat. Sci. 2015, 30, 478–488. [Google Scholar] [CrossRef] [Green Version]
  9. Kylander, M.; Söderlindh, J.; Schenk, F.; Gyllencreutz, R.; Rydberg, J.; Bindler, R.; Martínez Cortizas, A.; Skelton, A. It’s in your glass: A history of sea level and storminess from the Laphroaig bog, Islay (southwestern Scotland). Boreas 2020, 49, 152–167. [Google Scholar] [CrossRef]
  10. Sjöström, J.K.; Bindler, R.; Granberg, T.; Kylander, M. Procedure for organic matter removal from peat samples for XRD mineral analysis. Wetlands 2019, 39, 473–481. [Google Scholar] [CrossRef] [Green Version]
  11. Nielsen, P.R.; Dahl, S.O.; Jansen, H.L. Mid- to late Holocene aeolian activity recorded in a coastal dunefield and lacustrine sediments on Andoya, northern Norway. Holocene 2016, 14, 1486–1501. [Google Scholar] [CrossRef]
  12. Goslin, J.; Fruergaard, M.; Sander, L.; Galka, M.; Menviel, L.; Monkenbusch, J.; Thibault, N.; Clemmensen, L.B. Holocene centennial to millennial shifts in North-Atlantic storminess and ocean dynamics. Sci. Rep. 2018, 8, 12778. [Google Scholar] [CrossRef] [PubMed] [Green Version]
  13. Smieja-Król, B.; Fialkiewicz-Koziel, B. Quantitative determination of minerals and anthropogenic particles in some Polish peat occurrences using a novel SEM point-counting method. Environ. Monit. Assess 2014, 186, 2573–2587. [Google Scholar] [CrossRef] [PubMed] [Green Version]
  14. Kylander, M.E.; Martínez-Cortizas, A.; Bindler, R.; Greenwood, S.L.; Mörth, C.M.; Rauch, S. Potentials and problems of building detailed dust records using peat archives: An example from Store Mosse (the “Great Bog”), Sweden. Geoch. Cosmo. Acta 2016, 190, 156–174. [Google Scholar] [CrossRef]
  15. Senesi, N.; Miano, T.M.; Provenzano, M.R.; Brunetti, G. Characterization, differentiation, and classification of humic substances by fluorescence spectroscopy. Soil Sci. 1991, 152, 259–271. [Google Scholar] [CrossRef]
  16. Kalbitz, K.; Geyer, W.; Geyer, S. Spectroscopic properties of dissolved humic substances—A reflection of land use history in a fen. Biogeochemistry 1999, 47, 219–238. [Google Scholar] [CrossRef]
  17. Cocozza, D.; D’Orazio, V.; Miano, T.M.; Shotyk, W. Characterization of solid and aqueous phases of a peat bog profile using molecular fluorescence spectroscopy, ESR and FT-IR, and comparison with physical properties. Org. Geoch. 2003, 34, 49–60. [Google Scholar] [CrossRef]
  18. Zaccone, C.; Miano, T.M.; Shotyk, W. 2007: Qualitative comparison between raw peat and related humic acids in an ombrotrophic bog profile. Org. Geoch. 2007, 38, 151–160. [Google Scholar] [CrossRef]
  19. Artz, R.R.E.; Chapman, S.J.; Robertson, A.H.J.; Potts, J.M.; Laggoun-Défarge, F.; Gogo, S.; Comont, L.; Disnar, J.R.; Francez, A.J. FT-IR spectroscopy can be used as a screening tool for organic matter quality in regenerating cutover peatlands. Soil Biol. Biochem. 2008, 40, 515–527. [Google Scholar] [CrossRef]
  20. Heller, C.; Ellerbrock, R.H.; Roskopf, N.; Klingenfus, C.; Zeitz, J. Soil organic matter characterization of temperate peatland soil with FTIR-spectroscopy: Effects of mire type and drainage intensity. Eur. J. Soil Sci. 2015, 66, 847–858. [Google Scholar] [CrossRef]
  21. Martínez Cortizas, A.; Sjöström, J.K.; Ryberg, E.E.; Kylander, M.E.; López-Costas, O.; Álvarez Fernández, N.; Bindler, R. 9000 years of changes in peat organic matter composition in Store Mosse (Sweden) traced using FTIR-ATR. Boreas 2021. [Google Scholar] [CrossRef]
  22. Hofmeister, A.M.; Bowey, J.E. Quantitative infrared spectra of hydrosilicates and related minerals. Mon. Not. R. Astron. Soc. 2006, 367, 577–591. [Google Scholar] [CrossRef]
  23. Sivakumar, S.; Ravisankar, R.; Raghu, Y.; Chandrasekaran, A.; Chanfromohan, J. FTIR spectroscopic studies on coastal sediment samples from Cuddalore District, Tamilnadu, India. Ind. J. Adv. Chem. Sci. 2012, 1, 40–46. [Google Scholar]
  24. Kumar, R.S.; Rajkumar, P. Characterization of minerals in air dust particles in the state of Tamilnadu, India through FTIR, XRD and SEM analyses. Inf. Phys. Technol. 2014, 67, 30–41. [Google Scholar] [CrossRef]
  25. Müller, C.M.; Pejcic, B.; Esteban, L.; Delle Piane, C.; Raven, M.; Mizaiko, B. Infrared attenuated total reflectance spectroscopy: An innovative strategy for analyzing mineral components in energy relevant systems. Sci. Rep. 2014, 4, 6764. [Google Scholar] [CrossRef] [PubMed] [Green Version]
  26. Tinti, A.; Tugnoli, V.; Bonora, S.; Francioso, O. Recent applications of vibrational mid-infrared (IR) spectroscopy for studying soil components: A review. J. Cent. Eur. Agric. 2015, 16, 1–22. [Google Scholar] [CrossRef]
  27. Della Ventura, G.; Vigliaturo, R.; Gier, R.; Pollastri, S.; Gualteri, A.F.; Iezzi, G. Infrared spectroscopy of regulated asbestos amphiboles. Minerals 2018, 8, 43. [Google Scholar] [CrossRef] [PubMed] [Green Version]
  28. Neupane, B.B.; Sharma, A.; Giri, B.; Joshi, M.K. Characterization of airborne dust samples collected from core areas of Kathmandu Valley. Heliyon 2020, 6, e03791. [Google Scholar] [CrossRef] [PubMed]
  29. Simonescu, C.M. Applications of FTIR spectroscopy in environmental studies. In Advanced Aspects of Spectroscopy; Farruck, M.A., Ed.; INTECH: London, UK, 2012; Chapter 2; pp. 49–84. [Google Scholar]
  30. Xu, Z.; Cornilsen, C.; Popko, D.C.; Pennington, W.D.; Wood, J.R.; Hwang, J.-Y. Quantitative mineral analysis by FTIR spectroscopy. Int. J. Vib. Spect. 2001, 5, 1–11. [Google Scholar]
  31. Henry, D.G.; Watson, J.S.; John, C.M. Assessing and calibrating the ATR-FTIR approach as a carbonate rock characterization tool. Sedim. Geol. 2017, 347, 36–52. [Google Scholar] [CrossRef] [Green Version]
  32. Guatame-Garcia, A.; Buxton, M. The use of infrared spectroscopy to determine the quality of carbonate-rich diatomite ores. Minerals 2018, 8, 120. [Google Scholar] [CrossRef] [Green Version]
  33. Liu, X.; Colman, S.M.; Brown, E.T.; Minor, E.C.; Li, H. Estimation of carbonate, total organic carbon, and biogenic silica content by FTIR and XRF techniques in lacustrine sediments. J. Paleolimnol. 2013, 50, 387–398. [Google Scholar] [CrossRef]
  34. Meyer-Jacob, C.; Vogel, H.; Boxberg, F.; Rodén, P.; Weber, M.E.; Bindler, R. Independent measurement of biogenic silica in sediments by FTIR spectroscopy and PLS regression. J. Paleolimnol. 2014, 52, 245–255. [Google Scholar] [CrossRef]
  35. Meyer-Jacob, C.; Vogel, H.; Gebhardt, A.C.; Wennrich, V.; Melles, M.; Rosén, P. Biogeochemical variability during the past 3.6 million years recorded by FTIR spectroscopy in the sediment record of Lake El’gygytgyn, Far East Russian Arctic. Clim. Past. 2014, 10, 209–220. [Google Scholar] [CrossRef] [Green Version]
  36. Vogel, H.; Meyer-Jacob, C.; Thöle, L.; Lippold, J.A.; Jaccard, S.L. Quantification of biogenic silica by means of Fourier transform infrared spectroscopy (FTIRS) in marine sediments. Limnol. Oceanog Methods 2016, 14, 828–838. [Google Scholar] [CrossRef]
  37. Melucci, D.; Zappi, A.; Poggioli, F.; Morozzi, P.; Giglio, F.; Tositti, L. ATR-FYIR spectroscopy, a new non-destructive approach for the quantitative determination of biogenic silica in marine sediments. Molecules 2019, 24, 3927. [Google Scholar] [CrossRef] [Green Version]
  38. Bourdon, S.; Laggoun-Defarge, F.; Disnar, J.R.; Maman, O.; Guillet, B.; Derenne, S.; Largeus, C. Organic matter sources and early digenetic degradation in a tropical peaty marsh (Tritrtivakely, Madagascar), implications for environmental reconstruction during the sub-Atlantic. Org. Geochem. 2000, 31, 421–438. [Google Scholar] [CrossRef] [Green Version]
  39. Broder, T.; Blodau, C.; Biester, H.; Knorr, K.H. Peat decomposition records in three pristine ombrotrophic bogs in southern Patagonia. Biogeosciences 2012, 9, 1479–1491. [Google Scholar] [CrossRef] [Green Version]
  40. Biester, H.; Knorr, K.-H.; Schellekens, J.; Basler, A.; Hermanns, Y.-M. Comparison of different methods to determine the degree of peat decomposition in peat bogs. Biogeosciences 2014, 11, 2691–2707. [Google Scholar] [CrossRef] [Green Version]
  41. Silva-Sánchez, N.; Schofield, J.E.; Mighall, T.M.; Martínez Cortizas, A.; Edwards, K.J.; Foster, I. Climate changes, lead pollution and soil erosion in south Greenland over the past 700 years. Quat. Res. 2015, 84, 159–173. [Google Scholar] [CrossRef] [Green Version]
  42. Silva-Sánchez, N.; Martínez Cortizas, A.; Abel-Schaad, D.; López-Sáez, J.A.; Mighall, T.M. Influence of climate change and human activities on the organic and inorganic composition of peat during the ‘Little Ice Age’ (El Payo mire, W Spain). Holocene 2016, 26, 1290–1303. [Google Scholar] [CrossRef] [Green Version]
  43. Silva Sánchez, N.; Martínez Cortizas, A.; López-Merino, L. Linking forest cover, soil erosion and mire hydrology to late-Holocene human activity and climate in NW Spain. Holocene 2014, 24, 714–725. [Google Scholar] [CrossRef]
  44. Frost, L.W.; Weier, L.M. Thermal treatment of weidellite–a Raman and infrared emission spectroscopic study. Thermoch. Act. 2003, 406, 221–232. [Google Scholar] [CrossRef] [Green Version]
  45. Bauer, P.; Elbaum, R.; Weiss, I.M. Calcium and silicon mineralization in land plants: Transport, structure and function. Plant. Sci. 2011, 180, 746–756. [Google Scholar] [CrossRef] [PubMed]
  46. García Salinas, F. Memoria Explicativa a la hoja 96, Arzúa, del Mapa Geológico de España E 1:50.000 (IGME); Servicio de Publicaciones del Ministerio de Industria: Madrid, Spain, 1978. [Google Scholar]
  47. Álvarez Fernández, N.; Martínez Cortizas, A. Andurinha: Make Spectroscopic Data Processing Easier. R package version 0.0. Available online: https://CRAN.Rproject.org/package_andurinha.2020 (accessed on 4 September 2021).
  48. Larkin, P.J. IR and Raman Spectroscopy, Principles and Spectral Interpretation; Elsevier: Amsterdam, The Netherland, 2011; p. 228. [Google Scholar]
  49. Estracanholli, E.S.; Nicolodelli, G.; Pratavieira, S.; Kurachi, C.; Bagnto, V.S. Mathematical methods to analyze spectroscopic data–new applications. In Advanced Aspects of Spectroscopy; Farrukh, M.A., Ed.; INTECH: London, UK, 2012; Chapter 17; pp. 483–498. [Google Scholar]
  50. Kylander, M.E.; Holm, M.; Fitchett, J.; Grab, S.; Martínez Cortizas, A.; Norström, E.; Bindler, R. Late glacial (17,060–13,400 cal yr BP) sedimentary and palaeoenvironmental evolution of the Sekhokong Range (Drakensher, Soutthern Africa). PLoS ONE 2021, 16, e0246821. [Google Scholar] [CrossRef]
  51. Damman, H.W.A. Distribution and movement of elements in ombrotrophic peat bogs. Oikos 1978, 30, 480–495. [Google Scholar] [CrossRef]
  52. Macías, F.; Chesworth, W. Weathering in humid regions, with emphasis on igneous rocks and their metamorphic equivalents. In Weathering, Soils and Paleosols; Martini, P., Chesworth, W., Eds.; Elsevier: Amsterdam, The Netherlands, 1992; Chapter 12; pp. 283–306. [Google Scholar]
  53. Rudmin, M.; Ruban, A.; Savichev, O.; Mazurov, A.; Dauletova, A.; Savinova, O. Authigenic and detrital minerals in peat environment of Vasyugan swamp, Western Siberia. Minerals 2018, 8, 500. [Google Scholar] [CrossRef] [Green Version]
  54. Pejcic, B.; Heath, C.; Pagés, A.; Normore, L. Analysis of carbonaceous materials in shales using mid-infrared spectroscopy. Vib. Spectr. 2021, 112, 103186. [Google Scholar] [CrossRef]
Figure 1. Location of the PPB core in the Cruz do Bocelo mire (NW Spain) and sketch of the geology (after [46]) of the area.
Minerals 11 01084 g001
Figure 2. Spectra of the peat samples (upper panel), the ash samples (mid panel), and of the standard deviations of the peat samples (black line) and ash samples (grey line) (lower panel: the region 2400–1900 cm−1 is not represented, as it is of little informative value).
Minerals 11 01084 g002
Figure 3. Average second derivative spectra of the peat samples (green line) and ash samples (orange line). Numbers correspond to the wavenumbers of the main absorption peaks identified using {andurinha}.
Minerals 11 01084 g003
Figure 4. Score spectra of the principal components extracted in the peat (pCp1 to pCp5) and ash (aCp1 to aCp5) samples and spectra of reference minerals. Black line, peat samples; grey line, ash samples; orange line, reference minerals.
Minerals 11 01084 g004
Figure 5. Chronology of the partial communalities (i.e., squares of the loadings) of the IR components extracted in the peat (black line) and ash (gray line) samples of the PPB core. These values represent the proportion of the IR signal of each sample that is accounted for by each principal component. The color bar to the right represents the homogenous groups of mineralogical composition obtained using HCA (group 1: yellow, mica > quartz > K feldspar > plagioclase; group 2: green, quartz > mica > K feldspar > plagioclase; group 3: blue, quartz > mica and K feldspar > plagioclase), which enabled identifying six (I to VI) major periods of mineralogical composition.
Minerals 11 01084 g005
Table 1. Loadings of the reference minerals in the PCA for bulk peat (pCp1 to pCp5) and ash (aCp1 to aCp5) samples (their spectra were included in both cases).
MineralBulk PeatAsh Samples
pCp1pCp2pCp3pCp4pCp5aCp1aCp2aCp3aCp4aCp5
quartz0.300.470.120.790.090.830.150.450.12-0.02
microcline0.260.870.260.310.100.420.270.860.090.02
orthoclase0.270.850.270.310.160.420.290.850.15-0.01
albite0.290.840.280.280.170.370.320.850.160.04
anorthite0.320.500.370.170.690.230.450.530.690.02
muscovite0.380.380.750.270.200.350.810.400.19-0.02
biotite0.330.270.860.190.130.270.900.290.10-0.10
Publisher’s Note: MDPI stays neutral with regard to jurisdictional claims in published maps and institutional affiliations.

