Article

Molecular and Stable Isotope Composition of Pollutants Emitted during Thermal Processes within the Rymer Coal Waste Dump (Upper Silesia, Poland)

by
Dariusz Więcław
1,*,
Krzysztof Jurek
1,
Monika J. Fabiańska
2,
Elżbieta Bilkiewicz
1,
Adam Kowalski
1,
Magdalena Misz-Kennan
2 and
Justyna Ciesielczuk
2
1
Faculty of Geology, Geophysics and Environmental Protection, AGH University of Science and Technology, 30 Mickiewicza Av., 30-059 Krakow, Poland
2
Faculty of Natural Sciences, University of Silesia, 60 Będzińska Str., 41-200 Sosnowiec, Poland
*
Author to whom correspondence should be addressed.
Minerals 2021, 11(10), 1120; https://doi.org/10.3390/min11101120
Submission received: 13 September 2021 / Revised: 7 October 2021 / Accepted: 7 October 2021 / Published: 13 October 2021
(This article belongs to the Special Issue Geochemistry and Mineralogy of Coal-Bearing Rocks)

Abstract

:
Twenty-seven gases and sixteen rock wastes from the thermal active Rymer coal waste dump were collected. The composition and origin of gaseous, liquid, and solid pollutants emitted during the self-heating process and the development of these processes with time were established. Gases were subjected to determination of molecular and stable isotope (δ13C and δ2H) composition. Rock-Eval pyrolysis and pyrolysis-gas chromatography-mass spectrometry (Py-GC-MS) were applied for evaluation of the quantity and molecular composition of pyrolysates released during the heating of rocks in temperatures from 100 to 650 °C. The main products of Py-GC-MS are released between 350 and 650 °C, namely alkanes, aromatic hydrocarbons, and aromatic alcohols. These components were also recorded in Py-GC-MS products of samples collected from the dump surface. Besides the high-molecular-weight organic compounds, in emitted gases CO2, CO, gaseous hydrocarbons, and S-compounds were recorded. The stable isotope data indicated that methane was generated mainly during the low-temperature thermogenic process, but a share of the microbial-originated gas was visible. The source of the CO2 was the oxidation of organic matter. The gaseous S-compounds were products of high-temperature decomposition of sulphides and organic S-compounds. The hydrocarbon and CO contents of the emitted gases proved to be good indicators for tracking of the self-heating processes.

1. Introduction

The by-product of coal mining, regardless of the method of exploitation (opencast or deep mining), is coal waste, usually deposited in dumps [1,2,3,4]. In the Polish part of the Upper Silesian Coal Basin (USCB), where coal mining has been carried out for over a century, coal waste dumps are part of the industrial region’s landscape [5]. The wastes consist mainly of siltstone/mudstone and sandstone with subordinate carbonates. Organic material concentration, present in a dispersed form or laminas/layers/lenses, can reach up to 30 wt.% expressed as total organic carbon (TOC) [1]. The Rymer Coal Mine, working close to the town of Rybnik (southern part of the USCB), operated from the end of the 19th century until the 1980s. The Rymer coal waste dump was formed in the early 1900s as three cones some 60–65 m in height [2]. Due to improper deposition of wastes, self-heating and spontaneous burning processes were developed, resulting in the burn out of collected material. At the end of the 1980s, in 1995–1999, and in 2004 the reclaim of the dump was made. This action was intended to inhibit self-heating processes by isolating combustible material from oxygen sources and cooling the fire outbreaks. Two cones were lowered, and the old material was separated from the air (in assumptions) with new coal wastes and inert incombustible material, mostly clays and fly ash from the power station [2]. During this process, thermal processes were intensified and pollutants were significantly emitted due to the disruption of the dump structure. Reclamation treatments proved ineffective, resulting in continued emissions of gaseous, water-soluble, and solid (tars/bitumen) pollutants [2,5,6,7]. Remote sensing techniques using available satellite images combined with thermal maps and field temperature measurements help in recognising the developing self-heating processes on coal waste dumps, also in the past [8,9]. Due to the ongoing thermal processes, the dump has been under environmental monitoring (A. Tabor, personal communication). In emitted gases, as a product of oxidation, carbon dioxide dominate. Additionally, carbon monoxide, hydrocarbons (primarily methane), molecular hydrogen, and sulphur compounds can be formed under oxygen-limited conditions (pyrolysis) [10,11,12,13]. In water-soluble organic compounds phenolic compounds, light ketones, organic acids, and polycyclic aromatic hydrocarbons (PAHs) dominate [14]. Heavy hydrocarbons and organic compounds with heteroatoms may condensate in the forms of bitumen or tars [15].
The purpose of the present study was the identification of gaseous pollutants emitted during self-heating and self-ignition processes from the thermally active coal waste dump and the determination of the relationship between their concentrations and the temperature of wastes, as well as stage of the self-heating processes development. The detailed concentrations of the S-compounds and aromatic hydrocarbons in emitted gases were published for the first time. Also, the first attempt of the stable carbon and hydrogen isotope composition of selected gases was applied for the identification of these gases’ origin. For the evaluation of properties of organic matter present in wastes, both in-situ dispersed in rock as well as secondary products of transformation of wastes in oxygen-restricted conditions (tars, bitumen), the pyrolytical methods, were used.

2. Materials and Methods
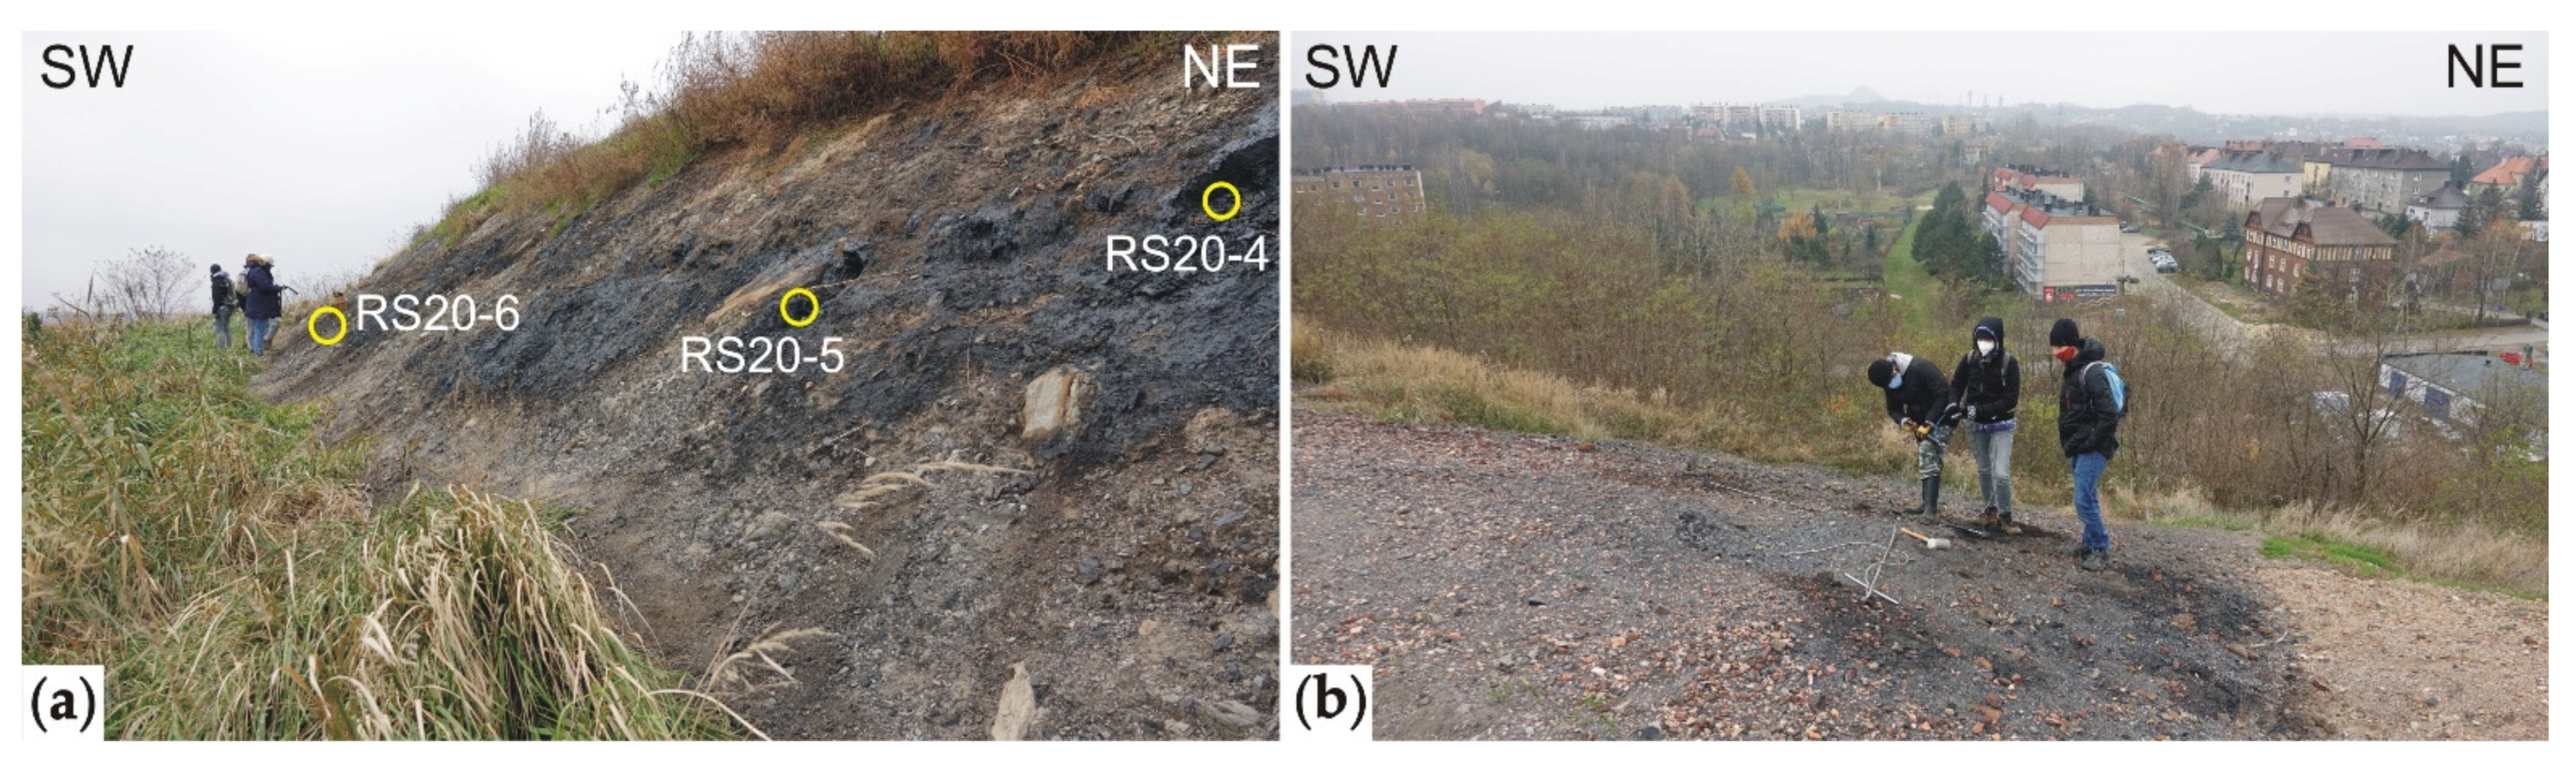
2.1. Materials

2.1.1. Gas Samples

Gas samples were collected with a soil gas probe from a depth between 0.3 m to 1 m to 1-Liter Tedlar® sample bags from the non-heating and currently thermally active dump parts in three series on 21 May 2019, 23 July 2019, and 26 November 2020 (Table 1, Figure 1). The first sampling (May 2019) was limited to areas where visible changes in the dump surface due to thermal processes (absence or dry vegetation, gas emanations, presence of oily patches on the surface) were observed. During the second sampling run (July 2019), most of the same locations were sampled as we did in May, and thermally inactive locations (samples RS-19-9 and RS-19-10) were sampled to determine the background of microbial gases in the dump. The third cycle of sampling was conducted in November 2020. It was found that the front of thermal activity has moved. The sampling sites were selected to repeat locations tested in 2019, and sample new fire outbreaks (Figure 2). In two sites (RS-20-4 and RS-20-6) two samples at each point were collected (Table 1, Figure 2a). These points were localised in chimneys with gas fumes. The first sample (S = surface) was taken directly from the chimney outlet, while the other (D = deep) was taken at the same point but at a given depth using a soil gas probe. The purpose of this sampling was the determination the differences between gas collected using a soil probe and gas emitted to the atmosphere directly from the hot spot.

2.1.2. Rock Samples

During the first and second rounds of sampling (May and July 2019), rock waste samples were collected (Figure 1). In May 2019, wastes from the surface layer were taken. The rocks were weathered, and in the thermally active points, samples contained besides coal waste material also crust of precipitated tars. Samples RS-19-6 and RS-19-7 were taken from the spaces between the concrete panels and were a mixture of solid bitumen and the bulk material used to seal the panels. In July 2019, rocks were collected at depths of ca. 15 cm. At this depth, weathering processes are restricted due to the permanent presence of moisture (in hot points, i.e., vapour mixed with secondary products of self-heating). At each point, ca. 500 g of solid material was taken to a glass jar and closed tightly to prevent vapour and hydrocarbons evaporation.

2.2. Methods

2.2.1. Gas Samples

Molecular compositions of natural gases (CH4, C2H6, C2H4, C3H8, i-C4H10, n-C4H10, trans-2-C4H8, 1-C4H8, cis-2-C4H8, neo-C5H12, i-C5H12, n-C5H12, n-C6H14 and sum of C6 isomers, n-C7H16 and sum of C7 isomers, n-C8H18, CO2, O2, H2, N2, He, and Ne) were analysed in a set of two columns on Agilent 7890A gas chromatograph (GC) equipped with a gas sampling valve plumbed with a dual sample loop. The first sample loop was connected to a flame ionisation detector (FID) with a 50 m × 0.53 mm i.d. alumina column for the determination of the concentration of the C1-C8 hydrocarbons, and the second loop used a thermal conductivity detector (TCD) connected with a 1/8” packed column with HayeSep Q 80/100 mesh and 1/8” packed column with molecular sieve 13× for the analysis of H2, He, Ne, CO2, O2, N2, C2H6 and CH4 concentration. Argon was used as a carrier gas. The GC oven was programmed: 60 °C held for 1 min, then increased to 90 °C at the rate of 10 °C/min, then increased to 190 °C at the rate of 20 °C/min and finally held for 11 min. Concertation of hydrogen sulphide (H2S) and carbonyl sulphide (COS), methanethiol (MM), ethanethiol (EM), 1-propanethiol (MP), dimethylsulphide (DMS) and methylethylsulphide (MES) was analysed on the second Agilent 7890B GC equipped with a gas sampling valve plumbed with sample loop equipped with Agilent DB-1 60 m × 0.530 mm × 5 μm column and flame photometric detector (FPD) using helium as a carrier gas. The GC oven was programmed: 35 °C held for 5 min, then increased to 200 °C at the rate of 15 °C/min, then increased to 230 °C at a rate of 20 °C/min and held for 3 min. Concertation of carbon monoxide (CO) was analysed on Thermo Scientific TRACE 1300/1310 GC. The sample loop was connected to two series-connected columns Rt-Q-BOND (15 m × 0.53 mm × 20 μm) held isothermal at l50 °C and RT-Msieve 5A (30 m × 0.53 mm × 50 μm) kept in a constant temperature of 40 °C with methanizer, where CO was converted into CH4 and analysed on FID. Helium was used as a carrier gas. Benzene, toluene, ethyl-benzene, xylenes, chlorobenzene, was analysed on Agilent Technologies 7890A gas chromatograph coupled with Agilent Technologies 5975C inert mass selective detector (MSD) with Triple Axis Detector (GC-MS system). Gas samples were introduced to the GC-MS through an inlet equipped with liner in split mode (7:1) heated to 300 °C. Separation of compounds was made using Agilent HP-PONA 50 m × 200 μm × 0.5 μm column with helium (carrier gas) flow of 1.4 mL/min. The temperature program started from 24 °C, held for 6 min, then increased with a rate of 8 °C/min to 180 °C and finally held for 2 min. Signal was collected in two ranges. From start to 7 min, masses from 14 to 350 m/z were monitored, next from 25 to 450 m/z. Source temperature was 230 °C, and MS Quad temperature was 150 °C. Mass spectra were recorded under electron impact ionisation energy at 70 eV.
Stable carbon isotope analyses of methane, ethane, propane, and carbon dioxide were carried out using a Finnigan™ Delta Plus MS coupled through a GC combustion III interface with an HP 6890 GC. The stable hydrogen isotope analyses of methane were performed in a Thermo Scientific™ Delta VTM Plus MS connected through GC Isolink™ and Conflo IV interfaces with a Trace GC Ultra chromatograph. The stable carbon and hydrogen isotope data are expressed in the δ-notations (δ13C and δ2H, ‰) relative to VPDB and VSMOW, respectively. Analytical precision established as standard deviation from 10 measurements is estimated to be ±0.2 and ±3 ‰ for δ13C and δ2H, respectively. All gas analyses were performed at the Faculty of Geology, Geophysics and Environmental Protection, AGH University of Science and Technology (AGH UST) in Krakow.

2.2.2. Rock Samples

An aliquot of each rock sample prior to geochemical analyses was dried at room temperature to constant mass and pulverised in a rotary mill to fraction below 0.2 mm.

Rock-Eval Pyrolysis

Pyrolysis in the anhydrous, open-system was conducted using the Rock-Eval 6 Turbo apparatus at AGH UST. The general evaluation of the hydrocarbon potential of the rocks was established by applying the Basic cycle of the ‘Bulk Rock’ method. The analysis consists of two steps: firstly, rock (ca. 50 mg) is heated in a pyrolytic oven under nitrogen flow in temperatures from 300 to 650 °C. The pyrolysed sample is moved to an oxidation oven, where, in the air atmosphere, the remaining organic material is burned in temperatures from 300 to 850 °C. The details of the analysis was described by Waliczek et al. [16] and Zielińska et al. [17]. The received parameters and indices are presented by Lafargue et al. [18].
For identification of the fractions of the solid hydrocarbon pollutants present in selected samples, the ‘Multi Heating Rates’ method was applied. This method allows stepwise programming pyrolysis (up to six steps) and identification of the quantity of flammable products (hydrocarbons) evaporated at each temperature range (analysed on FID). For the current study, the temperature in the pyrolytic oven was programmed: start at 100 °C (5 min of isothermal heating), an increase of the temperature to 180 °C at 10 °C/min (5 min of isothermal heating), increase to 250 °C at 15 °C/min (5 min of isothermal heating), increase to 350 °C at 20 °C/min (5 min of isothermal heating), increase to 450 °C at 25 °C/min (5 min of isothermal heating) and final heating to 650 °C at 25 °C/min. The quantities of hydrocarbons released in individual temperature intervals have been marked as Q0, Q1, Q2, Q3, Q4, and Q5.

Stepwise Pyrolysis in Py-GC-MS

The Py-GC-MS experiments were carried out using CDS Analytical Inc. (Oxford, PA, USA) Pyroprobe 5000 and CDS Analytical Inc. CDS 1500 valved interface linked to Agilent Technologies 7890A gas chromatograph coupled with Agilent Technologies 5975C inert mass selective detector (MSD) with Triple Axis Detector at AGH UST. Samples were crushed in a mortar to a fraction below 0.2 mm, and aliquots c.a. 2 mg was pyrolyzed in a capillary sample holder using the platinum coil attachment of 1/4 inch diameter using helium as carrier gas. The sample in a quartz capillary sample holder was introduced to a valved interface heated to 30°C and rinsed with He for c.a. 1 min for removing of air. In the first stage, the interface and the probe were heated ballistically to 180 °C and held for 3.5 min., next to 250 °C (both interface and probe) and held for 3.5 min, then to 350 °C (the interface to 290 °C and the probe to 350 °C) and held for 3.5 min., then, the sample was heated to 450 °C (the interface was still at 290 °C and the probe at 450 °C) and held for 15 s, then to 650 °C and 750 °C with conditions as for 450 °C. During each stage of heating, the released gases were directly directed for GC-MS analysis and the next stage of heating was started after the GC program was finished. For identification of the products of pyrolysis pyrolytic gases were introduced to the GC through an inlet system equipped with liner heated to 320 °C in split mode (50:1). For separation of compounds, the column Agilent HP-PONA 50 m × 200 μm × 0.5 μm was initially held at 30 °C for 7 min, then was heated with a rate of 8 °C/min to 305 °C (held for 5 min). Helium was used as a carrier gas with a flow of 1.4 mL/min. The MSD operated with an ion source temperature of 230 °C, ionisation energy of 70 eV and a cycle time of 1 s in the mass range from 20 to 550 m/z.

3. Results

3.1. Gas Samples

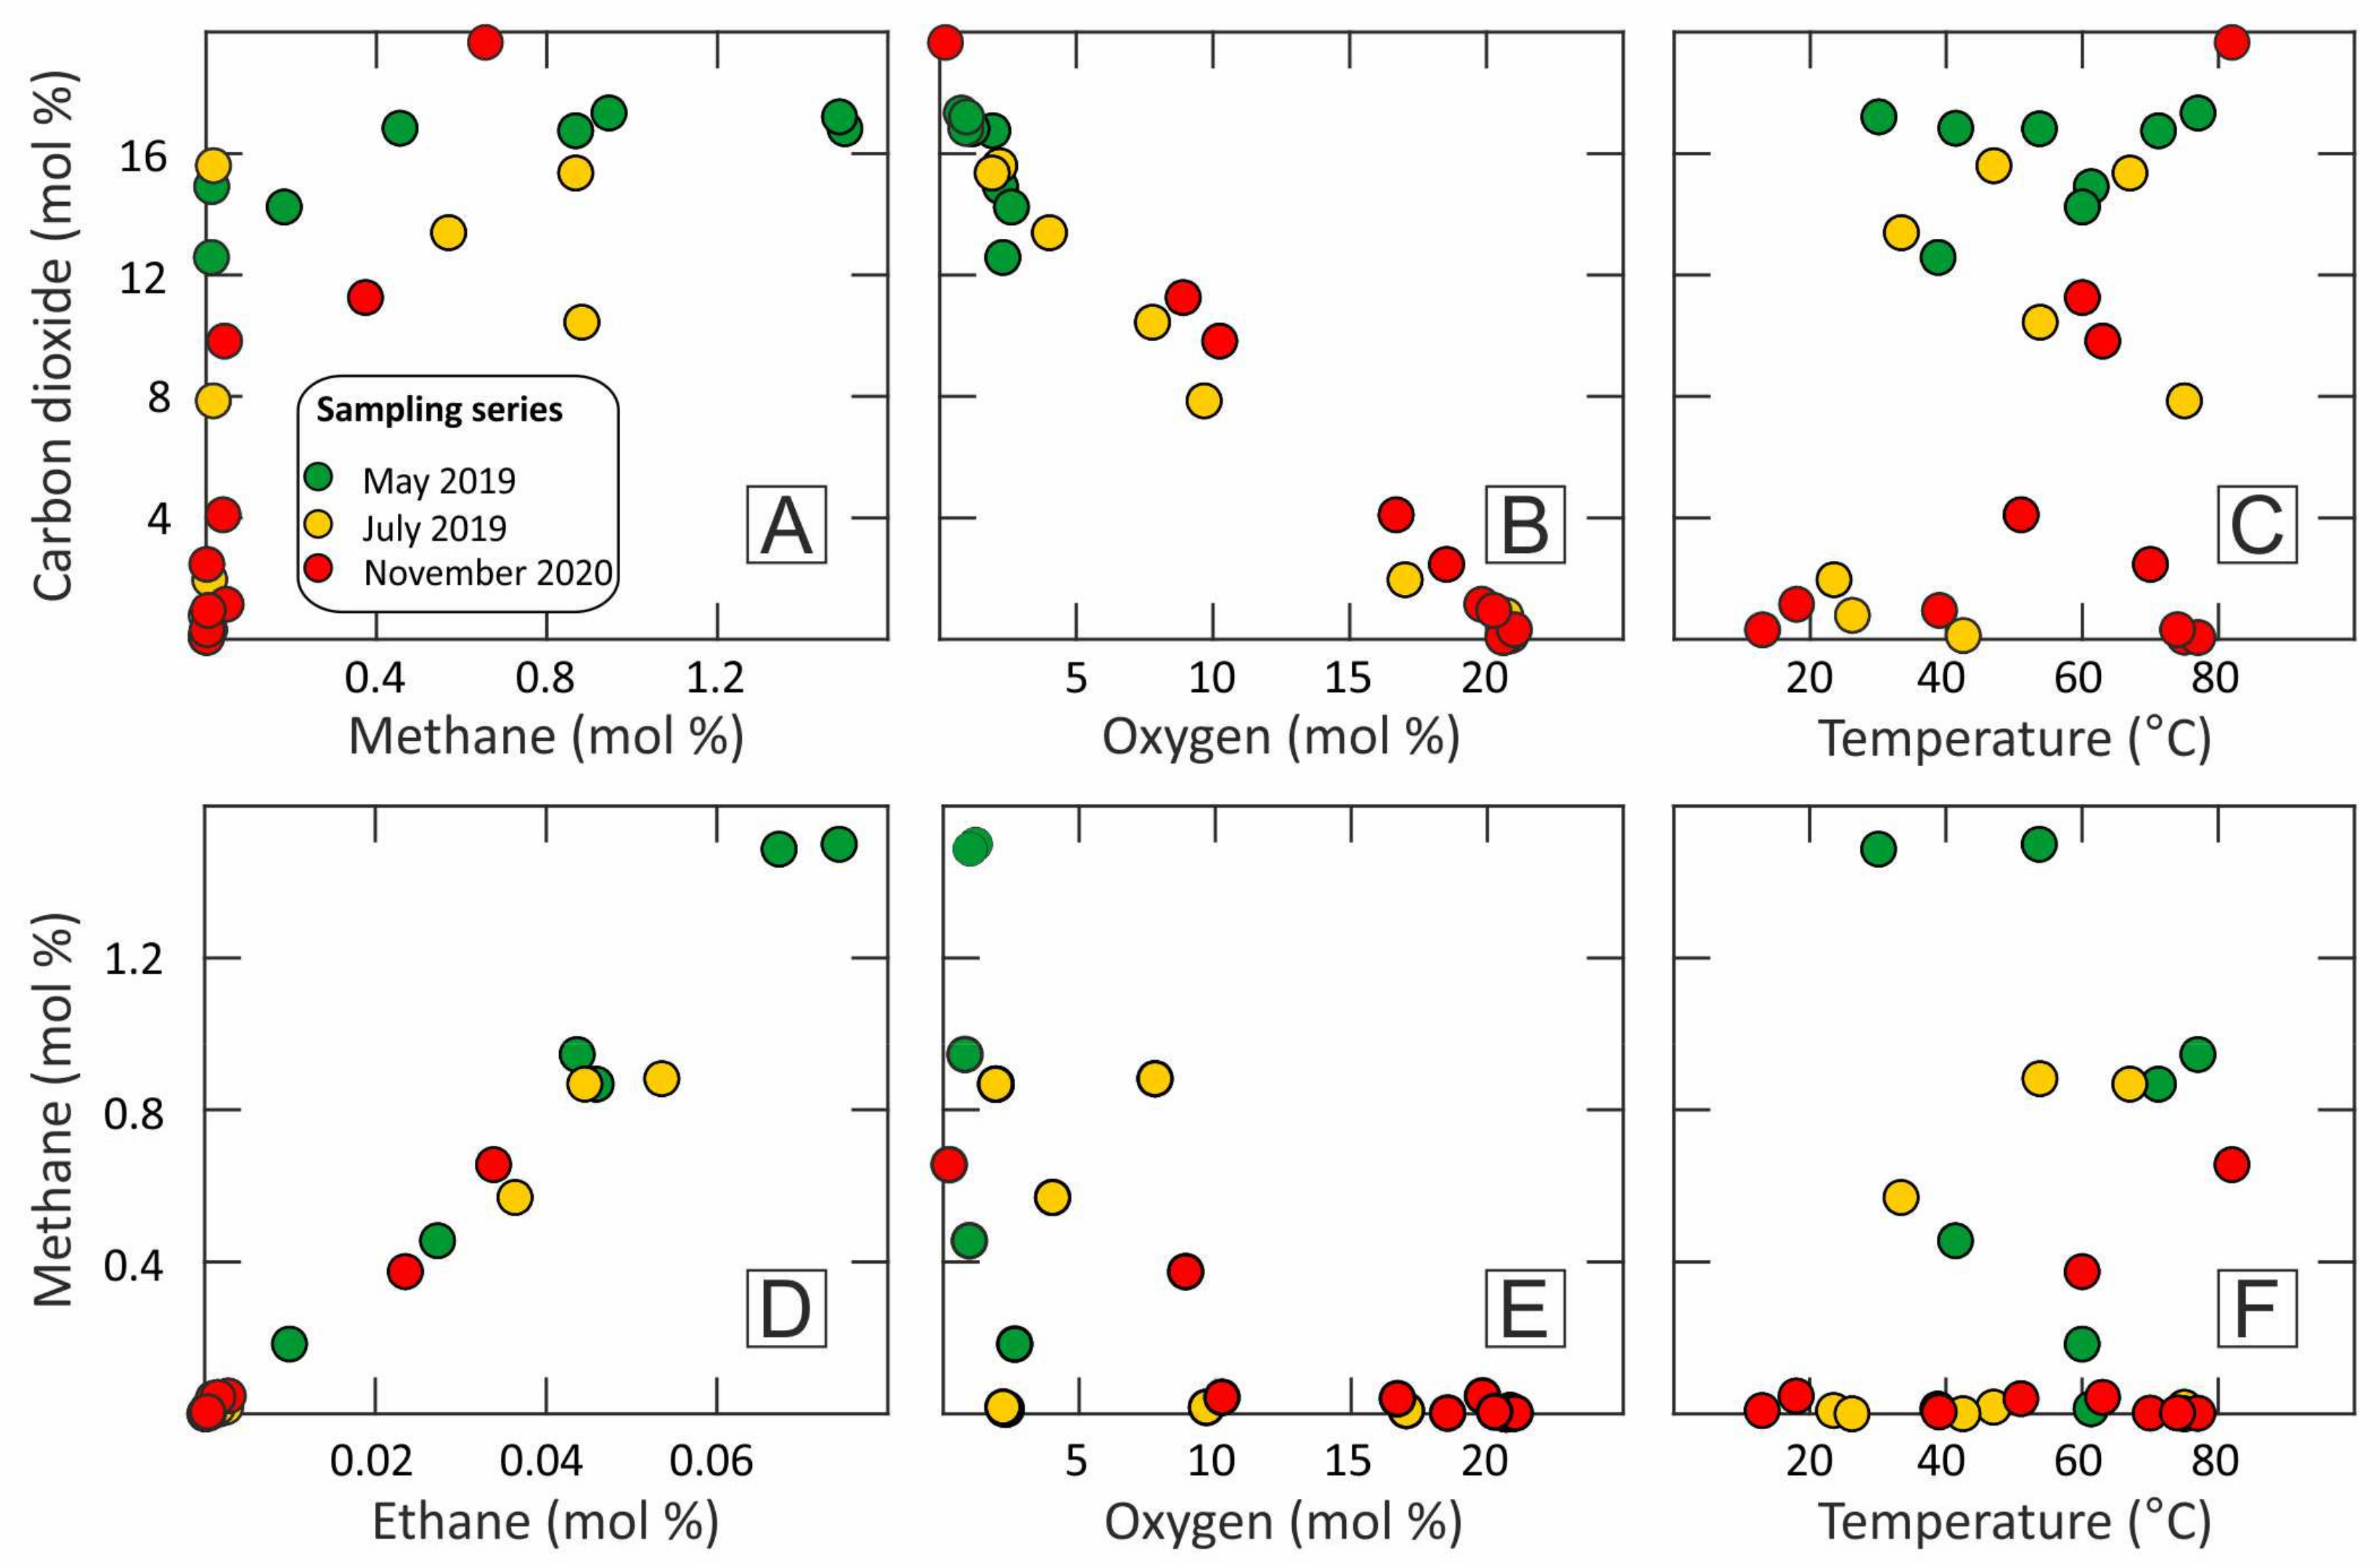
3.1.1. Molecular Composition

Molecular composition analysis revealed that sampled coal waste dump gases are composed of air mixed with both hydrocarbon and non-hydrocarbon gaseous compounds. Results of the molecular analysis are presented in Supplementary Materials (Table S1).
Molecular nitrogen occurs in concentrations from 78.5 to 85.1 mol %, and oxygen contents vary from 0.217 to 21.0 mol %. Other main components include carbon dioxide and methane whose concentrations vary from 0.06 up to 19.7 mol % and from <0.001 up to 1.5 mol %, respectively. Among sulphur compounds, hydrogen sulphide occurs in the highest concentrations up to 102.8 ppm. Measured concentrations of methanethiol and ethanethiol are within the range 0.00–1.45 ppm and 0.00–6.46 ppm, respectively. Carbonyl sulphide occurs in amounts up to 0.92 ppm, and other sulphur compounds are minor components of studied gases. Higher hydrocarbon gases, molecular hydrogen, helium, neon and carbon monoxide occur, mostly in much lower amounts than methane. Unsaturated hydrocarbons are present in insignificant concentrations. The relative percentage compositions of selected compounds of analysed gases calculated as molecular gas indices are presented in Table 2. Due to the fact that studied gas samples were collected in the subsurface area, where gas is the mixture of bacterial gas generated in-situ, air, and gases diffused from deeper parts of the dump, molecular indices should be regarded with caution.

3.1.2. Isotopic Composition

Results of the stable isotope composition of selected gases and differences of stable carbon isotope values between individual components are shown in Table 3. The analyses were conducted only for gases where the concentration of a given compound (CH4, C2H6, C3H8, CO2) was sufficient to reach a reliable result (intensity of peak at MS above 1 mV). Additionally, the stable isotope compositions of methane, ethane and carbon dioxide of coke-oven gas produced at ca. 1000 °C from neighbouring coke plant in Radlin (using primarily coal from this part of the USCB) were measured for evaluation of isotope trends with increasing pyrolysis temperature.
Stable carbon isotope composition of methane from Rymer waste dump varies from −47.4 to −39.8‰, apart from one sample (RS-20-6S) showing the value of −29.0‰. Stable hydrogen isotope composition of methane varies from −246 to −223‰. Stable carbon isotope composition of ethane and propane are within the range of −26.1 to −23.3‰ and −24.9 to −21.6‰, respectively. Carbon dioxide shows δ13C values ranging from −28.4 to −19.2‰.

3.2. Rock Samples

3.2.1. Rock-Eval Data
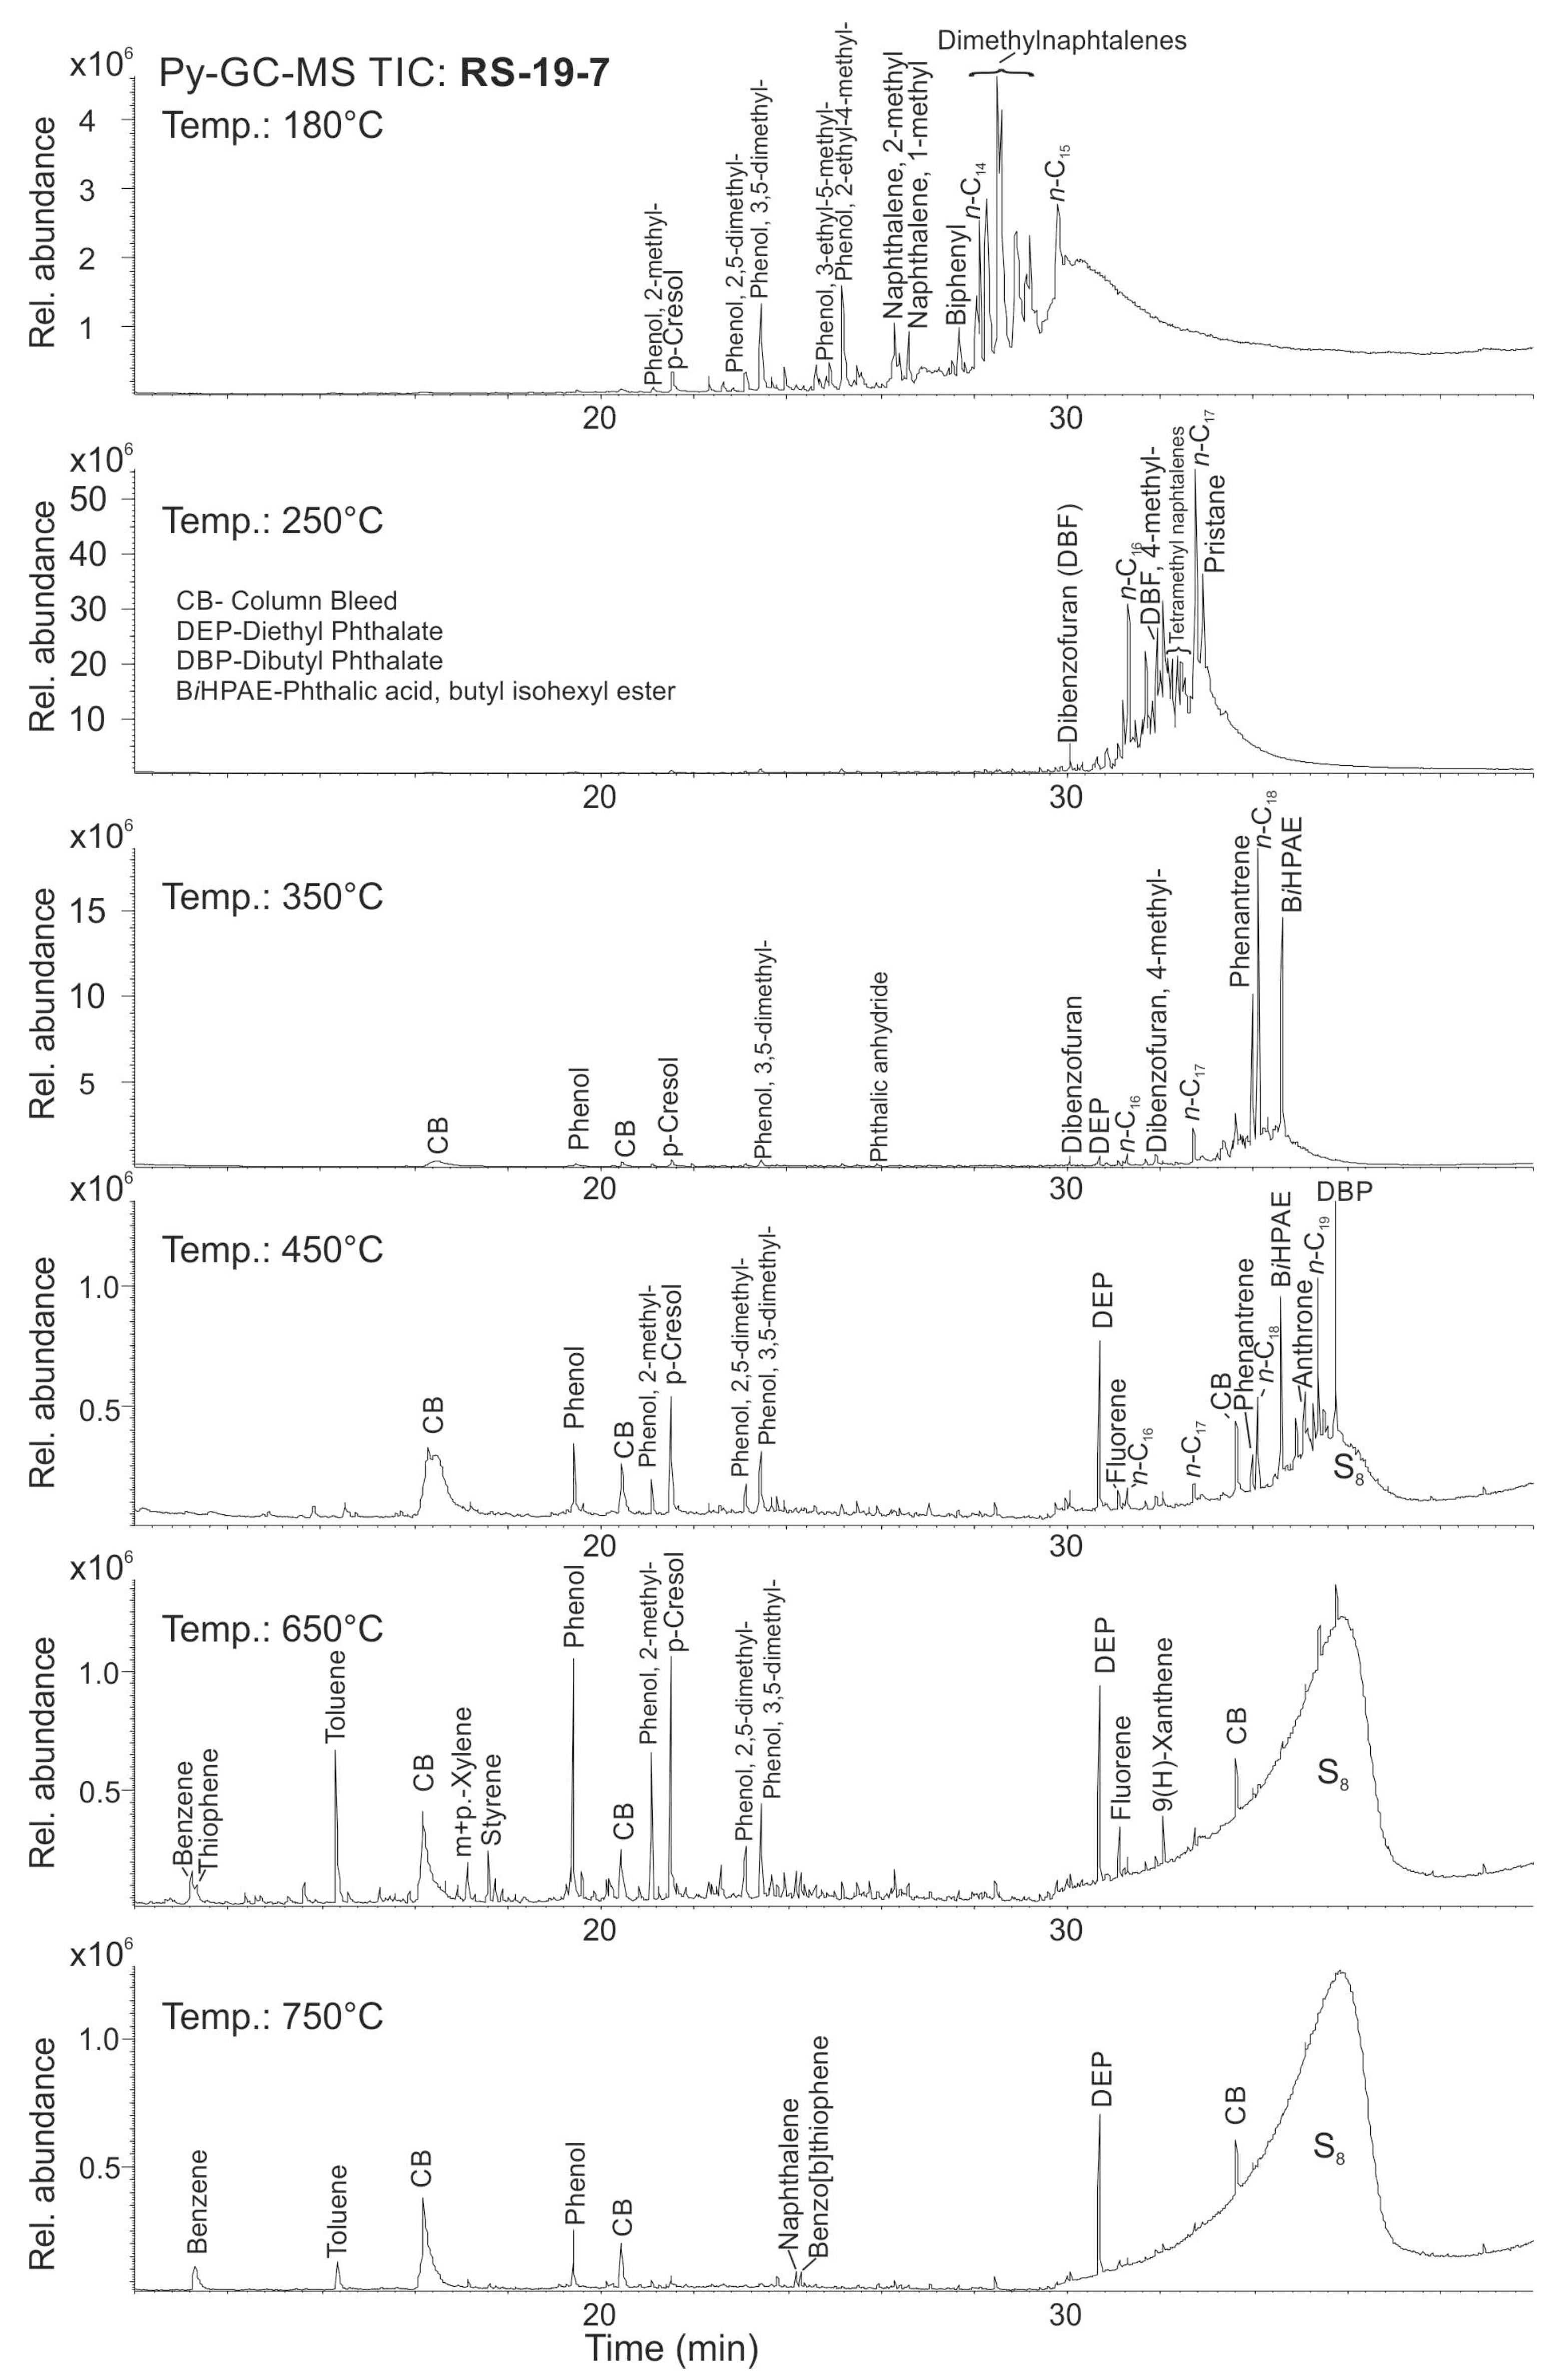
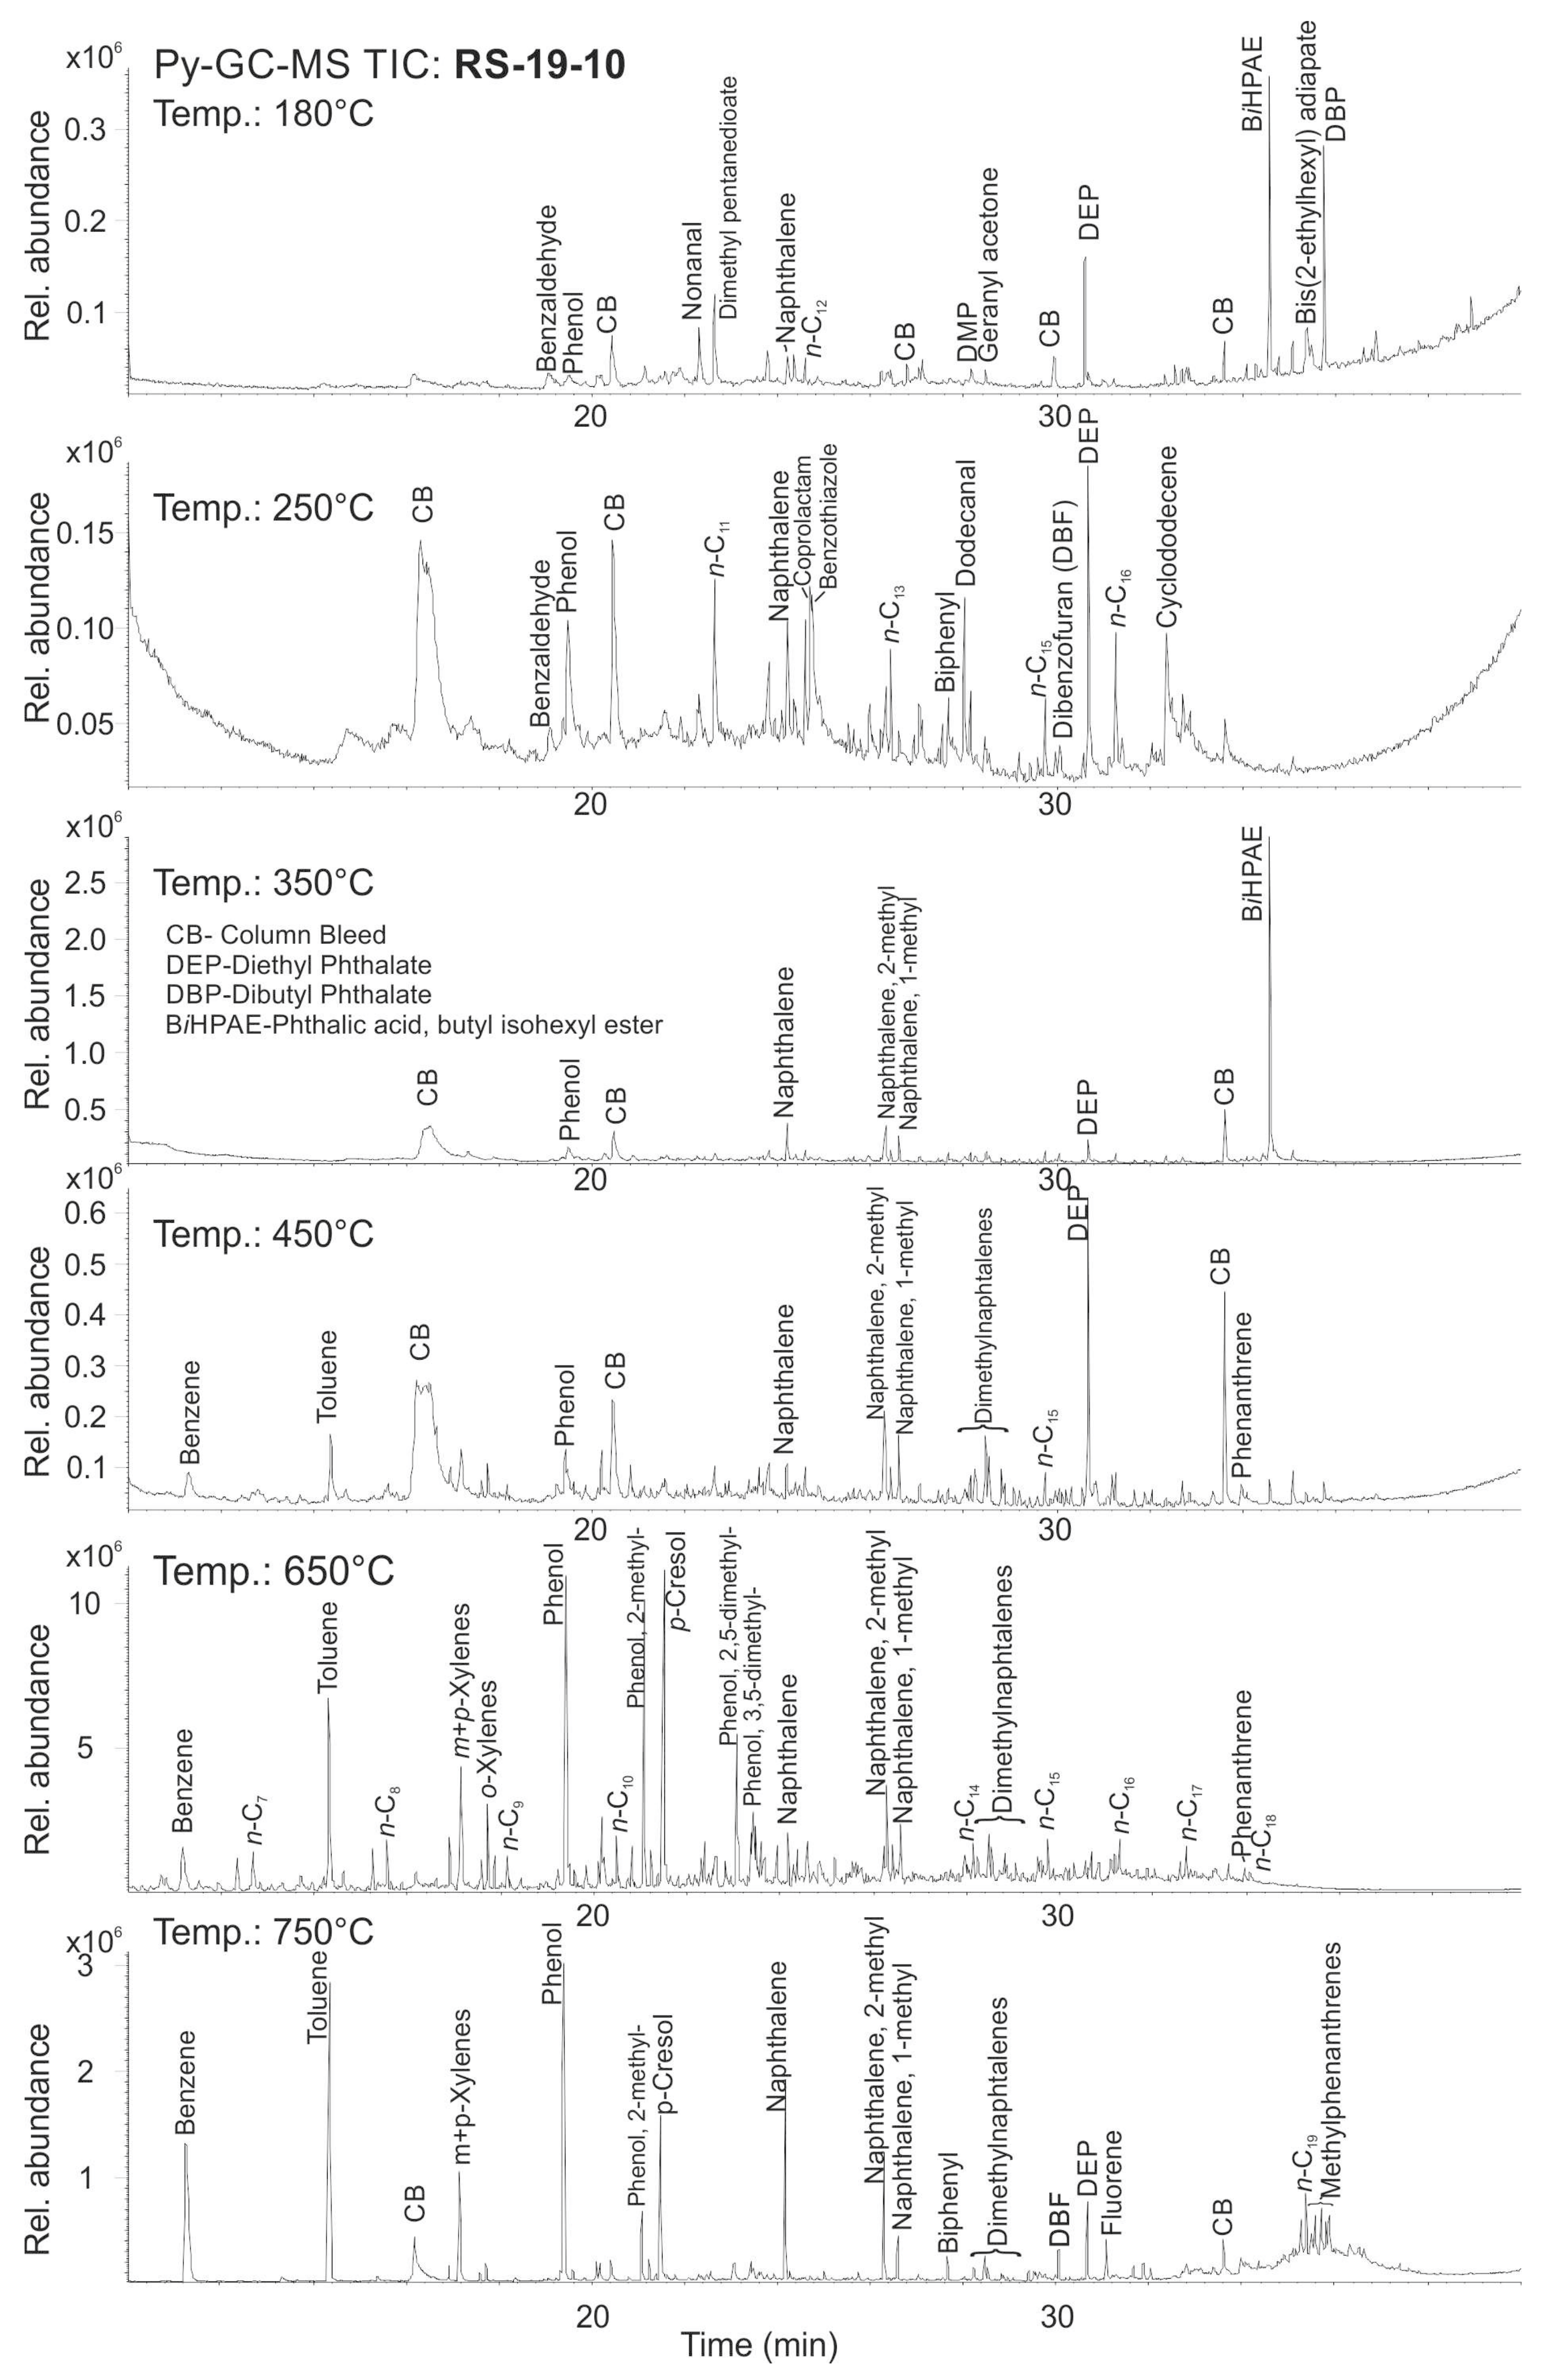
Results of the ‘Bulk Rock’ method of the Rock-Eval analysis are presented in Table 4. In all samples elevated concentrations of TOC, from 7.3 to 28.6 wt.% were recorded. The average of the TOC of samples collected in July 2019 (from 0.15 m depth) is higher than rocks collected in May 2019 from the surface (20.9 and 13.6 wt.%, respectively). The same relation is visible in the mineral carbon content (MINC), which ranges from 0.55 to 0.96 wt.%. in surface-collected coal wastes and from 1.28 to 2.8 wt.% in rocks taken from the subsurface layer. The RS-19-6 and RS-19-7 samples contain higher concentrations of MINC than other surface samples, but they are composed of another material than the remaining ones. The last mentioned two samples are characterised by significantly lower Tmax values and elevated values of PI than other samples. The remaining samples collected from the dump surface have statistically higher Tmax and PI values than rocks taken from the subsurface (Table 4). Values of the HI and OI samples taken from the subsurface are statistically higher than rocks collected from the surface.
The two surface samples (RS-19-6 and RS-19-7) richest in free hydrocarbons evaporated at 300 °C during ‘Bulk Rock’ method (Table S1 and Table 4) and RS-19-10 sample (collected from the thermally inactive zone), were subjected to the ‘Multi Heating Rates’ method and the results of this analysis is presented in Table 5.
There is a visible comparable total quantity of hydrocarbons (QT) and distribution of recorded fractions in RS-19-6 and RS-19-7 samples. The fraction evaporated at 100–180 °C (Q1) dominates and represents more than 50% of the total quantity of released hydrocarbons from these samples. Also, fraction evaporated in the range 180–250 °C (Q2) has a high share, ca. 20–30% relative. Hydrocarbons produced from the RS-19-10 sample are dominated by fractions received from 350 to 650 °C (Table 5).

3.2.2. Py-GC-MS

The Py-GC-MS studies were conducted for two samples: first, rich in secondary products of coal waste self-heating: tars and solid bitumen, collected from currently thermally active area (RS-19-7); and second, typical coal waste deposited in this heap, subjected only to weathering and microbial processes, collected from a thermally inactive area (RS-19-10). The molecular composition of gases released during pyrolysis of the RS-19-7 sample represents components accumulated in the solid crust at the surface layer and potentially subjected to leaching by meteoric waters, whereas compounds recorded during pyrolysis of RS-19-10 sample are products released from coal wastes during self-heating and self-burning processes at oxygen-restricted conditions. The total ion chromatograms (TIC) of pyrolysates of RS-19-7 and RS-19-10 samples are presented in Figure 3 and Figure 4, respectively.
In the components released from the RS-19-7 sample at temperatures up to 350 °C aromatic oxygen-containing compounds (OCC): dibenzofuran and alcohols, and some alkanes and PAHs (homologues of naphthalene and phenanthrene) occur. With an increasing temperature of pyrolysis (from 450 to 750 °C), there are also other polyaromatic hydrocarbons (PAHs, e.g., fluorene) and OCC (e.g., anthrone) recorded. The increasing share of low-weight compounds (benzene, toluene and xylenes (BTX), phenol homologues) being the most probable products of thermal decomposition of the high-molecular-weight molecules is visible. The dominating compound recorded in pyrolytic gases at temperatures from 450 to 750 °C is native sulphur (Figure 3). Taking into consideration the intensity of peaks, it is possible to evaluate the dominating compounds released from this sample. The signal from pyrolysis at 250 °C is ca. three times higher than recorded from pyrolysis at 350 °C and by more than an order of magnitude from other chromatograms (Figure 3). Therefore, these two chromatograms (recorded at 250 and 350 °C) show dominating compounds of thermal decomposition of tars precipitated at the surface of self-heating coal waste dump: alkanes, PAHs, and in smaller amounts dibenzofuran derivatives.
Among the compounds released during sequential pyrolysis of RS-19-10 sample at temperatures from 180 to 350 °C alkanes, PAHs, and OCC (acids, alcohols, aldehydes and ketones) are mostly recorded (Figure 4). Benzothiazole, the compound containing sulphur and nitrogen (C7H5NS), was also recorded. The same or structurally comparable components were recorded in pyrolysis products of the RS-19-7 sample (polluted by secondary products of the self-heating processes, Figure 3).
At higher temperatures of pyrolysis (above 450 °C), there is recorded generation of much more components. However, their group composition becomes more uniform and includes saturated hydrocarbons (from C7 to C19), aromatic hydrocarbons (BTX, PAHs) and OCC (phenols, cresols and dibenzofuran). Taking into consideration the intensity of peaks the dominating products of pyrolysis are released at temperatures above 450 °C (Figure 4). It means that the production of pollutants is the most effective in these temperatures, and PAHs, alkanes, and low-boiling aromatic alcohols are the main products of this process. These components are then accumulated in the form of the solid crust in the colder (surface) layer of the coal waste dump.

4. Discussion

4.1. Evaluation of Pollutants Released during Self-Heating Using Rock-Eval and Py-GC-MS

Pyrolytic methods are widely used for the characterisation of organic materials. One of the pyrolytic methods often applied for hydrocarbon potential analysis of source rocks [19,20,21,22], recent sediments [23,24], or organic matter dispersed in soils evaluation [24,25] and also characterisation of the hydrocarbons-polluted ground [26] is the Rock-Eval programmed pyrolysis. The basic application of this method is the evaluation of rock properties as a source of hydrocarbons. For this purpose, the Bulk Rock method was applied for coal wastes collected from the Rymer dump (Table 4). In all samples, the gas-generative Type-III kerogen occurs (HI < 200 mg HC/g TOC), and its maturity refers to an initial and mid-phase of “oil window” (Tmax usually from 430 to 440 °C) [27]. Samples collected from the subsurface layer are statistically richer in TOC and MINC and have higher values of HI and OI (Table 3) than surface ones. This lowering of these indices in surface samples is connected with the permanent destruction of organic matter and carbonates by oxygen and meteoric waters leading to an increased proportion of residual (dead) carbon in C budged of these samples. The production index (PI = S1/(S1 +S2)) shows the share of light hydrocarbons (evaporated in 300 °C, S1) in a total amount of pyrolysable hydrocarbons. Its elevated values (above 0.4) indicate a very high maturity of organic matter or pollution by migrating hydrocarbons [27]. Such values are usually noted for surface samples identifying deposition on the surface of tars and bitumen generated in deeper layers during self-heating processes.
Application of the ‘Multi Heating Rates’ (MHR) method allow identifying of the fraction composition of pyrolysable organic matter (OM) present in rock [26]. In surface samples (RS-19-6 and RS-19-7) occur products of the deeper self-heating process. During pathway, they were deposited according to local surface, and quality of transported compounds and on the surface were oxidised or enzymatically transformed. High concentrations of fraction evaporated from 100 to 180 °C in these samples were recorded (Table 5). This indicates that bitumen and tars occurring on dump surface are composed mostly of light organic compounds or bonds in heavy-weight organic structures are weak and break at low temperatures suggesting low stability of this material. It may evaporate, polluting the air, especially on hot days, when the surface of the heap heats up. The organic material in coal wastes (represented by RS-19-10 sample) during MHR analysis decomposes at 350–650 °C (Table 5), indicating that during self-heating of coal wastes, in this temperature interval, most of the organic pollutants is generated. Results of Py-GC-MS analysis of this sample show that at temperatures above 450 °C saturated hydrocarbons (from C7 to C19), aromatic hydrocarbons (BTX, PAHs) and OCC (phenols, cresols and dibenzofuran) are released (Figure 4). These molecules migrate to the surface of the heap, are partly emitted to air [15], partly are dissolved in meteoric waters [14] and partly precipitate in surface layers (see the molecular composition of pyrolysates produced from sample RS-19-7, Figure 3).

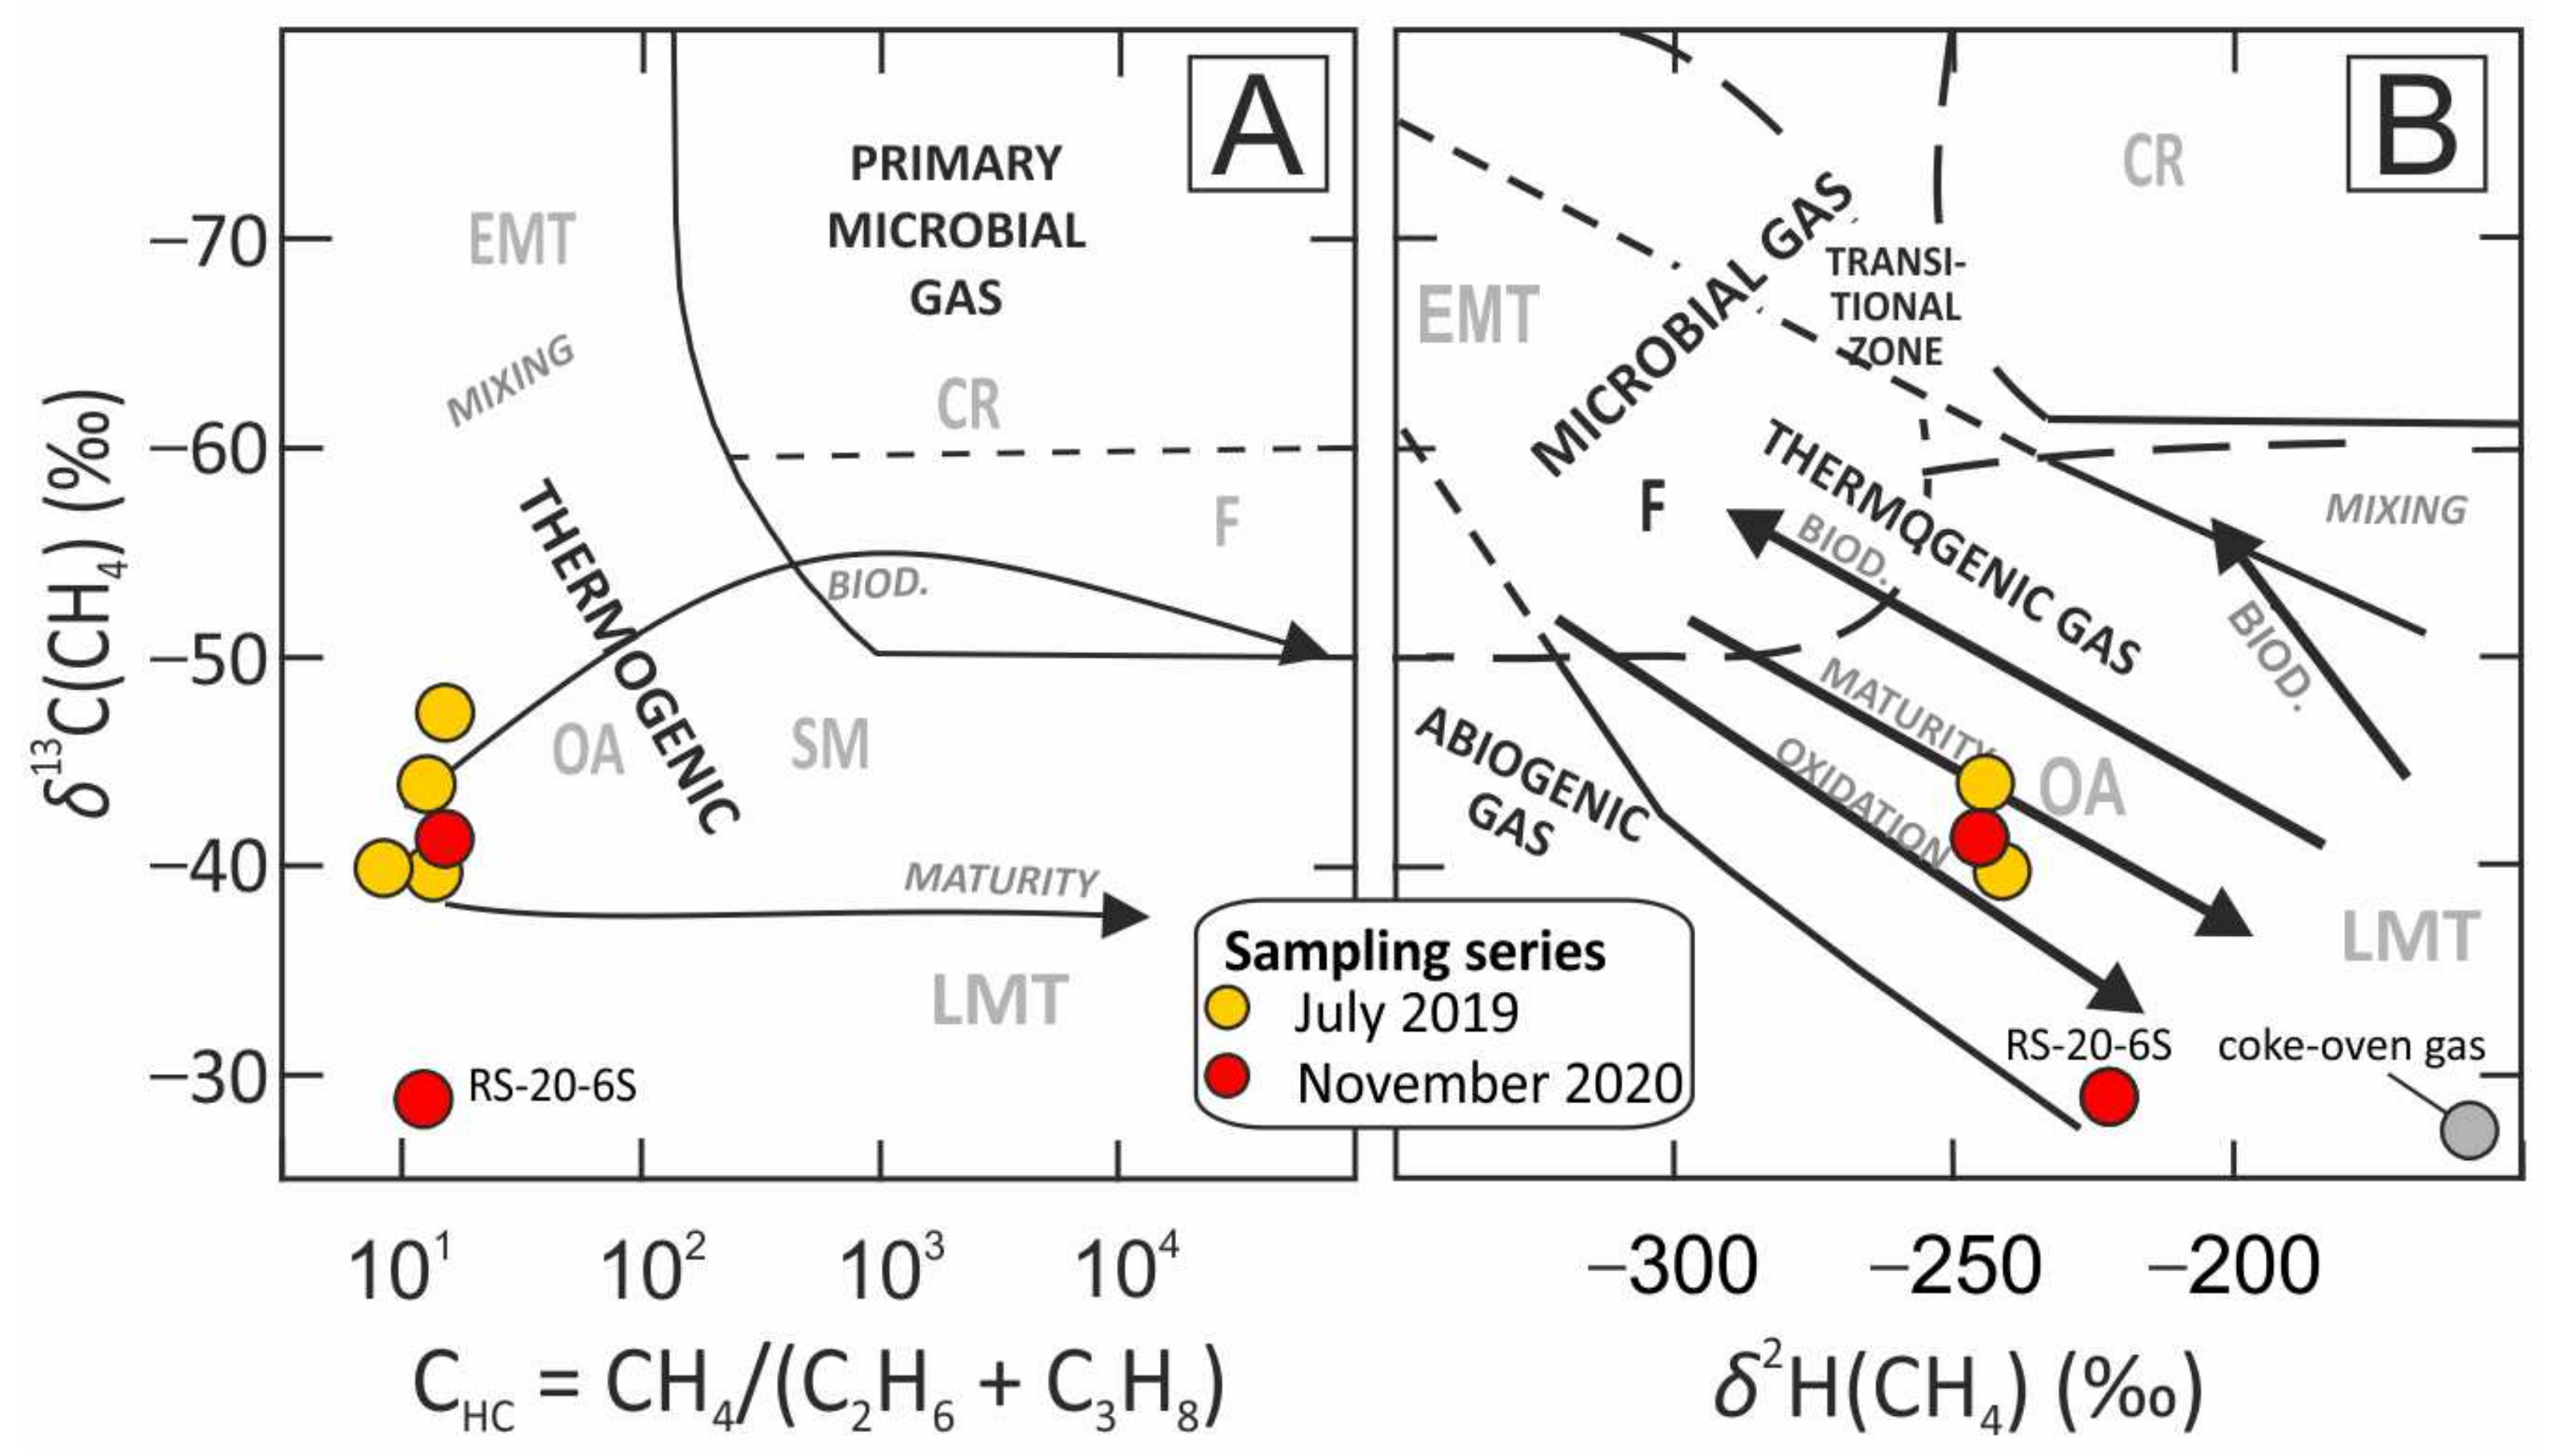
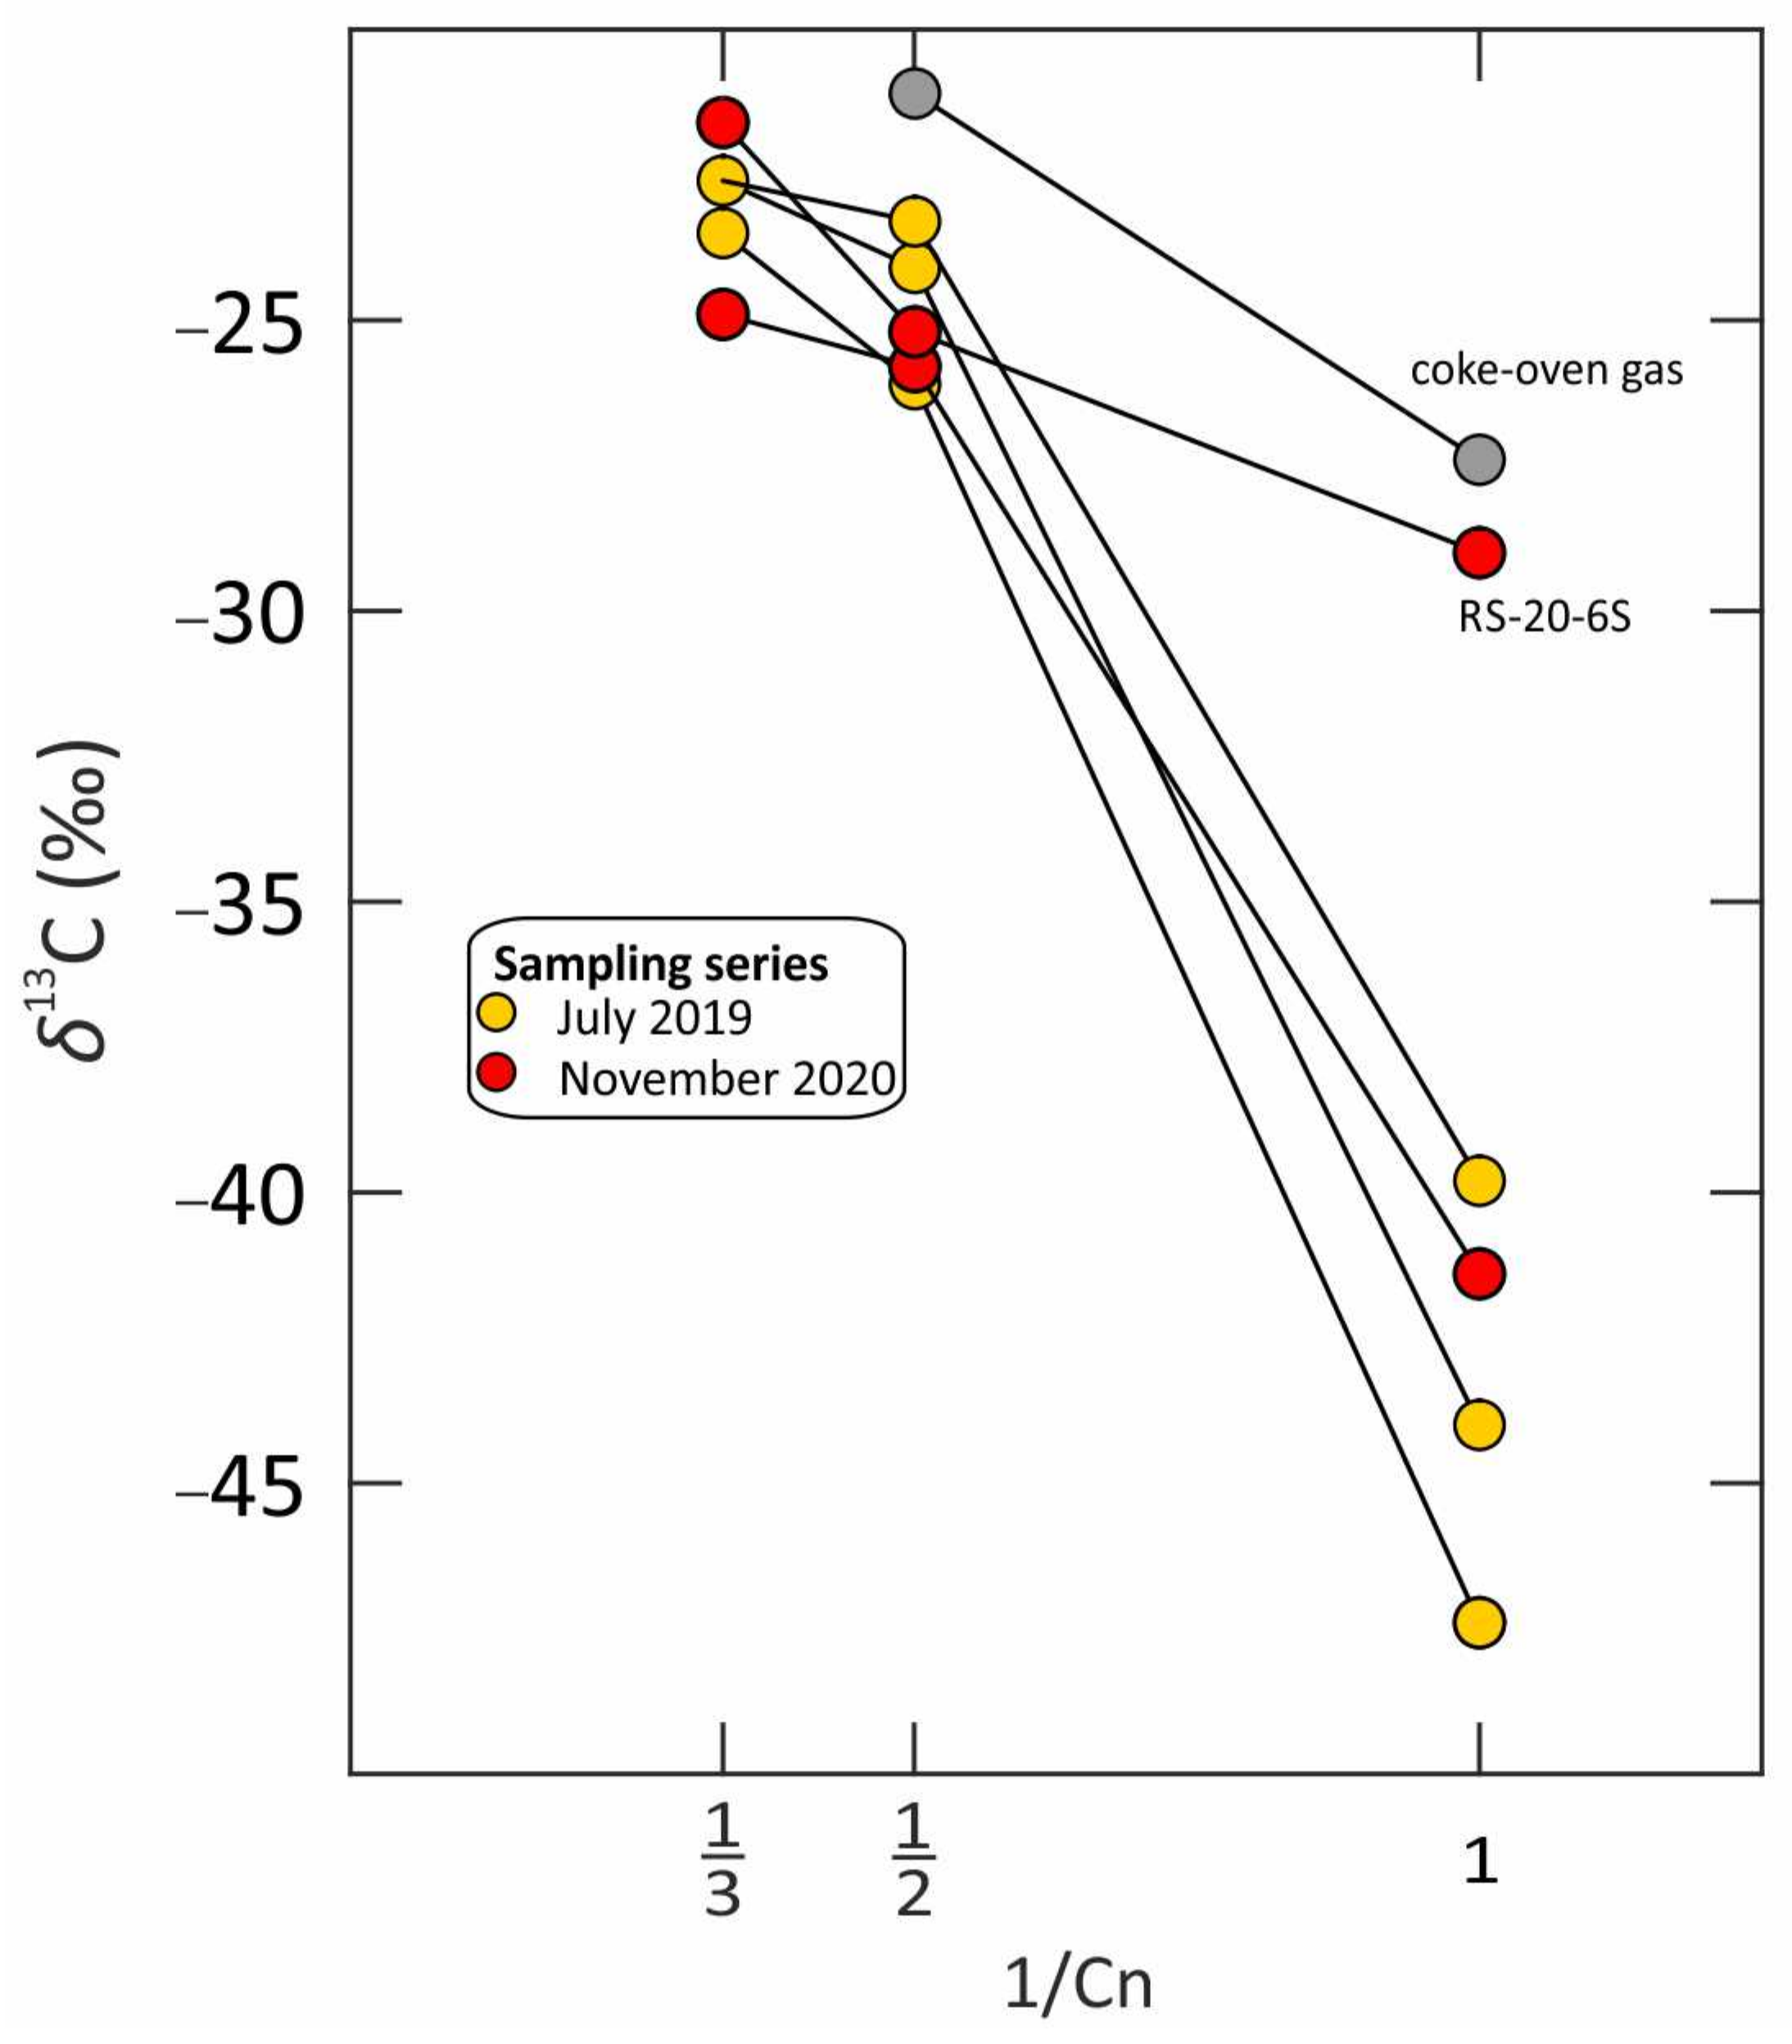
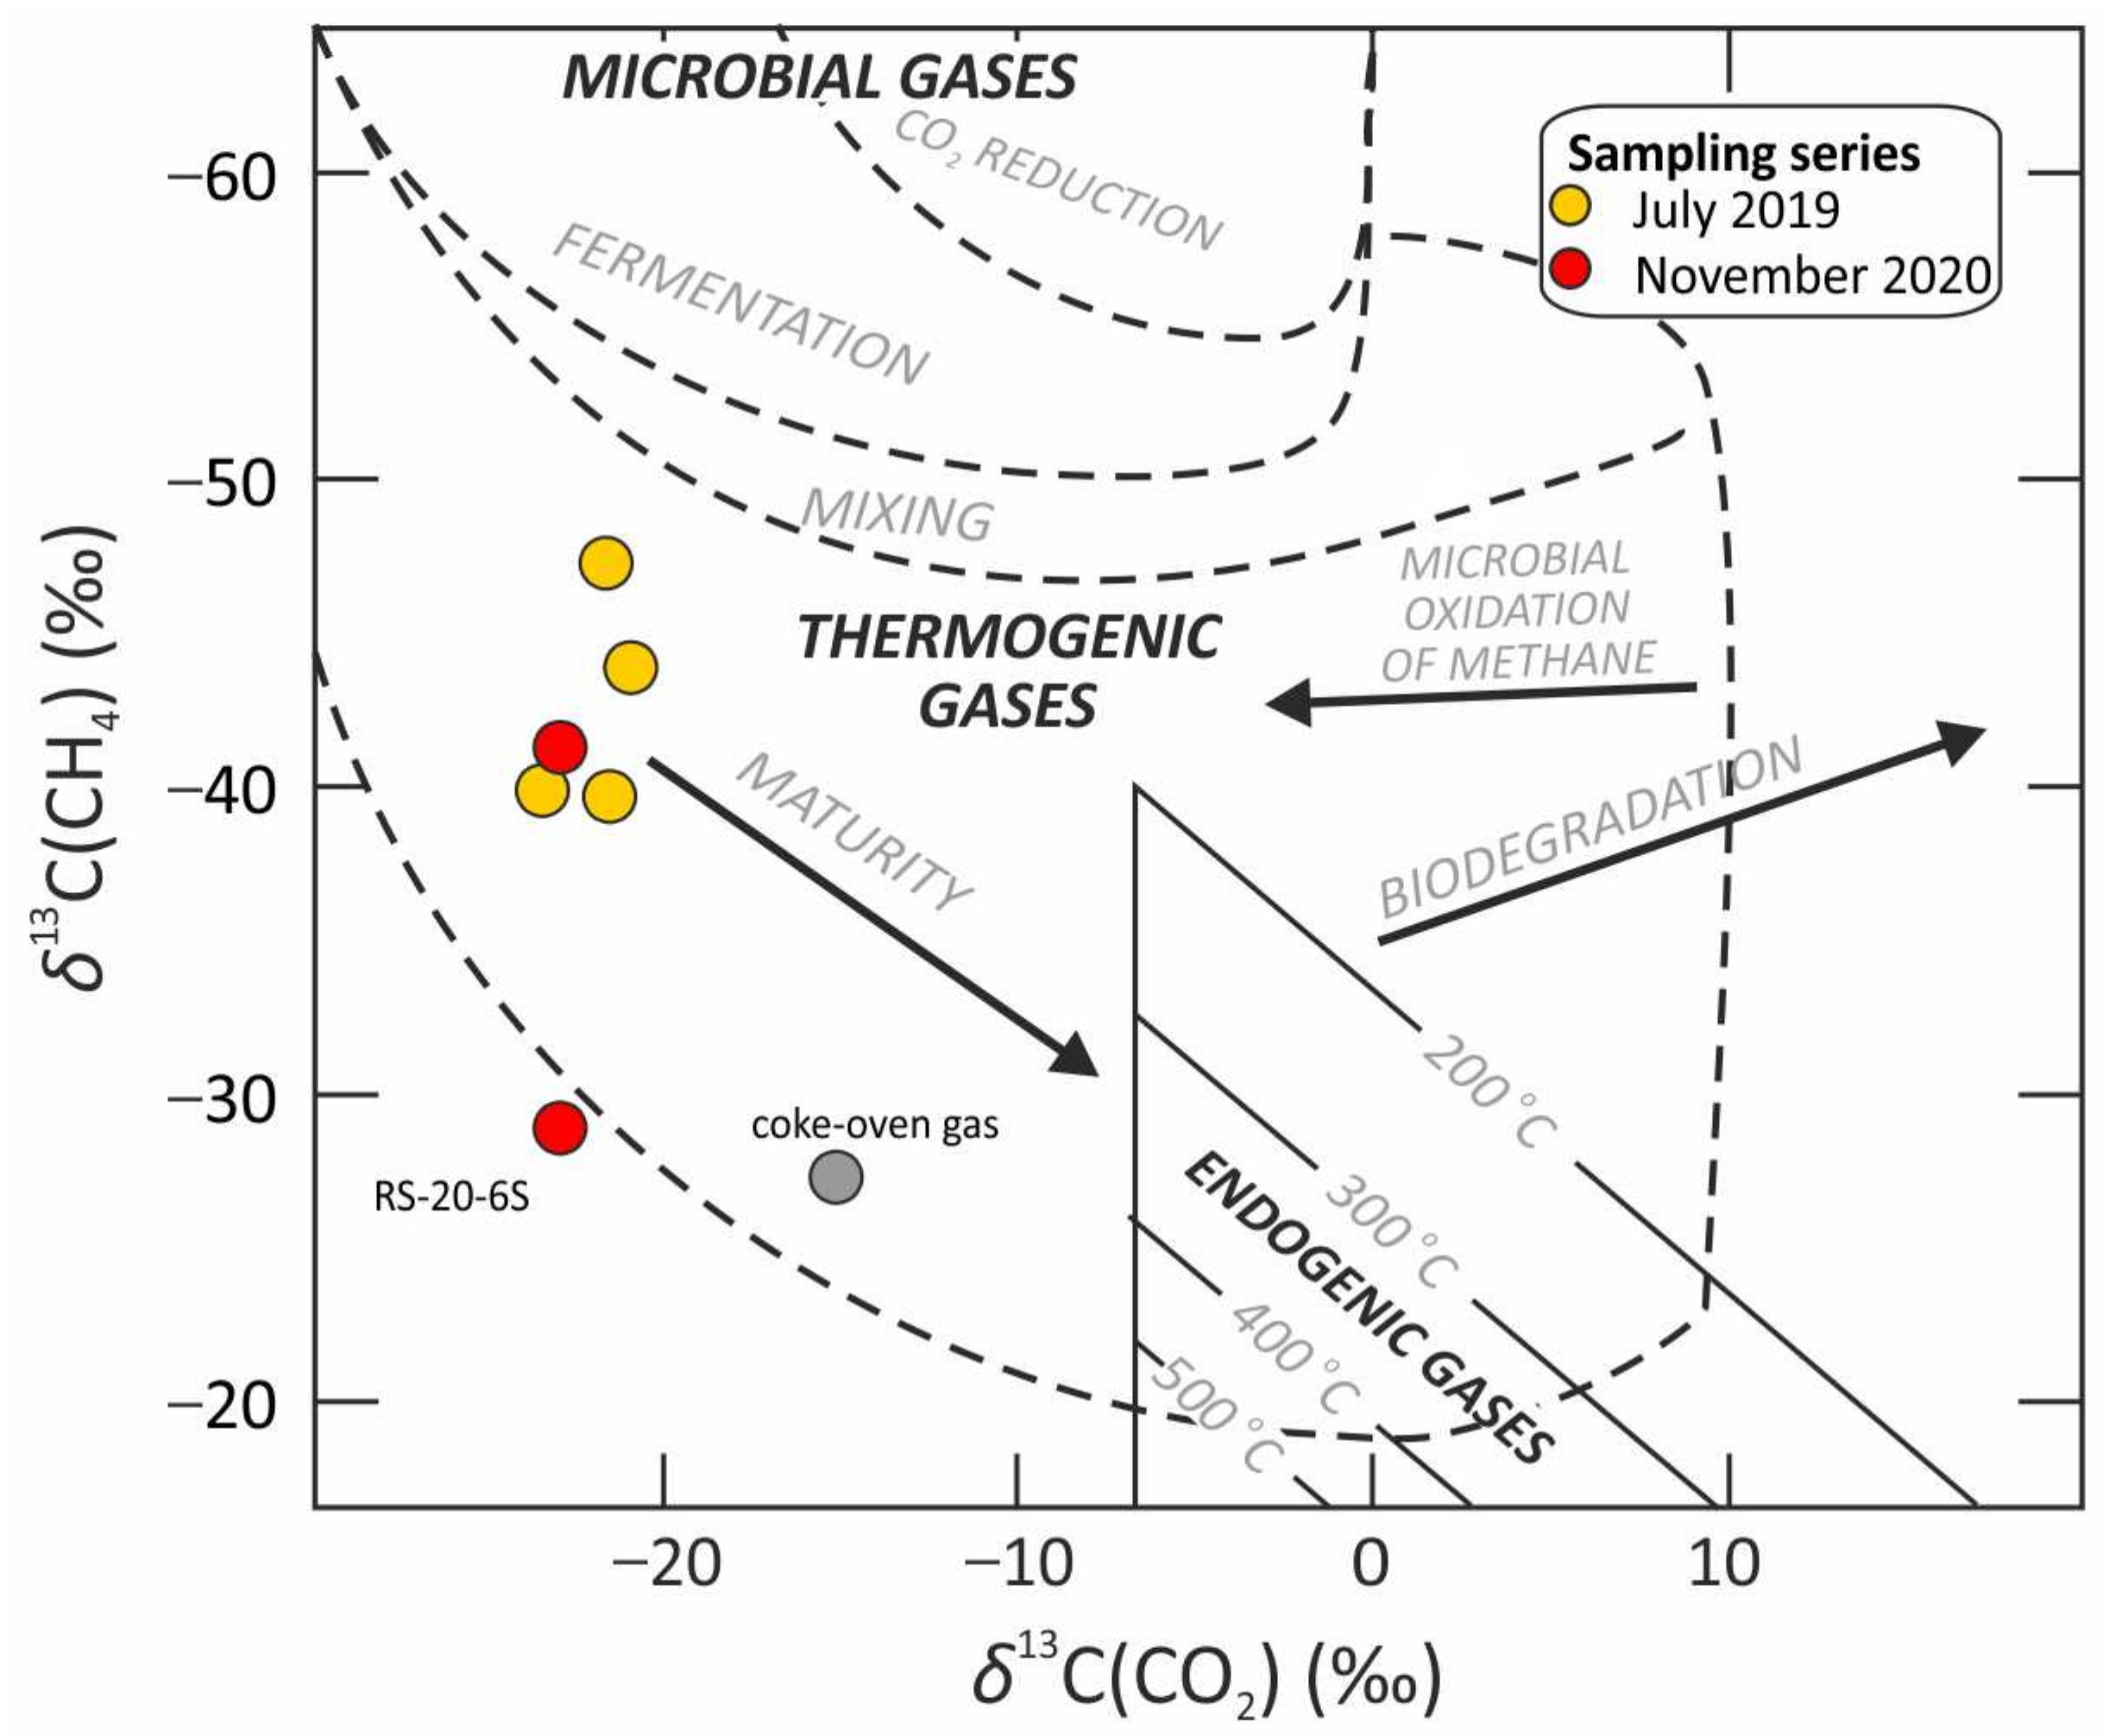
4.2. Origin of Emitted Gases

Generally, hydrocarbon gases emitted at the studied coal waste dump can be divided into two genetic groups: (i) gases generated in situ, in the near-surface zone as a result of thermal or microbial destruction of organic matter dispersed within the rock material deposited at the dump [12,15,28,29]; and (ii) coalbed gases generated in deep subsurface from Mississippian and Pennsylvanian source rocks within the USCB. Previous studies of coalbed gases accumulated in the Pennsylvanian coal-bearing strata of the USCB revealed that they were formed during both thermogenic and microbial processes [30]. Thermogenic, indigenous gases, composed basically of methane, enriched in 13C, were produced during a bituminous stage of coalification [30,31,32,33]. During Mesozoic and Paleogene time, the coal-bearing strata were uplifted and subjected to intensive degassing by diffusion and effusion, during which isotopic fractionation takes place, leading to migration of isotopically lighter methane and forming of the primary accumulation zone, located beneath the degassing zone [30,33,34,35]. Microbial gases produced probably as a result of carbon dioxide reduction during biochemical coalification are accumulated within the secondary accumulation zone, located in topmost Pennsylvanian strata beneath the impermeable Miocene strata [30,35]. USCB coalbed gases contain high volumes of methane and lower amounts of carbon dioxide and higher hydrocarbons, and their emissions associated with coal mining cause a serious environmental problem. After the shutting down high-methane coal mines in the USCB, the growth of average methane concentrations in the near-surface zone has been observed, and the highest anomalies of methane and carbon dioxide recorded in soil gases are assumed to be related to the secondary accumulation zone of coalbed gases [35,36]. Carbon dioxide in coal-bearing strata associated with hydrocarbon gases occurs in insignificant concentrations, and its origin is related to thermogenic processes of coalification and microbial processes [30,33].
Analysed gases are characterised by a relatively high content of carbon dioxide, which concentration slightly increases with methane content (Figure 5A), clearly increases with the decrease of oxygen concentration (Figure 5B), and shows no correlation with the temperature of the sampling point (Figure 5C). Methane occurs in variable concentration in studied samples showing distinct correlation with ethane content (Figure 5D), slightly negative correlation with O2 content (Figure 5E), and revealing no correlation with the temperature of sampling point (Figure 5F).
Analysed hydrocarbon gases are relatively enriched in 13C, which indicates their thermogenic origin (Figure 6A). The location of studied samples on the diagnostic diagram plotting δ13C and δ2H in methane presented in Figure 6B suggests that methane was generated during the early stage of thermogenic processes with the exception of sample RS-20-6S collected from the surface zone showing distinctly higher values of both δ13C and δ2H indicating the higher stage of thermogenic processes (Figure 6B). None of the studied gases could be produced a similar maturation stage as coke-oven gas taken from the neighbouring coke plant in Radlin as specified by their noticeably different δ2H signature.
The increase of ethane concentration with the increase of methane content indicates that these gases are produced together as a result of thermogenic organic matter alteration (Figure 5D). δ13C values of methane, ethane, and propane plotted on the Chung diagram (Figure 7) [38] show dog-leg trends of mostly concave pattern with a pronounced shift of methane toward more negative values, which may suggest an admixture of microbial methane. This trend does not show gas RS-20-6S, which pattern is more similar to coke-oven gas, suggesting its pure thermogenic origin of higher maturation stage. Considerable variation of the isotopic composition of gases RS-20-6S and RS-20-6D collected from the same point but of 1.1 m away in depth is highly puzzling, indicating the existence of different migration paths supplying gas from different sources. Moreover, gas RS-20-6S collected from the surface (gas chimney) does not show microbial isotopic signature as expected. The origin of hydrocarbon gases is related to thermal processes ongoing on the dump leading to pyrolysis of organic material. However, the small contribution of microbial coalbed gases from deeper subsurface is also likely. The negative correlation of CH4 concentration with a temperature of sampling point suggests that this gas is produced within the deeper parts of the dump.
Carbon dioxide is the dominant component of studied gases (except air gas) and shows relatively high negative δ13C values ranging from −24.9 to −21.6 ‰ (Table 3, Figure 8), indicating is origin related mostly to organic matter or generated CH4 oxidation taking place within the dump, which is also confirmed by a clear correlation of CO2 concentration increase with O2 concentration decrease (Figure 5B). Low difference between δ13C of CO2 and CH4 support thermal processes as the main source of these gases with minimal possible bacterial activity. The kinetic effect of fractionation during transport phenomena may complicate the stable isotope signature. The infiltrated water is the most probably medium whose presence led to the oxidation of organic compounds. The negative correlation of CO2 concentration with a temperature of sampling point suggests that methane oxidation takes place in deeper parts of the dump. Also, the migration of at least some portion of CO2 from Pennsylvanian strata cannot be excluded.
Hydrogen sulphide occurs in variable concentrations in studied samples (Table S1), and generally, its content increases with the decrease of oxygen content (Figure 9A) and temperature of sampling point (Figure 9B). The origin of H2S is related to the thermal decomposition of sulphides and sulphur organic compounds present in rocks deposited in the dump and also thiols generated within the dump. Significant amounts of H2S generated from coals and shales from USCB during hydrous pyrolysis experiments [32,42] evidence H2S-generation potential of coal waste rocks. Carbonyl sulphide may be generated as a result of the oxidation of sulphides such as pyrite and marcasite and the reaction of elemental sulphur with carbon monoxide [43]. The concentration of thiols slightly increases with the concentration of H2S (Figure 9C), suggesting that their origin may be related to the presence of H2S. Thiols may be formed as a result of the reaction between H2S and S and hydrocarbons.
Molecular hydrogen in the highest concentration occurs in point RS-20-6, where it reaches values of 0.8 and 0.64 mol % (Table S1). Its presence is related to coal oxidation processes resulting in the breakdown of aldehyde groups or the reaction of burning coal in self-heating areas with moisture (syngas (CO + H2) generation).

4.3. Changes in Pollutants Type Released during the Development of the Self-Heating Process

Sampling along with A-A’ profile (Figure 1) in three series (from May 2019 to November 2020) made it possible to track the development of the self-heating process in this area. There is a visible increase of temperature from NE to SW in all sampling series (Figure 10A). Temperatures recorded in November 2020 in SW part are statistically higher and in NE part lower than in 2019. This may indicate the development of self-heating processes in the SW part of the profile and their partial extinguishing in the NE part. This statement is also supported by recorded increased concentrations of CO in SW part of the profile (Figure 10B) and distribution of hydrocarbons (n-alkanes and unsaturated HC): there is a visible systematic decrease of hydrocarbons concentration to values near zero in the NE part of the profile from May 2019 to November 2020 whereas in gases taken in November in the SW part concentrations of n-alkanes above 0.4 mol % are recorded (Figure 10C,D). The H2S and thiols are the by-products of the self-heating process in oxygen-restricted conditions [15]. Their concentrations are changeable and come to 100 ppm for H2S (Figure 10E) and 7 ppm for thiols (Figure 10F). There is no visible relationship between the location (and temperature) of the sampling site with a concentration of S-compounds. Since these compounds are heavier than air and present in low concentrations, and hydrogen sulphide dissolves well in porous water, their presence in the air present in a coal waste landfill may not be directly related to the current self-heating process.

5. Conclusions

The complex investigation (molecular, pyrolytical and stable isotope) of rocks and gases collected at the Rymer coal waste dump allowed conclusions to be drawn:
(i)
TOC content in coal wastes is high, from 7.3 to 27.2 wt.%, whereas subsurface layers are richer than surface one. For surface samples, higher PI values than for subsurface samples were recorded, identifying deposition on surface tars and bitumen migrated from self-heating spots.
(ii)
Alkanes, BTX, PAHs and aromatic alcohols are the main products of the thermal decomposition of coal wastes, and the main phase of this process occurs at 350–650 °C, indicating that this temperature regime is responsible for the generation of most of the organic pollutants. These components migrate upwards and precipitate on the surface of the dump and were recorded in pyrolysis products of samples collected from landfill surface.
(iii)
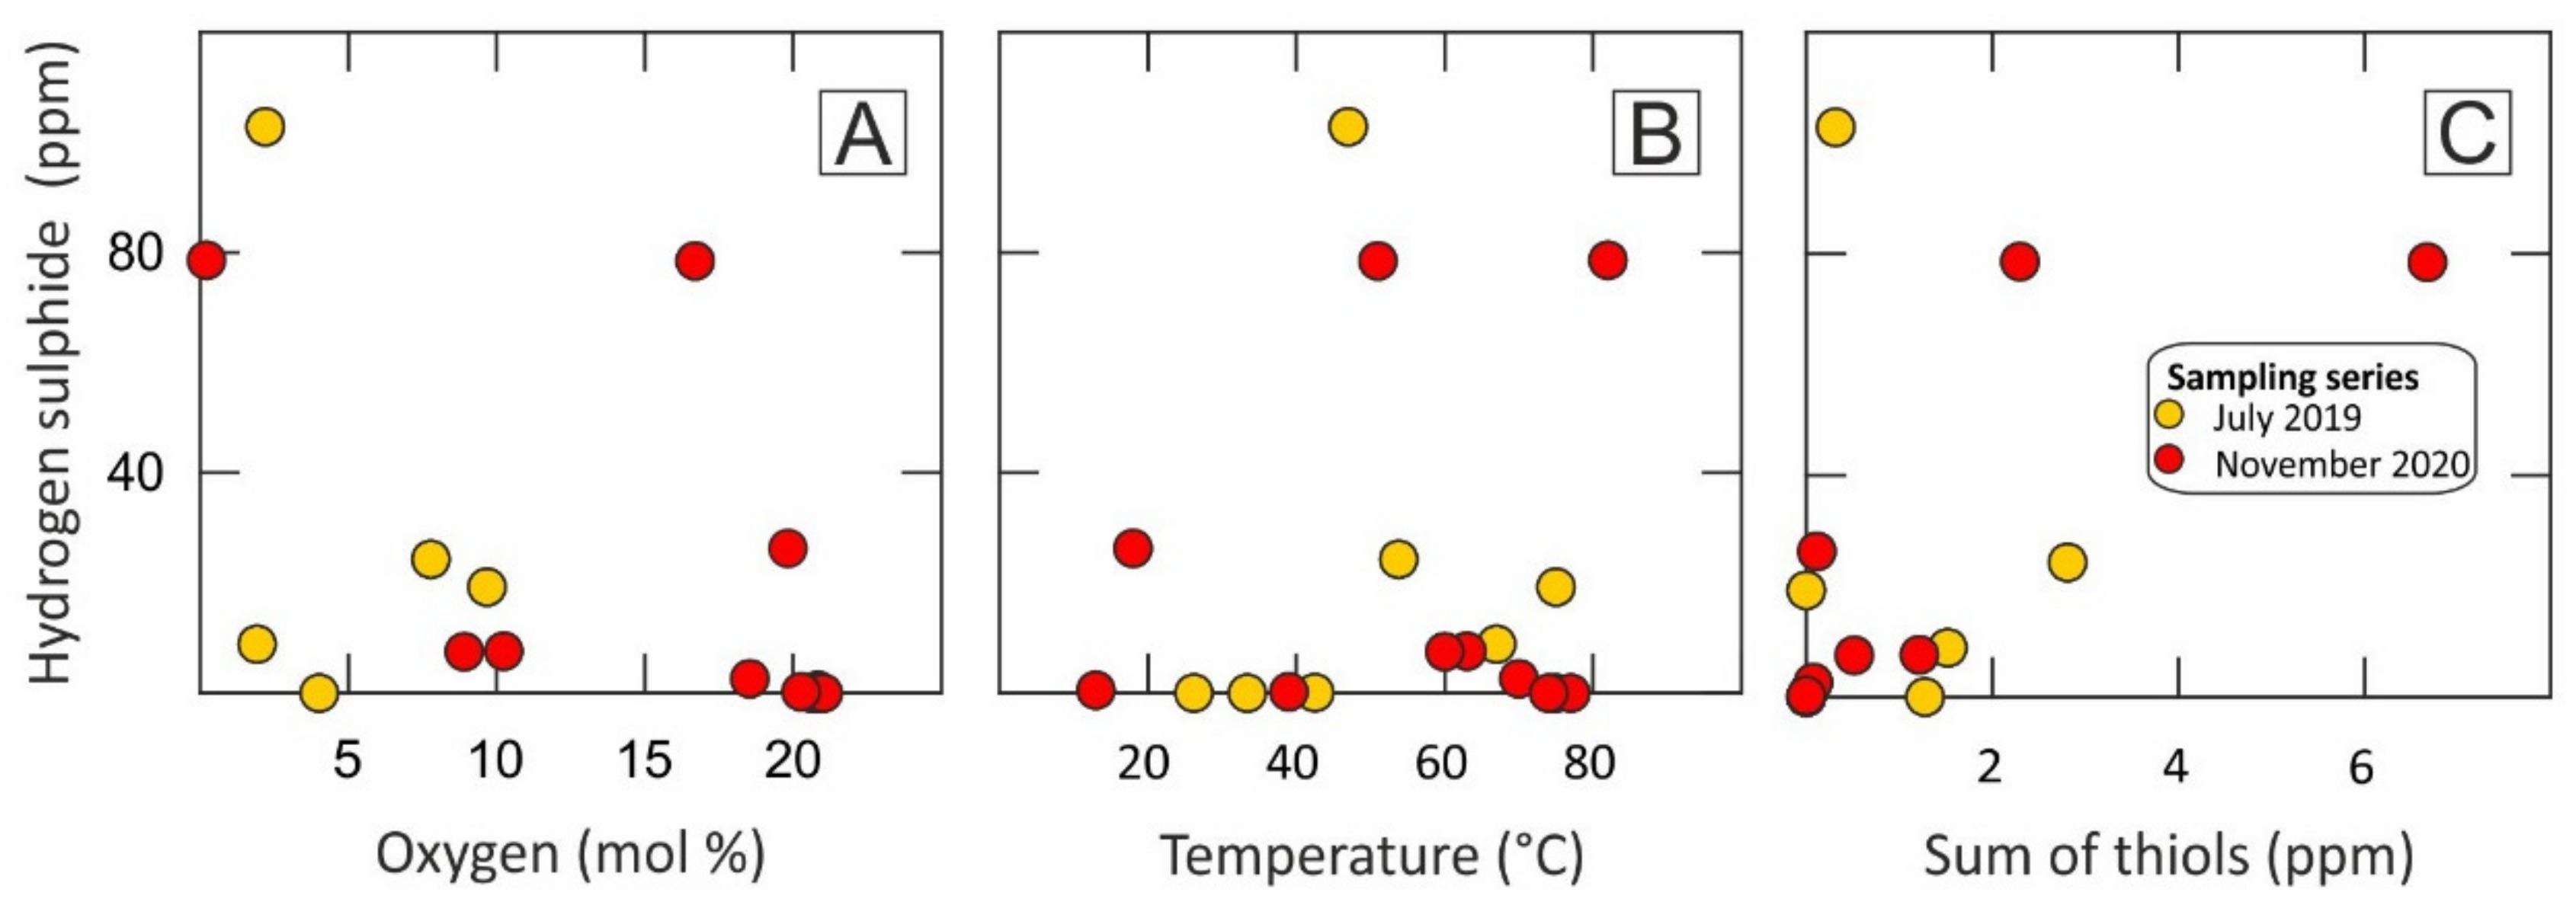
In addition to high-molecular-weight organic compounds, the products of self-heating are CO2, CO, hydrocarbons (mainly CH4) and sulphur compounds (mainly H2S). The stable isotope composition indicates that methane is mainly related to the thermal decomposition of organic matter, but some part of this gas is microbial-originated. CO2 and CO are products of organic matter or generated hydrocarbons oxidation, but a part of CO (and also H2) may originate from the reaction of burning coal with water (moisture), resulting in syngas generation. The S-compounds (H2S, COS and thiols) detected in soil gases are the result of mainly thermal decomposition of sulphides and organic S-compounds present in coal wastes. The BTX’s also occur in soil gases as products of organic matter pyrolysis and burning in oxygen-depleted conditions.
(iv)
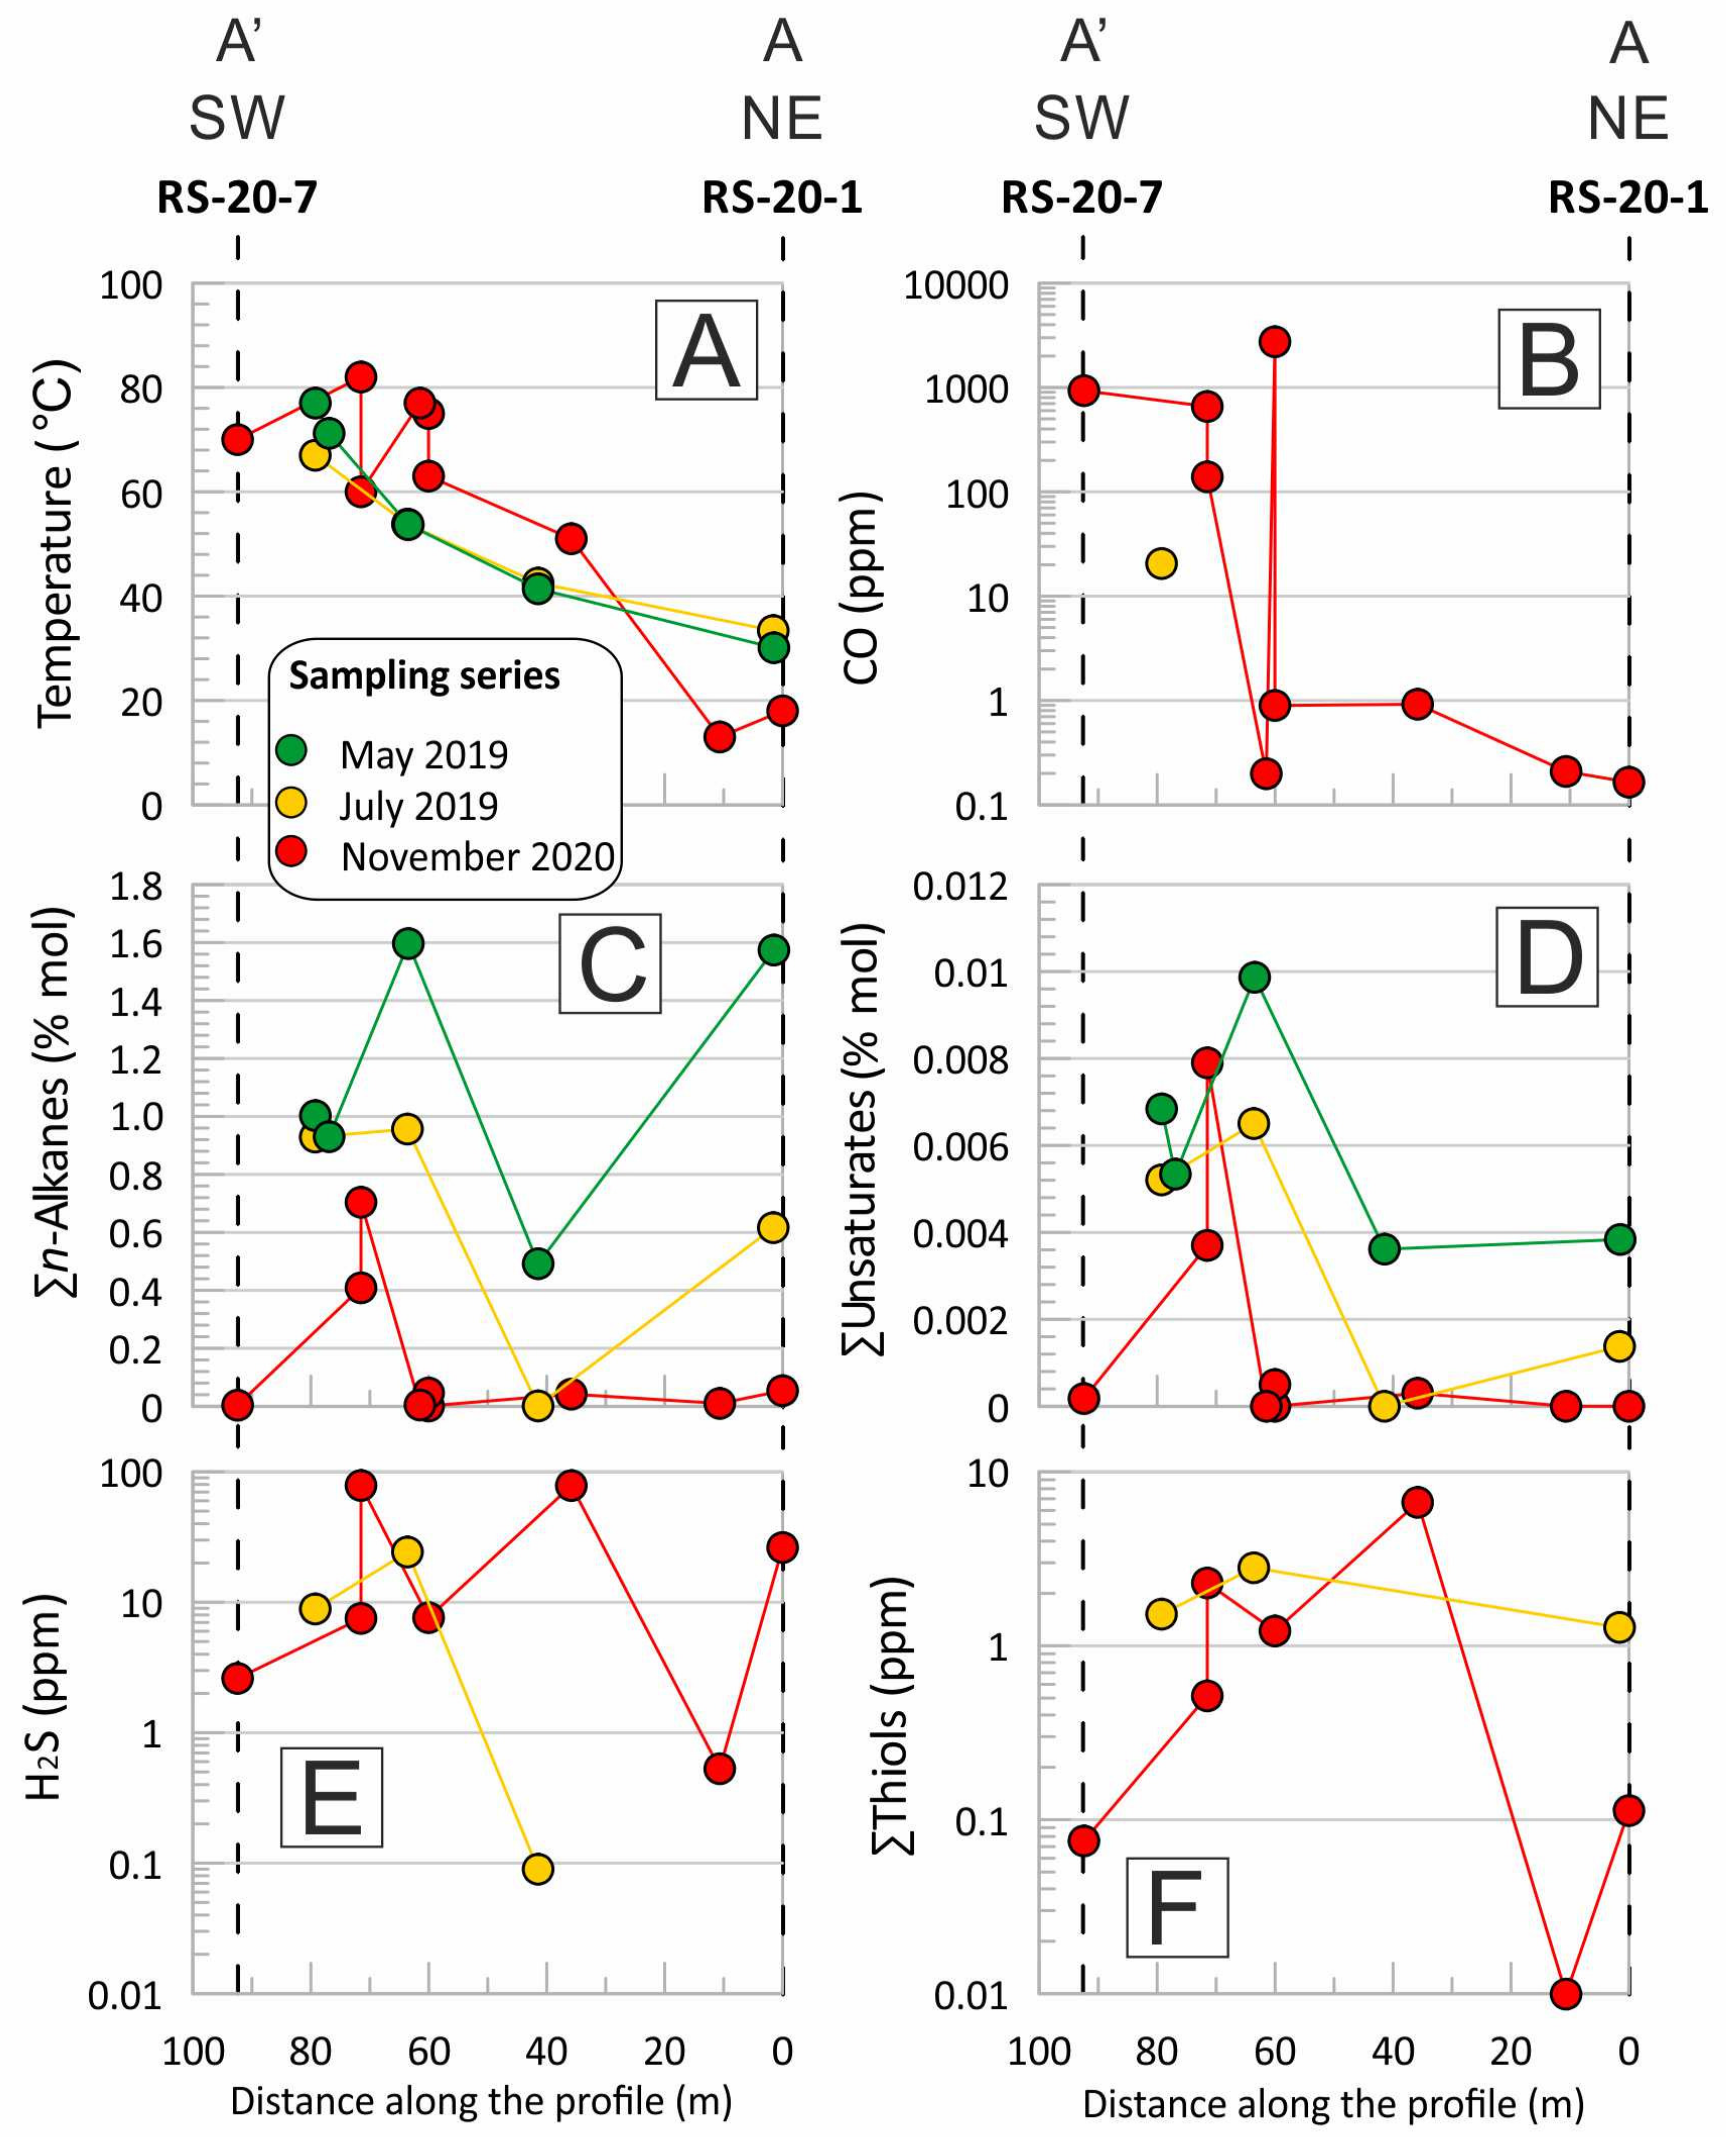
The sampling survey along the delineated profile made it possible to study the variation of waste temperature and gaseous contaminants in soil gases over time. Hydrocarbon and CO contents are good indicators of self-heating processes, while sulphur compounds, due to their low concentrations and susceptibility to dissolution in water and adsorption, are not a good indicator of changes in these processes.

Supplementary Materials

The following are available online at https://www.mdpi.com/article/10.3390/min11101120/s1. Table S1. The molecular composition of gases collected at the Rymer coal waste dump.

Author Contributions

Conceptualization, M.J.F., M.M.-K., J.C. and D.W.; methodology, D.W., M.J.F., A.K. and K.J.; validation, A.K., K.J. and E.B.; formal analysis, D.W., A.K., K.J. and E.B.; investigation, D.W., A.K., K.J., E.B., M.J.F., M.M.-K. and J.C.; resources, M.J.F., M.M.-K., J.C. and D.W.; data curation, K.J.; writing—original draft preparation, D.W., E.B. and K.J.; writing—review and editing, M.J.F., M.M.-K., J.C. and A.K.; visualization, K.J. and E.B.; supervision, D.W.; project administration, M.J.F. and D.W.; funding acquisition, M.J.F. and D.W. All authors have read and agreed to the published version of the manuscript.

Funding

This research was funded by National Science Centre, grant No 2017/27/B/ST10/00680 and by the Faculty of Geology, Geophysics and Environmental Protection at the AGH University of Science and Technology in Cracow, Poland (no. 16.16.140.315).

Acknowledgments

Three anonymous reviewers provided very constructive reviews, which greatly improved the discussion and hypotheses presented in the manuscript. The technical support at collecting samples and conducting analyses by Marlena Zawadzka and Tomasz Kowalski at isotope analyses is kindly acknowledged. The authors thank Piotr Burmistrz from the Faculty of Energy and Fuels, AGH UST, for the help of coke-oven gas sampling.

Conflicts of Interest

The authors declare no conflict of interest. The funders had no role in the design of the study; in the collection, analyses, or interpretation of data; in the writing of the manuscript; or in the decision to publish the results.

References

  1. Skarżyńska, K.M. Reuse of coal mining wastes in civil engineering—Part 1: Properties of minestone. Waste Manag. 1995, 15, 3–42. [Google Scholar] [CrossRef]
  2. Misz-Kennan, M.; Fabiańska, M. Thermal transformation of organic matter in coal waste from Rymer Cones (Upper Silesian Coal Basin, Poland). Int. J. Coal Geol. 2010, 81, 343–358. [Google Scholar] [CrossRef]
  3. Querol, X.; Izquierdo, M.; Monfort, E.; Alvarez, E.; Font, O.; Moreno, T.; Alastuey, A.; Zhuang, X.; Lu, W.; Wang, Y. Environmental characterization of burnt coal gangue banks at Yangquan, Shanxi Province, China. Int. J. Coal Geol. 2008, 75, 93–104. [Google Scholar] [CrossRef]
  4. Ribeiro, J.; da Silva, E.F.; Flores, D. Burning of coal waste piles from Douro Coalfield (Portugal): Petrological, geochemical and mineralogical characterization. Int. J. Coal Geol. 2010, 81, 359–372. [Google Scholar] [CrossRef]
  5. Misz-Kennan, M. Thermal alterations of organic matter in coal wastes from Upper Silesia, Poland. Mineralogia 2010, 41, 105–236. [Google Scholar] [CrossRef]
  6. Skrȩt, U.; Fabiańska, M.J.; Misz-Kennan, M. Simulated water-washing of organic compounds from self-heated coal wastes of the Rymer Cones Dump (Upper Silesia Coal Region, Poland). Org. Geochem. 2010, 41, 1009–1012. [Google Scholar] [CrossRef]
  7. Misz-Kennan, M.; Tabor, A. The Thermal History of Select Coal-Waste Dumps in the Upper Silesian Coal Basin, Poland. In Coal and Peat Fires: A Global Perspective; Stracher, G.B., Sokol, E.V., Prakash, A., Eds.; Elsevier: Amsterdam, The Netherlands, 2015; pp. 431–462. [Google Scholar]
  8. Nádudvari, Á.; Abramowicz, A.; Fabiańska, M.; Misz-Kennan, M.; Ciesielczuk, J. Classification of fires in coal waste dumps based on Landsat, Aster thermal bands and thermal camera in Polish and Ukrainian mining regions. Int. J. Coal Sci. Technol. 2021, 8, 441–456. [Google Scholar] [CrossRef]
  9. Nádudvari, Á.; Ciesielczuk, J. Remote Sensing Techniques for Detecting Self-Heated Hot Spots on Coal Waste Dumps in Upper Silesia, Poland. In Coal and Peat Fires: A Global Perspective; Stracher, G.B., Ed.; Elsevier: Amsterdam, The Netherlands, 2019; pp. 387–406. ISBN 978-0-12-849885-9. [Google Scholar]
  10. Kruszewski, Ł.; Fabiańska, M.J.; Ciesielczuk, J.; Segit, T.; Orłowski, R.; Motyliński, R.; Kusy, D.; Moszumańska, I. First multi-tool exploration of a gas-condensate-pyrolysate system from the environment of burning coal mine heaps: An in situ FTIR and laboratory GC and PXRD study based on Upper Silesian materials. Sci. Total Environ. 2018, 640–641, 1044–1071. [Google Scholar] [CrossRef]
  11. Kruszewski, Ł.; Fabiańska, M.J.; Segit, T.; Kusy, D.; Motyliński, R.; Ciesielczuk, J.; Deput, E. Carbon-nitrogen compounds, alcohols, mercaptans, monoterpenes, acetates, aldehydes, ketones, SF6, PH3, and other fire gases in coal-mining waste heaps of Upper Silesian Coal Basin (Poland)—A re-investigation by means of in situ FTIR external database ap. Sci. Total Environ. 2020, 698, 134274. [Google Scholar] [CrossRef]
  12. Fabiańska, M.; Ciesielczuk, J.; Nádudvari, Á.; Misz-Kennan, M.; Kowalski, A.; Kruszewski, Ł. Environmental influence of gaseous emissions from self-heating coal waste dumps in Silesia, Poland. Environ. Geochem. Health 2019, 41, 575–601. [Google Scholar] [CrossRef] [Green Version]
  13. Więcław, D.; Jurek, K.J.; Kowalski, A.; Fabiańska, M.J.; Ciesielczuk, J.; Misz-Kennan, M.; Nádudvari, Á. Dependence of the molecular composition of the gas emitted during self-ignition processes on the temperature in the coal waste dump: Example from Upper Silesia, Poland. In Proceedings of the Energy, Fuels, Environment Conference, Kraków, Poland, 16–18 September 2020. [Google Scholar]
  14. Fabiańska, M.J.; Nádudvari, Á.; Ciesielczuk, J.; Szram, E.; Misz-Kennan, M.; Więcław, D. Organic contaminants of coal-waste dump water in the Lower- and Upper Silesian Coal Basins (Poland). Appl. Geochem. 2020, 122, 104690. [Google Scholar] [CrossRef]
  15. Nádudvari, Á.; Fabiańska, M.J.; Misz-Kennan, M.; Ciesielczuk, J.; Kowalski, A. Investigation of organic material self-heating in oxygen-depleted condition within a coal-waste dump in Upper Silesia Coal Basin, Poland. Environ. Sci. Pollut. Res. 2020, 27, 8285–8307. [Google Scholar] [CrossRef]
  16. Waliczek, M.; Machowski, G.; Więcław, D.; Konon, A.; Wandycz, P. Properties of solid bitumen and other organic matter from Oligocene shales of the Fore-Magura Unit in Polish Outer Carpathians: Microscopic and geochemical approach. Int. J. Coal Geol. 2019, 210, 103206. [Google Scholar] [CrossRef]
  17. Zielińska, M.; Fabiańska, M.J.; Więcław, D.; Misz-Kennan, M. Comparative petrography and organic geochemistry of different types of organic matter occurring in the Outer Carpathians rocks. Geol. Q. 2020, 64, 165–184. [Google Scholar] [CrossRef] [Green Version]
  18. Lafargue, E.; Marquis, F.; Pillot, D. Rock-Eval 6 applications in hydrocarbon exploration, production, and soil contamination studies. Rev. Inst. Fr. Pet. 1998, 53, 421–437. [Google Scholar] [CrossRef] [Green Version]
  19. Behar, F.; Beaumont, V.; De B. Penteado, H.L. Rock-Eval 6 Technology: Performances and Developments. Oil Gas Sci. Technol. 2001, 56, 111–134. [Google Scholar] [CrossRef]
  20. Dahl, B.; Bojesen-Koefoed, J.; Holm, A.; Justwan, H.; Rasmussen, E.; Thomsen, E. A new approach to interpreting Rock-Eval S2 and TOC data for kerogen quality assessment. Org. Geochem. 2004, 35, 1461–1477. [Google Scholar] [CrossRef]
  21. Więcław, D. Habitat and hydrocarbon potential of the Kimmeridgian strata in the central part of the Polish Lowlands. Geol. Q. 2016, 60, 192–210. [Google Scholar] [CrossRef] [Green Version]
  22. Kotarba, M.J.; Więcław, D.; Bilkiewicz, E.; Dziadzio, P.; Kowalski, A. Genetic correlation of source rocks and natural gas in the Polish Outer Carpathians and Paleozoic-Mesozoic basement east of Kraków (Southern Poland). Geol. Q. 2017, 61, 795–824. [Google Scholar] [CrossRef] [Green Version]
  23. Baudin, F.; Disnar, J.-R.; Aboussou, A.; Savignac, F. Guidelines for Rock–Eval analysis of recent marine sediments. Org. Geochem. 2015, 86, 71–80. [Google Scholar] [CrossRef] [Green Version]
  24. Carrie, J.; Sanei, H.; Stern, G. Standardisation of Rock–Eval pyrolysis for the analysis of recent sediments and soils. Org. Geochem. 2012, 46, 38–53. [Google Scholar] [CrossRef]
  25. Hetényi, M.; Nyilas, T. Soil Organic Matter Characterization Using S3 and S4 Signals from Rock-Eval Pyrolysis. Pedosphere 2014, 24, 563–574. [Google Scholar] [CrossRef]
  26. Więcław, D.; Sadlik, M. Evaluation of ground pollution by hydrocarbons using Rock-Eval pyrolysis. Pol. J. Chem. Technol. 2019, 21, 8–12. [Google Scholar] [CrossRef] [Green Version]
  27. Peters, K.E.; Cassa, M.R. Applied Source-Rock Geochemistry. In The Petroleum System. From Source to Trap, AAPG Memoir; Magoon, L.B., Dow, W.G., Eds.; AAPG: Tulsa, OK, USA, 1994; pp. 93–120. [Google Scholar]
  28. Pone, J.D.N.; Hein, K.A.A.; Stracher, G.B.; Annegarn, H.J.; Finkleman, R.B.; Blake, D.R.; McCormack, J.K.; Schroeder, P. The spontaneous combustion of coal and its by-products in the Witbank and Sasolburg coalfields of South Africa. Int. J. Coal Geol. 2007, 72, 124–140. [Google Scholar] [CrossRef]
  29. Kruszewski, Ł. Burning Coal-Mining Heaps as an Organochemical Laboratory: Interesting Trace Compounds and their Potential Sources. In Organic Compounds; Open Access eBooks: Las Vegas, NV, USA, 2021; p. 38. ISBN 978-93-87500-41-9. [Google Scholar]
  30. Kotarba, M.J. Composition and origin of coalbed gases in the Upper Silesian and Lublin basins, Poland. Org. Geochem. 2001, 32, 163–180. [Google Scholar] [CrossRef]
  31. Kotarba, M.J.; Lewan, M.D. Characterizing thermogenic coalbed gas from Polish coals of different ranks by hydrous pyrolysis. Org. Geochem. 2004, 35, 615–646. [Google Scholar] [CrossRef]
  32. Lewan, M.D.; Kotarba, M.J. Thermal-maturity limit for primary thermogenic-gas generation from humic coals as determined by hydrous pyrolysis. Am. Assoc. Pet. Geol. Bull. 2014, 98, 2581–2610. [Google Scholar] [CrossRef]
  33. Kotarba, M.J.; Pluta, I. Origin of natural waters and gases within the Upper Carboniferous coal-bearing and autochthonous Miocene strata in South-Western part of the Upper Silesian Coal Basin, Poland. Appl. Geochem. 2009, 24, 876–889. [Google Scholar] [CrossRef]
  34. Kędzior, S.; Kotarba, M.J.; Pękała, Z. Geology, spatial distribution of methane content and origin of coalbed gases in Upper Carboniferous (Upper Mississippian and Pennsylvanian) strata in the south-eastern part of the Upper Silesian Coal Basin, Poland. Int. J. Coal Geol. 2013, 105, 24–35. [Google Scholar] [CrossRef]
  35. Sechman, H.; Kotarba, M.J.; Kędzior, S.; Dzieniewicz, M.; Romanowski, T.; Twaróg, A. Distribution of methane and carbon dioxide concentrations in the near-surface zone, genetic implications, and evaluation of gas flux around abandoned shafts in the Jastrzębie-Pszczyna area (southern part of the Upper Silesian Coal Basin, Poland). Int. J. Coal Geol. 2019, 204, 51–69. [Google Scholar] [CrossRef]
  36. Sechman, H.; Kotarba, M.J.; Kędzior, S.; Kochman, A.; Twaróg, A. Fluctuations in methane and carbon dioxide concentrations in the near-surface zone and their genetic characterization in abandoned and active coal mines in the SW part of the Upper Silesian Coal Basin, Poland. Int. J. Coal Geol. 2020, 227, 103529. [Google Scholar] [CrossRef]
  37. Milkov, A.V.; Etiope, G. Revised genetic diagrams for natural gases based on a global dataset of >20,000 samples. Org. Geochem. 2018, 125, 109–120. [Google Scholar] [CrossRef]
  38. Chung, H.M.; Gormly, J.R.; Squires, R.M. Origin of gaseous hydrocarbons in subsurface environments: Theoretical considerations of carbon isotope distribution. Chem. Geol. 1988, 71, 97–104. [Google Scholar] [CrossRef]
  39. Gustalo, L.K.; Plotnikov, A.M. Carbon isotopic composition in the CH4-CO2 system as a criterion for the origin of methane and carbon dioxide in Earth natural gases. Dokl. Akad. Nauk SSSR 1981, 259, 470–473. (In Russian) [Google Scholar]
  40. Milkov, A.V. Worldwide distribution and significance of secondary microbial methane formed during petroleum biodegradation in conventional reservoirs. Org. Geochem. 2011, 42, 184–207. [Google Scholar] [CrossRef]
  41. Kotarba, M.J. Geochemical criteria for the origin of natural gases accumulated in the Upper Carboniferous coal-seam-bearing formation in Wałbrzych coal basin. Geology 1988, 42, 1–119, (In Polish with English Abstract). [Google Scholar]
  42. Kotarba, M.J.; Bilkiewicz, E.; Jurek, K.J.; Waliczek, M.; Więcław, D.; Zych, H. Thermogenic gases generated from coals and carbonaceous shales of the Upper Silesian and Lublin Coal Basins: Hydrous pyrolysis approach. Geol. Q. 2021, 65, 26–65. [Google Scholar] [CrossRef]
  43. Fabiańska, M.J.; Ciesielczuk, J.; Kruszewski, Ł.; Misz-Kennan, M.; Blake, D.R.; Stracher, G.; Moszumańska, I. Gaseous compounds and efflorescences generated in self-heating coal-waste dumps—A case study from the Upper and Lower Silesian Coal Basins (Poland). Int. J. Coal Geol. 2013, 116–117, 247–261. [Google Scholar] [CrossRef]
Figure 1. Location of gas and rock sampling sites on the background of the altimetry map of the Rymer coal waste dump. Poland CS92: The National Geodetic Coordinate System 1992 for Poland (EPSG:2180).
Minerals 11 01120 g001
Figure 2. Thermally active areas on Rymer coal waste dump on 26 November 2020: (a) RS-20-4, RS-20-5 and RS-20-6 sampling sites at SE slope; (b) gas collection followed by temperature measurement in RS-20-8 sampling site at SW slope of the dump, which is located next to the housing estate of Rybnik town.
Minerals 11 01120 g002
Figure 3. The total ion chromatograms (TIC) of pyrolysates of the RS-19-7 sample. Rel., relative; Temp., temperature.
Minerals 11 01120 g003
Figure 4. The total ion chromatograms (TIC) of pyrolysates of the RS-19-10 sample.Rel., relative; Temp., temperature.
Minerals 11 01120 g004
Figure 5. The concentration of carbon dioxide versus (A) methane and (B) oxygen concentrations and (C) temperature at the point of sampling and concentration of methane versus (D) ethane and (E) oxygen concentrations and (F) temperature at the point of sampling of analysed gases.
Minerals 11 01120 g005
Figure 6. Stable carbon isotope composition of methane versus (A) hydrocarbon index (CHC) and (B) stable hydrogen isotope composition of methane of analysed gases. Modified genetic fields and arrows directions of maturity and secondary processes after Milkov and Etiope [37]. CR, microbial CO2 reduction; F, methyl-type fermentation; SM, secondary microbial; EMT, early mature thermogenic gas; OA, oil-associated thermogenic gas; LMT, late mature thermogenic gas; BIOD, biodegradation.
Minerals 11 01120 g006
Figure 7. δ13C values of CH4, C2H6 and C3H8 versus the reciprocal of their carbon number (Cn) for studied gases. Order of δ13C values for CH4, C2H6 and C3H8 after Chung et al. [38].
Minerals 11 01120 g007
Figure 8. Genetic identification of analysed gases using δ13C(CH4) versus δ13C(CO2). Genetic fields modified after Gutsalo and Plotnikov [39], Milkov [40] and Kotarba [41].
Minerals 11 01120 g008
Figure 9. Hydrogen sulphide concentration versus (A) oxygen concentration, (B) temperature at the point of sampling and (C) sum of thiols (methanethiol + ethanethiol + propanethiol).
Minerals 11 01120 g009
Figure 10. Changes of (A) temperature, and concentrations of (B) carbon oxide, (C) sum of n-alkanes, (D) sum of unsaturated hydrocarbons, (E) hydrogen sulphide and (F) sum of thiols of gases emitted from thermally active areas in the Rymer coal waste dump in the period from May 2019 to November 2020.
Minerals 11 01120 g010
Table 1. General data on gas and rock sampling sites.
Sample CodeLatitude (N)Longitude (E)Temperature Measurement Depth (m)Temperature at Depth (°C)Gas Sample Depth (m)Rock Sample Depth (m)Sampling Date
RS-19-150.05537918.4936590.20770.80surface21 May 2019
RS-19-250.05535518.4937130.20710.45surface21 May 2019
RS-19-350.05543318.4938690.20541.00surface21 May 2019
RS-19-450.05561218.4940450.20410.90surface21 May 2019
RS-19-550.05582918.4945040.20300.70surface21 May 2019
RS-19-650.05673718.4949600.20610.70surface21 May 2019
RS-19-750.05679018.4951110.20600.60surface21 May 2019
RS-19-850.05688818.4949730.17390.90n.s.21 May 2019
RS-19-950.05524318.4939720.15241.000.1523 July 2019
RS-19-1050.05505418.4937670.15260.500.1523 July 2019
RS-19-1150.05605518.4927170.15470.500.1523 July 2019
RS-19-1250.05537918.4936590.15670.600.1523 July 2019
RS-19-1350.05543318.4938690.15540.800.1523 July 2019
RS-19-1450.05561218.4940450.15430.600.1523 July 2019
RS-19-1550.05582918.4945040.15330.900.1523 July 2019
RS-19-1650.05673718.4949600.15750.90n.s.23 July 2019
RS-20-150.05581118.4944540.50180.50n.s.26 November 2020
RS-20-250.05577218.4943860.50130.30n.s.26 November 2020
RS-20-350.05562818.4941220.70510.70n.s.26 November 2020
RS-20-4D50.05549218.4938580.50750.50n.s.26 November 2020
RS-20-4S50.05549218.493858surface63surfacen.s.26 November 2020
RS-20-550.05547218.4938611.00771.00n.s.26 November 2020
RS-20-6D50.05541718.4937500.70821.10n.s.26 November 2020
RS-20-6S50.05541718.493750surface60surfacen.s.26 November 2020
RS-20-750.05540018.4934120.50700.45n.s.26 November 2020
RS-20-850.05606218.4928041.00740.65n.s.26 November 2020
RS-20-950.05598018.4924691.00390.80n.s.26 November 2020
n.s.—not sampled.
Table 2. Geochemical indices of gases collected from Rymer waste dump.
Sample CodeCHCC1/C2+CO × 100/CO2CO/Σ(C1–C7)H2 × 100/CO2ΣS-Comp. (ppm)ΣPAH (ppm)CDMICDHI
RS-19-117.214.4n.a.n.a.0.19n.a.n.a.94.894.5
RS-19-214.912.2n.a.n.a.0.21n.a.n.a.95.194.7
RS-19-316.113.6n.a.n.a.0.24n.a.n.a.91.891.3
RS-19-413.210.9n.a.n.a.0.03n.a.n.a.97.497.1
RS-19-517.715.7n.a.n.a.0.01n.a.n.a.92.091.6
RS-19-66.12.2n.a.n.a.0.27n.a.n.a.99.999.9
RS-19-715.16.8n.a.n.a.0.59n.a.n.a.98.798.5
RS-19-823.27.5n.a.n.a.0.02n.a.n.a.99.999.9
RS-19-96.01.5n.a.n.a.0.00n.a.n.a.99.599.3
RS-19-101.40.20.000.000.000.02n.a.100.099.7
RS-19-115.53.00.060.430.41107.04n.a.99.999.8
RS-19-1215.212.50.010.0020.1111.05n.a.94.794.2
RS-19-1312.710.5n.a.n.a.0.0627.10n.a.92.291.5
RS-19-141.30.6n.a.n.a.0.000.09n.a.99.598.8
RS-19-1513.610.80.000.000.001.27n.a.95.995.6
RS-19-168.45.53.1912.237.5719.67n.a.99.899.7
RS-20-110.56.3<0.01<0.0010.0426.380.4696.195.5
RS-20-215.47.0<0.01<0.0010.000.670.2697.396.9
RS-20-330.818.2<0.01<0.0010.0985.116.2399.099.0
RS-20-4D8.20.9<0.01<0.0010.230.080.4799.398.6
RS-20-4S22.915.02.795.890.8212.2313.3899.699.5
RS-20-51.70.6<0.01<0.0010.440.090.2797.092.4
RS-20-6D15.110.60.070.024.0982.77124.0096.896.5
RS-20-6S12.39.10.580.165.778.34104.9596.896.4
RS-20-74.81.03.7721.540.573.663.0499.999.8
RS-20-813.11.82.902.211.150.170.5599.298.7
RS-20-912.05.20.100.141.580.440.7899.499.3
CHC = CH4/(C2H6+C3H8); C1/C2+ = CH4/Σ(C2–C7); CDMI = (CO2/[CO2+CH4]) 100 (%); CDHI = (CO2/[CO2 + Σ(C1–C7)]) 100 (%); comp., compounds; n.a., not analyzed.
Table 3. Stable isotope composition and indices (‰) of gases collected from Rymer waste dump.
Sample Codeδ13Cδ2Hδ13Cδ13Cδ13CΔ13C (C2−C1)Δ13C (C3−C2)Δ13C (CH4−CO2)
(CH4)(CH4)(C2H6)(C3H8)(CO2)
RS-19-9n.a.n.a.n.a.n.a.−19.2n.a.n.a.n.a.
RS-19-10n.a.n.a.n.a.n.a.−20.7n.a.n.a.n.a.
RS-19-11n.a.n.a.n.a.n.a.−22.3n.a.n.a.n.a.
RS-19-12−47.4n.a.−26.1−23.5−21.721.32.6−25.7
RS-19-13−44.0−245−24.1−22.6−21.019.91.5−23.0
RS-19-14−n.a.n.a.n.a.n.a.−28.4n.a.n.a.n.a.
RS-19-15−39.8−242−23.3−22.6−21.616.50.7−18.2
RS-19-16−40.0n.a.n.a.n.a.−23.5n.a.n.a.−16.5
RS-20-6D−41.4−246−25.8−24.9−23.015.60.9−18.4
RS-20-6S−29.0−223−25.2−21.6−23.03.83.6−6.0
coke-oven gas−27.4−159−21.1n.a.−15.26.3n.a.−12.2
n.a., not analysed.
Table 4. Results of the Rock-Eval analysis (‘Bulk Rock’ method).
SampleSamplingDepthTOCTmaxS1S2PIHIOIMINC
Serie(m)(wt.%)(oC) (wt.%)
RS-19-1May 2019surface16.84361.8915.30.119180.69
RS-19-2May 2019surface9.84326.68.20.4584250.57
RS-19-3May 2019surface15.943623.89.90.7163150.96
RS-19-4May 2019surface10.143613.15.70.705640.55
RS-19-5May 2019surface8.74360.696.90.0980250.92
RS-19-6May 2019surface22.232699.111.00.9049732.76
RS-19-7May 2019surface11.431095.90.560.995443.87
RS-19-9July 20190.157.34340.076.40.01871321.31
RS-19-10July 20190.1524.24300.6823.10.0395842.34
RS-19-11July 20190.1523.242746.532.50.59140212.35
RS-19-12July 20190.1525.64305.131.60.14123312.13
RS-19-13July 20190.1528.643121.633.70.39118232.60
RS-19-14July 20190.1510.34302.89.60.2293591.28
RS-19-15July 20190.1527.24273.029.70.09109912.79
TOC, total organic carbon; Tmax, temperature of a maximum of the S2 peak; S1, free hydrocarbons (mg HC/g rock); S2, residual hydrocarbons (mg HC/g rock); PI, production index; HI, hydrogen index (mg HC/g TOC); OI, oxygen index (mg CO2/g TOC); MINC, mineral carbon.
Table 5. Results of Rock-Eval pyrolysis (‘Multi Heating Rates’ method).
FractionQ0Q1Q2Q3Q4Q5QT
Temperature Interval (°C)<100100–180180–250250–350350–450450–650
RS-19-61.079.040.610.77.12.0140.4
RS-19-72.8111.735.80.70.10.2151.3
RS-19-100.010.030.050.245.66.112.0
Q0, Q1, Q2, Q3, Q4, Q5, quantity of hydrocarbons released during given temperature interval; QT, total quantity of hydrocarbons; all values in mg/g rock.
Publisher’s Note: MDPI stays neutral with regard to jurisdictional claims in published maps and institutional affiliations.

