
An Intelligent Rockburst Prediction Model Based on Scorecard Methodology


 ,
,  and
and 
Abstract
:1. Introduction
2. Methods
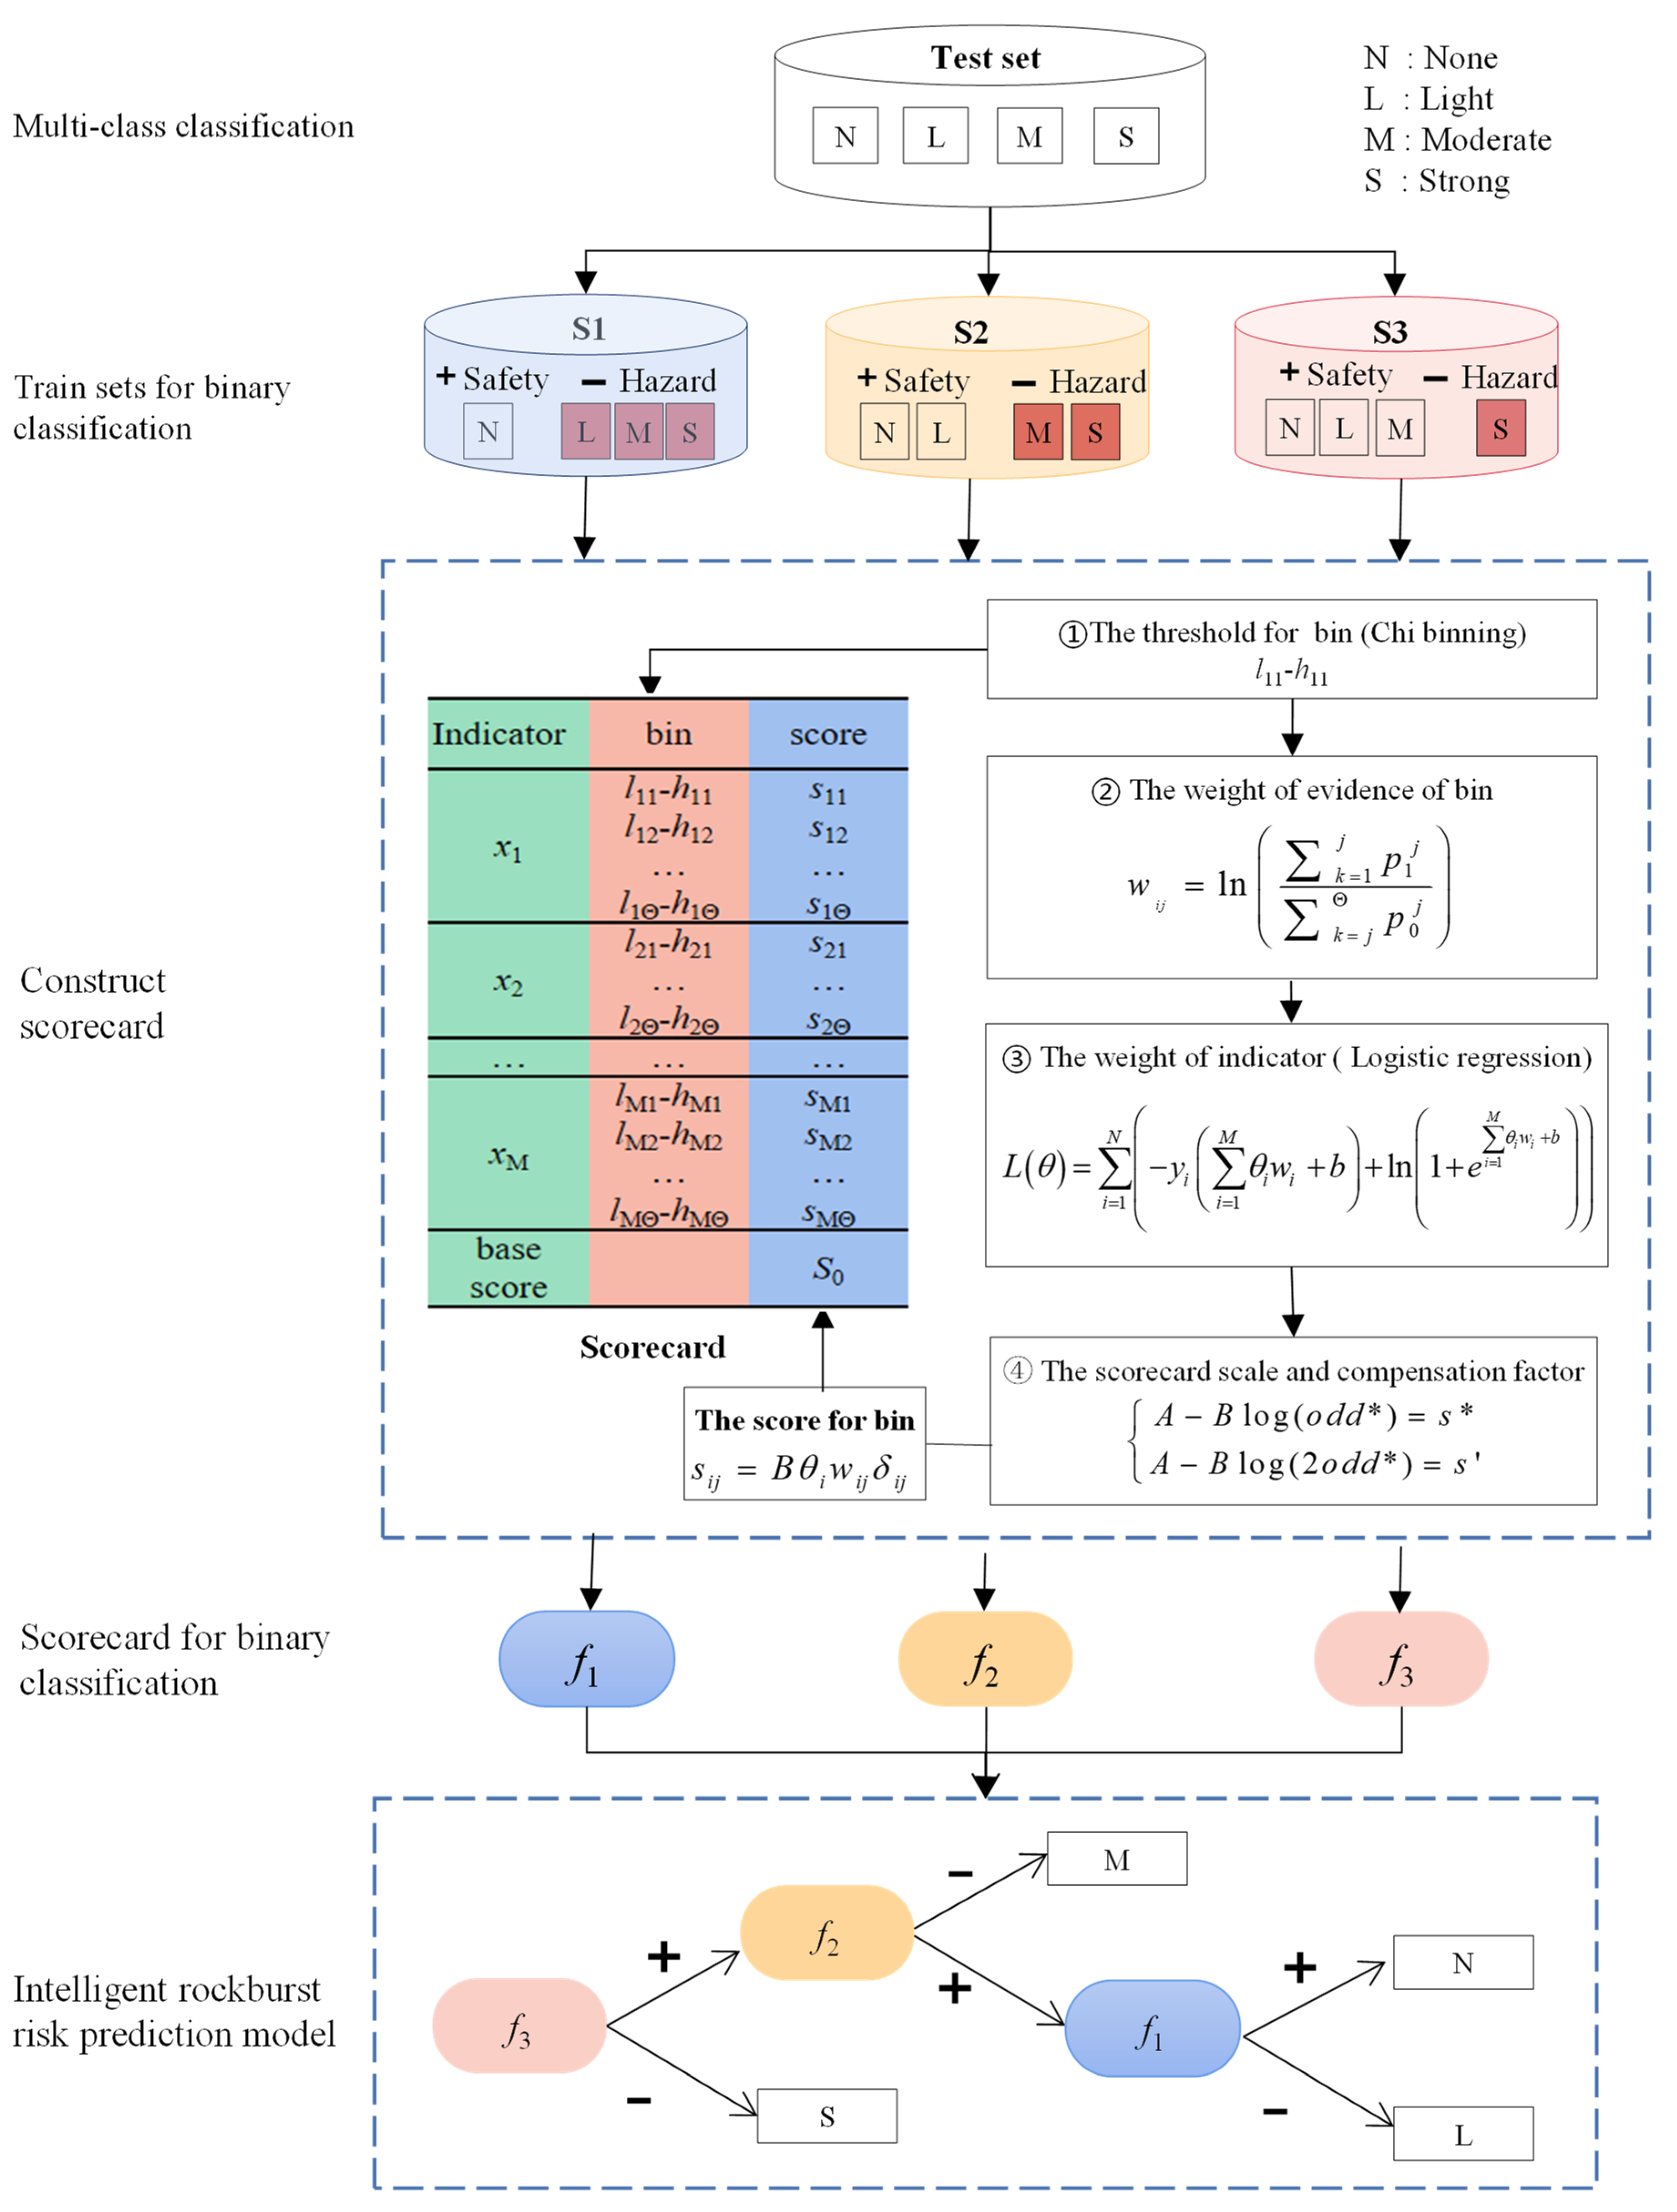
2.1. Establishment of the Intelligent Rockburst Risk Prediction Model
2.2. Construction of the Rockburst Risk Prediction Scorecard
2.2.1. Binning of Indicators
2.2.2. Determination of the Weight of Evidence for Each Bin
2.2.3. Determination of Each Weight’s Indicator
2.2.4. Determination of Scorecard Scales and Compensation Factors
2.3. Evaluation of Prediction Effectiveness
2.4. Parameter Setting
3. Results
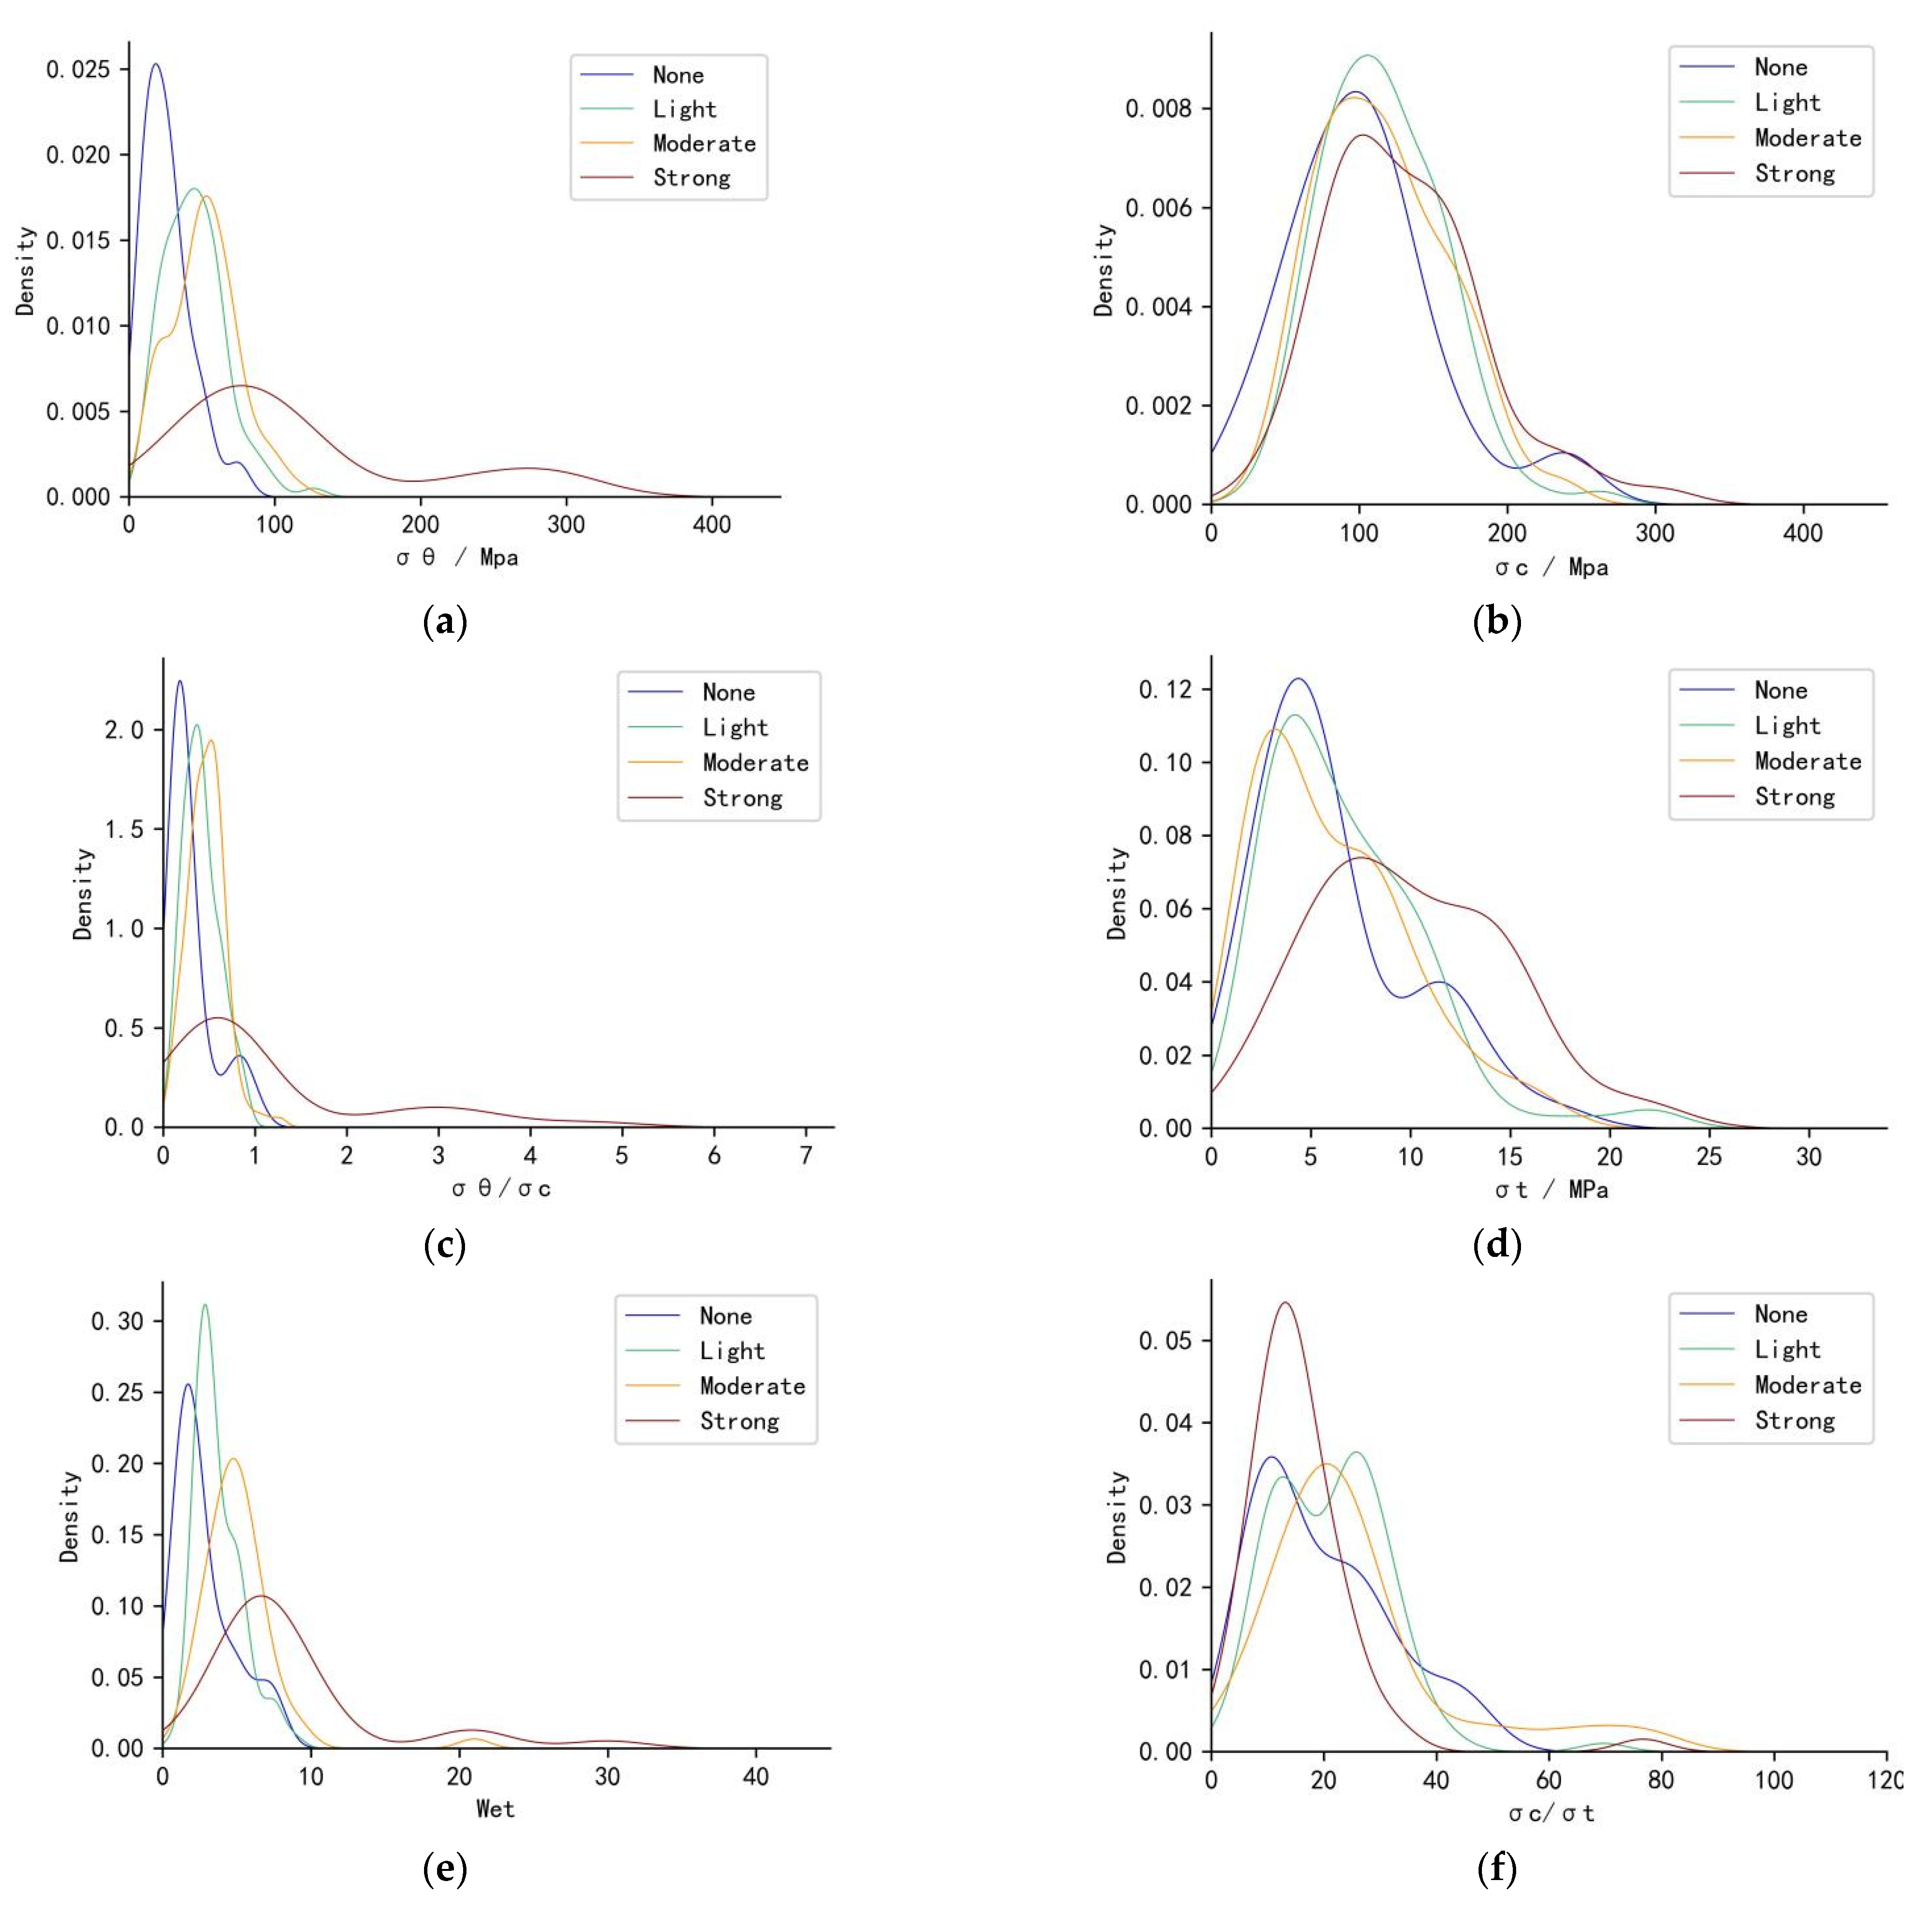
3.1. Rockburst Case Collection and Analysis
3.2. The Intelligent Rockburst Risk Prediction Model by Using Scorecards
3.3. Application to Riverside Hydropower Station Tunnel Rockburst Case
4. Discussion
4.1. Comparison with Machine Learning Models
4.2. Effect of Hazard Sample Category Weights on Scorecard Prediction Results
5. Conclusions
- (1)
- Using 311 rockburst cases, an IRPSC was constructed based on ChiMerge, WOE, and LR algorithms. The model was applied to predict rockburst cases in the riverside hydropower station tunnel. The IRPSC can identify the main controlling factors affecting the occurrence of rockburst. As for the field application in this work, the Wet was the main indicator affecting the rockburst risk level. The model predicted an ACC, FAR, and MAR of 75%, 12.5% and 12.5%, respectively, demonstrating that the evaluation process of the IRPSC is simple and transparent with high prediction accuracy.
- (2)
- The influence of sample category weight on the predicted FAR and MAR of rock burst was further investigated. Results show that when the safety sample category weight is set to 1 and the hazard sample category weight is gradually increased from 0.5 to 10, the rockburst risk scorecard’s MAR gradually decreases from 56.9% to 17.2%, the FAR increases from 1.5% to 31.4%, and the ACC decreases from 88.4% to 71.2%. Setting higher category hazard sample weights reduces the MAR of the rockburst risk scorecard; however, this will increase the FAR and should be considered when determining sample category weights.
Author Contributions
Funding
Conflicts of Interest
References
- Cai, W.; Dou, L.; Si, G.; Cao, A.; He, J.; Liu, S. A principal component analysis/fuzzy comprehensive evaluation model for coal burst liability assessment. Int. J. Rock Mech. Min. Sci. 2016, 81, 62–69. [Google Scholar] [CrossRef]
- He, J.; Dou, L.; Gong, S.; Li, J.; Ma, Z. Rock burst assessment and prediction by dynamic and static stress analysis based on micro-seismic monitoring. Int. J. Rock Mech. Min. 2018, 93, 46–53. [Google Scholar] [CrossRef]
- He, M.; Ren, F.; Liu, D. Rockburst mechanism research and its control. Int. J. Min. Sci. Technol. 2018, 28, 829–837. [Google Scholar] [CrossRef]
- Zhou, J.; Li, X.; Mitri, H.S. Evaluation method of rockburst: State-of-the-art literature review. Tunn. Undergr. Space Technol. 2018, 81, 632–659. [Google Scholar] [CrossRef]
- Tian, R. Research and Application of Rockburst Intensity Classification Prediction Model Based on Machine Learning Algorithms; Inner Mongolia University of Science & Technology: Baotou, China, 2020. [Google Scholar]
- Liang, W.; Zhao, G.; Wu, H.; Dai, B. Risk assessment of rockburst via an extended MABAC method under fuzzy environment. Tunn. Undergr. Space Technol. 2019, 83, 533–544. [Google Scholar] [CrossRef]
- Liang, W.; Sari, A.; Zhao, G.; McKinnon, S.D.; Wu, H. Short-term rockburst risk prediction using ensemble learning methods. Nat. Hazards 2020, 104, 1923–1946. [Google Scholar] [CrossRef]
- Naji, A.M.; Emad, M.Z.; Rehman, H.; Yoo, H. Geological and geomechanical heterogeneity in deep hydropower tunnels: A rock burst failure case study. Tunn. Undergr. Space Technol. 2019, 84, 507–521. [Google Scholar] [CrossRef]
- Wang, C.; Cao, A.; Zhang, C.; Canbulat, I. A New Method to Assess Coal Burst Risks Using Dynamic and Static Loading Analysis. Rock Mech. Rock Eng. 2020, 53, 1113–1128. [Google Scholar] [CrossRef]
- Barton, N.; Lien, R.; Lunde, J. Engineering classification of rock masses for the design of tunnel support. Rock Mech. Rock Eng. 1974, 6, 189–236. [Google Scholar] [CrossRef]
- Hoek, E.; Brown, E.T. Practical estimates of rock mass strength. Int. J. Rock Mech. Min. 1997, 34, 1165–1186. [Google Scholar] [CrossRef]
- Kidybiński, A. Bursting liability indices of coal. Int. J. Rock Mech. Min. Sci. Géoméch. Abstr. 1981, 18, 295–304. [Google Scholar] [CrossRef]
- Mitri, H.S. Assessment of horizontal pillar burst in deep hard rock mines. Int. J. Risk Assess. Manag. 2007, 7, 695. [Google Scholar] [CrossRef]
- Qiu, S.; Feng, X.; Zhang, C.; Wu, W. Development and validation of rockburst vulnerability index (RVI) in deep hard rock tunnels. Chin. J. Rock Mech. Eng. 2011, 30, 1126–1141. [Google Scholar]
- Xia, Y.; Kang, L.; Qi, Q.; Mao, D.; Ren, Y.; Lan, H.; Pan, J. Five indexes of microseismic and their application in rockburst forecastion. J. Chin. Coal Soc. 2010, 35, 2011–2016. [Google Scholar]
- Dou, L.; Chen, T.; Gong, S.; He, H.; Zhang, S. Rockburst hazard determination by using computed tomography technology in deep workface. Saf. Sci. 2012, 50, 736–740. [Google Scholar] [CrossRef]
- Tong, J.; Jiang, Z.; Huang, Y.; Chen, S. Application of Grey System Optimal Theory Model in Forecasting Rockburs. J. North Chin. Inst. Water Conserv. Hydro. Power. 2003, 24, 37–40. [Google Scholar]
- Liu, Z.; Shao, J.; Xu, W.; Meng, Y. Prediction of rockburst classification using the technique of cloud models with attribution weight. Nat. Hazard 2013, 68, 549–568. [Google Scholar] [CrossRef]
- Pan, J.; Qin, Z.; Wang, S.; Xia, Y.; Feng, M. Comprehensive evaluation method of impact risk by weight of different sources. J. Chin. Coal Soc. 2015, 40, 2327–2335. [Google Scholar]
- Cai, W.; Dou, L.; Zhang, M.; Cao, W.; Shi, J.; Feng, L. A fuzzy comprehensive evaluation methodology for rockburst forecasting using microseismic monitoring. Tunn. Undergr. Space Technol. 2018, 80, 232–245. [Google Scholar] [CrossRef]
- Chen, J.; Pu, Y.; Jiang, Y.; Qi, Q.; Wen, Z. Machine learning method for predicting and warning of rockbursts. J. Min. Strata Control Eng. 2020, 3, 13026. [Google Scholar]
- Zhou, J.; Li, X.; Shi, X. Long-term prediction model of rockburst in underground openings using heuristic algorithms and support vector machines. Saf. Sci. 2012, 50, 629–644. [Google Scholar] [CrossRef]
- Li, N.; Jimenez, R. A logistic regression classifier for long-term probabilistic prediction of rockburst hazard. Nat. Hazard 2018, 90, 197–215. [Google Scholar] [CrossRef]
- Feng, X.; Wang, L. Rockburst prediction based on neural networks. T. Nonfer. Soc. 1994, 4, 7–14. [Google Scholar]
- Pu, Y.; Apel, D.B.; Xu, H. Rockburst prediction in kimberlite with unsupervised learning method and support vector classifier. Tunn. Undergr. Space Technol. 2019, 90, 12–18. [Google Scholar] [CrossRef]
- Dong, L.; Wesseloo, J.; Potvin, Y.; Li, X. Discrimination of Mine Seismic Events and Blasts Using the Fisher Classifier, Naive Bayesian Classifier and Logistic Regression. Rock Mech. Rock Eng. 2016, 49, 183–211. [Google Scholar] [CrossRef]
- Xu, W.; Zhang, J. A measure on the credit risk of china’s Municipal Bonds: A scorecard model based on multivariate logistic regression. J. App. Stat. Manag. 2020, 39, 705–720. [Google Scholar]
- Bequé, A.; Coussement, K.; Gayler, R.; Lessmann, S. Approaches for credit scorecard calibration: An empirical analysis. Knowl. Based Syst. 2017, 134, 213–227. [Google Scholar] [CrossRef]
- Liu, T. Credit Score Theory and Application Research; Hunan University: Changsha, China, 2010. [Google Scholar]
- Afraeia, S.; Shahriara, K.; Madania, S.H.; Abbas, A.K. Developing intelligent classification models for rockburst prediction after recognizing significant predictor variables, Section 2: Designing classifiers. Tunn. Undergr. Space Technol. 2019, 84, 522–537. [Google Scholar] [CrossRef]
- Pu, Y.; Apel, D.B.; Wei, C. Applying Machine Learning Approaches to Evaluating Rockburst Liability: A Comparation of Generative and Discriminative Models. Pure Appl. Geophys. 2019, 176, 4503–4517. [Google Scholar] [CrossRef]
- López, V.; Fernández, A.; García, S.; Palade, V.; Herrera, F. An insight into classification with imbalanced data: Empirical results and current trends on using data intrinsic characteristics. Inf. Sci. 2013, 250, 113–141. [Google Scholar] [CrossRef]
- Fernández, A.; García, S.; Galar, M.; Prati, R.C.; Krawczyk, B.; Herrera, F. Learning from Imbalanced Data Sets; Springer: Singapore, 2018. [Google Scholar]
- Linkov, I.; Loney, D.; Cormier, S.; Satterstrom, F.K.; Bridges, T. Weight-of-evidence evaluation in environmental assessment: Review of qualitative and quantitative approaches. Sci. Total Environ. 2009, 407, 5199–5205. [Google Scholar] [CrossRef]
- Teichgräber, U.; Sibbel, R.; Heinrich, A.; Güttler, F. Development of a balanced scorecard as a strategic performance measurement system for clinical radiology as a cost center. Insights Imaging 2021, 12, 69. [Google Scholar] [CrossRef]
- Kerber, R. ChiMerge: Discretization of Numeric Attributes; AAAI’92: Palo Alto, CA, USA, 1992; pp. 123–128. [Google Scholar]
- Hardy, A.; Benford, D.; Halldorsson, T.; Jeger, M.J.; Knutsen, H.K.; More, S.; Naegeli, H.; Noteborn, H.; Ockleford, C.; Ricci, A.; et al. Guidance on the use of the weight of evidence approach in scientific assessments. Efsa. J. 2017, 15, e04971. [Google Scholar]
- Weed, D.L. Weight of Evidence: A Review of Concept and Methods. Risk Anal. 2005, 25, 1545–1557. [Google Scholar] [CrossRef]
- Chen, J.; Chen, S.; Fu, R.; Wang, C.; Li, D.; Jiang, H.; Zhao, J.; Wang, L.; Peng, Y.; Mei, Y. Simulation of water hyacinth growth area based on multi-source geographic information data: An integrated method of WOE and AHP. Ecol. Indic. 2021, 125, 107574. [Google Scholar] [CrossRef]
- Li, H. Statistical Learning Methods; Tsinghua University Press: Beijing, China, 2012. [Google Scholar]
- Zhou, Z. Machine Learning; Tsinghua University Press: Beijing, China, 2016. [Google Scholar]


| Actual Risk Level | Prediction Risk Level | |||
|---|---|---|---|---|
| None | Light | Moderate | Strong | |
| None | n11 | n12 | n13 | n14 |
| Light | n21 | n22 | n23 | n24 |
| Moderate | n31 | n32 | n33 | n34 |
| Strong | n41 | n42 | n43 | n44 |
| Data Set | Safety Samples | Risk Samples | Ratios of Safety and Hazard Samples |
|---|---|---|---|
| S1 | 48 | 263 | 0.18 |
| S2 | 142 | 169 | 0.84 |
| S3 | 256 | 55 | 4.65 |
| Parameter | Range | Mean | Standard Deviation | Skew |
|---|---|---|---|---|
| σθ/MPa | 2.6–297 | 57.53 | 49.40 | 2.99 |
| σc/MPa | 20–304 | 116.46 | 46.08 | 0.71 |
| σt/MPa | 0.4–22.6 | 7.02 | 4.30 | 1.00 |
| σθ/σc | 0.05–4.87 | 0.55 | 0.60 | 4.31 |
| σc/σt | 0.15–80 | 21.53 | 13.51 | 1.91 |
| Wet | 0.81–30 | 5.02 | 3.76 | 3.48 |
| Indicator | Bin | f1 | f2 | f3 | |||||||||
|---|---|---|---|---|---|---|---|---|---|---|---|---|---|
| θ | Range | WOE | Score | θ | Range | WOE | Score | θ | Range | WOE | Score | ||
| σθ/MPa | 1 | 0.32 | <13.7 | −4.88 | 23 | 0.30 | <13.7 | −5.14 | 22 | 0.32 | <48.0 | −2.23 | 10 |
| 2 | 13.7–24.0 | −1.59 | 7 | 13.7–46.06 | −1.15 | 5 | 48.0–73.2 | −0.09 | 0 | ||||
| 3 | 24.0–38.25 | −0.59 | 3 | 46.06–62.1 | 0.44 | −2 | 73.2–123.61 | 1.93 | −9 | ||||
| 4 | >38.25 | 1.67 | −8 | >62.1 | 2.24 | −10 | >123.61 | 5.54 | −26 | ||||
| σc/MPa | 1 | 0.17 | <61.1 | 2.44 | 6 | −0.08 | <112.0 | −0.74 | −1 | −0.07 | <83.78 | −1.95 | −2 |
| 2 | 61.1–135.07 | −0.07 | 0 | 112.0–115.0 | 0.16 | 0 | 83.78–112.0 | −0.45 | 0 | ||||
| 3 | 135.0–190.8 | 1.62 | −4 | 115.0–122.4 | 0.27 | 0 | 112.0–135.0 | 0.19 | 0 | ||||
| 4 | >190.85 | 2.77 | −7 | >122.47 | 1.04 | 1 | >135.07 | 1.29 | 1 | ||||
| σt/MPa | 1 | −0.26 | <4.7 | −1.04 | −4 | −0.30 | <2.88 | −1.67 | −7 | 0.39 | <5.0 | −1.95 | 11 |
| 2 | 4.7–6.0 | −0.32 | −1 | 2.88–6.7 | −0.60 | −3 | 5.0–10.51 | 0.12 | −1 | ||||
| 3 | 6.0–10.51 | 0.88 | 3 | 6.7–7.31 | 0.43 | 2 | 10.51–13.0 | 1.47 | −8 | ||||
| 4 | >10.51 | 1.47 | 6 | >7.31 | 1.04 | 5 | >13.0 | 2.98 | −17 | ||||
| σθ/σc | 1 | 0.70 | <0.23 | −1.99 | 20 | 0.26 | < 0.31 | −1.74 | 6 | 0.30 | <0.23 | −2.93 | 13 |
| 2 | 0.23–0.31 | −0.54 | 5 | 0.31–0.465 | −0.29 | 1 | 0.23–0.63 | −0.75 | 3 | ||||
| 3 | 0.31–0.74 | 1.14 | −12 | 0.465-0.55 | 0.74 | −3 | 0.63–1.03 | 1.54 | −7 | ||||
| 4 | >0.74 | 2.08 | −21 | > 0.55 | 1.42 | −5 | >1.025 | 4.44 | −19 | ||||
| σc/σt | 1 | 0.35 | <6.3 | −2.80 | 14 | 0.02 | <6.3 | −2.50 | 1 | 0.60 | <6.3 | −1.95 | 7 |
| 2 | 6.3–11.28 | −1.74 | 9 | 6.3–10.11 | −2.17 | 1 | 6.3–10.11 | −1.69 | 5 | ||||
| 3 | 11.28–22.9 | 0.03 | 0 | 10.11–22.9 | −0.20 | 0 | 10.11–17.52 | −0.15 | 1 | ||||
| 4 | >22.9 | 0.93 | −5 | >22.9 | 0.77 | 0 | >17.52 | 0.49 | −4 | ||||
| Wet | 1 | 0.72 | <1.5 | −4.47 | 46 | 0.57 | <2.87 | −2.50 | 21 | 0.53 | <4.9 | −2.42 | 18 |
| 2 | 1.5–2.03 | −2.86 | 30 | 2.87–4.9 | −0.45 | 4 | 4.9–5.2 | −0.56 | 4 | ||||
| 3 | 2.03–2.5 | −1.40 | 15 | 4.9–7.8 | 1.43 | −12 | 5.2–9.3 | 1.17 | −9 | ||||
| 4 | >2.5 | 1.04 | −11 | >7.8 | 4.26 | −35 | >9.3 | 4.85 | −37 | ||||
| Base score | −31 | −3 | 22 | ||||||||||
| Case | Indicator | σθ/MPa | σc/MPa | σt/MPa | σθ/σc | σc/σt | Wet | Total Score | Scorecard Predicted Results | IRPSC Prediction Results | Actual Rockburst Risk Level |
|---|---|---|---|---|---|---|---|---|---|---|---|
| 1 | value | 91.23 | 157.63 | 11.96 | 0.58 | 13.18 | 6.27 | Moderate | Strong | ||
| f1 score | −8 | −4 | 6 | −12 | 0 | −11 | −60 | hazard | |||
| f2 score | −10 | 1 | 5 | −5 | 0 | −12 | −24 | hazard | |||
| f3 score | −9 | 1 | −8 | 3 | 1 | −9 | 1 | safety | |||
| 2 | value | 66.77 | 148.48 | 8.47 | 0.45 | 17.53 | 5.08 | - | Moderate | Light | |
| f1 score | −8 | −4 | 3 | −12 | 0 | −11 | −63 | hazard | |||
| f2 score | −10 | 1 | 5 | 1 | 0 | −12 | −18 | hazard | |||
| f3 score | 0 | 1 | -1 | 3 | -4 | 4 | 25 | safety | |||
| 3 | value | 51.5 | 132.05 | 6.33 | 0.39 | 20.86 | 4.63 | Moderate | Moderate | ||
| f1 score | −8 | 0 | 3 | −12 | 0 | −11 | −59 | hazard | |||
| f2 score | −2 | 1 | −3 | 1 | 0 | 4 | −2 | hazard | |||
| f3 score | 0 | 0 | −1 | 3 | −4 | 18 | 38 | safety | |||
| 4 | value | 35.82 | 127.93 | 4.43 | 0.28 | 28.9 | 3.67 | Light | Light | ||
| f1 score | 3 | 0 | −4 | 5 | −5 | −11 | −43 | hazard | |||
| f2 score | 5 | 1 | −3 | 6 | 0 | 4 | 10 | safety | |||
| f3 score | 10 | 0 | 11 | 3 | -4 | 18 | 60 | safety | |||
| 5 | value | 21.5 | 107.52 | 2.98 | 0.2 | 36.04 | 2.29 | None | None | ||
| f1 score | 7 | 0 | −4 | 20 | −5 | 15 | 2 | safety | |||
| f2 score | 5 | −1 | −3 | 6 | 0 | 21 | 25 | safety | |||
| f3 score | 10 | 0 | 11 | 13 | −4 | 18 | 70 | safety | |||
| 6 | value | 18.32 | 96.41 | 2.01 | 0.19 | 47.93 | 1.87 | None | None | ||
| f1 score | 7 | 0 | −4 | 20 | −5 | 30 | 17 | safety | |||
| f2 score | 5 | −1 | −7 | 6 | 0 | 21 | 21 | safety | |||
| f3 score | 10 | 0 | 11 | 13 | −4 | 18 | 70 | safety | |||
| 7 | value | 110.3 | 167.19 | 12.67 | 0.66 | 13.2 | 6.83 | Strong | Strong | ||
| f1 score | −8 | −4 | 6 | −12 | 0 | −11 | −60 | hazard | |||
| f2 score | −10 | 1 | 5 | −5 | 0 | −12 | −24 | hazard | |||
| f3 score | −9 | 1 | −8 | −7 | 1 | −9 | −9 | hazard | |||
| 8 | value | 26.06 | 118.46 | 3.51 | 0.22 | 33.75 | 2.89 | Light | Light | ||
| f1 score | 3 | 0 | −4 | 20 | −5 | −11 | −28 | hazard | |||
| f2 score | 5 | 0 | −3 | 6 | 0 | 4 | 9 | safety | |||
| f3 score | 10 | 0 | 11 | 13 | −4 | 18 | 70 | safety |
| Data Set | Model | TP | FN | FP | TN | ACC | FAR | MAR |
|---|---|---|---|---|---|---|---|---|
| S1 | SCM | 25 | 25 | 9 | 260 | 89.3% | 50.0% | 3.3% |
| LR | 15 | 35 | 14 | 255 | 84.6% | 70.0% | 5.2% | |
| SVM | 7 | 43 | 6 | 263 | 84.6% | 86.0% | 2.2% | |
| CART | 29 | 21 | 12 | 257 | 89.7% | 42.0% | 4.5% | |
| RF | 32 | 18 | 9 | 260 | 91.5% | 36.0% | 3.3% | |
| AdaBoost | 29 | 21 | 11 | 258 | 90.0% | 42.0% | 4.1% | |
| S2 | SCM | 109 | 37 | 40 | 133 | 75.9% | 25.3% | 23.1% |
| LR | 113 | 33 | 41 | 132 | 76.8% | 22.6% | 23.7% | |
| SVM | 113 | 33 | 46 | 127 | 75.2% | 22.6% | 26.6% | |
| CART | 109 | 37 | 45 | 128 | 74.3% | 25.3% | 26.0% | |
| RF | 115 | 31 | 21 | 152 | 83.7% | 21.2% | 12.1% | |
| AdaBoost | 109 | 37 | 30 | 143 | 79.0% | 25.3% | 17.3% | |
| S3 | SCM | 248 | 13 | 27 | 31 | 87.5% | 5.0% | 46.6% |
| LR | 253 | 8 | 31 | 27 | 87.8% | 3.1% | 53.4% | |
| SVM | 258 | 3 | 39 | 19 | 86.8% | 1.1% | 67.2% | |
| CART | 233 | 28 | 25 | 33 | 83.4% | 10.7% | 43.1% | |
| RF | 248 | 13 | 26 | 32 | 87.8% | 5.0% | 44.8% | |
| AdaBoost | 238 | 23 | 29 | 29 | 83.7% | 8.8% | 50.0% |
| Category Weight | TP | FN | FP | TN | ACC | MAR | FAR |
|---|---|---|---|---|---|---|---|
| 0.5 | 257 | 4 | 33 | 25 | 88.4% | 56.9% | 1.5% |
| 1 | 248 | 13 | 27 | 31 | 87.5% | 46.6% | 5.0% |
| 2.5 | 232 | 29 | 18 | 40 | 85.3% | 31.0% | 11.1% |
| 5 | 206 | 55 | 14 | 44 | 78.4% | 24.1% | 21.1% |
| 7.5 | 192 | 69 | 13 | 45 | 74.3% | 22.4% | 26.4% |
| 10 | 179 | 82 | 10 | 48 | 71.2% | 17.2% | 31.4% |
Publisher’s Note: MDPI stays neutral with regard to jurisdictional claims in published maps and institutional affiliations. |
© 2021 by the authors. Licensee MDPI, Basel, Switzerland. This article is an open access article distributed under the terms and conditions of the Creative Commons Attribution (CC BY) license (https://creativecommons.org/licenses/by/4.0/).
Share and Cite
Wang, H.; Li, Z.; Song, D.; He, X.; Sobolev, A.; Khan, M. An Intelligent Rockburst Prediction Model Based on Scorecard Methodology. Minerals 2021, 11, 1294. https://doi.org/10.3390/min11111294
Wang H, Li Z, Song D, He X, Sobolev A, Khan M. An Intelligent Rockburst Prediction Model Based on Scorecard Methodology. Minerals. 2021; 11(11):1294. https://doi.org/10.3390/min11111294
Chicago/Turabian StyleWang, Honglei, Zhenlei Li, Dazhao Song, Xueqiu He, Aleksei Sobolev, and Majid Khan. 2021. "An Intelligent Rockburst Prediction Model Based on Scorecard Methodology" Minerals 11, no. 11: 1294. https://doi.org/10.3390/min11111294
APA StyleWang, H., Li, Z., Song, D., He, X., Sobolev, A., & Khan, M. (2021). An Intelligent Rockburst Prediction Model Based on Scorecard Methodology. Minerals, 11(11), 1294. https://doi.org/10.3390/min11111294