Article

Origin of Lithium–Potassium-Rich Brines in the Jianghan Basin, South China: Constraints by Water–Rock Reactions of Mesozoic–Cenozoic Igneous Rocks

1
MNR Key Laboratory of Metallogeny and Mineral Assessment, Institute of Mineral Resources, Chinese Academy of Geological Sciences, Beijing 100037, China
2
School of Earth and Space Sciences, Peking University, Beijing 100871, China
3
Department of Geological Sciences and Environmental Studies, State University of New York at Binghamton, New York, NY 13902, USA
4
Oil & Gas Survey, China Geological Survey, Beijing 100083, China
5
Faculty of Earth Science, University of Iceland, Sturlugata 7, Askja, 101 Reykjavík, Iceland
6
Institute of Geological Survey, China University of Geosciences, Wuhan 430074, China
*
Author to whom correspondence should be addressed.
Minerals 2021, 11(12), 1330; https://doi.org/10.3390/min11121330
Submission received: 12 October 2021 / Revised: 20 November 2021 / Accepted: 23 November 2021 / Published: 28 November 2021
(This article belongs to the Section Mineral Deposits)

Abstract

:
A large number of lithium–potassium-rich brines have been found in Paleocene reservoirs in the Jianghan Basin, South China. First, the brines have exceptionally high lithium and potassium contents that are even higher than those in other closed basins on the Tibetan Plateau. Second, the enriched brines are widely distributed in the center of the basin. The Mesozoic and Cenozoic igneous rocks in the Jiangling depression are mainly basalt and granite, and their distribution area exceeds 50% of the basin. The large basalt body provided a thermal source for the water–rock reaction. The igneous rocks in the study area could have provided ore-forming elements, such as lithium and potassium, for the brine. A static immersion experiment at room temperature shows that fluids with certain salinities are more likely to activate K ions in basalt. However, weakly alkaline solutions more easily dissolve K. High-temperature water–rock experiments show that the dissolution rates of Ca, Mg, and Sr decrease with increasing temperature, while the dissolution rates of K and Li first increase and then decrease with increasing temperature. The dissolution of K and Li is easier when saline fluid reacts with volcanic rock. The dissolution rate of K is higher than that of Li in basalt, and the dissolution rate of Li is higher than that of K in granite. Compared with the results at normal temperatures, the ability of the fluid to leach elements at higher temperatures is significantly enhanced. Temperature is the main factor controlling the ability of fluid to leach elements. High-salinity fluid is the main carrier of ore-forming elements. According to the water–rock experiments, the mineral composition of the ancient brine in the Jiangling depression that formed during the Paleocene is consistent with that of the ore-rich brine found today, but different by a few orders of magnitude, indicating that the formation of lithium–potassium-rich brines requires a long time. The water–rock reaction is one of the important processes of brine formation, and surface evaporation and concentration are the main mechanisms of brine mineralization.

1. Introduction

Modern salt lake brines and deep-buried underground brines are often rich in potassium, lithium, boron, rubidium, cesium, and other high-value strategic emerging mineral resources [1,2,3,4,5,6,7,8,9,10,11,12,13,14], and are important raw material sources of potash and lithium globally. China’s external potash dependence has decreased from 75% to 45%, but the consumption has been growing rapidly, from 3.999 million tons in 2000 to 10.19 million tons in 2018, which accounts for approximately 20–25% of the global potash consumption [15]. At present, the potash resource in China is mainly found in the brines of Qaidam, Lop Nur, and other salt lakes in Northwest China. Researchers have predicted that the service life of these resources is about 20 years [16]. China’s existing lithium supply is highly dependent on external resources; 70% of the lithium supply was imported in 2017. The lithium ore in China is dominated by the hard rock-type. Lithium brine-type deposits are mainly distributed in the western plateau area andare greatly restricted by mining conditions and technology due to their high Mg/Li ratios. The world’s large and super-large lithium deposits are mainly brine-type, accounting for 75% of the global lithium production, which is mainly from salt lake lithium-rich brine in South America, the western plateau of North America, and lithium-rich underground hot water in New Zealand [17]. These lithium-rich brines or underground hot water reservoirsall have very low Mg/Li ratios and are easy to extract. The common characteristics of these regions are that they are all located in active tectonic regions with dry climates, making them conducive to material concentration and mineralization. When the Pacific Plate subducted under the Eurasian plate, and the Indian Plate converged and collided with the Eurasian Plate, the two processes were alternately active, resulting in a strong stress release zone in the eastern part of China that has been present since the Jurassic; this has formed a giant rift system in eastern China. The Jianghan Basin is located in this rift system, which has structural conditions that are conducive for the formation of large-scale lithium brine deposits, similar to those found abroad.
The research developments regardingthe source and genesis of potassium and lithium in the brine have been introduced in depth. Lowenstein et al. (1989) [18] proposed that some abnormal potassium salts may be formed in nonmarine brine rather than seawater, indicating that their provenance isricher in potassium ions than seawater, and there are abnormal replenishing sources. Holmearda and Hutchinsan (1968) [19] proposed that potassium was formed by rift thermal halogen, as in the case of the Ethiopian salt lake (belonging to the Red Sea rift system) distributed near Black Mountain and Round Mountain in the middle part of the Danakil Depression, which was formed by some brine pools formed by a thermal halogen spring rising from underground, accompanied by the precipitation of many potassium salts and other salts. The hot brine spring in Black Mountain is composed of high-temperature (up to 130 °C) saturated brine with a potassium chloride content of about 2%. In Katwe crater lake, an East African Rift salt lakeon the Uganda border, the area of volcanic rock is mainly basic rock with a high K/Na ratio; more than 50 springs supply the lake; and potassium content of the lake is 2.2–45 g/L, bromine content is 0.5–2.55 g/L, and fluorine content is 0.1–0.5 g/L [20].
Lithium deposits in salt lake brine areassociated with potassium salt and also go through the evaporation enrichment process. Yu et al. (2021) [21] proposed a preliminary model and pointed out that the lithium mineralization of brine is mainly by evaporation and the reaction between hot fluid and aquifer. Godfrey et al. (2013) [2] proposed that climate plays an important influence on lithium enrichment in salt lake brine; that is, the high-altitude drought in the middle Andes leads to rapid enrichment of lithium in brine. Munk et al. (2018) [11] summarized the metallogenic characteristics of 18 lithium brine deposits in the world. Munk and Chamberlain (2011) [22] proposed that the genesis model of lithium-rich brines in Clayton Valley, Nevada, is as follows: (1) lithium comingfrom the leaching of lithium-rich rhyolite; (2) condensing and evaporating in dry salt lakes; and (3) the underground mixing of brine and the evolution of water–rock reaction. Hofstra et al. (2013) [23] summarized and proposed the formation mode of lithium-rich brine deposit and lithium clay ore in Clayton Valley Salt Lake in the United States, namely partial remelting of A-type or S-type granite (up-invasion, eruption) and lithium filtering into the salt lake fromthe forest, finally forming lithium-rich brine deposits by processes such as evaporation and concentration. The formation of lithium-rich brines in Puna Salt Lakes in Argentina is related to the contribution of hot water and weathering of lithium-bearing rocks [24]. Price et al. (2000) [25] believed that lithium-rich brine in Clayton Valley Salt Lake, Nevada, western United States, may come from the weathering products of lithium-rich volcanic ash or rhyolite; Araoka et al. (2013) [26] believed that lithium-rich intercrystalline brine of the dry salt lake in Nevada, United States, mainly came from high-temperature water–rock (volcanic rock) reaction and local hot spring activities, rather than from low-temperature weathering products of surface materials.
One common feature of lithium–potassium-rich brines mentioned is the development of volcanic activity in the basin. Active and dormant volcanoes plus the massive magmatic body are important as heat sources, which enhance water–rock reactions [14,17,25].
The concentrations of KCl and LiCl in the brine in the Jiangling depression reach 1.64% and 300–800 mg/L, respectively, both of which have met the formal and official requirements of industrial development in China. The brine is a liquid-type potassium- and lithium-rich deposit and hasa high comprehensive utilization value [5,27,28]. Therefore, it is of great significance to study the source and enrichment process of mineralization in the brine to establish a metallogenic model of potassium- and lithium-rich brine and guide the further prospecting of potassium- and lithium-rich brine in this area. Magmatic activity in Middle Cenozoic was frequent in and around the basin. Basalt and granite are rich in potassium, lithium, rubidium, tungsten, tin, and other elements [29,30,31], which may have been the main source of minerals for the deep-buried brine in the basin. Whether the ore-forming materials of potassium–lithium-rich brine were directly enriched by water–rock reactions or formed by surface weathering, evaporation, and concentration and finally sealed storage is the subject of this research. To solve the scientific problem of the material source and enrichment process of potassium and lithium in the brine in the Jiangling depression, potassium–lithium-rich brine and Cenozoic igneous rocks around the Jiangling depression were selected for analysis of the chemical constituents of brine and rocks. The water–rock reaction process of basalt and granite was carried out by using a reaction kettle to explore its significance to the material source and genesis of the potassium–lithium-rich brine.

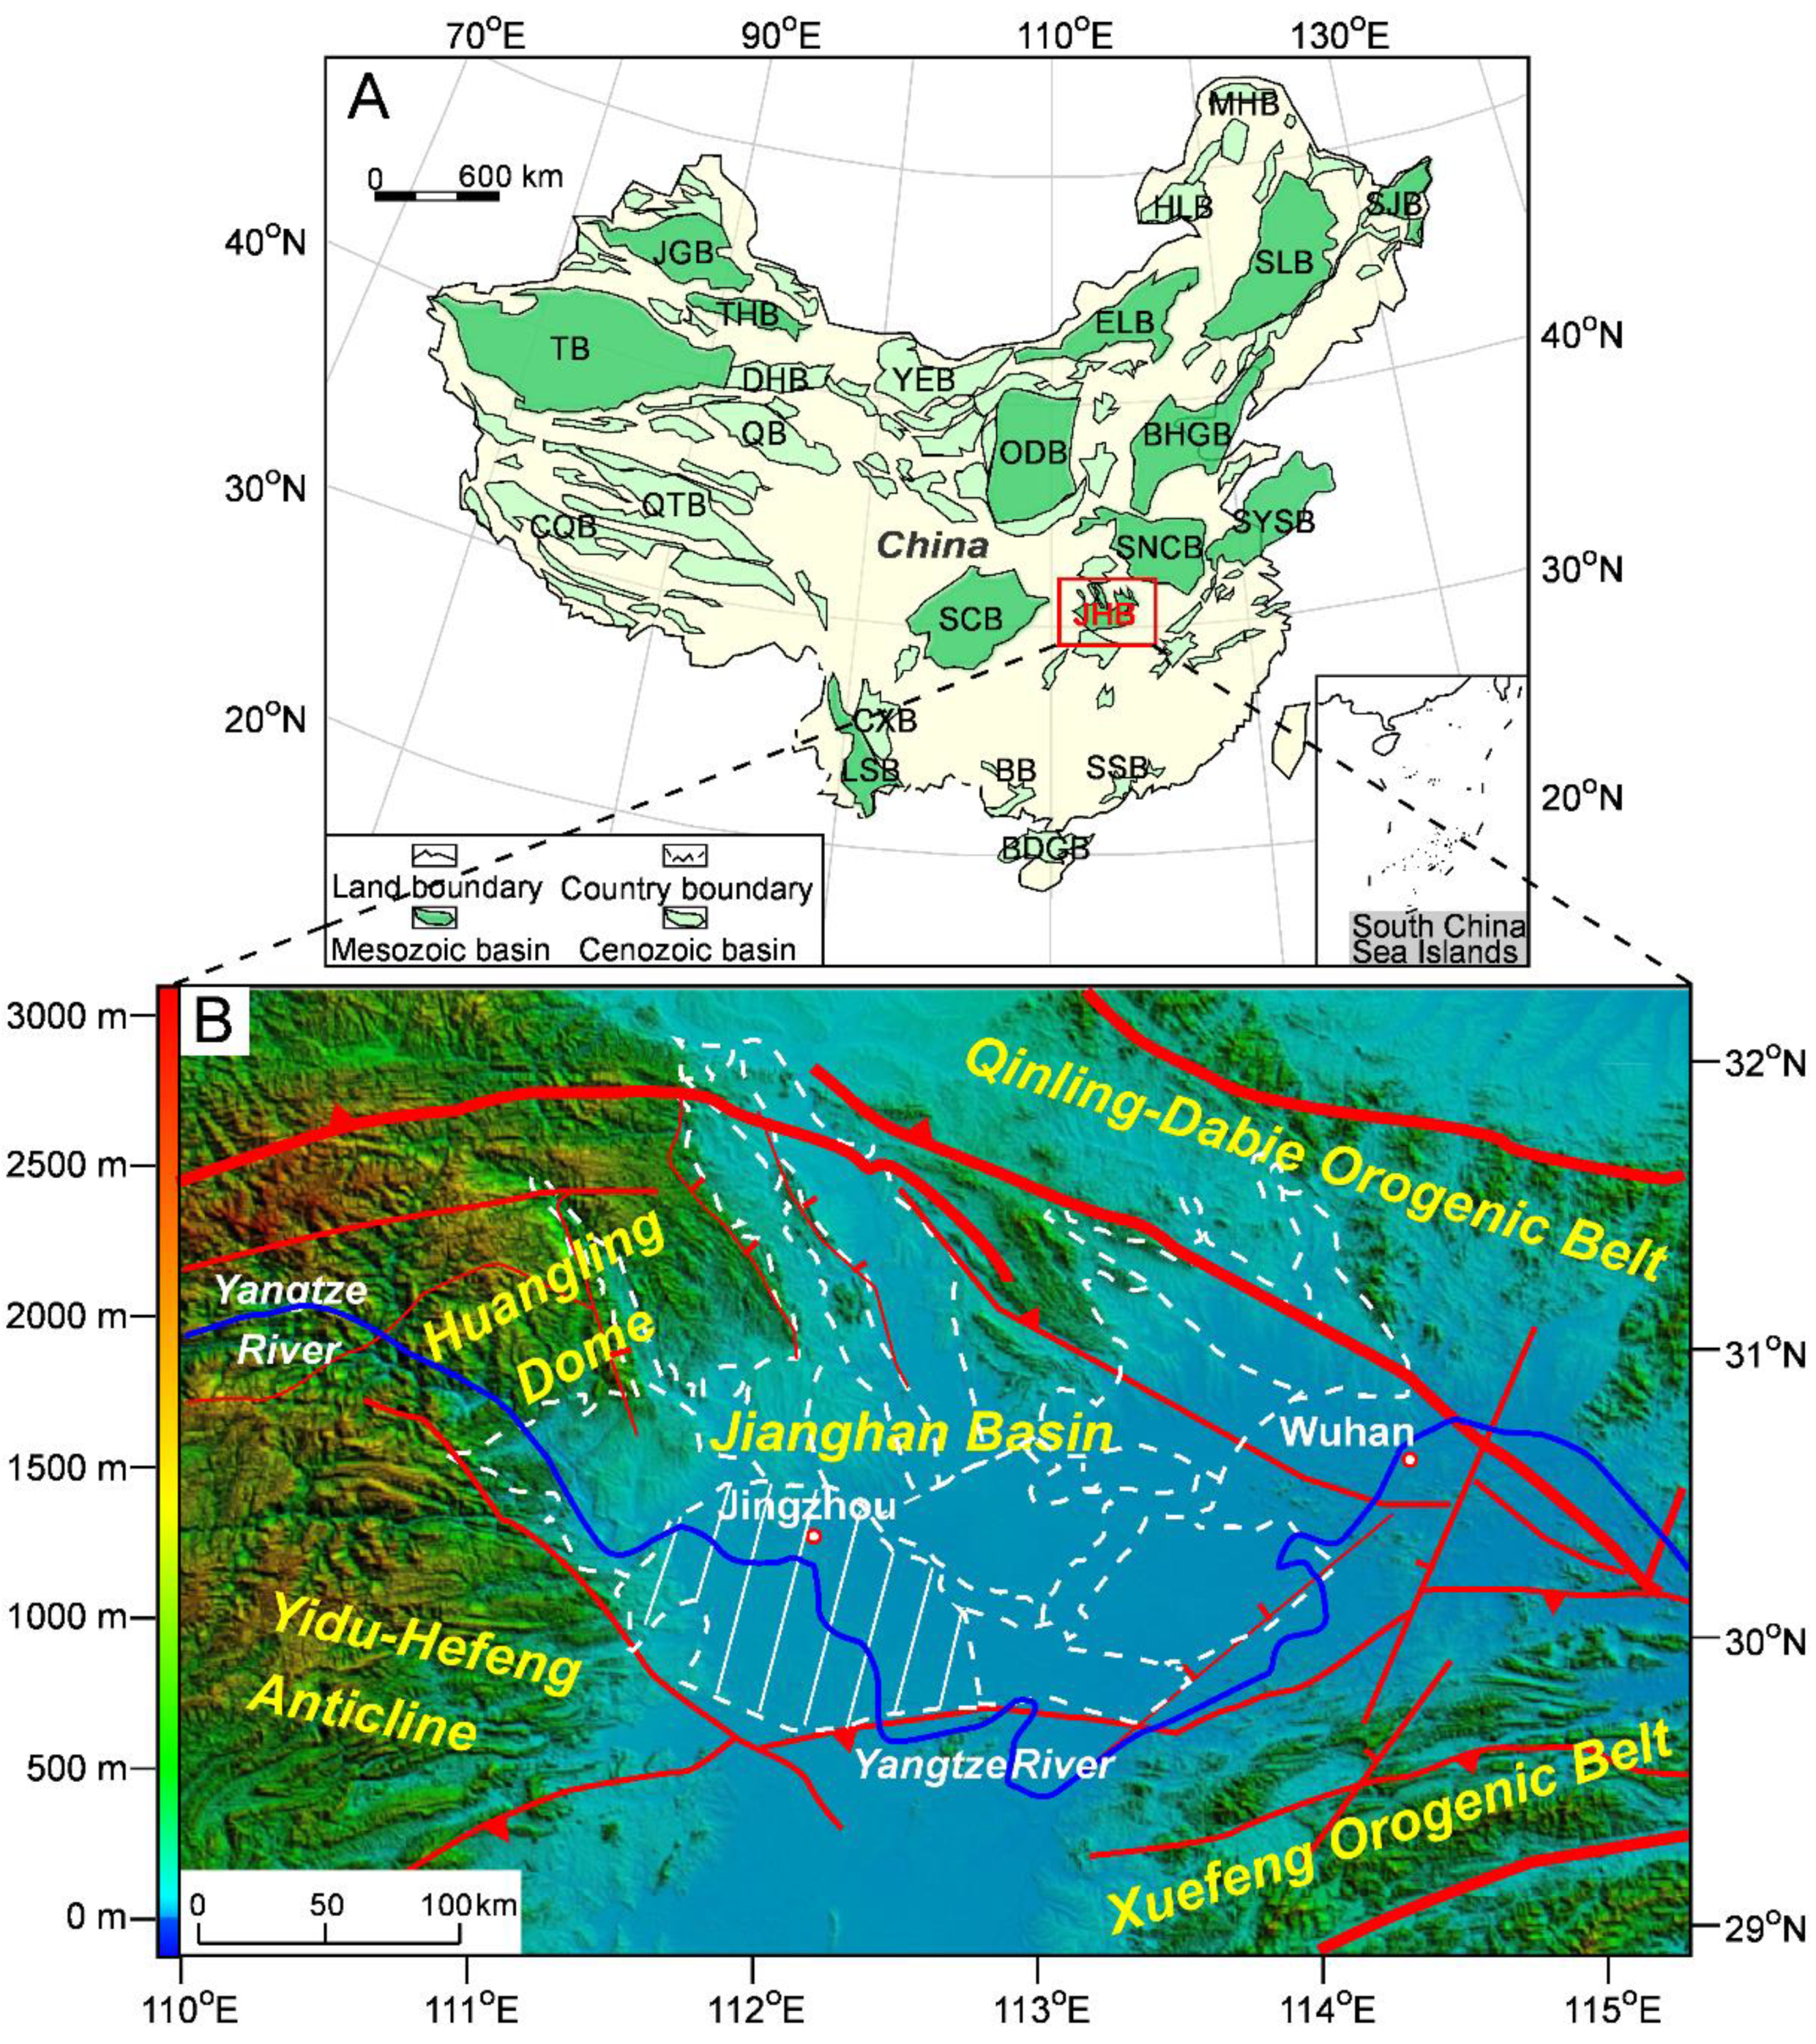
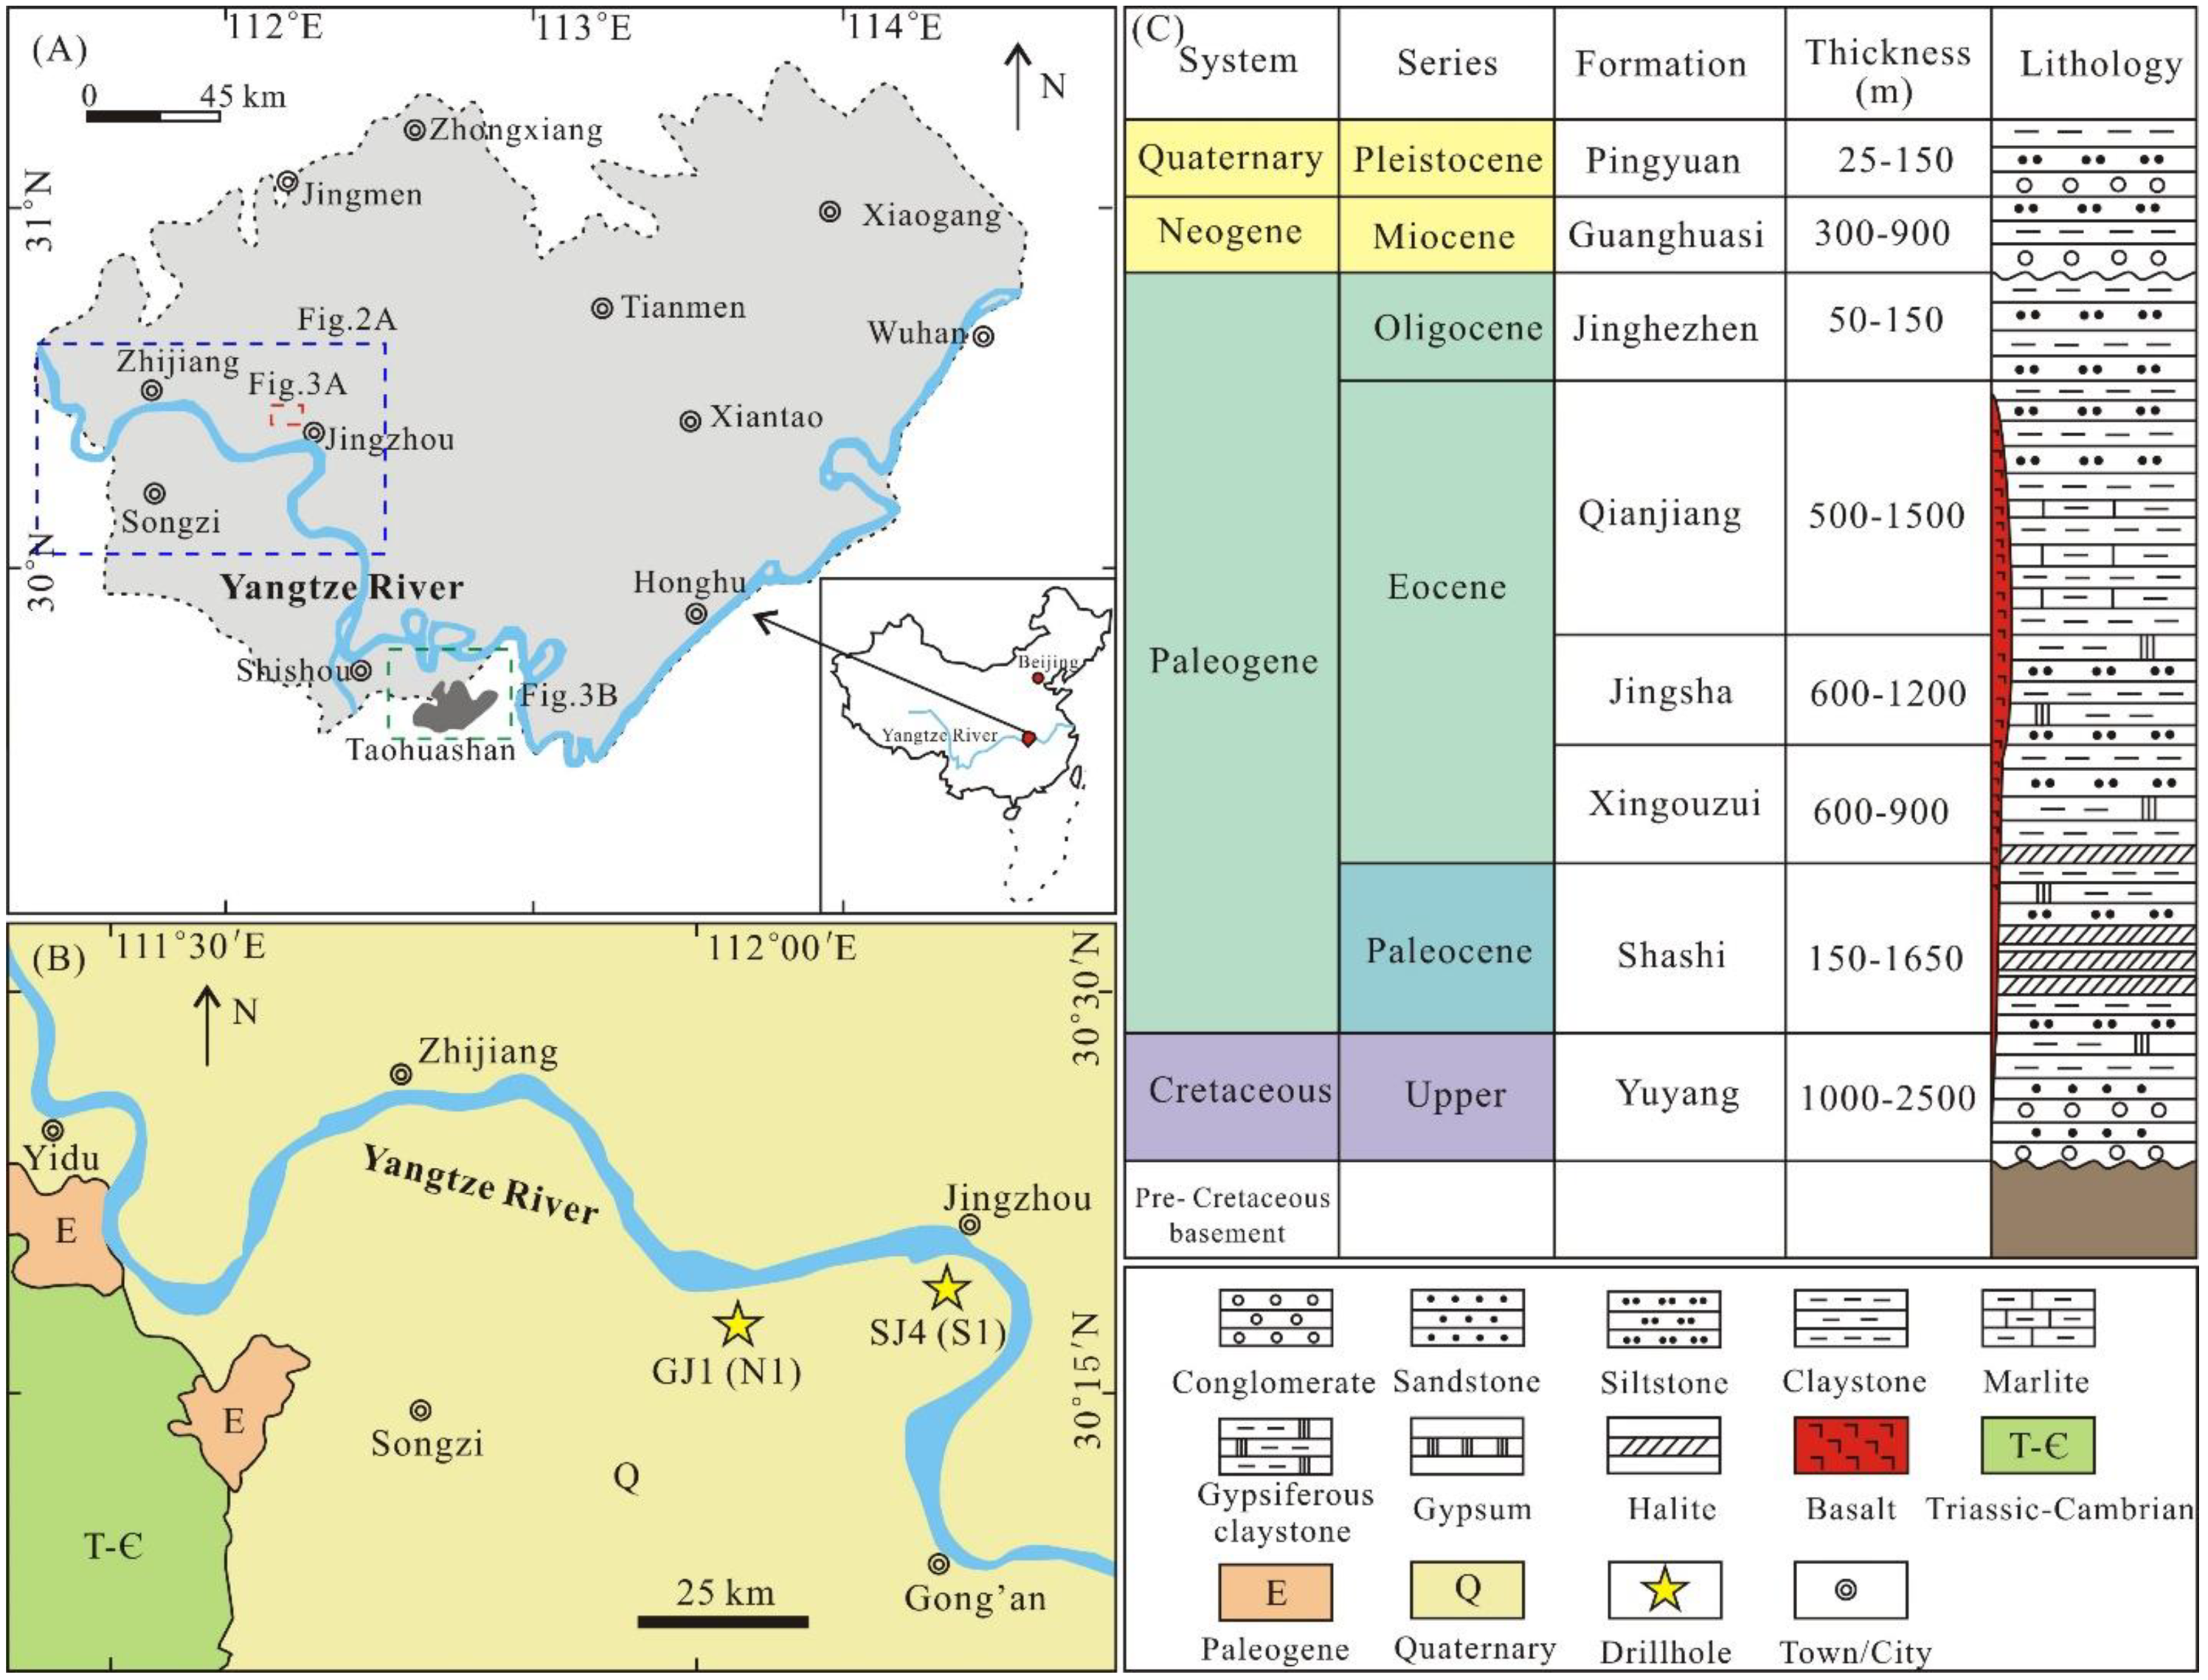
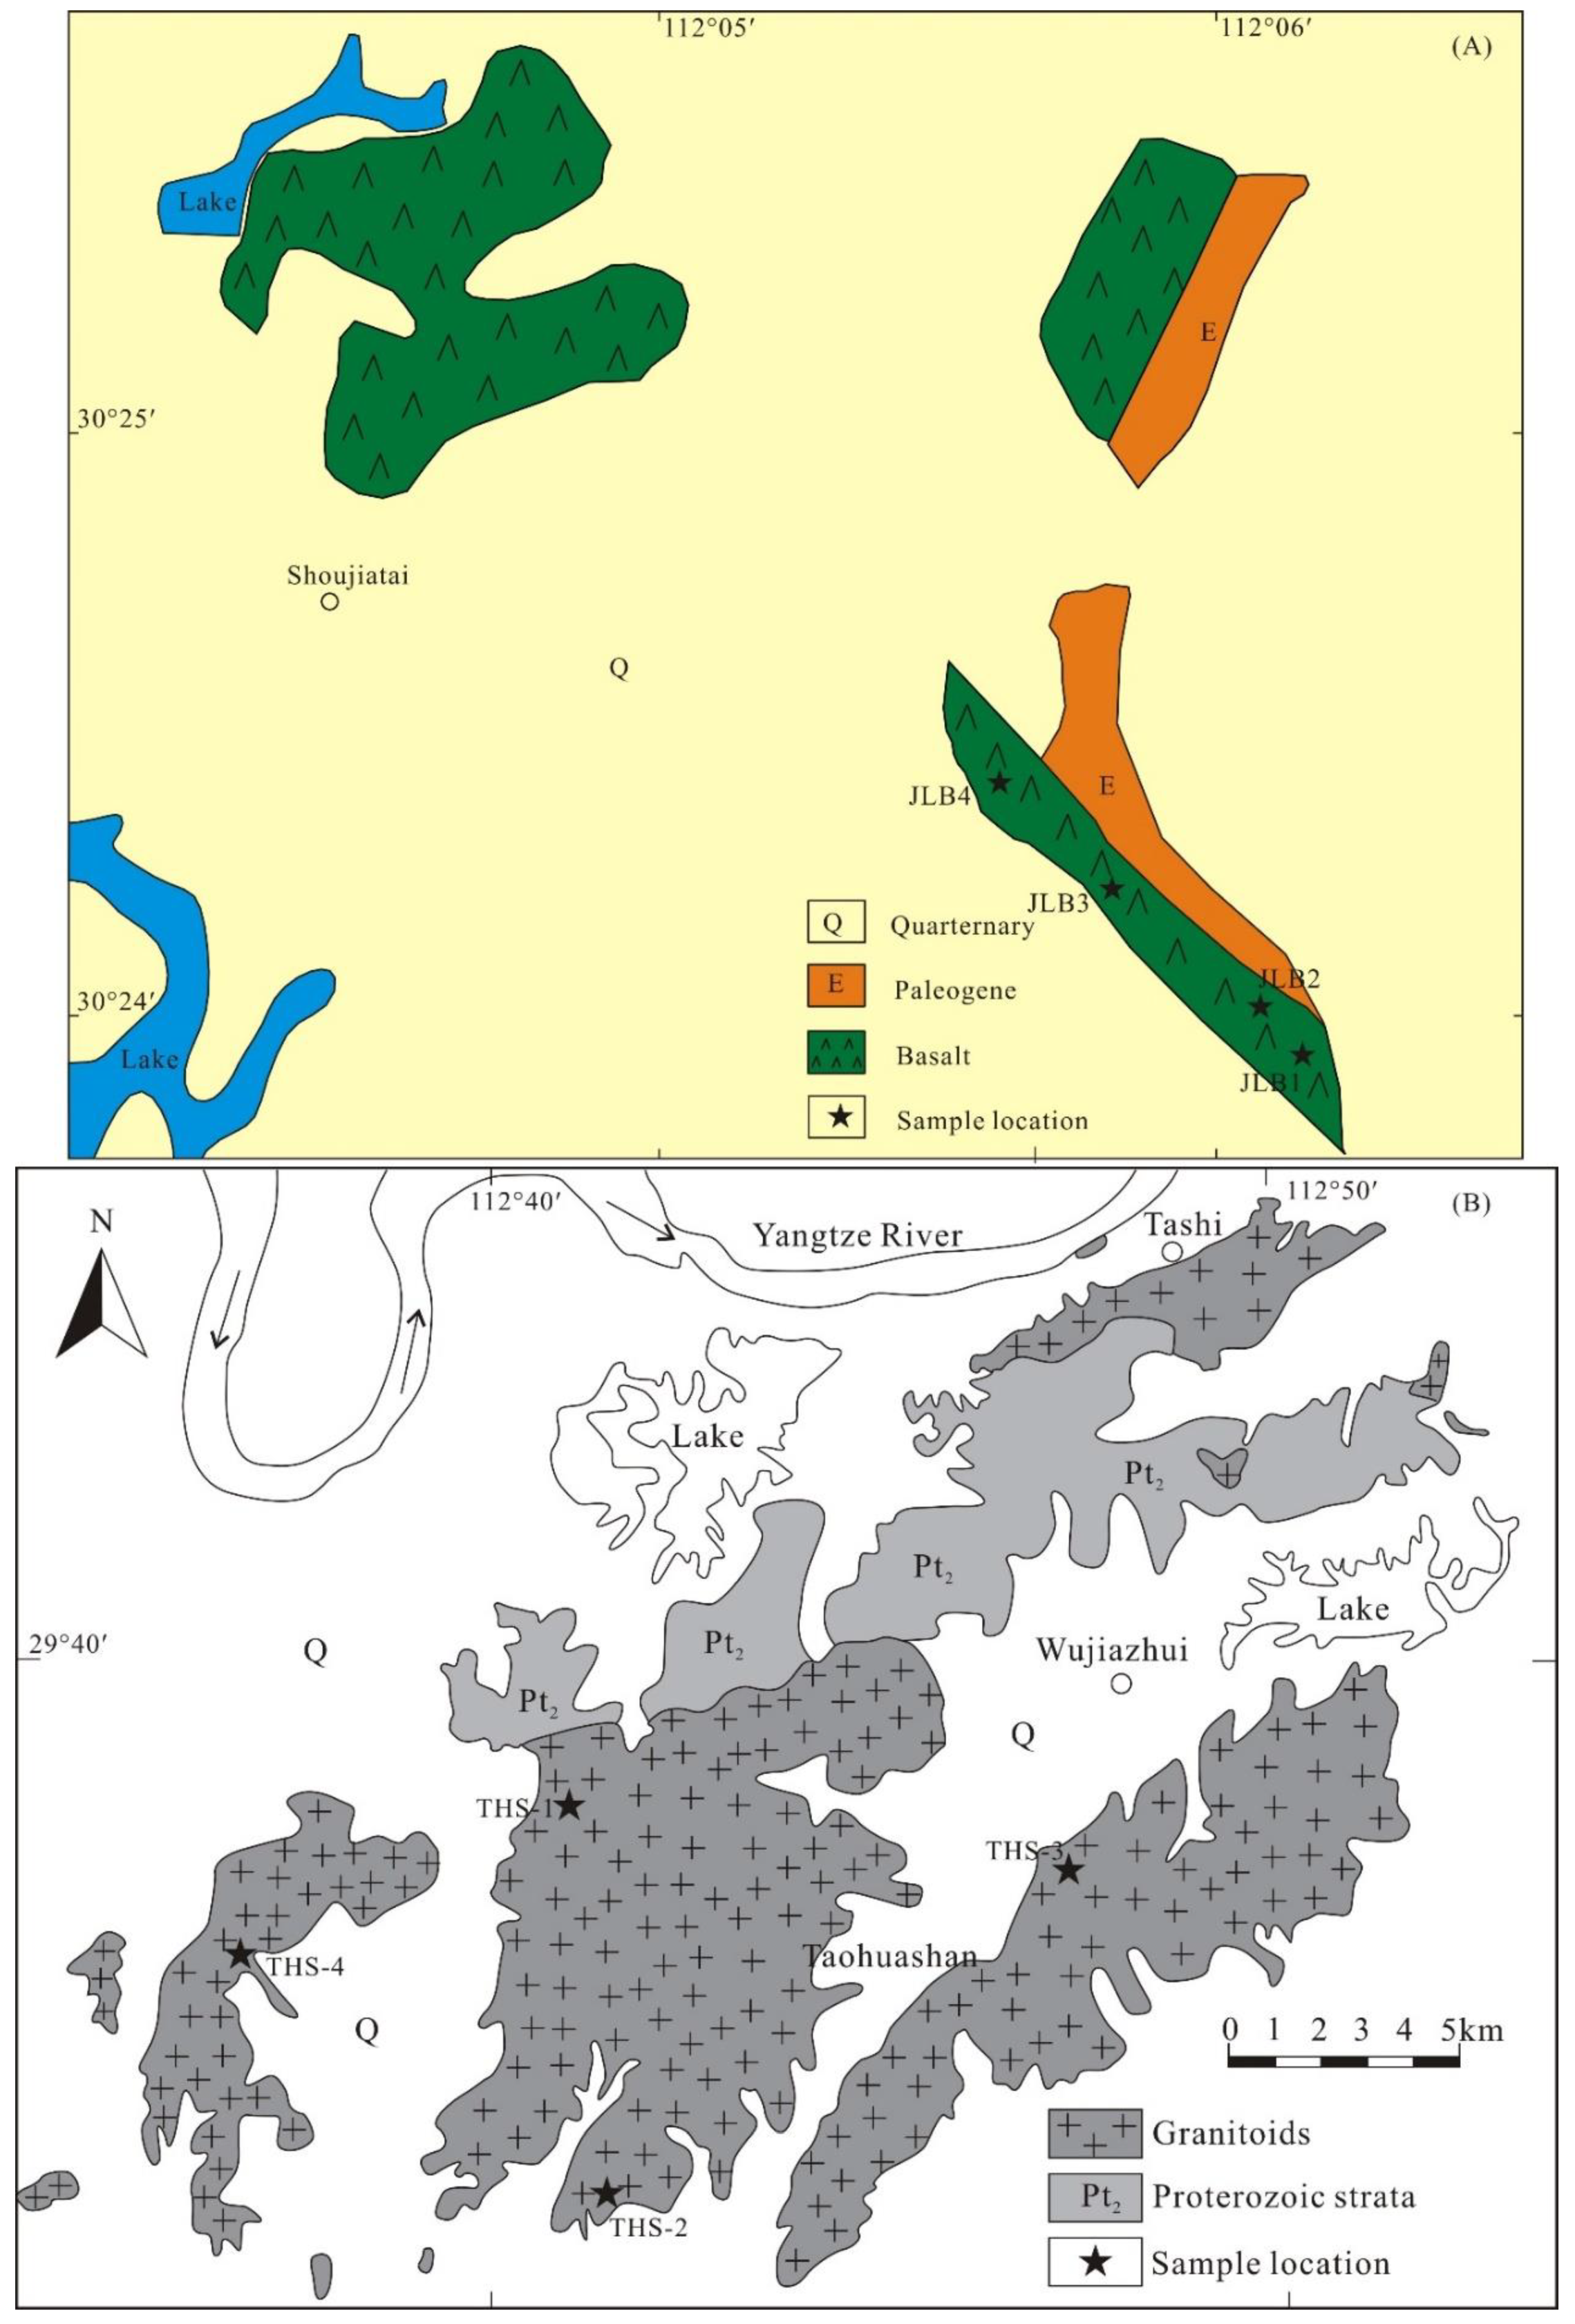
2. Geological Background

The Jianghan Basin, which covers an area of almost 36,360 km2, is located in Hubei Province in South China (Figure 1A). It is one of a series of northeast–southwest-oriented Mesozoic–Cenozoic continental rift basins in East Asia [32,33,34]. It formed in a back-arc extensional tectonic setting due to widespread regional extensional subsidence caused by the eastward rollback of the subducting Pacific Plate that has occurred since the Mesozoic [35,36,37]. The Jianghan Basin is bounded by NNE-trending normal faults and is underlain by the crystalline basement of the Yangtze Craton [38,39]. It is located between two Mesozoic orogenic belts: the Qinling–Dabie orogenic belt to the north and the Xuefeng orogenic belt to the south. It is also bordered to the west by the Huangling Dome along the Three Gorges of the Yangtze River [39] and to the southwest by the Yidu–Hefeng Anticline (Figure 1B).
The Jianghan Basin is surrounded by high mountains that are 1000~3000 m above sea level. Its periphery is surrounded by low hills with a height of more than 120 m, and the central area is a large plains area [41]. The interior of the basin is covered by Quaternary sediments, and the lower strata are exposed only at the edge of the basin (Figure 2A). The Yangtze River flows from the northwest to the southeast and then to the northeast (Figure 2B). There is hot-spring activity in the Songzi area of the basin. The Jianghan Basin is composed of Neoproterozoic to Middle Triassic marine carbonate rocks and continental shelf clastic rocks, Late Triassic to Early Cretaceous continental clastic rocks, and a large number of Late Cretaceous to Paleocene evaporite rocks and a clastic rock series interbedded with basalt (Figure 2C).
The Jiangling depression is a Late Cretaceous to Paleogene rift basin in the southwestern Jianghan Basin that covers an area of nearly 6500 km2. Volcanic rocks cover more than half of the depression, and the Qingshuikou fault, Jishansi fault, Wen’ansi fault, and Gong’an–Songzi fault are located at the edge of the depression, which jointly controls the formation and evolution of the depression. The Wancheng fault in the middle of the depression divides the depression into two parts. A large number of basalts are distributed in the northeastern Jiangling depression (Figure 3A). The area in which the basalt is distributed in the Jiangling depression reaches 3570 km2, and the basalt has a large accumulative thickness, with a maximum thickness of 588.6 m. The horizontal distribution and scale of the volcanic rock are controlled by the period and intensity of fault activity. At the same time, the distribution of basalt is controlled by the nearly east–west-oriented fault [9]. A large number of granites are distributed in the southeastern Jiangling depression. In the southeastern Jiangling depression, the granite distribution area can reach 1600 km2 on Taohuashan in the Huarong area (Figure 3B). The typical granites are mainly gneiss-like biotite monzonite, medium- to fine-grained biotite monzonite, medium-grained porphyritic biotite monzonite, and granitic pegmatite, which formed at 129 Ma in the Early Cretaceous [44]. These granites may have been the source of lithium in the brine [30].
The brine-type lithium and potassium deposits spatially intersect with basalts and granites. Therefore, it is speculated that the mineralization of the brine deposits may be affected by a deep source of materials [45,46].

3. Samples and Methods

Six brine samples were collected from two boreholes (wells GJ1 and SJ4) for this study. Samples N1-1, N1-2, and N1-3 were collected from well GJ1. Samples S1-1, S1-2, and S1-3 were collected from well SJ4. The brine from well GJ1 was collected from the Paleocene fractured mudstone reservoir at a depth of 3571 m. The brine from well SJ4 was collected from the basalt pore-type reservoir at a depth of 3880 m (Figure 2B). Four basalt samples were collected from a field outcrop in the Balingshan area in the northern Jiangling depression (Figure 3A). Four granite samples were collected from a field outcrop in the Taohuashan area in the southeast of the depression (Figure 3B).
The composition analysis of the potassium–lithium-rich brine and major elements was completed by the National Geological Testing Center, in which Cl and SO4 were tested by the titration method of AgNO3 and BaCl2, and the analysis error was less than 3%. The other main elements were tested by inductively coupled plasma optical emission spectroscopy (ICP-OES), and the analysis error was less than 5%. Trace elements were determined by plasma mass spectrometry (X-series).
Through the microscopic identification of thin sections, petrography of the igneous rock was studied to determine the mineral assemblage, composition, structure, alteration characteristics of the surrounding rock, rock type, and inclusions in the rock.
Some fresh granite and basalt samples were selected and crushed to 200 mesh and sent to the National Geological Experiment and Test Center of the Ministry of Natural and Resources for major and trace element analyses. The major elements were detected by fused X-ray fluorescence spectrometry (XRF-PW4400) based on GB/T14506.28-2010, and the analysis error was less than 2–5%. Trace elements were detected by plasma mass spectrometer (ICPMS-PE300D) based on GB/T14506.30-2010, and the analysis error was less than 5–10%.
The appropriate granite and basalt samples were selected, the weathered and attached objects on the surface of the samples were removed, and the samples were coarsely crushed. After cleaning and drying, the samples were finely crushed to a size of 60~80 mesh with a crushing machine, from which 20 g samples were sifted. Attention was given to ensure that the samples were clean and not contaminated. Water–rock reaction experiments were carried out in the laboratory with a reactor device at different temperatures, reaction times, fluid compositions, and fluid types, and the reaction products were measured by inductively coupled plasma atomic emission spectrometry (ICP-AES). The experiment of the water-rock reaction due to static immersion of igneous rock was carried out under normal temperature and pressure conditions. The reaction fluid conditions were distilled water, 1 mol/L NaCl, 2 mol/L NaCl, pH = 5, and pH = 8, and the sampling times were on the 1st, 5th, 11th, 19th, 29th, 41st, and 55th days. To explore the influence of reaction time on the dissolved elements, one granite sample and one basalt sample were selected for this experiment. The reaction solution was a 1 mol/L NaCl solution, the total reaction time was 6 h, the reaction temperature was 150 °C, the average sampling time was once per hour, and the two samples were sampled 12 times in total. To explore the effect of reaction temperature and fluid composition on the element dissolution amount, one basalt sample and one granite sample were selected; the reaction time was 4 h; the reaction temperatures were 200, 250, 300, 350, and 400 °C; the reaction fluid was distilled water and 1 mol/L NaCl solution; and each sample was sampled 10 times fora total of 20 times.

4. Results

4.1. Brine Composition

According to the observations from two boreholes (GJ1 and SJ4), the brine deposits are distributed from 1500 m to 5000 m underground in the basin. Brine occurs in tectonic fracture zones, sandstone pores, and basalt fractures of the Paleocene Shashi and Xin’gouzui formations [9]. Brine is pressure-bearing. The results of large-scale pumping experiments show that the water flow in multiple wells is stable, and the water inflow in each well is more than 1000 m3/d. The lithium and potassium content in the deep-buried brine reaches industrial grade, and it also contains other beneficial components such as B and Br (Table 1). The contents of sodium, chloride, potassium, calcium, sulfate, lithium, boron, and strontium are 102.97–113.93 g/L, 182.68–202.02 g/L, 6.32–10.35 g/L, 4.16–13.56 g/L, 0.24–0.54 g/L, 44.15–107.41 mg/L, 588.23–971.99 mg/L, and 402.02–1031.70 mg/L, respectively (Table 1).
The SiO2 content in the basalt ranges from 48.03% to 52.55%, with an average value of 50.92%. The Na2O content varies from 3.85% to 5.56%, with an average of 4.79%. The K2O content varies from 0.36% to 2.05%, with an average of 1.00%; the Al2O3 content varies from 12.30% to 14.00%, with an average of 13.45%; and the CaO content varies from 4.23% to 7.35%, with an average of 5.76%.

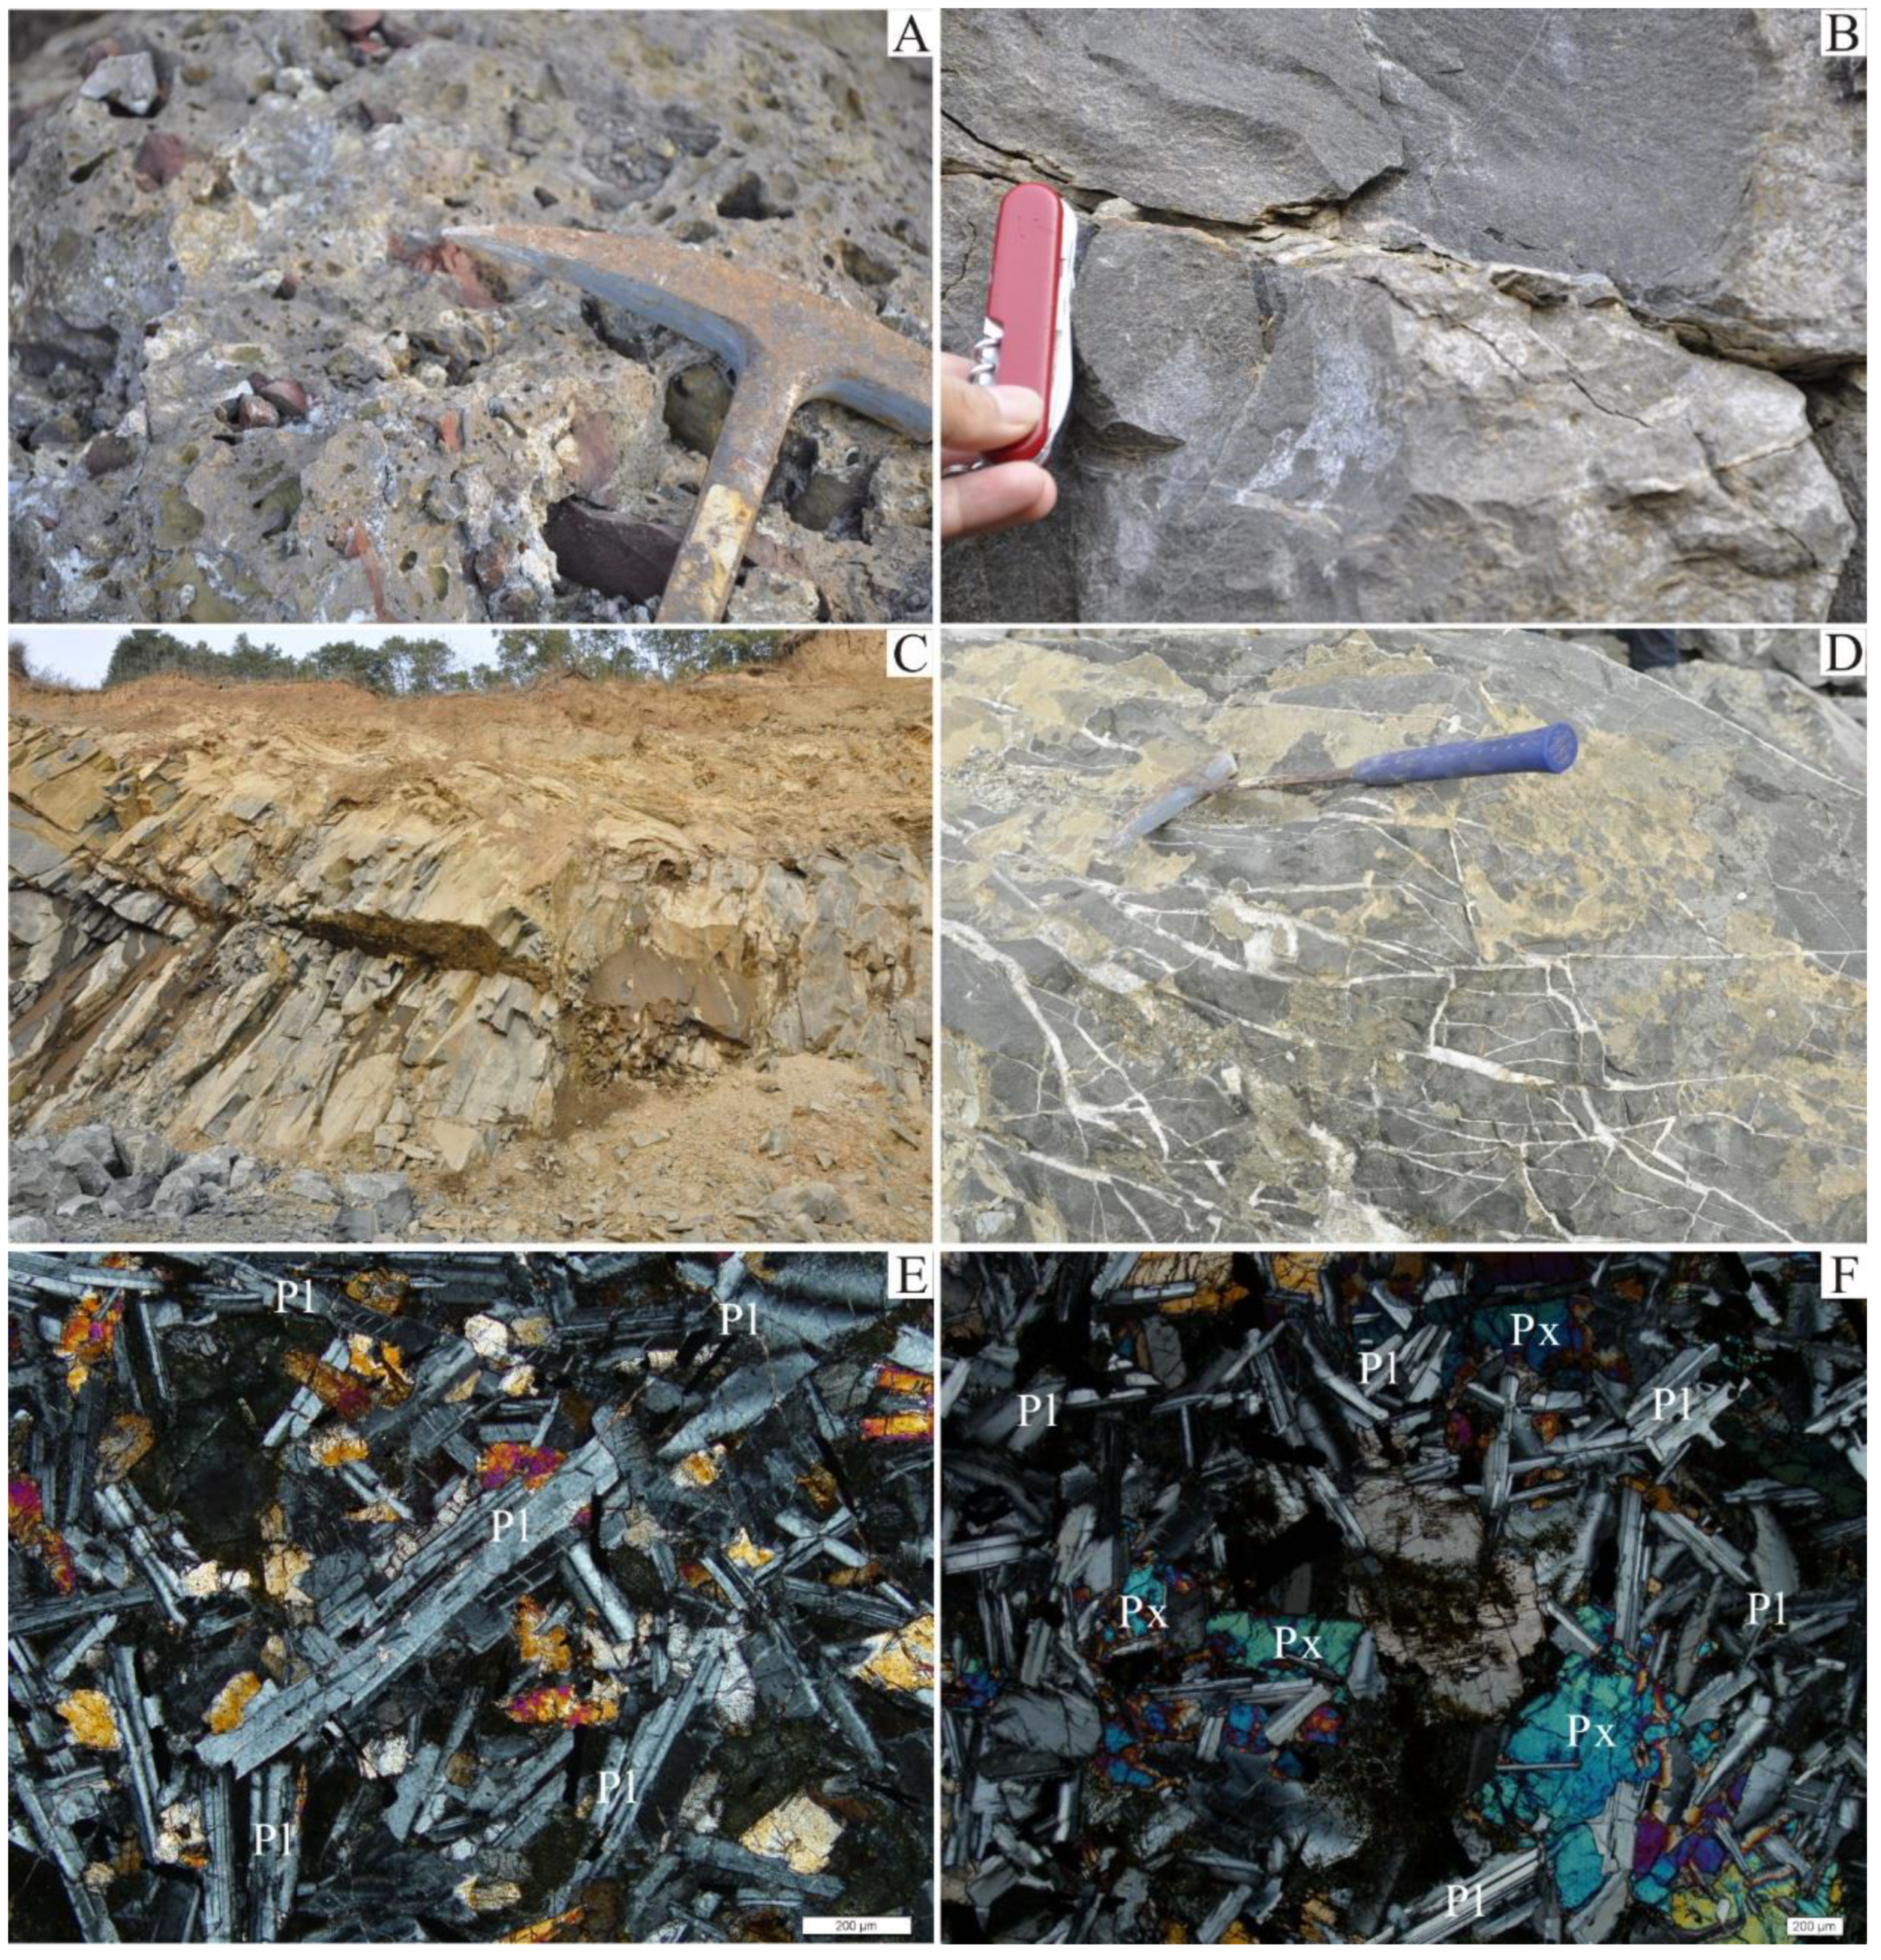
4.2. Petrology and Mineralogy

4.2.1. Basalt

Basalt is the most widely distributed volcanic rock in the Jiangling depression. Longitudinally, it is characterized by the alternating occurrence of red stomatal nodular basalt and dark grey dense massive basalt (Figure 4A and Figure 5B). The pores of the red stomatal nodular basalt are filled with minerals such as zeolite, chlorite, calcite, and opal (Figure 4A). The dark grey-green dense massive basalt has columnar joints (Figure 4C), in which the calcite and quartz veins are extremely well developed, ranging from 1 to 5 cm in width, most often up to several meters (Figure 4D). Microscopic observation shows that the basalt has an obvious intergranular structure, and olivine alteration is strong, resulting in chloritization and iddingsitization (Figure 4E). Plagioclase and pyroxene are the main weakly altered rock-forming minerals (Figure 4F), and the accessory minerals are mainly magnetite, ilmenite, apatite, etc.
According to the major element analysis of basalt samples in the Jiangling depression (Table 2), the SiO2 content in the basalt ranges from 52.86% to 53.10%, with an average value of 52.99%. The Na2O content varies from 3.24% to 3.87%, with an average of 3.48%. The K2O content varies from 1.03% to 1.20%, with an average of 1.09%. The Al2O3 content ranges from 13.03% to 14.00%, with an average of 13.54%. The CaO content ranges from 6.23% to 8.55%, with an average of 7.34%.

4.2.2. Granite

The analysis results of the major element composition of granite around the Jiangling depression (Table 3) reveal that the SiO2 content in granite is high, ranging from 70.33% to 73.05%, with an average of 71.37%; the content of K2O varies from 4.64% to 5.35%, with an average of 5.04%; the content of Na2O varies from 2.88% to 3.62%, with an average of 3.20%; the content of Al2O3 varies from 14.10% to 15.14%, with an average of 14.68%; and the content of CaO ranges from 1.26% to 2.04%, with an average of 1.76%.

4.3. Experiment Results of the Water–Rock Reaction Due to Basalt Static Immersion

The experimental results of the water–rock reaction due to static immersion are shown in Table 4.

4.4. Results of High-Temperature Water–Rock Reactions

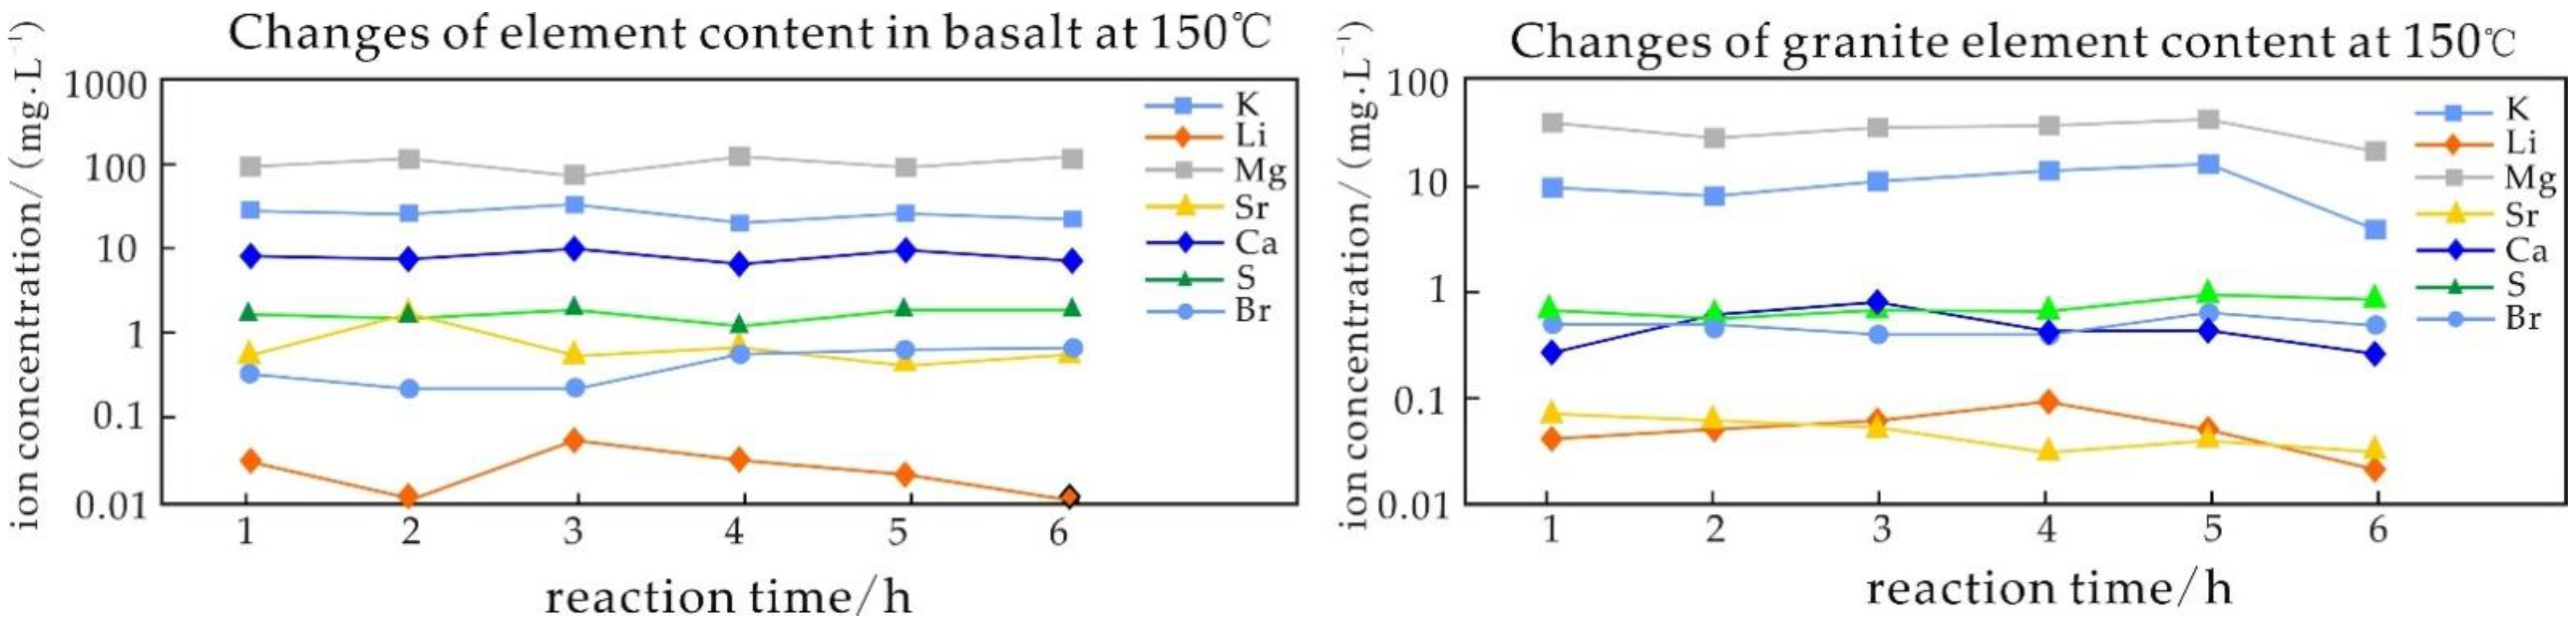
4.4.1. Experiment of Water–Rock Reactions over Time

The experimental results of water–rock reactions over time are shown in Table 5.

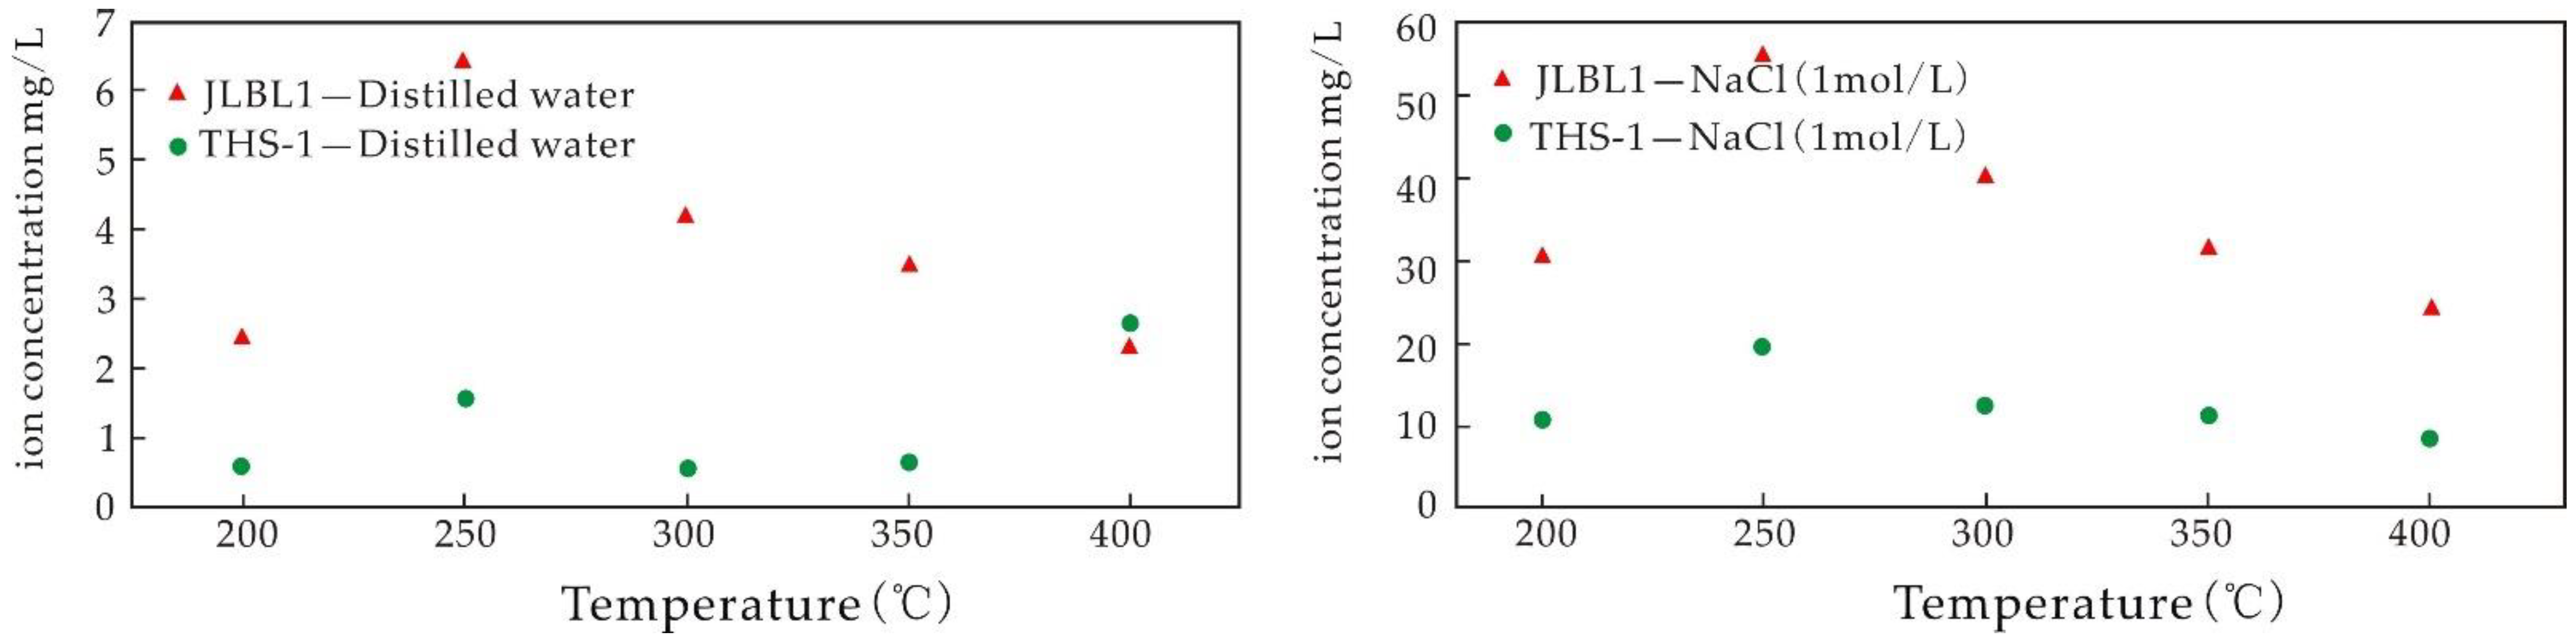
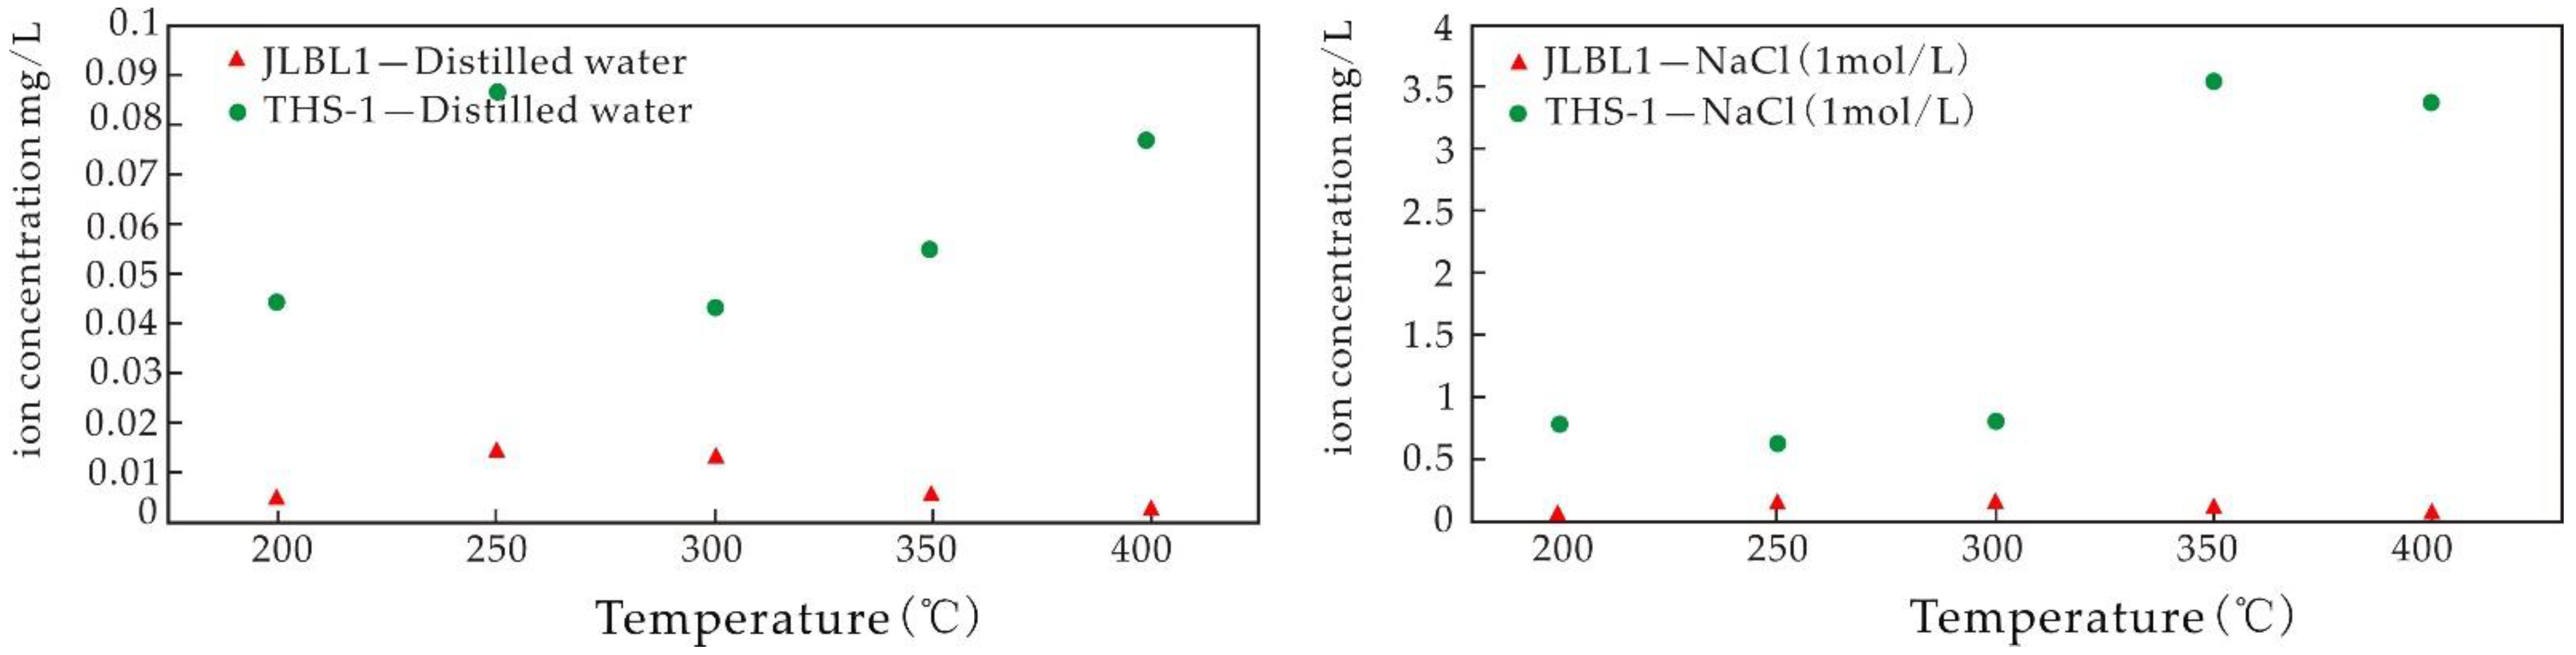
4.4.2. Experiment of Water–Rock Reactions with Variable Temperatures

The experimental results of water–rock reactions with variable temperature are shown in Table 6.

5. Discussion

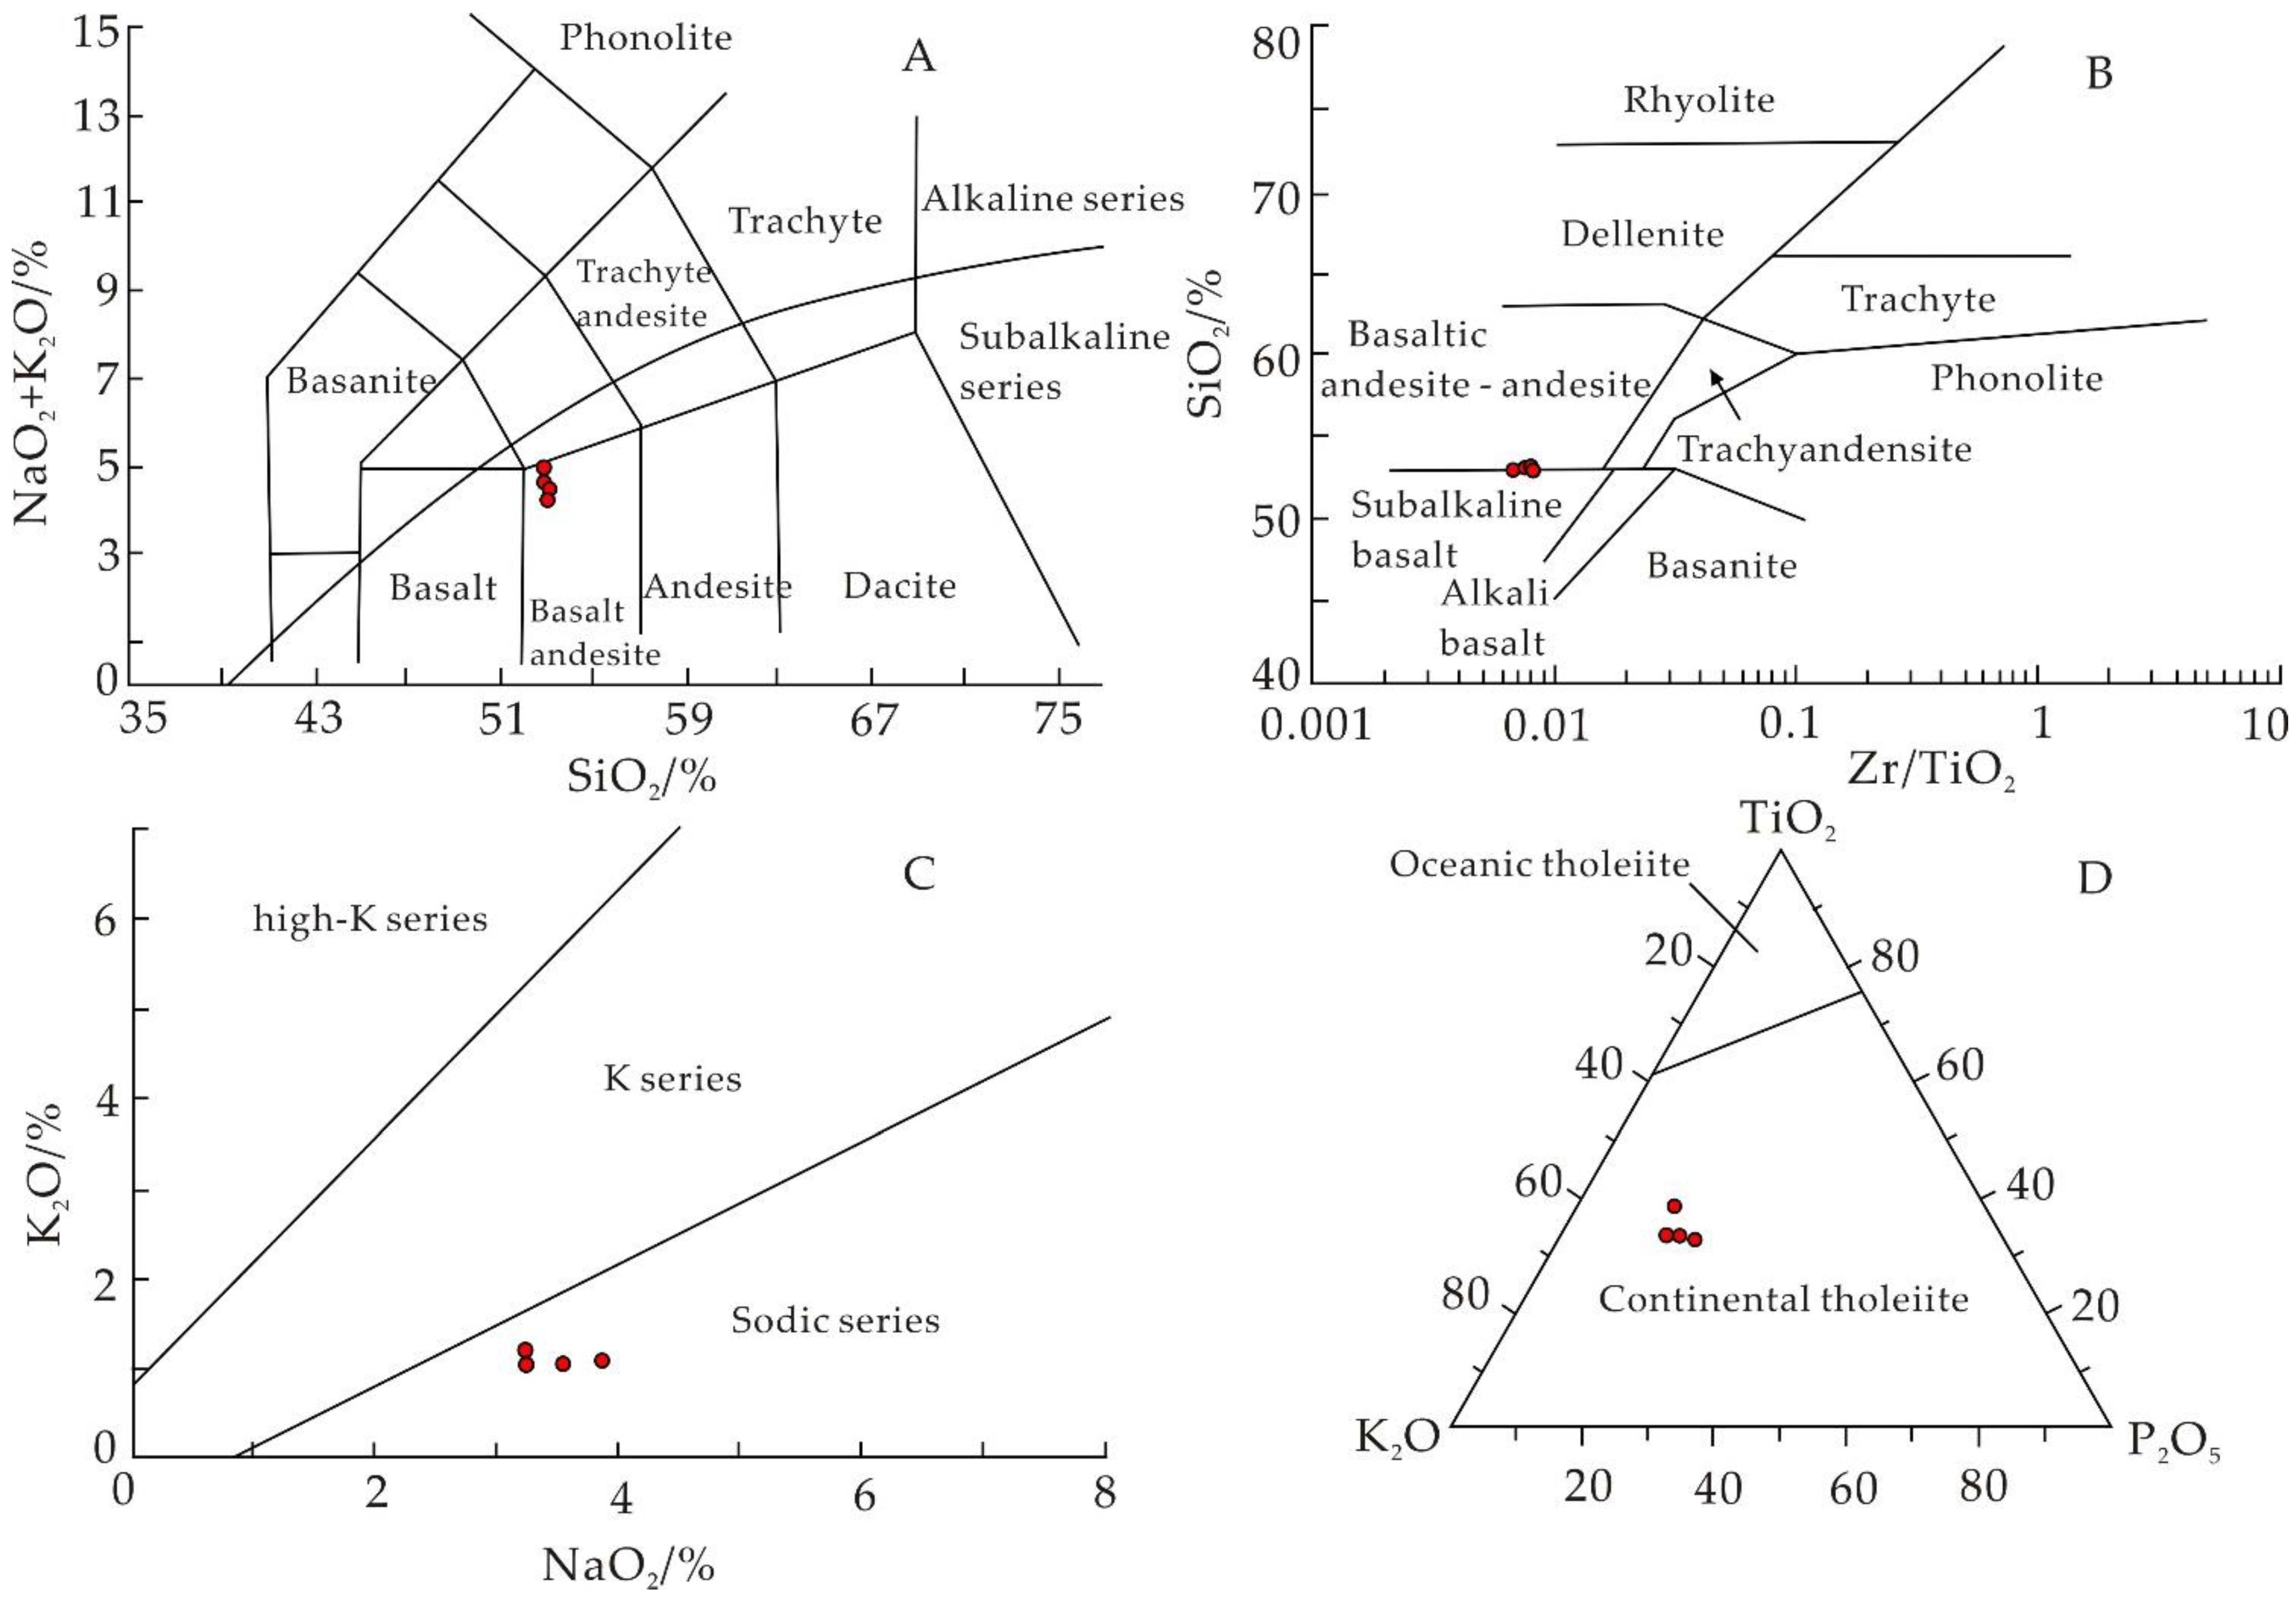
5.1. Geochemical Characteristics

The total Na+K content, namely the Na2O+K2O content, is medium and high (7.52~9.08). In the SiO2–(Na2O+K2O) diagram (Figure 5A), granite samples are plotted in the granite field, indicating that the magma around the Jianghan Basin has been differentiated to different degrees. In the SiO2–K2O diagram (Figure 5B), all the granite samples except the altered samples are plotted in the shoshonite series area, and all the other granite samples are plotted in the high-K calc-alkaline area. In A-CN-K compositional space, the aluminum saturation index ranges from 1.35 to 1.53, with an average of 1.45. All of the granites are strongly peraluminous. The AKI value of the over-alkaline index ranges from 0.70 to 0.83, with an average of 0.73, indicating that it is over-alkaline. According to previous studies, acidic and alkaline rocks are favorable for the accumulation of lithium [49]. Therefore, the granite on the periphery of the Jiangling Basin is favorable for the enrichment of lithium. Rb, Ba, and Zr are relatively enriched in the granites, showing the common characteristics of high-evolution granites in South China and indicating that the granites have undergone strong differentiation evolution.
According to the petrogeochemical characteristics of volcanic rocks, elemental analysis of basalt samples in the Jianghan Basin (Table 2) and CIPW standard mineral calculations can be used to determine the specific types of basalt. As shown in Figure 6A, the samples are plotted in the basaltic andesite region of the sub-alkaline series. According to the calculation results of CIPW standard minerals by Yu et al. (1996) [51], the basalt can be further divided into three categories: quartz tholeiite, olivine tholeiite, and alkaline olivine basalt. They all belong to the sodic series and formed in a continental environment (Figure 6B–D). The basalts in the Jiangling depression are tholeiite- and potassium-rich basalts, which may provide abundant material sources for potassium-rich brine.

5.2. Determination of the Starting and Stopping Temperatures of the Water–Rock Reaction

The homogenization temperature range of gas–liquid two-phase inclusions in granite varies greatly, with a concentration range of 170–230 °C and an average homogenization temperature of 210.1 °C, indicating that the fluid temperature of the water–rock reaction is high, and the lowest temperature of mineralization is 210.1 °C [53]. Therefore, the initial temperature of the water–rock reaction in igneous rock was set at 150–200 °C, and the experimental temperature range was set at 150–400 °C to explore the effect of the water–rock reaction on brine mineralization.

5.3. Discussion on the Genesis of Lithium–Potassium-Rich Brine

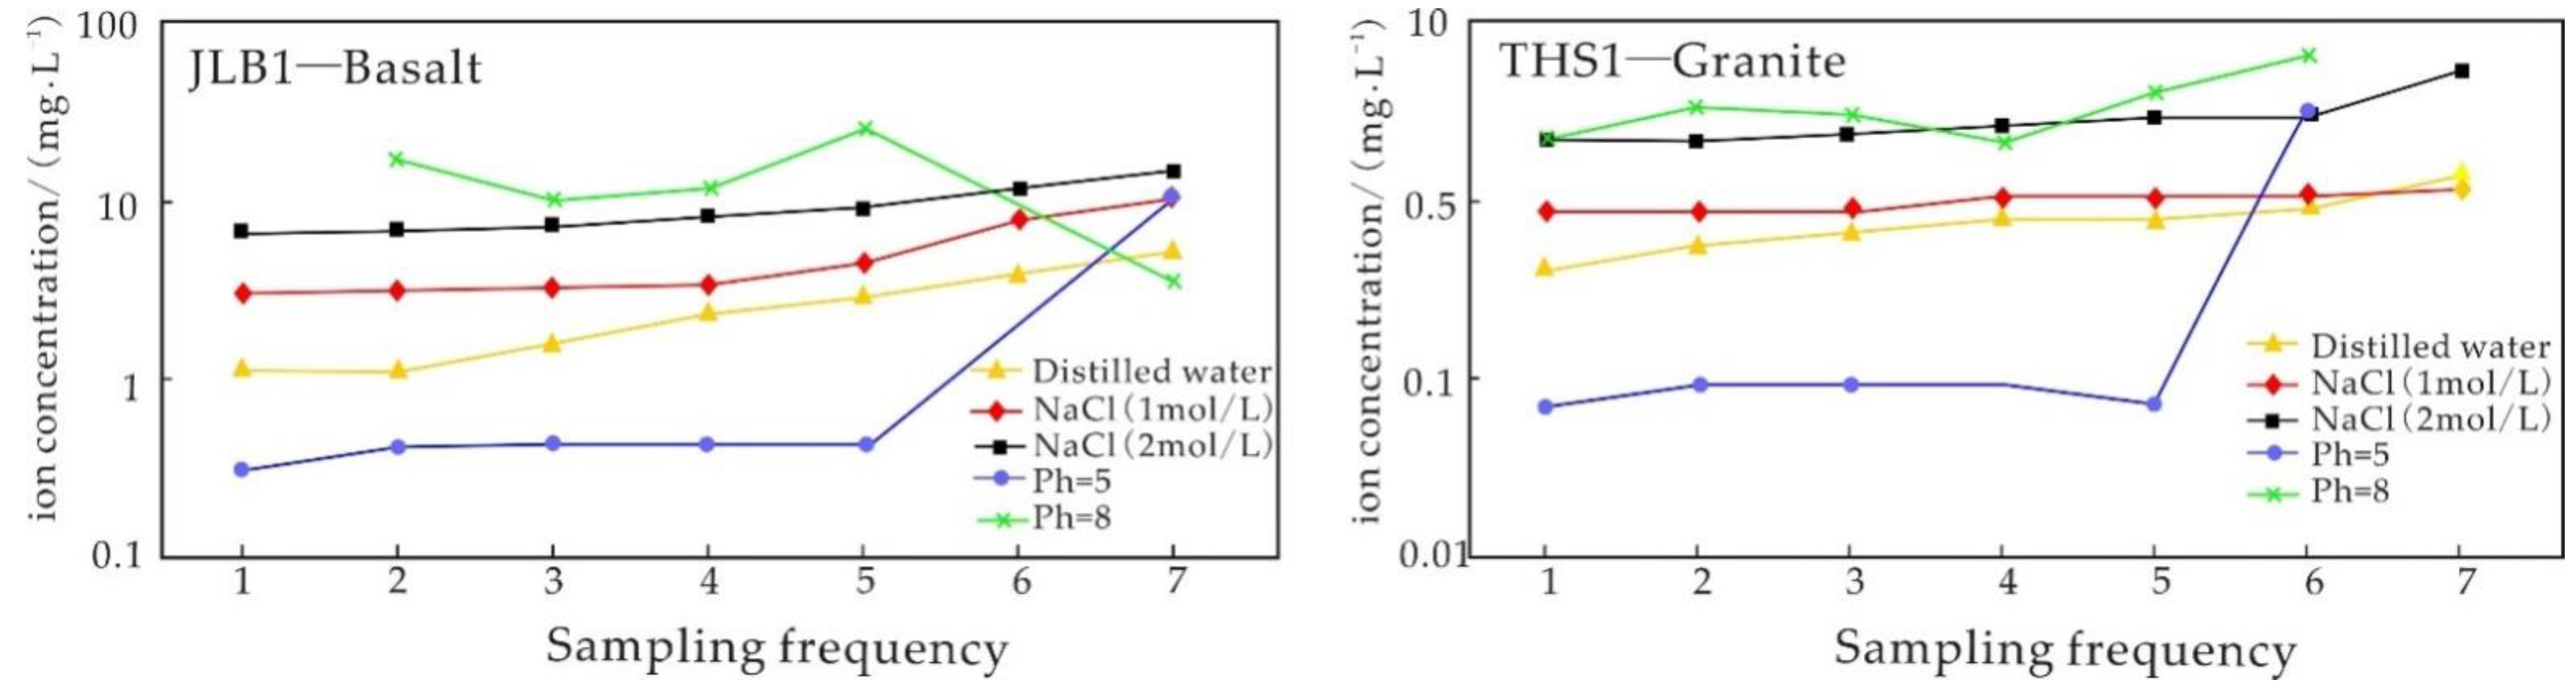
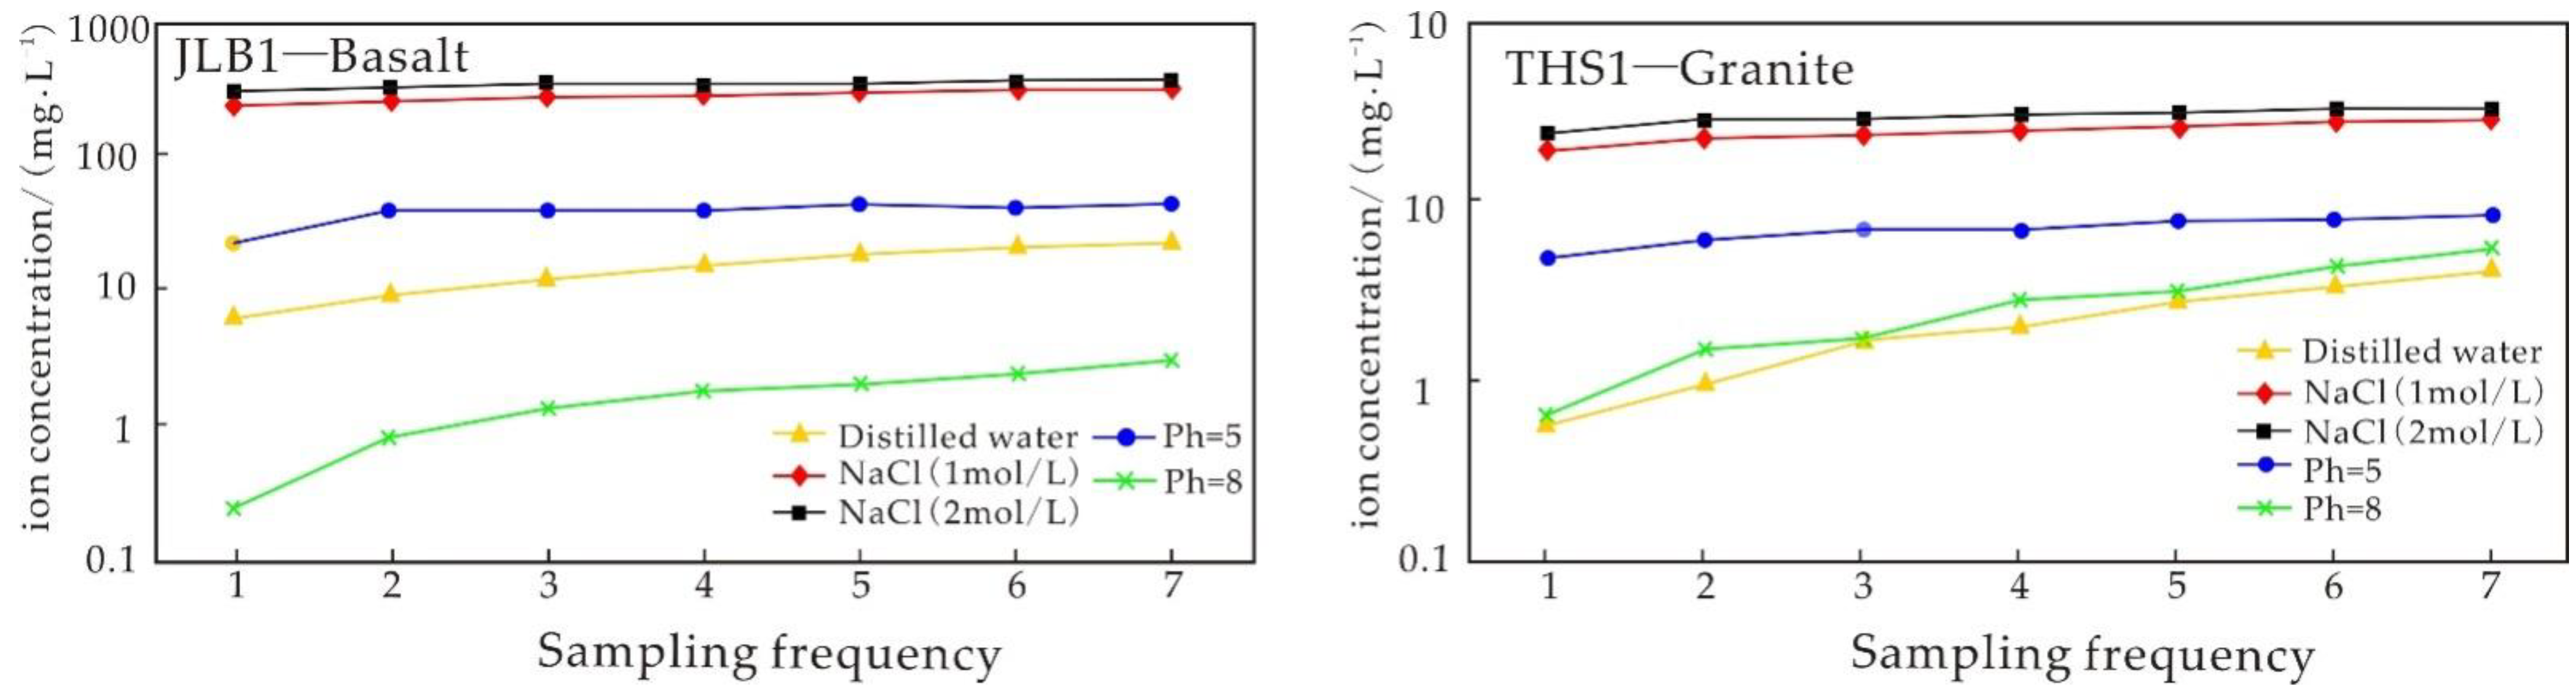
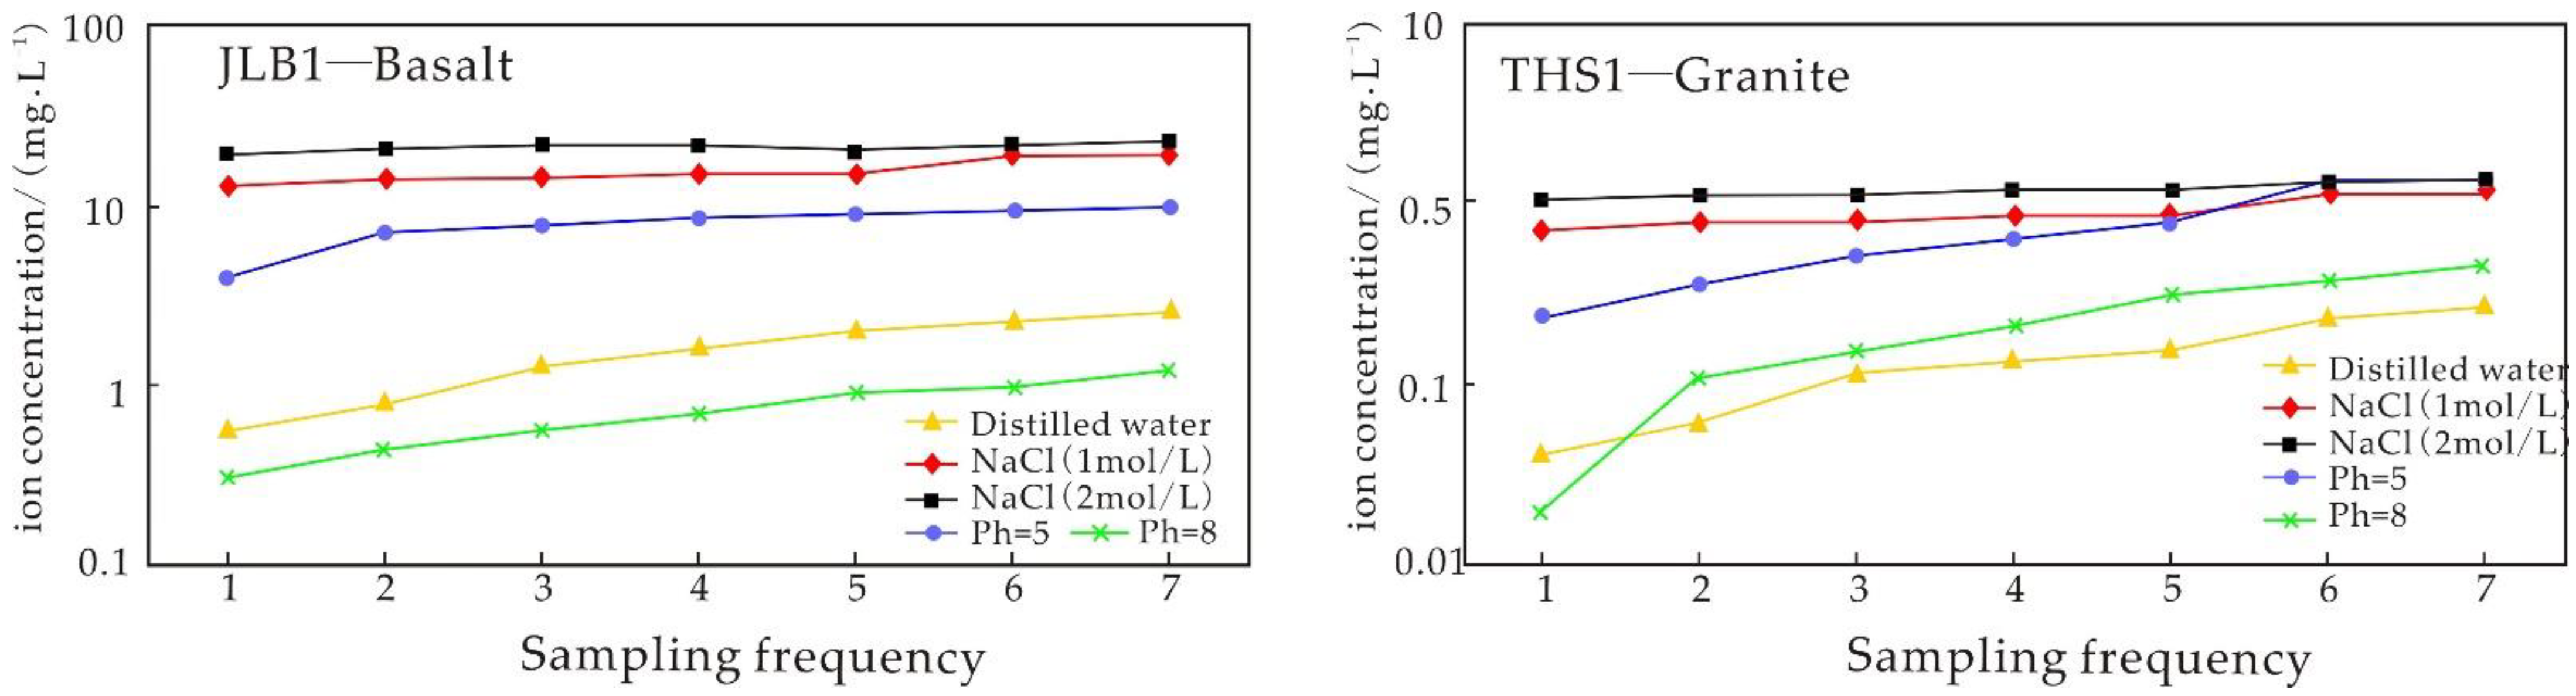
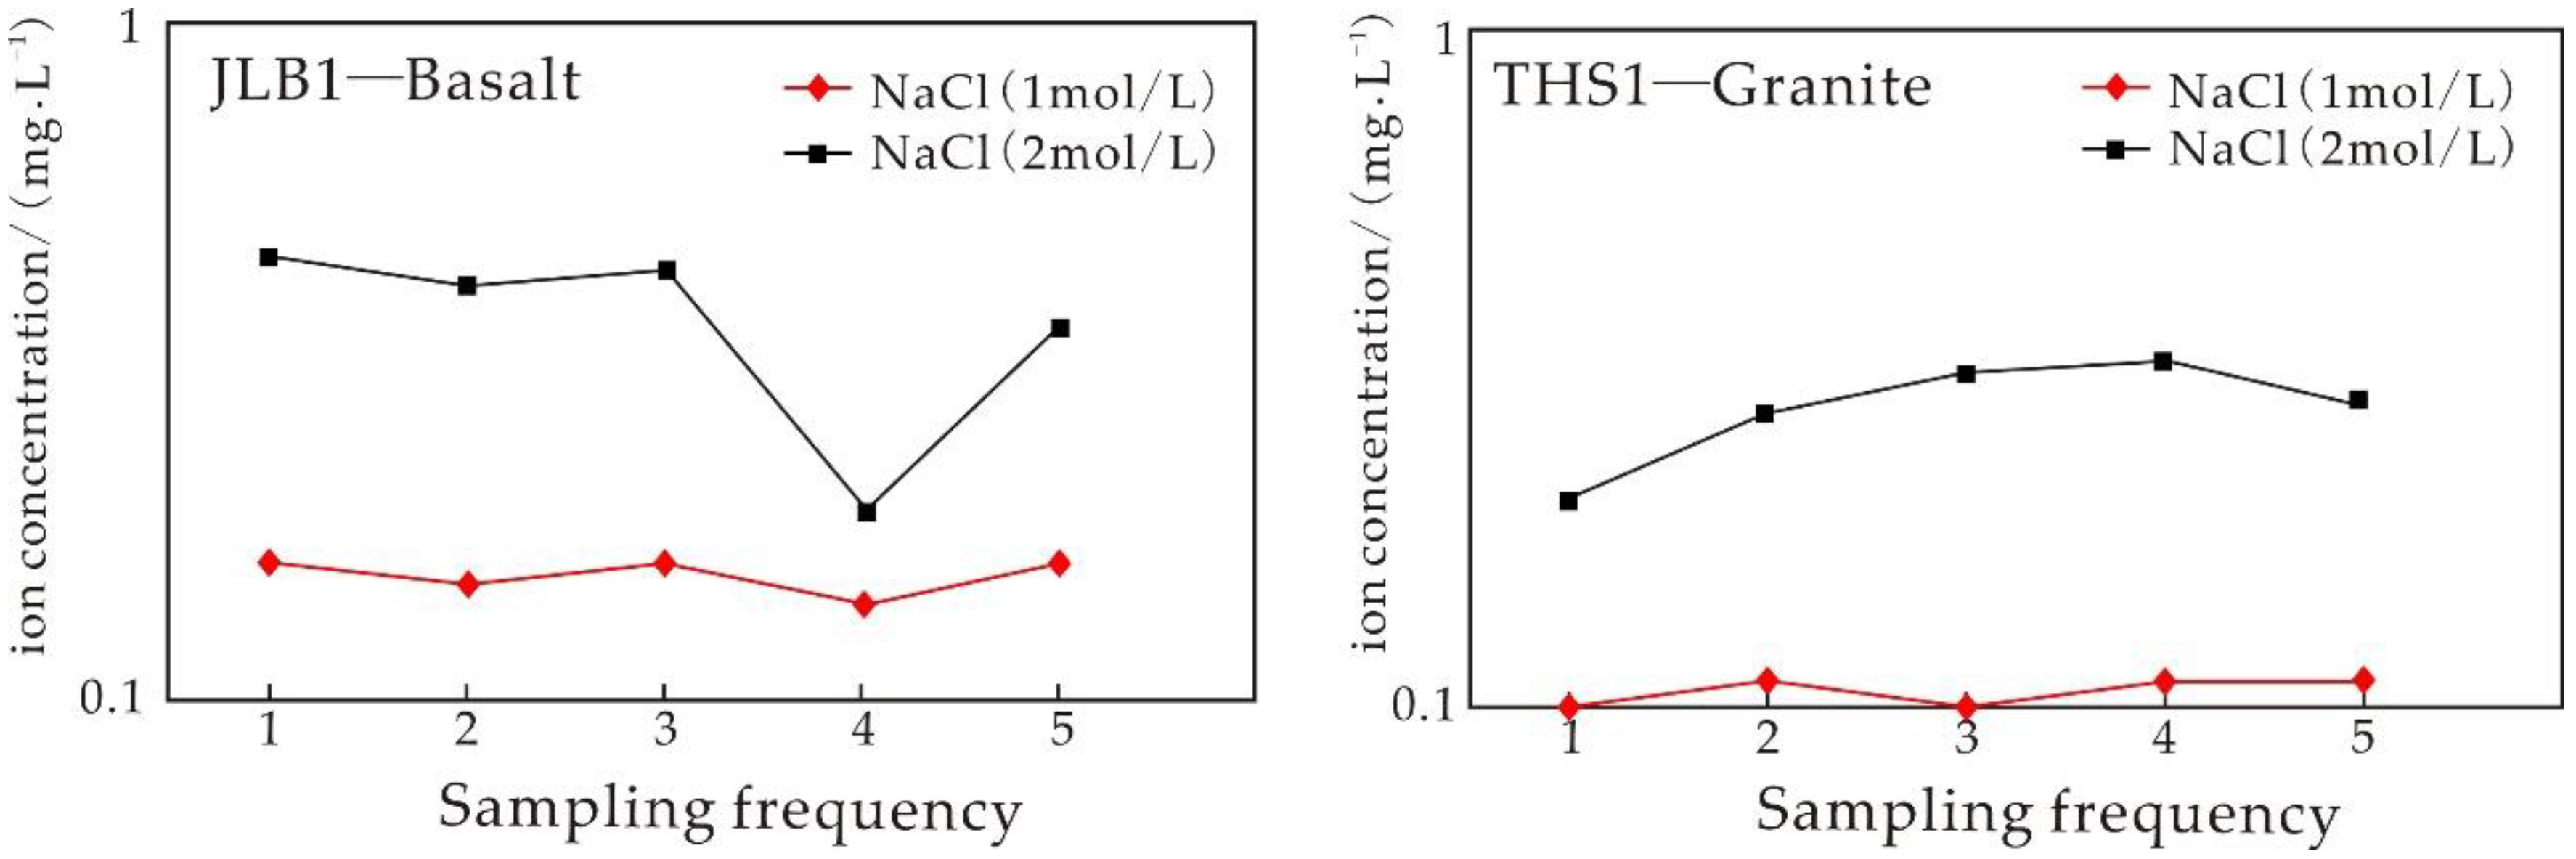
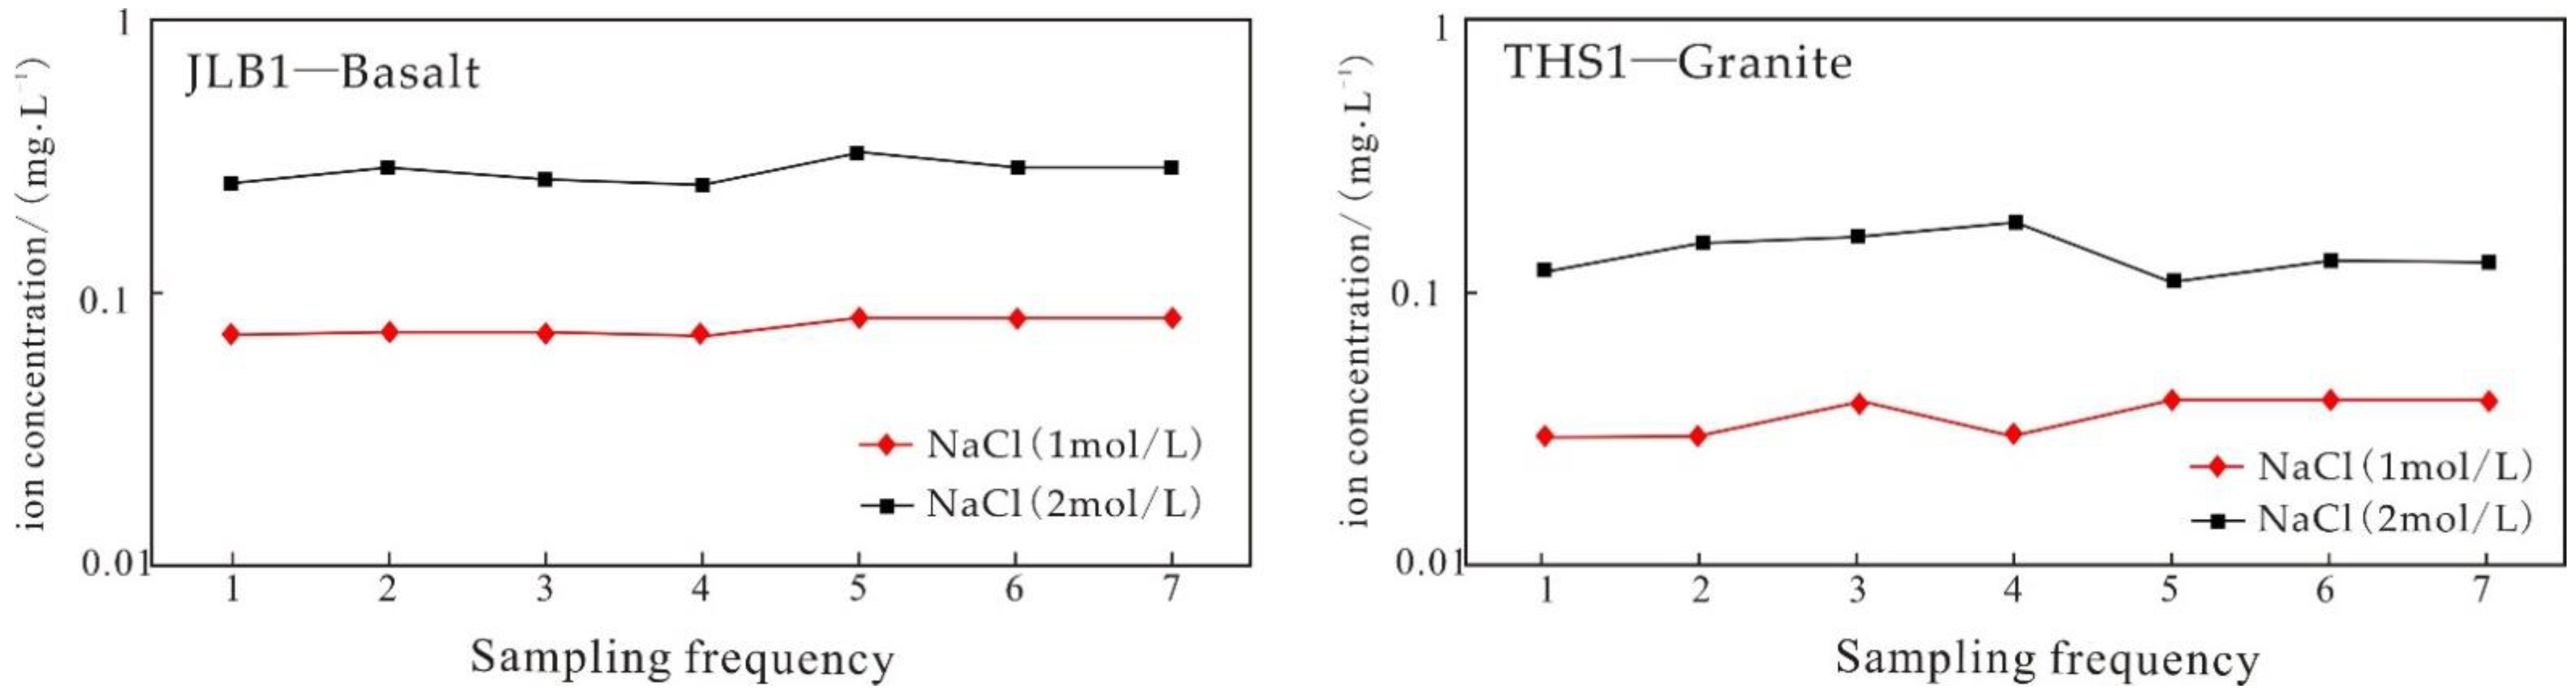
5.3.1. Analysis of Static Immersion Experimental Results

The contents of K in the five fluids were different, but the trend was similar. Most of the K content in the solution was the highest after soaking for 55 h after the seventh sampling. Moreover, weakly alkaline (pH = 8) solutions and 1 mol/L and 2 mol/L NaCl solutions were more conducive to K leaching (Figure 7). At room temperature, the content of K in the 2 mol/L NaCl was higher than that in the 1 mol/L NaCl solution, and the dissolution amount of K in the 1 mol/L of NaCl solution was 10.90 mg/L. However, its concentration increased with increasing salinity and soaking time. In the 2 mol/L NaCl solution, the maximum value was 14.86 mg/L. Basalt immersion was more conducive to potassium dissolution than granite, and the dissolution amount was one order of magnitude higher (Table 4).
Ca, Mg, and Sr showed a consistent trend, with the highest element content in the 1 mol/L and 2 mol/L NaCl solutions, followed by the solution with pH = 5; the lowest element content was in the distilled water and the solution with pH = 8 (Figure 8, Figure 9 and Figure 10), in which the content of Ca was the highest, followed by Mg, and the lowest was Sr. With increasing soaking time, the dissolution amount of the three kinds of ions increased slowly. At room temperature, the Ca, Mg, and Sr contents in 2 mol/L NaCl were generally higher than those in 1 mol/L NaCl solution. In the 1 mol/L NaCl solution, the maximum Ca dissolution amount was 290.40 mg/L, and the concentration of Ca increased with increasing salinity and immersion time. The maximum value of Ca in the 2 mol/L NaCl solution was 343.45 mg/L. In the 1 mol/L NaCl solution, the maximum Mg dissolution was 18.97 mg/L, while in the 2 mol/L NaCl solution, the maximum Mg dissolution was 22.79 Mg/L. In 1 mol/L NaCl solution, the maximum Sr release was 1.59 mg/L, while in the 2 mol/L NaCl solution, the maximum Sr release was 1.90 mg/L (Table 4).
No concentration of lithium was detected in the five fluids.
Br, I, and B were not detected in distilled water, pH = 5, and pH = 8 solutions but were detected in the 1 mol/L and 2 mol/L NaCl solutions. The changes in Br, I, and B in 1 mol/L and 2 mol/L NaCl solutions are discussed as follows:
The Br content fluctuated within a certain range with little change (Figure 11). In addition, the Br content in the 2 mol/L NaCl solution was 1–2 times higher than that in the 1 mol/L NaCl solution (Table 4).
The I and B contents in the solution were low with little fluctuation, but the saline fluid more easily activated the ions (Figure 12 and Figure 13). Moreover, the activation effect of the 2 mol/L NaCl solution was better than that of the 1 mol/L NaCl solution; it was generally 1~2 times higher (Table 4).
The above analysis shows that saline fluid was more conducive to the activation of various ions, especially in the 2 mol/L NaCl solution, while the solution with weak acid was conducive to the dissolution of K. Li was not dissolved in the whole experiment, indicating that the solution concentration was not the factor affecting the dissolution of lithium, and the main controlling factor was temperature. Under the same conditions, the solubility of K in the NaCl solution was approximately 1~2 orders of magnitude higher than that in the distilled water. Potassium in basalt is more easily dissolved than that in granite, which further reveals that the water–rock reaction between basalt and basin brine with weak alkalinity can provide the source of ore-forming materials for potassium-rich brines.

5.3.2. Influence of Time on the Igneous Rock Water–Rock Reaction

The trends of dissolution of Ca, K, Sr, and Li elements in basalt and granite are the same, with a small fluctuation and obvious positive correlation (Figure 14). Under certain conditions, Mg in granite is correlated with S, while Mg in basalt is negatively correlated with Ca, K, Sr, and Li. The maximum dissolution amounts of K, Li, Mg, Ca, and S are reached after 3 h of reaction, and the maximum dissolution amount of K, Mg, S, and Br in granite is reached after 5 h of reaction (Figure 14). The result of this reaction is quite different from that of the brine samples in the Jiangling Basin, which indicates that the formation of brine ore takes a long time.

5.3.3. Influence of Temperature on the Igneous Rock Water–Rock Reaction

Considering the elemental composition of the original rock, whether the reaction fluid medium was distilled water or 1 mol/L NaCl solution, K dissolution in basalt reached a relatively high value at 250 °C, and the dissolution decreased with increasing temperature. At 400 °C, the dissolution reached the lowest maximum value, 54.629 mg/L (Figure 15). The amount of K in the same fluid was different at different temperatures. At the same temperature, the K dissolution amount in 1 mol/L NaCl solution was higher than that in distilled water. The dissolution amount of Li in basalt was very low, whether the reaction fluid medium was distilled water or 1 mol/L NaCl solution; it reached a maximum value of 0.152 mg/L at 250–300 °C, with a small fluctuation, and then it decreased gradually with increasing temperature (Figure 16).
Considering the elemental composition of the original rock, whether the reaction fluid medium was distilled water or 1 mol/L NaCl solution, Li dissolution in basalt and granite reached a relatively high value at 250 °C, and the dissolution decreased with increasing temperature. At 400 °C, the dissolution reached the lowest maximum value, 19.490 mg/L (Figure 16). The amount of Li in the same fluid was different at different temperatures. At the same temperature, the Li dissolution amount in the 1 mol/L NaCl solution was higher than that in distilled water. The dissolved Li from granite was an order of magnitude higher than that from basalt, whether the reaction fluid medium was distilled water or 1 mol/L NaCl solution; it reached the maximum value of 3.525 mg/L at 250–350 °C, with a large fluctuation, and then it decreased gradually with increasing temperature (Figure 16).
The contents of Ca, Mg, and Sr in the 1 mol/L NaCl solution and distilled water decreased with increasing temperature, and the decreasing rate of Mg was higher than that of Ca and Sr (Figure 17). However, the content of various ions in 1 mol/L NaCl solution was higher than that in distilled water. The content of Br in the fluid was different at different temperatures. At the same temperature, the content of Br ions in 1 mol/L NaCl solution was higher than that in distilled water (Figure 17).
The above analysis shows that the rates of water–rock reactions are different at different temperatures for the same fluid. The dissolution rates of Ca, Mg, and Sr decrease with increasing temperature, while the dissolution rates of K and Li first increase and then decrease with the increase in temperature. The change of Br is not obvious (Figure 17). However, the content of each element in the saline fluid is much higher than that in the distilled water, indicating that the saline fluid more easily activates ions. Basalt is favorable for the dissolution of potassium, and granite is favorable for the dissolution of lithium.

5.3.4. Influence of Fluid Composition on the Igneous Rock Water–Rock Reaction

The dissolution of K in both basalt and granite is approximately 10 times higher in distilled water than in NaCl solution, and it is positively correlated with concentration (Figure 18). The dissolution amount of Ca increases with increasing salinity (Figure 18). The dissolution amount of Mg in granite is small. The dissolution amount of Sr increases with increasing concentration. The dissolution amount of Li is low in basalt and approximately one order of magnitude smaller than that in granite. Basalt is not the main source of lithium in brine. Under the same conditions, the leaching capacity of NaCl solution for various elements in rock is approximately 1–2 orders of magnitude higher than that of deionized water (Figure 18), indicating that high-salinity fluid is the main migration carrier of ore-forming elements.
Compared with leaching results under normal temperatures and the chemical analysis results of Jianghan basin brine (Table 4), the dissolution of Li, K, Sr, Mg, and other elements in autoclave water–rock reactions is significantly higher than the normal temperature immersion results, but still two orders of magnitude lower than the element content in the basin brine, indicating that high temperatures are more favorable for K, Li, Na, and Sr enrichment. The process with higher-than-normal temperatures has a significant impact on the composition of fluid, which is favorable for igneous rocks to react and provide material source for brine. Water–rock reaction of igneous rock is one of the important processes for the mineralization of lithium–potassium-rich brine, and surface evaporation and concentration are the main mechanisms for the mineralization of brine.

5.3.5. Geotectonics

According to Guan [51], Mesozoic volcanic rocks in eastern China are divided into four rock belts extending to the NNE. According to the research results of Xu et al. (2015) [54], volcanic activity in the Paleogene was mainly distributed in the NE-trending Songliao Plain, North China Plain, and Jianghan Plain. The thickest basalt was more than 1000 m thick, and the magma was mainly tholeiitic basaltic magma, which was only sporadically exposed on the surface. From the Cretaceous to the Paleocene, a large-scale lithospheric extension characterized by volcanic activity, rift basin formation, and large-scale mineralization occurred in North China [32,55,56]. At the same time, due to the extension of the lithosphere, there were also large-scale faulted basins, volcanic eruptions, and metallogenic accumulations in Central China and South China [57].
Volcanic rocks are widely distributed in the Jianghan Basin, with a total area of 5049 km2, accounting for 18% of the basin area. Volcanic rocks are well developed in the Jiangling depression, with a distribution area of 3527 km2 (Figure 4), accounting for nearly half of the whole depression, and an average thickness of more than 200 m from the Shashi Formation to Qianjiang Formation [35,58]. Some basalt samples collected in the Balingshan area are typical tholeiites of continental rift type, which are rich in K, Li, Rb, Sr, Zn, Cu, and other elements [59].
Most scholars believe that the composition of magma is mainly controlled by the composition of the source region, and asthenosphere–lithosphere interactions lead to the heterogeneity in the source region. Tholeiitic basalts are the result of a relatively high degree of melting at the shallow part of the lithospheric mantle or asthenospheric mantle [60,61]. Intracontinental tholeiitic basalts generally have high boron contents, ranging from 0.48 × 10⁻⁶ to 17.8 × 10⁻⁶ [62]. As a soluble element, boron can be released in large quantities into surface hot springs, concentrated brines, and meteoric water. Along with the large-scale volcanic eruption in the Paleocene in the Jiangling depression, a large number of boron-containing minerals carried by magma and post-stage hydrothermal fluids could have provided a large number of ore-forming materials for brine deposits in the Jiangling depression.

5.3.6. Paleocene Paleoclimate and Paleo-Lake Composition

The sedimentary environment of Paleocene salt-bearing strata in the Jiangling depression was dominated by a warm and dry environment, which alternated frequently with a humid environment. Under the paleogeomorphic background of “high mountain and deep basins”, the brine in the lake basin reached sodium chloride saturation through strong evaporation (extremely dry and hot climate events), and halite precipitated. The brines continued to be evaporated to form boron-rich brines, and with the length of salt-forming time, halite layers with different thicknesses formed. The Paleocene–Eocene salt-bearing strata in the Jiangling depression are characterized by mineral deposits such as mudstone, silt or fine sandstone, marl, halite, anhydrous mirabilite, calcium mirabilite, anhydrite, potassic gypsum, potassic salt, and carnallite [3,6], which are mineralogical markers of a hot and dry climate.
The long-term subsidence of the Jiangling depression leads to good basin sealing. During the Paleocene, the Jiangling depression was volcanically active, which brought abundant ore-forming materials for brine mineralization into the depression. However, the contents of lithium and potassium in the brine in the Jiangling depression are abnormally high and reach the industrial grade. Water–rock reactions alone could not have made the concentration of ore-forming fluid reach such a high level, which is inseparable from the continuous enrichment of minerals caused by evaporation and concentration in late ancient lakes under extremely dry and hot climate conditions. The formation of boron-rich brines in the Jiangling depression is the coupled result of structural conditions, material conditions, and an arid climate.

6. Conclusions

(1)
The field evidence shows that Mesozoic and Cenozoic igneous rocks in the Jiangling depression are mainly basalt and granite, and their distribution area is more than half of the basin area. The magma is differentiated to different degrees, which could have provided lithium and potassium for the brine.
(2)
The static immersion experiment at room temperature shows that saline fluid is more likely to activate K ions in basalt. The weak alkaline solution more easily dissolves K. During the whole experiment, Li was not dissolved, indicating that the concentration of the solution was not the factor affecting the dissolution of lithium, and the main controlling factor was temperature.
(3)
The experiments of water–rock reaction with high temperature show that the dissolution rates of Ca, Mg, and Sr decrease with the increase in temperature, while the dissolution rates of K and Li first increase and then decrease with the increase in temperature. The dissolution of K and Li is easier when saline fluid reacts with volcanic rock. The dissolution rate of K in basalt is higher than that of Li, and that of Li in granite is higher than that of K. Compared with the results at normal temperatures, the ability of the fluid to leach elements is significantly enhanced at higher temperatures, the temperature is the main factor controlling the ability to leach elements, and the high-salinity fluid is the main migration carrier of ore-forming elements.
(4)
According to the experiments of water–rock reaction, the mineral composition of the ancient brine in the Jiangling depression during the Paleogene is consistent with that of the brine found today, indicating that the Jiangling depression in the Paleogene was influenced by hot and dry climate. However, these two compositions are different by a few orders of magnitude, indicating that the formation of lithium–potassium-rich brines requires a long period of time. The water–rock reaction is one of the important processes for brine formation, and surface evaporation and concentration are the main mechanisms for brine mineralization.

Author Contributions

C.W. and X.Y. designed the research and prepared the original manuscript. R.L. and L.L. revised the manuscript. K.Y. and C.Y. participated in sample collection and processing. All authors have read and agreed to the published version of the manuscript.

Funding

The work was supported by the Central Public Welfare Scientific Research Basic Scientific Research Business Expenses (Nos. KK2005 and KY1603), the National Natural Science Foundation of China (Nos. U20A2092, 42002106, 41907262, and 41502089), the National Basic Research Program of China (973 program) (No. 2011CB403007), and the China Geological Survey (No. DD20190606).

Institutional Review Board Statement

Not applicable.

Informed Consent Statement

Not applicable.

Data Availability Statement

Data are available based on request.

Acknowledgments

We would like to thank Kuan Zhang and Cheng Chen from Jinhui (Jing Zhou) Fine Chemical Co., Ltd. for their help during the field sampling. We are grateful to reviewers for their critical and constructive review.

Conflicts of Interest

The authors declare that they have no conflict of interest.

Abbreviations

PlPlagioclase
PxPyroxene

References

  1. Kesler, S.E.; Gruber, P.W.; Medina, P.A.; Keoleian, G.A.; Wallington, T.J. Global lithium resources: Relative importance of pegmatite, brine and other deposits. Ore Geol. Rev. 2012, 48, 55–69. [Google Scholar] [CrossRef]
  2. Godfrey, L.V.; Chan, L.H.; Alonso, R.N.; Lowenstein, T.K.; McDonough, W.F.; Houston, J.; Li, J.; Bobst, A.; Jordan, T.E. The role of climate in the accumulation of lithium-rich brine in the central Andes. Appl. Geochem. 2013, 38, 92–102. [Google Scholar] [CrossRef]
  3. Wang, C.L.; Liu, C.L.; Liu, B.K.; Shen, L.J.; Cai, X.L.; Yu, X.C.; Xie, T.X.; Wang, L.C.; Zhao, Y.J.; Xuan, Z.Q. The discovery of carnallite in Paleocene Jiangling Depression and its potash searching significance. Acta Geol. Sin. 2015, 89, 129–136. [Google Scholar]
  4. Yu, X.C.; Wang, C.L.; Liu, C.L.; Zhang, Z.C.; Xu, H.M.; Huang, H.; Xie, T.X.; Li, H.N.; Liu, J.L. Sedimentary characteristics and depositional model of a Paleocene-Eocene salt lake in the Jiangling Depression, China. Chin. J. Oceanol. Limn. 2015, 33, 1426–1435. [Google Scholar] [CrossRef]
  5. Liu, C.L.; Yu, X.C.; Zhao, Y.J.; Wang, J.Y.; Wang, L.C.; Xu, H.M.; Li, J.; Wang, C.L. Atentative discussion on regional metallogenicbackground and mineralization mechanism of subterranean brinesrich in potassium and lithiumin South China Block. Miner. Depos. 2016, 35, 1119–1143. [Google Scholar]
  6. Wang, C.L.; Liu, C.L.; Yu, X.C.; Li, H.N.; Liu, J.L. The extremely hot and dry climatic events and potash enrichment in salt lakes. Acta Geol. Sin.-Engl. 2016, 90, 769–770. [Google Scholar]
  7. Zeng, F.M.; Xiang, S.Y. Geochronology and Mineral Composition of the Pleistocene Sediments in Xitaijin air Salt Lake Region, Qaidam Basin: Preliminary Results. J. Earth Sci. 2017, 8, 622–627. [Google Scholar] [CrossRef]
  8. Wang, D.H.; Liu, L.J.; Dai, H.Z.; Liu, S.B.; Hou, J.L.; Wu, X.S. Discussion on particularity and prospecting direction of large andsuper-large spodumene deposits. Earth Sci. 2017, 42, 2243–2257. [Google Scholar]
  9. Shen, C.B.; Mei, L.F.; Min, K.; Jonckheere, R.; Ratschbacher, L.; Yang, Z.; Peng, L.; Liu, Z. Multi-chronometric dating of the Huarong granitoids from the middle Yangtze Craton: Implications for the tectonic evolution of eastern China. J. Asian Earth Sci. 2012, 52, 73–87. [Google Scholar] [CrossRef]
  10. Li, R.Q.; Liu, C.L.; Jiao, P.C.; Wang, J.Y. The tempo-special characteristics and forming mechanism of Lithium-rich brines in China. China Geol. 2018, 1, 72–83. [Google Scholar] [CrossRef]
  11. Munk, L.A.; Boutt, D.F.; Hyneck, S.; Moran, B. Hydrogeochemical fluxes and processes contributing to the formation of lithium-enriched brinesina hyper-arid continental basin. Chem. Geol. 2018, 493, 37–57. [Google Scholar] [CrossRef]
  12. Li, R.Q.; Liu, C.L.; Xu, H.M.; Jiao, P.C.; Hu, Y.F.; Li, F.; Sun, X.H. Genesis of glauberite sedimentation in LopNur Salt Lake—Constraints from thermo dynamics imulation of the shallow ground water in the Tarim River Basin, China. Chem. Geol. 2020, 537, 119461. [Google Scholar] [CrossRef]
  13. Rosenthal, E.; Möller, P.; Buch-Leviatan, O.; Politi, M. The Hydrogeochemical Stratigraphy of Brinesand Its Implications on Water Management in the Central Jordan-Dead SeaRift Valley, Israel. Geofluids 2020, 17, 9812597. [Google Scholar]
  14. Godfrey, L.V.; Álvarez-Amado, F. Volcanic and Saline Lithium Inputs to the Salarde Atacama. Minerals 2000, 10, 201. [Google Scholar] [CrossRef] [Green Version]
  15. Wang, C.L.; Liu, L.H.; Li, Q.; Meng, L.Y.; Liu, C.L.; Zhang, Y.Y.; Wang, J.Y.; Yu, X.C.; Yan, K. Petrogeochemical characteristics and genetic analysis of the source area of brinety pelithium-potassium ore in Jitai Basin of Jiangxi province. Acta Petrol. Mineral. 2020, 39, 65–84. [Google Scholar]
  16. Liu, C.L.; Wang, M.L.; Jiao, P.C.; Chen, Y.Z. The exploration experiences of pot ash deposits in the world and probing of countermeasures of China’s future pot ash-deposits investigation. Geol. Chem. Miner. 2006, 28, 1–8. [Google Scholar]
  17. Munk, L.A.; Hynek, S.A.; Bradley, D.C.; Boutt, D.; Labay, K.; Jochens, H. Lithium Brines: A Global Perspective. Rev. Econ. Geol. 2016, 18, 339–365. [Google Scholar]
  18. Lowenstein, T.K.; Spencer, R.J.; Zhang, P.X. Origin of Ancient Potash Evaporites: Clues from the Modern Nonmarine Qaidam Basin of Western China. Science 1989, 245, 1090–1092. [Google Scholar] [CrossRef]
  19. Holmearda, J.G.; Hutchinsan, R.W. Potash-bearing evaporates in the Danakil area, Etiopia. Econ. Geol. 1968, 63, 129–132. [Google Scholar]
  20. Arod, A. Mineral spring and saline lake of the western rift Valley, Uganda. Geochim. Cosmochim. Acta 1969, 10, 1152–1162. [Google Scholar] [CrossRef]
  21. Yu, X.C.; Liu, C.L.; Wang, C.L.; Zhao, J.X.; Wang, J.Y. Origin of geothermal waters from the Upper Cretaceous to Lower Eocene strata of the Jiangling Basin, SouthChina: Constraints by multi-isotopic tracers and water-rock interactions. Appl. Geochem. 2020, 124, 104810. [Google Scholar] [CrossRef]
  22. Munk, L.; Chamberlain, C.P. Lithium Brine Resources: A Predictive Exploration Model, U.S. Geological Survey, Mineral Resources External Research Program-Final Technical Report: G10AP00056.2011. Available online: http://minerals.usgs.gov/mrerp/reports/Munk-G10AP00056 (accessed on 8 November 2021).
  23. Hofstra, A.H.; Todorov, T.I.; Mercer, C.N.; Adams, D.T.; Marsh, E.E. Silicate melt inclusion evidence for extremepre-eruptive enrichment and post-eruptive depletion of lithium in silicic volcanic rocks of the western United States: Implications for the origin of lithium-rich brines. Econ. Geol. 2013, 108, 1691–1701. [Google Scholar] [CrossRef]
  24. Von Strandmann, P.A.P.; Frings, P.J.; Murphy, M.J. Lithium isotope behavior during weathering in the Ganges Alluvial Plain. Geochim. Cosmochim. Acta 2017, 198, 17–31. [Google Scholar] [CrossRef] [Green Version]
  25. Price, J.G.; Lechler, P.J.; Lear, M.B.; Giles, T.F. Possible Volcanic Source of Lithium in Brines in Clayton Valley, Nevada. Geology and Ore Deposits 2000: The Great Basin and Beyond Proceedings: Geological Society of Nevada Symposium Proceedings: Nevada, USA, 2000. pp. 241–248. Available online: https://www.gsnv.org/shop/geology-and-ore-deposits-2000-the-great-basin-and-beyond-symposium-proceedings/ (accessed on 23 November 2021).
  26. Araoka, D.; Kawahata, H.; Takagi, T.; Watanabeet, Y.; Nishimura, K.; Nishioal, Y. Lithium and strontium isotopic system atic s in playas in Nevada, USA: Constraints on the origin of lithium. Miner. Depos. 2013, 49, 371–379. [Google Scholar] [CrossRef]
  27. Li, R.Q.; Liu, C.L.; Chen, X.; Chen, Y.Z.; Wang, C.L. Salting law by cooling deep potassium-bearing brine in Jiangling depression. J. Salt Lake Res. 2013, 21, 1–6. [Google Scholar]
  28. Li, R.Q.; Chen, X.; Liu, C.L.; Ma, L.C. Study on loss mechanism of rubidium during potassiumcry stallization from potassium-rich brine of Jiangling sunken area. Inorg. Chem. Ind. 2014, 46, 18–20, 26. [Google Scholar]
  29. Peccerillo, R.; Taylor, S.R. Geochemistry of Eocene calc-alkaline volcanic rocks from the Kastamonu area, NorthernTurkey. Contrib. Mineral. Petr. 1976, 58, 63–81. [Google Scholar] [CrossRef]
  30. Risacher, F.; Alonso, H.; Salazar, C. The origin of brines and salts in Chilean salars: A hydrochemical review. Earth-Sci. Rev. 2003, 63, 249–293. [Google Scholar] [CrossRef]
  31. Zhou, X.; Jiang, C.L.; Han, J.J.; Tang, L.W.; Cao, Q.; Li, T. Some problems related to the evaluation of subsurface brine resources in deep-seated aquifers in sedimentary basins. Acta Geol. Sin. 2013, 34, 610–616. [Google Scholar]
  32. Gilder, S.A.; Keller, G.R.; Luo, M.; Goodell, P.C. Timing and spatial distribution of rifting in China. Tectonophysics 1991, 197, 225–243. [Google Scholar] [CrossRef]
  33. Yu, X.Q.; Shu, L.S.; Deng, P.; Wang, B.; Zu, F.P. The sedimentary features of the Jurassic-Tertiary terrestrial strata in southeast China. J. Stratigr. 2003, 27, 224–263. [Google Scholar]
  34. Zhang, Y.Q.; Zhao, Y.; Dong, S.W.; Yang, N. Tectonic evolution stages of the Early Cretaceous rift basins in Eastern China and adjacent areas and their geodynamic background. Front. Earth Sci.-Front. 2004, 11, 123–133. [Google Scholar]
  35. Xu, L.X.; Yan, C.D.; Yu, H.L.; Wang, B.Q.; Yu, F.Q.; Wang, D.F. Chronology of Paleogene volcanic rocks in Jianghan Basin. Oil Gas Geol. 1995, 16, 132–137. [Google Scholar]
  36. Schellart, W.P.; Lister, G.S. The role of the East Asian active margin in widespread extensional and strike-slip deformation in East Asia. J. Geol. Soc. Lond. 2005, 162, 959–972. [Google Scholar] [CrossRef]
  37. Zhu, R.X.; Xu, Y.G.; Zhu, G.; Zhang, H.F.; Zheng, T.Y. Destruction of the North China Craton. Sci. China (Ser. D) 2012, 55, 1565–1587. [Google Scholar] [CrossRef]
  38. Liu, S.F.; Steel, R.; Zhang, G.W. Mesozoic sedimentary basin development and tectonic implication, northern Yangtze Block, eastern China: Record of continent–continent collision. J. Asian Earth Sci. 2005, 25, 9–27. [Google Scholar] [CrossRef]
  39. Shen, C.B.; Donelick, R.A.; O’Sullivan, P.B.; Jonckheere, R.; Yang, Z.; She, Z.B.; Miu, X.L.; Ge, X. Provenance and hinterland exhumation from LA-ICP-MS zircon U–Pb and fission-track double dating of Cretaceous sediments in the Jianghan Basin, Yangtze block, central China. Sediment. Geol. 2012, 281, 194–207. [Google Scholar] [CrossRef]
  40. Teng, X.H.; Fang, X.M.; Kaufman, A.J.; Liu, C.L.; Wang, J.Y.; Zan, J.B.; Yang, Y.B.; Wang, C.L.; Xu, H.M.; Schulte, R.F.; et al. Sedimentological and mineralogical records from drill core SKD1 in the Jianghan Basin, Central China, and their implications for late Cretaceous–early Eocene climate change. J. Asian Earth Sci. 2019, 182, 103936. [Google Scholar] [CrossRef]
  41. Wang, C.L.; Meng, L.Y.; Liu, C.L.; Yu, X.C.; Yan, K.; Liu, S.H.; You, C.; Li, K.K.; Teng, X.H. Study on the genesis of Paleocene underground brineboron deposit in Jiangling Depression. Acta Petrol. Mineral. 2021, 40, 1–13. [Google Scholar]
  42. Wang, B.J.; Lin, C.S.; Chen, Y.; Lu, M.G.; Liu, J.Y. Episodic tectonic movement and evolutional character in Jianghan basin. Oil Geophys. Prospect. 2006, 41, 226–230. [Google Scholar]
  43. Wang, C.L.; Liu, C.L.; Wang, J.Y.; Yu, X.C.; Yan, K. Palynology and stratigraphy of the thick evaporate-bearing Shashi Formation in Jiangling Depression, Jianghan Basin of South China, and its paleoclimate change. China Geol. 2020, 2, 283–291. [Google Scholar]
  44. Shen, C.B.; Mei, L.F.; Peng, L.; Chen, Y.Z.; Yang, Z.; Hong, G.F. LA-ICPMS U–Pb zircon age constraints on the provenance of Cretaceous sediments in the Yichang area of the Jianghan Basin, central China. Cretac. Res. 2012, 34, 172–183. [Google Scholar] [CrossRef]
  45. Liu, J.H.; Zhang, P.Z.; Lease, R.O.; Zheng, D.; Wan, J.; Wang, W.; Zhang, H. Eocene onset and late Miocene acceleration of Cenozoic intracontinental extension in the North Qinling range–Weihe graben: Insights from apatite fission track thermochronology. Tectonophysics 2013, 584, 281–296. [Google Scholar] [CrossRef]
  46. Xu, Y.G. Recycled oceanic crust in the source of 90–40 Ma basalts in North and Northeast China: Evidence, provenance and significance. Geochim. Cosmochim. Acta 2014, 143, 49–67. [Google Scholar] [CrossRef]
  47. Sun, J.X.; Li, N.; Zhang, W.Q. Petrogenesis and characteristics of the mantle source for the Quaternary Datong basalt: Research on the major, trace elements and Sr-Nd-Pb-Hf isotopes. Acta Petrol. Sin. 2020, 36, 3331–3345. [Google Scholar]
  48. Liu, F.; Cao, F.; Zhang, Z.X.; Li, Q. Chronology and geochemistry of the granite near the Keketuohai No3 pegmatite in Xinjiang. Acta Petrol. Sin. 2014, 30, 1–15. [Google Scholar]
  49. Li, J.K.; Liu, X.F.; Wang, D.H. The metallogenetic regularity of lithium deposit in China. Acta Geol. Sin. 2014, 88, 2269–2283. [Google Scholar]
  50. Middlemost, E.A.K. Naming Materialsinthe Magma/Igneous Rock System. Earth-Sci. Rev. 1994, 37, 215–244. [Google Scholar] [CrossRef]
  51. Yu, H.L.; Yan, C.D.; Yu, F.Q.; Wang, D.F. Geochemical characteristics and tectonic environment of Eogene basalts of the Jiangling hollow. Geol. Rev. 1996, 42, 44–51. [Google Scholar]
  52. Winchester, J.A.; Floyd, P.A. Geochemical discrimination of different magma series and their differentiation products using immobile elements. Chem. Geol. 1997, 20, 325–343. [Google Scholar] [CrossRef] [Green Version]
  53. Guan, D.F. Geological conditions for the formation of oil and gas in the second subsidence zone of the New Cathaysia Series. J. Daqing Petrol. Inst. 1997, 2, 7–21. [Google Scholar]
  54. Xu, Y.G.; Fan, Q.C. Cenozoic Volcanismin Eastern China: Reviewand Perspectives. Bull. Mineral. Petrol. Geochem. 2015, 34, 682–689. [Google Scholar]
  55. Lin, W.; Wang, Q.C. Late Mesozoic extensional tectonics in the North China block: A crustal response to subcontinental mantle removal? Bull. Soc. Geol. Fr. 2006, 117, 287–297. [Google Scholar] [CrossRef]
  56. Zhai, M.; Fan, Q.; Zhang, H.; Sui, J.; Shao, J.A. Lower crustal processes leading to Mesozoic lithospheric thinning beneath eastern North China: Underplating, replacement and delamination. Lithos 2007, 96, 36–54. [Google Scholar] [CrossRef]
  57. Mao, J.W.; Xie, G.Q.; Li, X.F.; Zhang, Z.H.; Wang, Y.T.; Wang, Z.L.; Zhao, C.S.; Yang, F.Q.; Li, H.M. Geodynamic process and metallogeny: History and present research trend, with a special discussion on continental accretion and related metallogeny throughout geological history in South China. Miner. Depos. 2005, 24, 193–205. [Google Scholar]
  58. Wu, L.L.; Mei, L.F.; Patonb, D.A. Late Cretaceous-Cenozoic intraplate extension and tectonic transitions in eastern China: Implications for intraplate geodynamic origin. Mar. Petrol. Geol. 2020, 117, 104379. [Google Scholar] [CrossRef]
  59. Yang, C.Q.; Chen, K.Q.; Chen, Z.Q.; Zhan, H.J. Constituent evolution and exploration potential in Jiangling depression. Nat. Gas Ind. 2003, 23, 51–54. [Google Scholar]
  60. Xu, Y.G.; Ma, J.L.; Frey, F.A.; Feigenson, M.D.; Liu, J.F. Role of lithosphere interaction in the genesis of Quaternary alkali and tholeiitic basalts from Datong, western North China Craton. Chem. Geol. 2005, 224, 247–271. [Google Scholar] [CrossRef]
  61. Chen, Y.; Zhang, Y.X.; Graham, D.; Su, S.; Deng, J. Geochemistry of Cenozoic basalts and mantle xenoliths in Northeast China. Lithos 2007, 96, 108–126. [Google Scholar] [CrossRef]
  62. Palmer, M.R. Boron-isotope systematics of Halmahera arc (Indonesia) lavas: Evidence for involvement of the subducted slab. Geology 1991, 19, 215–217. [Google Scholar] [CrossRef]
Figure 1. (A) Distribution of major Mesozoic–Cenozoic basins in China and location of Jianghan basin. BB, Baise Basin; BGB, Baidu Gulf Basin; BHG, Bohai Gulf Basin; CQB, Cuoqing Basin; CXB, Chuxiong Basin; DHB, Dunhuang Basin; ELB, Erlian Basin; HLB, Hailaer Basin; JGB, Junggar Basin; JHB, Jianghan Basin; LSB, Lanping–Simao Basin; MHB, Mehe Basin; ODB, Ordos Basin; QB, Qaidam Basin; QTB, Qiangtang Basin; SCB, Sichuan Basin; SJB, Sanjiang Basin; SLB, Songliao Basin; SNCB, Southern North China Basin; SSB, Sanshui Basin; SYSB, South Yellow Sea Basin; TB, Tarim Basin; THB, Turpan–Hami Basin; YEB, Yingen–Ejinaqi Basin. (B) DEM map showing the location of the Jiangling depression (diagonal white solid lines) in the Jianghan Basin (white dashed lines). The red lines show the major faults surrounding the basin. Geological data from [40].
Minerals 11 01330 g001
Figure 2. (A) Geographic location of the Jianghan Basin (modified from [41]); (B) locations of sampling boreholes; (C) basin-filling evolution and stratigraphic column of the Jianghan Basin (modified from [42,43]).
Minerals 11 01330 g002
Figure 3. Geological sketch map of the Balingshan basalt (A) and the Taohuashan granitoids (B) and sample location (modified from [9]).
Minerals 11 01330 g003
Figure 4. Field outcrops and microscopic photographs of basalt in Jiangling depression. (A) Red stomata almond-shaped basalt; (B) dense massive basalt; (C) columnar jointed basalt; (D) calcite and quartz veins developed in basalt; (E) intergranular basalt. Olivine undergoes intense alteration, chloritization, and iddingsitization; perpendicular polarized light. Plagioclase is colorless and transparent and has two groups of complete cleavage; long strip, polarization microscope common twin, interference color level gray, negative low protrusion. (F) Basalt is mainly composed of plagioclase (Pl) and pyroxene (Px), with weak alteration pairs; perpendicular polarized light. Pyroxene is the most common mineral in ultrabasic rocks and mafic rocks. It is greenish black and has two groups of nearly vertical cleavage, often forming irregular stepped fractures.
Minerals 11 01330 g004
Figure 5. (A) SiO2–(Na2O+K2O) relation diagram in granite (modified from [50]); (B) SiO2–K2O relation diagram in granite (modified from [29]). The four triangles represent the Taohuashan granite samples.
Minerals 11 01330 g005
Figure 6. Classification diagram of volcanic rocks in Jiangling depression. (A) SiO2–(Na2O+K2O) relation diagram; (B) Zr/TiO2–SiO2relation diagram; (C) Na2O–K2O relation diagram; (D) TiO2–K2O–P2O5 relation diagram. The four red dots represent basalt samples from Balingshan (after [52]).
Minerals 11 01330 g006
Figure 7. Variation diagram of K ion concentration in igneousrock static immersion experiment.
Minerals 11 01330 g007
Figure 8. Variation diagram of Ca ion concentration in igneous rock static immersion experiment.
Minerals 11 01330 g008
Figure 9. Variation diagram of Mg ion concentration in igneous rock static immersion experiment.
Minerals 11 01330 g009
Figure 10. Variation diagram of Sr ion concentration in igneous rock static immersion experiment.
Minerals 11 01330 g010
Figure 11. Variation diagram of Br ion concentration in igneous rock static immersion experiment.
Minerals 11 01330 g011
Figure 12. Variation diagram of I ion concentration in igneous rock static immersion experiment.
Minerals 11 01330 g012
Figure 13. Variation diagram of B ion concentration in igneous rock static immersion experiment.
Minerals 11 01330 g013
Figure 14. Diagram of element content over time in igneous rock water–rock reaction.
Minerals 11 01330 g014
Figure 15. Diagram of K ion content over temperature in water–rock reaction.
Minerals 11 01330 g015
Figure 16. Diagram of Li ion content over temperature in water–rock reaction.
Minerals 11 01330 g016
Figure 17. Diagram of ionic concentration over temperature in water–rock reaction.
Minerals 11 01330 g017
Figure 18. Diagram of K and Li element content in distilled water and NaCl solution over temperature in water–rock reaction.
Minerals 11 01330 g018
Table 1. Chemical composition of lithium–potassium-rich brines in Jiangling depression. Samples N1 and S1 are from ells GJ1 and SJ4, respectively.
SampleTDS
(g/L)
pHK
(g/L)
Na
(g/L)
Ca
(g/L)
Mg
(g/L)
Cl
(g/L)
SO4
(g/L)
B
(mg/L)
Li
(mg/L)
Sr
(mg/L)
Br
(mg/L)
I
(mg/L)
N1-13315.9010.18111.874.160.22183.480.41950.66104.71409.73461.9231.91
N1-23355.9310.26113.934.230.21184.590.32971.99105.58406.38440.3031.75
N1-33325.9910.35112.824.350.22182.680.54960.62107.41402.02433.0231.95
S1-13596.526.99106.1013.560.04202.020.26588.2348.611031.70227.6039.05
S1-23526.586.41105.2012.460.05197.700.24651.4044.25955.85206.6536.15
S1-33516.506.32102.9712.370.06194.420.28642.1844.15954.50203.3035.65
Table 2. Main elements of basalt in Jiangling depression (%). The last four samples are from [47].
SamplesSiO2TiO2Al2O3TFe2O3MnOMgOCaONa2OK2OP2O5LOILi (μg/g)Zr (μg/g)Total
JLB153.042.0014.009.240.188.326.373.251.030.201.8915.014799.82
JLB253.101.9513.039.640.108.296.233.241.200.221.8529.615299.95
JLB352.942.0313.258.980.107.498.553.561.050.221.6317.915999.81
JLB452.862.2613.868.820.176.828.213.871.090.291.6319.0149100.09
18DT1049.772.2814.7712.650.157.298.843.080.820.3707.26158100.02
18DT1251.681.9914.0112.330.167.348.053.210.630.2605.4313699.66
18DT1353.451.8214.1411.950.166.717.833.280.750.2105.34124100.28
18DT1452.281.8914.0312.230.167.188.033.090.490.2104.8712899.58
Table 3. Main elements of Cretaceous granite in Jiangling depression (%). The last five samples are from [48].
SamplesSiO2TiO2Al2O3TFe2O3MnOMgOCaONa2OK2OP2O5LOILi (μg/g) Total
THS-173.050.1514.101.500.040.301.263.625.350.080.4890.6100.12
THS-270.330.3515.142.230.040.632.042.884.640.131.0682.099.85
THS-371.300.1714.391.890.040.481.883.175.190.110.89102.099.78
THS-470.780.3615.101.960.050.511.843.124.960.090.7782.099.82
KKTH11773.450.1814.221.740.060.372.053.293.260.040.637299.93
KKTH11872.960.2314.242.160.050.522.333.113.130.050.6482100.14
KKTH11970.690.1815.741.680.040.352.133.064.940.050.5380.899.87
KKTH12072.300.1914.961.860.050.422.213.063.910.070.8067.6100.46
KKTH12173.810.2114.002.150.050.492.433.362.620.060.6083.1100.24
Table 4. Results of basalt static immersion experiment.
SamplesLithologyFluidTime
(Days)
Ion Concentration (mg·L−1)
KCaMgSrBBrI
JLB1BasaltDistilled water11.15. 630.550.04---
JLB1BasaltDistilled water51.128.620.790.05---
JLB1BasaltDistilled water111.5611.581.290.06---
JLB1BasaltDistilled water192.2814.801.590.07---
JLB1BasaltDistilled water292.8817.821.980.08---
JLB1BasaltDistilled water413.8219.992.210.09---
JLB1BasaltDistilled water555.1221.922.650.11---
JLB1Basalt1 mol/L NaCl13.06226.9112.401.250.073.230.16
JLB1Basalt1 mol/L NaCl53.15245.6913.951.330.073.480.15
JLB1Basalt1 mol/L NaCl113.28259.6814.411.390.073.460.16
JLB1Basalt1 mol/L NaCl193.36275.6414.821.340.073.390.14
JLB1Basalt1 mol/L NaCl294.40279.8814.651.410.083.160.16
JLB1Basalt1 mol/L NaCl417.97288.2818.661.520.083.98-
JLB1Basalt1 mol/L NaCl5510.90299.4018.971.590.084.87-
JLB1Basalt2 mol/L NaCl16.77272.9618.871.550.258.450.45
JLB1Basalt2 mol/L NaCl56.98301.8520.351.680.287.990.41
JLB1Basalt2 mol/L NaCl117.42321.5220.811.720.268.680.43
JLB1Basalt2 mol/L NaCl198.51322.6520.951.740.257.550.19
JLB1Basalt2 mol/L NaCl298. 98324.8420.541.730.328.520.35
JLB1Basalt2 mol/L NaCl4111.93328.1521.581.780.2810.28-
JLB1Basalt2 mol/L NaCl5514.86343.4522.791.900.2810.13-
JLB1BasaltPh = 510.3122.514.030.12
JLB1BasaltPh = 550.4236.987.100.19
JLB1BasaltPh = 5110.4339.057.960.19
JLB1BasaltPh = 5190.4238.548.450.20
JLB1BasaltPh = 5290.4440.728.910.21
JLB1BasaltPh = 541038.649.350.20
JLB1BasaltPh = 55510.4440.6910.080.20
JLB1BasaltPh = 8100.240.310
JLB1BasaltPh = 8516.960.790.440
JLB1BasaltPh = 81110.551.280.560
JLB1BasaltPh = 81912.421.730.690.01
JLB1BasaltPh = 82926.811.990.880.01
JLB1BasaltPh = 84102.380.960.01
JLB1BasaltPh = 8553.572.931.180.01
THS-1GraniteDistilled water10.420.560.040.01---
THS-1GraniteDistilled water50.520.930.060.01---
THS-1GraniteDistilled water110.641.650.110.02---
THS-1GraniteDistilled water190.831.980.130.02---
THS-1GraniteDistilled water290.742.770.150.03---
THS-1GraniteDistilled water410.913.290.230.03---
THS-1GraniteDistilled water551.494.110.260.04---
THS-1Granite1 mol/L NaCl10.8818.330.690.070.032.220.10
THS-1Granite1 mol/L NaCl50.921.480.780.080.032.190.11
THS-1Granite1 mol/L NaCl110.9522.690.780.080.042.250.10
THS-1Granite1 mol/L NaCl191.0223.940.810.080.032.150.11
THS-1Granite1 mol/L NaCl291.0324.490.840.080.043.140.11
THS-1Granite1 mol/L NaCl411.0827.061.110.090.043.13-
THS-1Granite1 mol/L NaCl551.1827.871.150.100.043.16-
THS-1Granite2 mol/L NaCl12.1822.661.010.090.125.320.20
THS-1Granite2 mol/L NaCl52.2626.681.060.090.155.650.27
THS-1Granite2 mol/L NaCl112.427.671.080.090.165.220.31
THS-1Granite2 mol/L NaCl192.6628.991.130.100.184.960.32
THS-1Granite2 mol/L NaCl292.8830.141.140.100.115.860.28
THS-1Granite2 mol/L NaCl413.1530.851.220.110.137.23-
THS-1Granite2 mol/L NaCl555.2930.671.220.110.137.44-
THS-1GranitePh = 510.074.550.240.12
THS-1GranitePh = 550.095.890.360.15
THS-1GranitePh = 5110.096.630.510.18
THS-1GranitePh = 5190.096.850.630.21
THS-1GranitePh = 5290.077.460.750.22
THS-1GranitePh = 5413.197.641.230.27
THS-1GranitePh = 555-8.061.260.34
THS-1GranitePh = 812.340.630.020
THS-1GranitePh = 853.141.470.110
THS-1GranitePh = 8113.201.600.150.01
THS-1GranitePh = 8192.122.810.210.01
THS-1GranitePh = 8294.233.130.300.01
THS-1GranitePh = 8416.834.200.370.01
THS-1GranitePh = 855-5.420.430.02
Note: - means below the detection limit.
Table 5. The water–rock reaction experiment results with variable time.
SamplesLithologyFluid
(NaCl)
T
(°C)
Time
(h)
Ion Concentration (mg/L)
KLiMgSrCaSBr
JLB1Basalt1 mol/L150128.590.03102.30.527.991.610.31
JLB1Basalt1 mol/L150225.980.01117.571.677.741.510.21
JLB1Basalt1 mol/L150333.500.0573.110.519.971.920.22
JLB1Basalt1 mol/L150419.660.03125.520.686.421.230.55
JLB1Basalt1 mol/L150527.040.0289.520.409.321.910.61
JLB1Basalt1 mol/L150622.130.01124.280.576.851.870.60
THS-1Granite1 mol/L15019.760.0439.370.070.280.670.49
THS-1Granite1 mol/L15028.050.0528.470.060.620.580.47
THS-1Granite1 mol/L150311.320.0635.510.050.840.690.41
THS-1Granite1 mol/L150414.210.0938.040.030.390.660.43
THS-1Granite1 mol/L150516.680.0544.270.040.460.960.63
THS-1Granite1 mol/L15063.870.0221.660.030.250.860.49
Table 6. The water–rock reaction experiment results with variable temperature.
SamplesLithologyFluid/SolutionT
(°C)
Ion Concentration (mg/L)
KCaMgSrLiBr
JLB1BasaltDistilled water2002.42317.0471.300-0.0050.184
JLB1BasaltDistilled water2506.42413.1810.541-0.0140.197
JLB1BasaltDistilled water3004.1721.1360.172-0.013-
JLB1BasaltDistilled water3503.4550.6250.054-0.005-
JLB1BasaltDistilled water4002.3440.3850.020-0.002-
JLB1Basalt1 mol/L NaCl20030.517764.66012.2024.4720.0420.676
JLB1Basalt1 mol/L NaCl25054.629687.4220.8574.2290.1310.640
JLB1Basalt1 mol/L NaCl30040.015459.8020.3192.5090.152-
JLB1Basalt1 mol/L NaCl35031.343198.1680.1220.7850.091-
JLB1Basalt1 mol/L NaCl40024.114156.9360.0500.0420.035-
THS-1GraniteDistilled water2000.579---0.0440.115
THS-1GraniteDistilled water2501.5720.047--0.0870.142
THS-1GraniteDistilled water3000.5590.025--0.0430.179
THS-1GraniteDistilled water3500.656---0.055-
THS-1GraniteDistilled water4002.6311.9490.023-0.077-
THS-1Granite1 mol/L NaCl20010.6436.127-4.2160.7640.761
THS-1Granite1 mol/L NaCl25019.4905.408-4.3060.6260.613
THS-1Granite1 mol/L NaCl30012.4723.065-2.5610.7810.580
THS-1Granite1 mol/L NaCl35011.1861.441-1.3223.525-
THS-1Granite1mol/L NaCl4008.7050.7230.1510.3613.373-
Note: - means below the detection limit.
Publisher’s Note: MDPI stays neutral with regard to jurisdictional claims in published maps and institutional affiliations.

