Article

A Numerical Study on the Optimization of the Material Pressure of the Feeding System

School of Chemical & Environmental Engineering, China University of Mining and Technology-Beijing, Beijing 100083, China
*
Author to whom correspondence should be addressed.
Minerals 2021, 11(12), 1333; https://doi.org/10.3390/min11121333
Submission received: 3 October 2021 / Revised: 12 November 2021 / Accepted: 24 November 2021 / Published: 28 November 2021
(This article belongs to the Section Mineral Processing and Extractive Metallurgy)

Abstract

:
To solve the problem of high energy consumption caused by the large initial material pressure of the feeding system, the macroscopic and mesoscopic laws of the effect of the movement of the feeder on the material pressure were studied, and an optimization method of changing the initial position of the feeder to reduce the initial material pressure is proposed. First, the influence of the movement direction of the feeder on the material pressure was studied based on the discrete element method and verified by experiments. A single-factor experiment was designed to analyze the influence of particle size, material repose angle, and bin slope on material pressure, drawing the applicable conditions of the proposed method. On this basis, the influence of the movement state of the feeder on the change of material pressure during the descent process was studied. Then, the motion parameters of the selected feeder descending process were optimized by the response surface method. Finally, case analyses of the vibrating feeding system and the scraper feeding system were carried out. The Discrete Element Method (DEM) calculation results show that the movement of the feeder will cause different distributions and evolution of the force chain on the mesoscale, which will result in different changes in the macroscopic material pressure. The initial material pressure and the material resistance were reduced in the optimized feeding system.

1. Introduction

Feeding systems are mainly used for the storage and transport of mineral materials in mineral processing. The feeding system is generally composed of a bin and feeder; the feeder conveys material under the pressure of the material in the bin. The material pressure increases the starting power required for the feeder. However, the actual power of the feeder will be greatly reduced after it has been started for a period of time due to the feeder generating inertial force after starting, so that the output power of the feeder cannot be fully utilized, resulting in waste of energy and increasing unnecessary manufacturing costs. To solve this problem, Han et al. proved that the lengthening chute of the bin can buffer and reduce the material pressure by theoretical calculation [1]. However, in many practical engineering situations, a long enough chute cannot be installed under the bin due to the limitation of space conditions. In this paper, a method is proposed to reduce the initial material pressure by controlling the movement of the feeder at the bottom of the stock bin based on the study of the formation mechanism and change law of the material pressure.
To address biomass particle aggregation, bridging, pipe blockage, and feeding fluctuation in bins and pipes, Li et al. [2] proposed a novel double-bin pneumatic feeder based on double gases to achieve continuous and stable feed for pyrolysis equipment. Shie and Shu [3] used the simulation method of DEM and experimental method to investigate the flow pattern of the filling and discharging process for two-dimensional plane silos. The effects of using differently shaped inserts on the flow pattern and wall stress are analyzed in this study. The placement of inserts improves the flow behaviors of funnel flow type to mass flow type during discharging. The wall normal stresses are influenced by the change of the flow type. Based on material transfer mechanism, Zhang, Q. and Cheng, X. [4] developed a predictive model for predicting dynamic pressures on the walls of grain bins during discharge. A mass-spring system was proposed to represent the grain bulk in calculating the inertia force caused by deceleration. Zhang, Q. and Ge, T. [5] developed a predictive model for arch destruction during vertical vibration in storage bins for cohesive bulk solids. The model predicts the minimum acceleration amplitudes and thrust forces required for destructing arches at certain locations in storage bins. The aforementioned research on the characteristics of granular materials in the stock bin focused on the fluidity of particles in the bin and the dynamic pressure on the bin wall during unloading. There is little research on the material pressure on the feeder.
The granular matter in the bin is a soft condensed matter composed of numerous discrete particles, which involves multiple physical hierarchies and is a multiscale problem. The mesoscale formed by the contact force chain between particles is the core of the multiscale mechanics research of granular matter [6]. There are many studies on the force chain evolution of granular matter. Wang et al. observed trajectories of force chains in discrete top coal and overlying strata by creating the photoelastic experiment apparatus of granular materials [7]. Dai et al. used the discrete element method (DEM) to simulate the construction of granular piles by considering various particle shapes as well as analyzing the underlying mechanisms through the examination of the macro- and micro-characteristics of granular piles [8]. Meng et al. established a model for uniaxial pressing of powder metallurgy via DEM and studied the force chain evolution law, the stress variation law, the variation of coordination number, and the variation of sliding fraction using the present model [9]. It can be seen that analyzing the mesoscopic evolution of the force chain can explain the macroscopic phenomenon of particulate matter.
Methods that can be used to display force chains include the pressure sensor detection method [10], the color-sensitive carbon paper indentation method [11], the photoelastic method [6], and the DEM [12]. The DEM is one of the easier methods to realize the distribution of force chains and can obtain content that cannot be obtained through theoretical methods and conventional experiments [13,14,15,16]. Xu et al. [17] used the DEM to complete the unloading process of nonsticky soft and sticky hard particles in the moving bed of a simulated flat-bottomed bin. The simulation results show that the collapse of the bin is caused by the sudden increase of friction on the bin wall when the main body changes from the active state to the passive state at the beginning of unloading, which leads to buckling failure. Cleary [18] used 3D discrete element software to perform numerical calculations on industrial-scale silos to study the flow of nonspherical particles. The results of the study indicate that the shape of the particles has a greater impact on the flow pattern. If oval particles were used instead of round particles, the flow rate of the particles would be 29% slower. Chen et al. [19] used the DEM (particle flow code in two dimensions) to study particles’ flow style, velocity fields, internal contact forces, and the lateral pressure of the silo wall. Some information, such as the internal contact forces and velocity fields, which cannot be obtained by theoretic method and experiment were obtained. Both static pressure and dynamic pressure detected by the method of discrete element simulation were in good agreement with the experimental results. The above work uses EDEM (EDEM2017, DEM Solutions, Edinburgh, Scotland, UK) to study the unloading process of the bin and obtains the influencing factors and parameters that affect the fluidity of the material and the side pressure of the bin wall. However, the above research did not conduct in-depth research and analysis on the mechanism of the internal pressure distribution change of the bin by observing the force chain on the mesoscopic scale. In this paper, the DEM method was used to calculate the quasi-static flow of particles in the bin when the feeder at the bottom of the bin moves. The distribution and evolution law of the internal force chain of the bin were studied to clear the mesoscopic mechanism of the change of the material pressure by using the post-processing module of EDEM. The influence of different dropping distances, velocity, and acceleration of the bottom feeder on the change of the material pressure was analyzed. A single-factor experiment was designed to analyze the influence of particle size, material repose angle, and bin slope on material pressure. The results show that the downward movement of the feeder could effectively reduce the static material pressure and that the movement of the feeder at the bottom of the bin caused the change of force chain distribution, which affected the change of material pressure further. Based on this, the optimal design of the vibration feeding system and the scraper feeding system was carried out, and examples were analyzed.

2. Materials and Methods

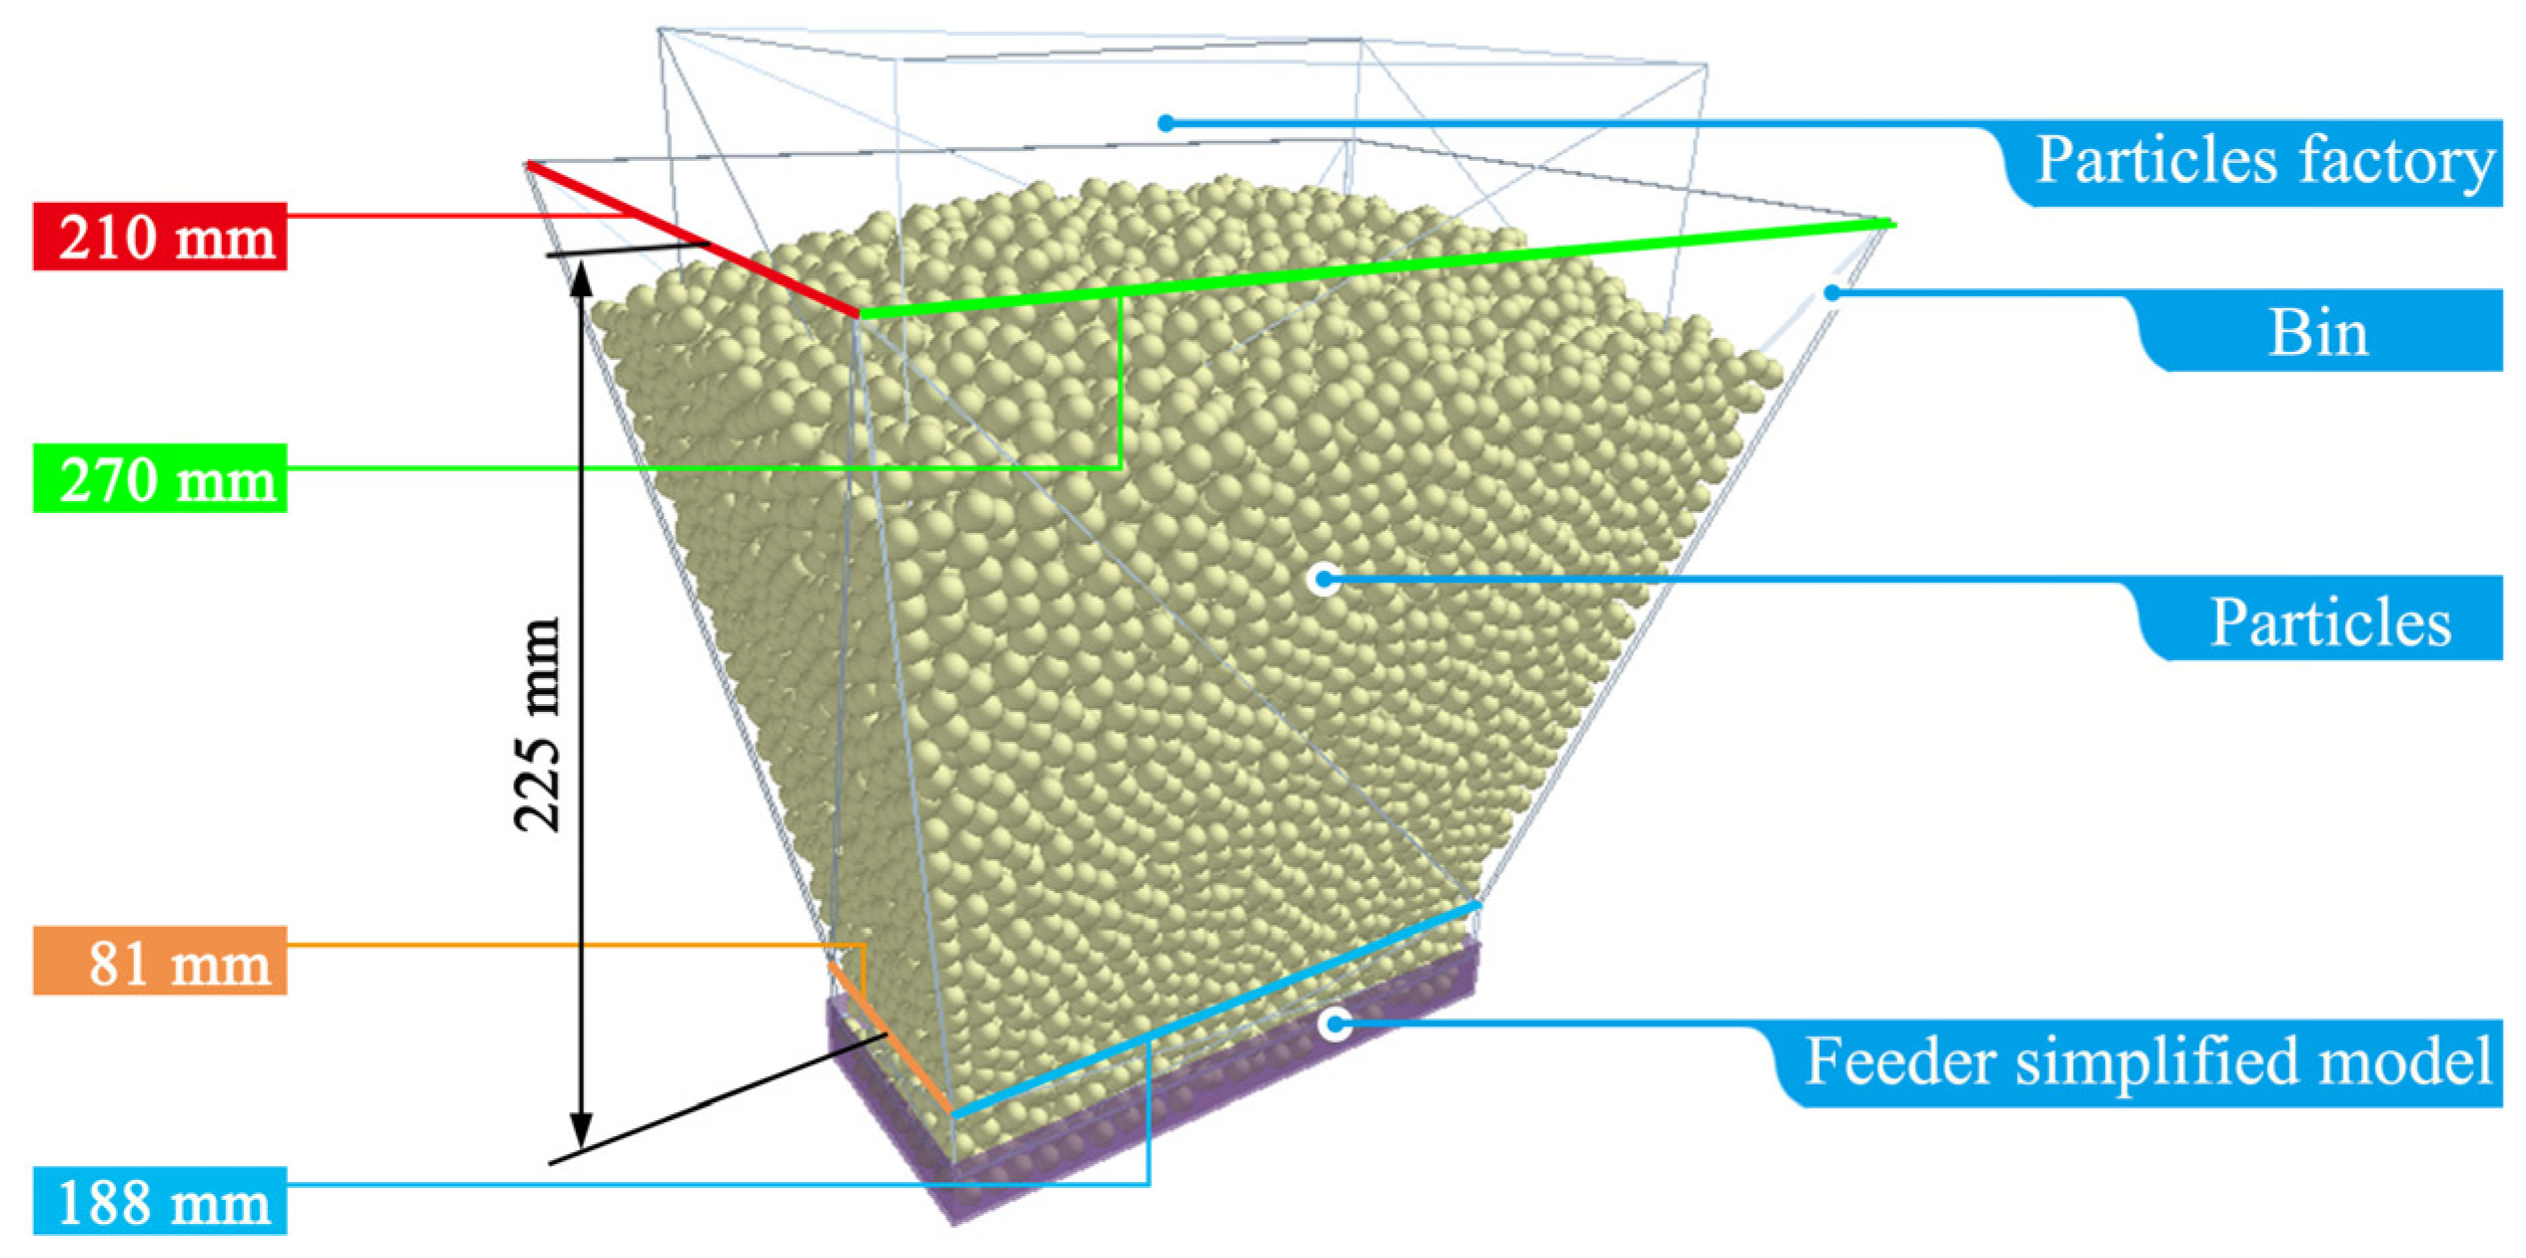
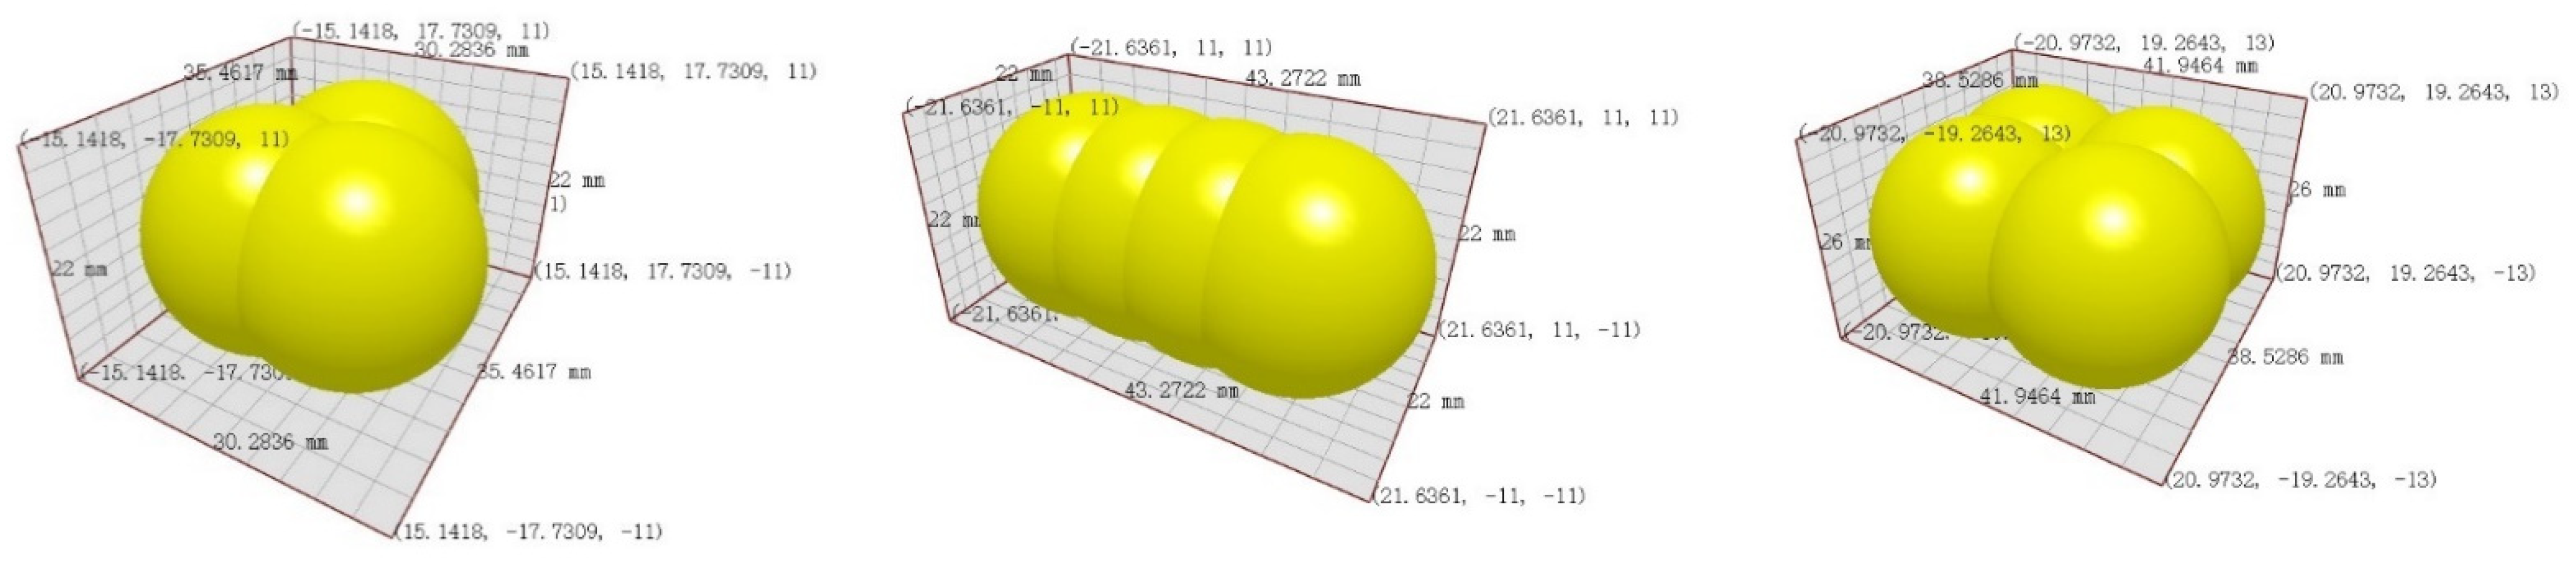
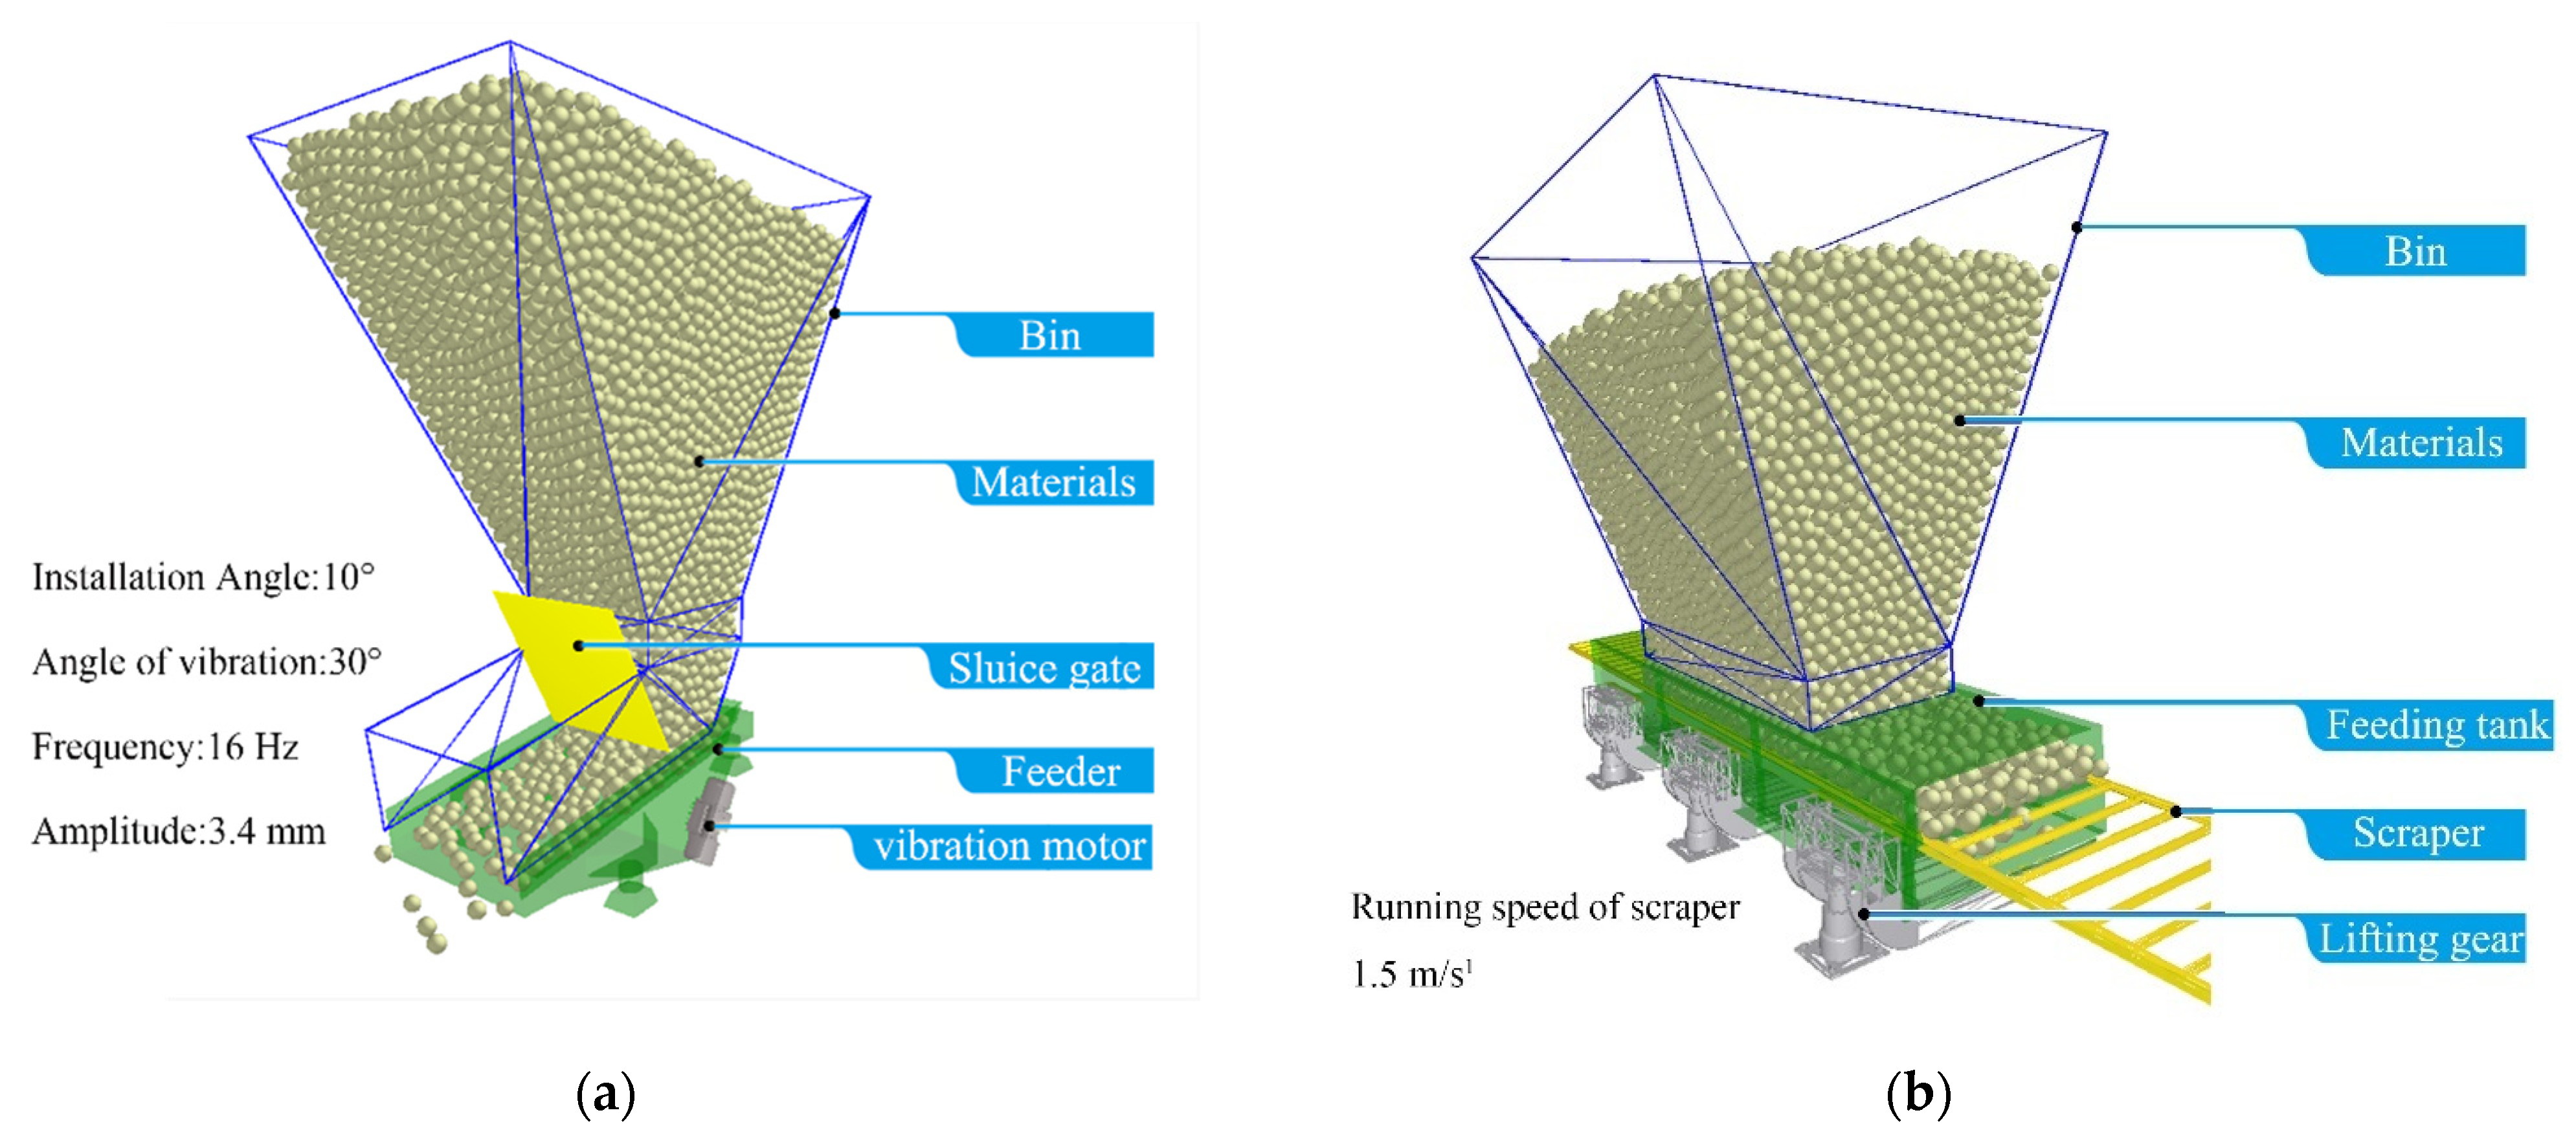
2.1. EDEM Simulation Parameter Setting

To explore the generation mechanism and change law of material pressure, a preliminary experiment was carried out. Hertz normal contact model was adopted to simulate the dynamic behavior of particles in the bin in this paper. To describe the force chain formed by the particle aggregate accurately, the spherical particle size in the simulation was set as 14 mm, less than 1/10 of the cross-section width of the bin [12,20], of which the material is glass. In the simulation, the bin model of polypropylene material and its size are shown in Figure 1.
When the coefficient of restitution is less than 0.8, the influence of the coefficient on particle motion and accumulation characteristics can be ignored [21], and when the coefficient of restitution is 0.5, it can improve the calculation efficiency and realize the simulation of the real contact behavior of particles at the same time [22]. Therefore, the coefficient of restitution of particles in the simulation was 0.5. Existing studies suggest that particle stiffness has little influence on the motion and accumulation characteristics of particles, but the smaller the particle stiffness is, the shorter the time required to complete DEM calculation [23]. Therefore, the particle stiffness selected in the simulation is smaller than the actual value. The material parameter settings are shown in Table 1.

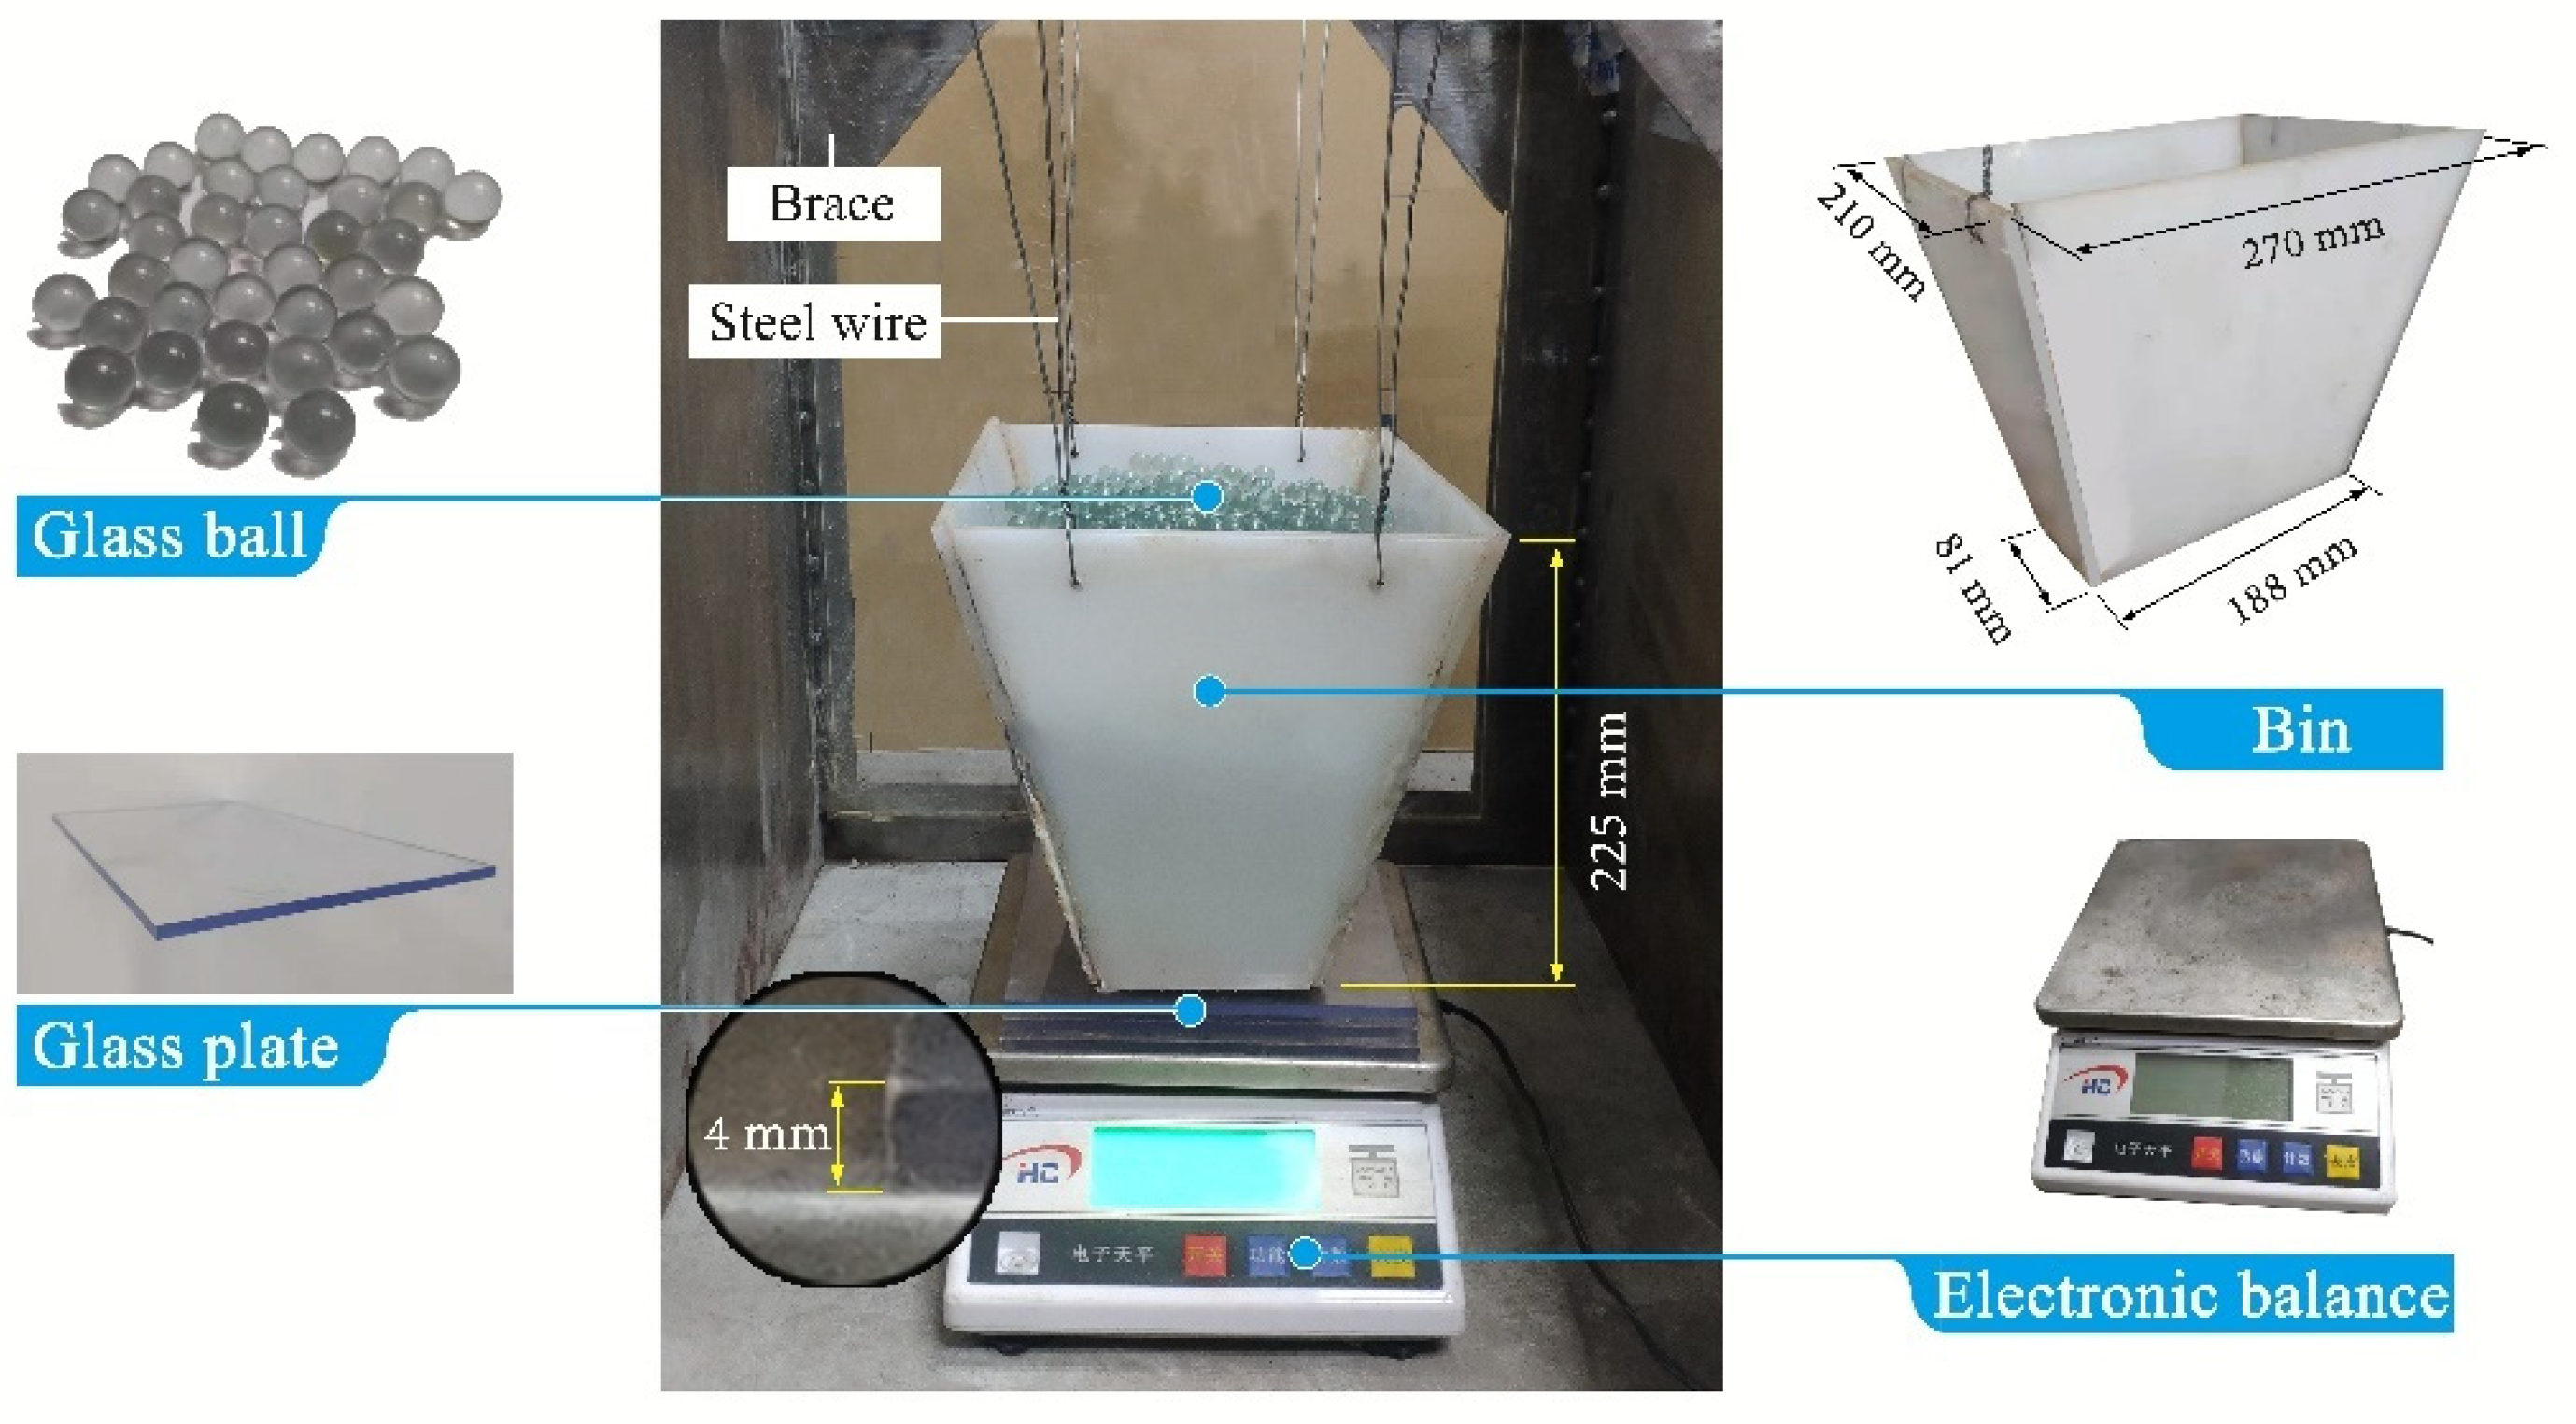
2.2. Experimental Materials and Equipment

The experimental device shown in Figure 2 was designed for the material pressure test. The materials and sizes of the device are consistent with the numerical simulation.
The polypropylene (PP) bin was suspended from the support frame by wire so that it had a gap of just 2 mm with the glass panel below. Three layers of glass plates, each 4 mm thick, were placed on the electronic balance tray. The electronic balance was placed on the ground and reset to zero. Then, 2000 glass balls with a diameter of 14 mm were placed into the bin. After the material pressure is stabilized, the initial bin pressure is the value displayed by the electronic balance multiplied by the gravity acceleration. The glass plate in direct contact with the glass ball was kept without horizontal displacement, and the glass plate below was pulled out to simulate the downward movement of the feeder at the bottom of the bin. Similarly, the upward movement of the feeder at the bottom of the bin was simulated by inserting two glass plates in sequence.

3. Results and Discussion

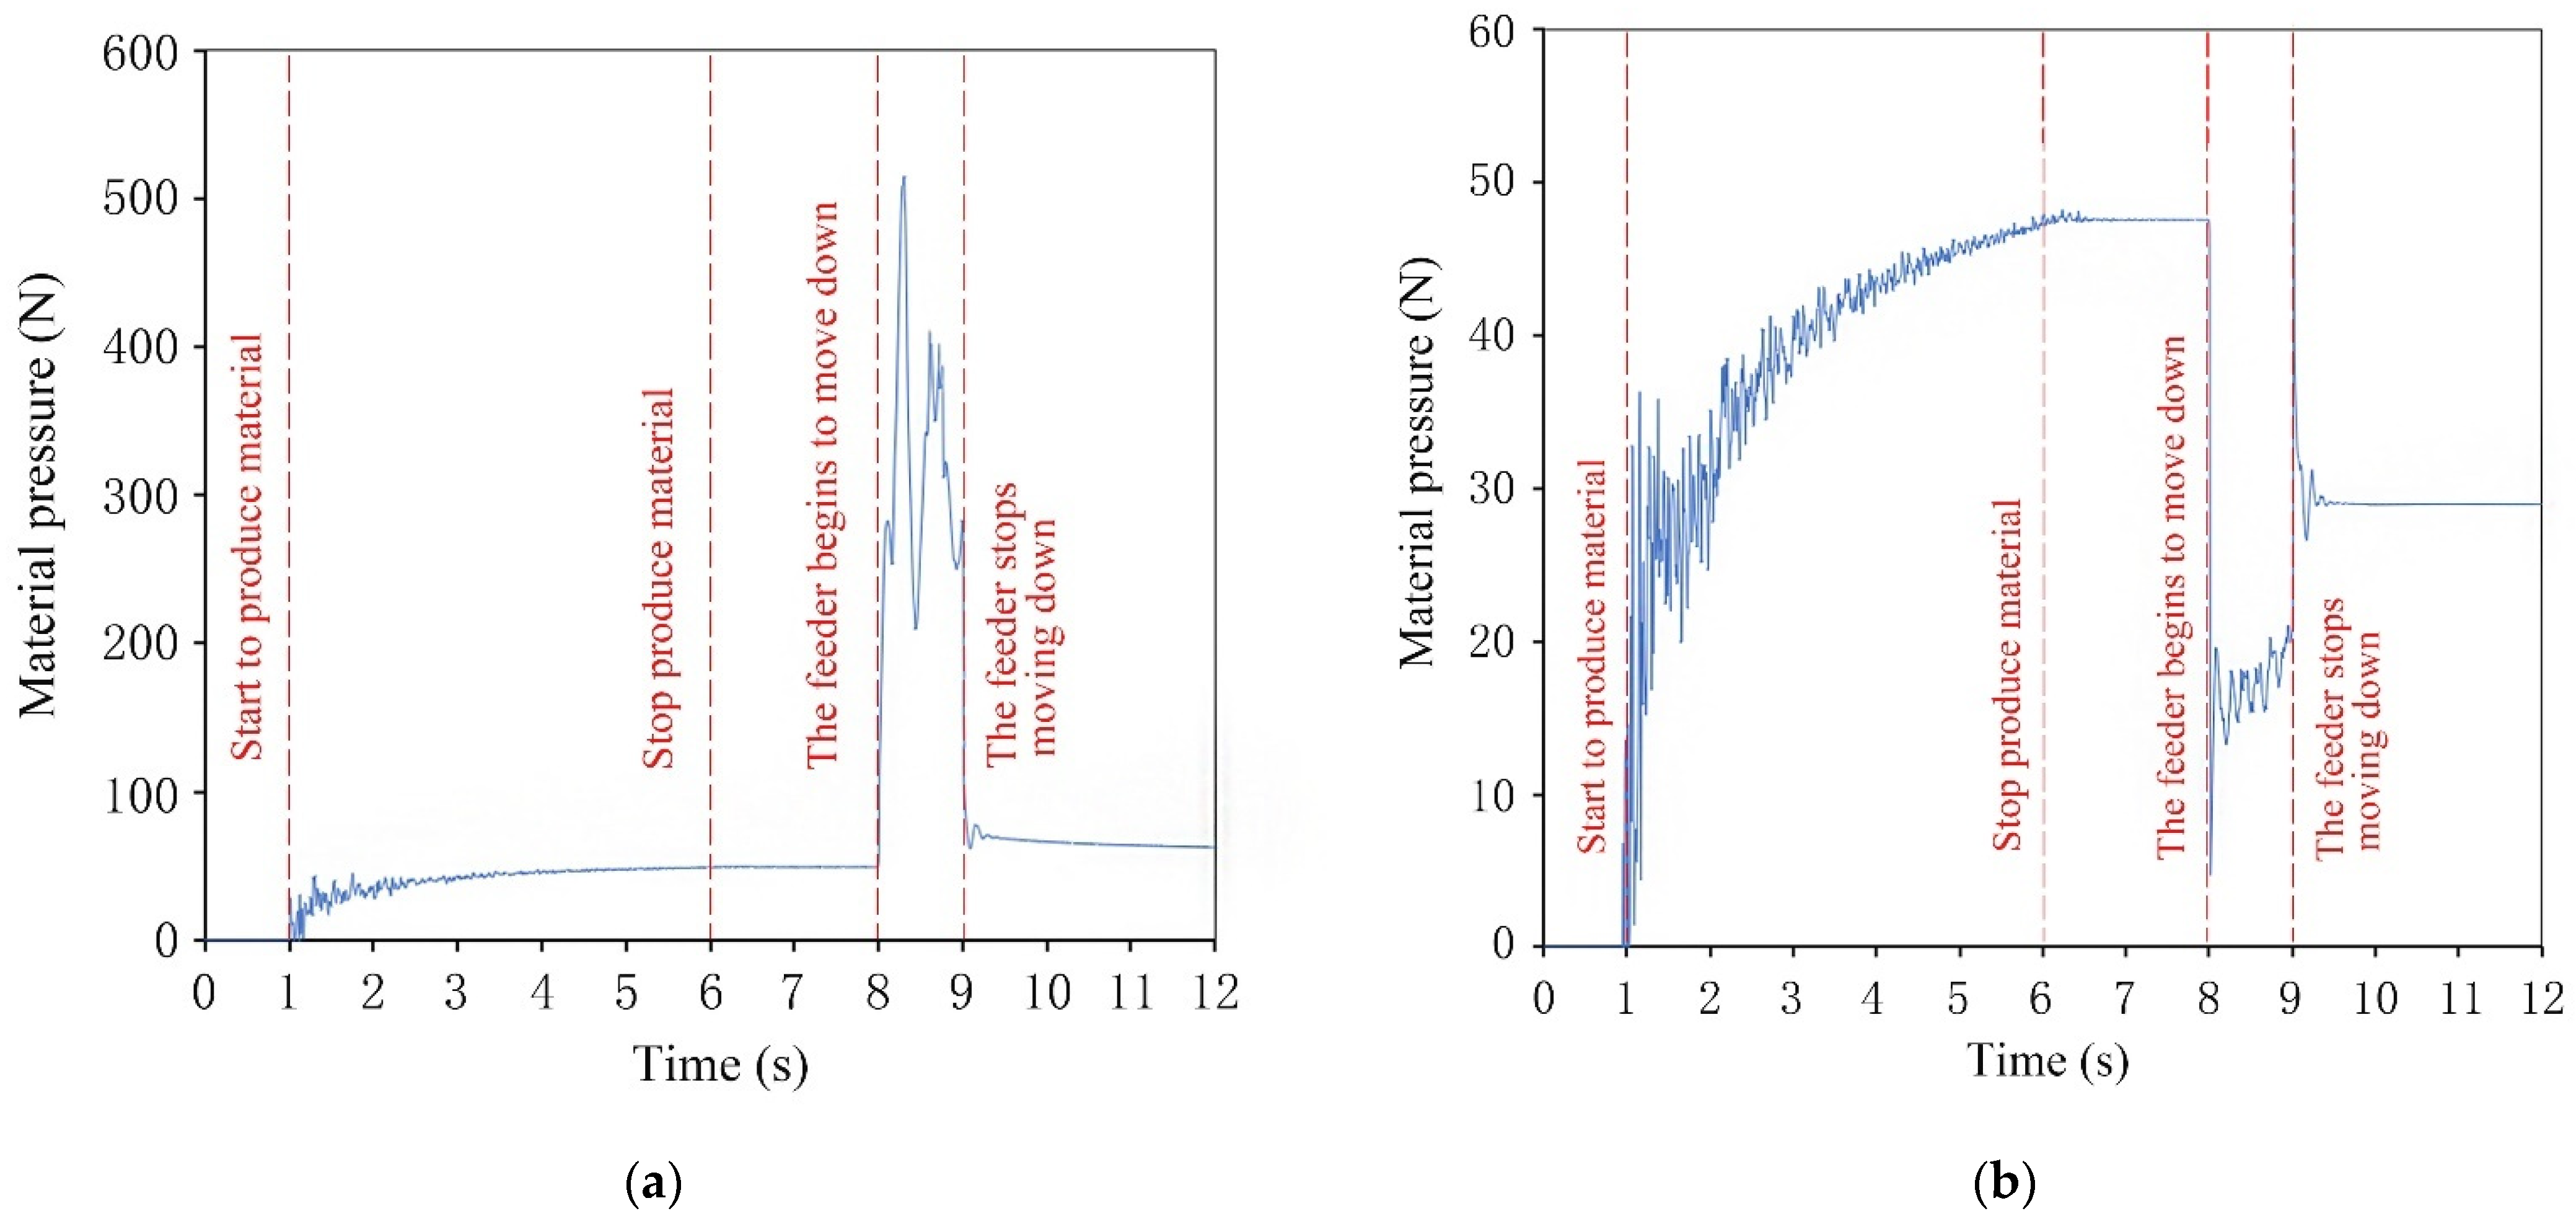
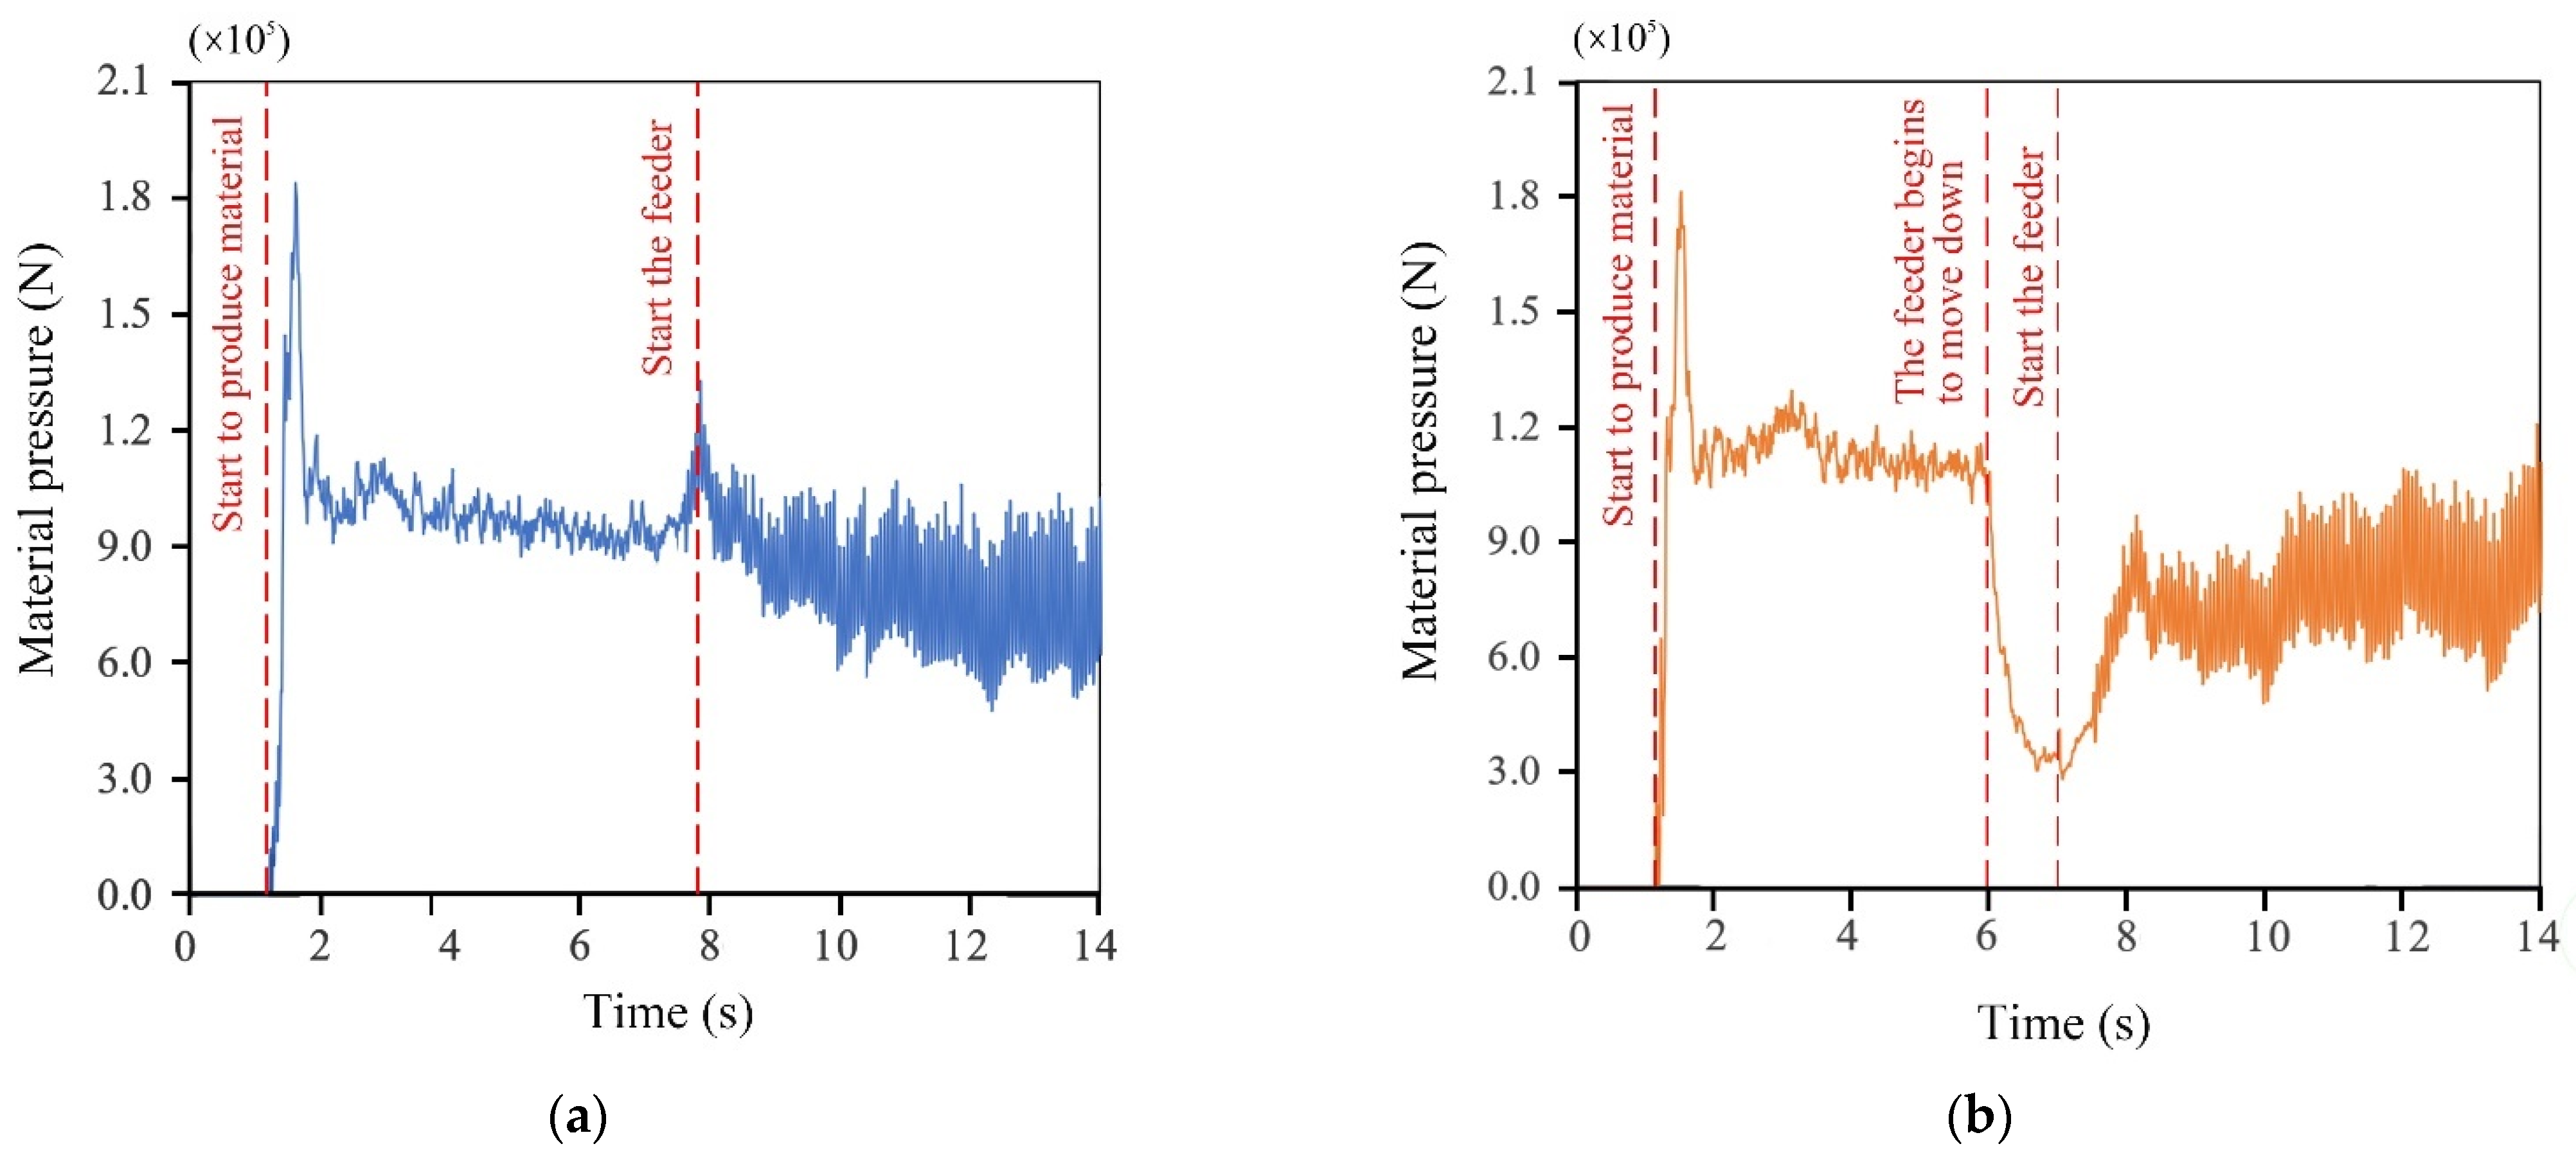
3.1. Influence of the Movement Direction of the Feeder

The variation in result of the material pressure with time when the feeder moves up 4 mm was obtained by discrete element simulation calculation, as shown in Figure 3a. The material pressure rose sharply in 8–9 s but immediately recovered to a smaller level when the feeder stopped in 9 s and gradually tended to stabilize. After the stabilization, the material pressure was 62.3 N, which was greater than the initial value of 47.5 N. The feeder movement in the above process was turned to a downward movement of 4 mm to explore the change of the material pressure when the feeder moves downward, the results of which are shown in Figure 3b. The material pressure dropped sharply in 8–9 s, and then the stable material pressure was 28.9 N, which was less than the original material pressure of 47.5 N.
The changes of material pressure when the feeder drops and rises by 4 mm were measured through the experiment described in Section 2.2. The experimental value, simulated value, and the margin of error are summarized in Table 2. The difference between the experiment and simulation was about 5%, indicating that the simulation results were reliable; the rise of the feeder at the bottom of the bin increased the material pressure, while the drop of the feeder reduced the material pressure.

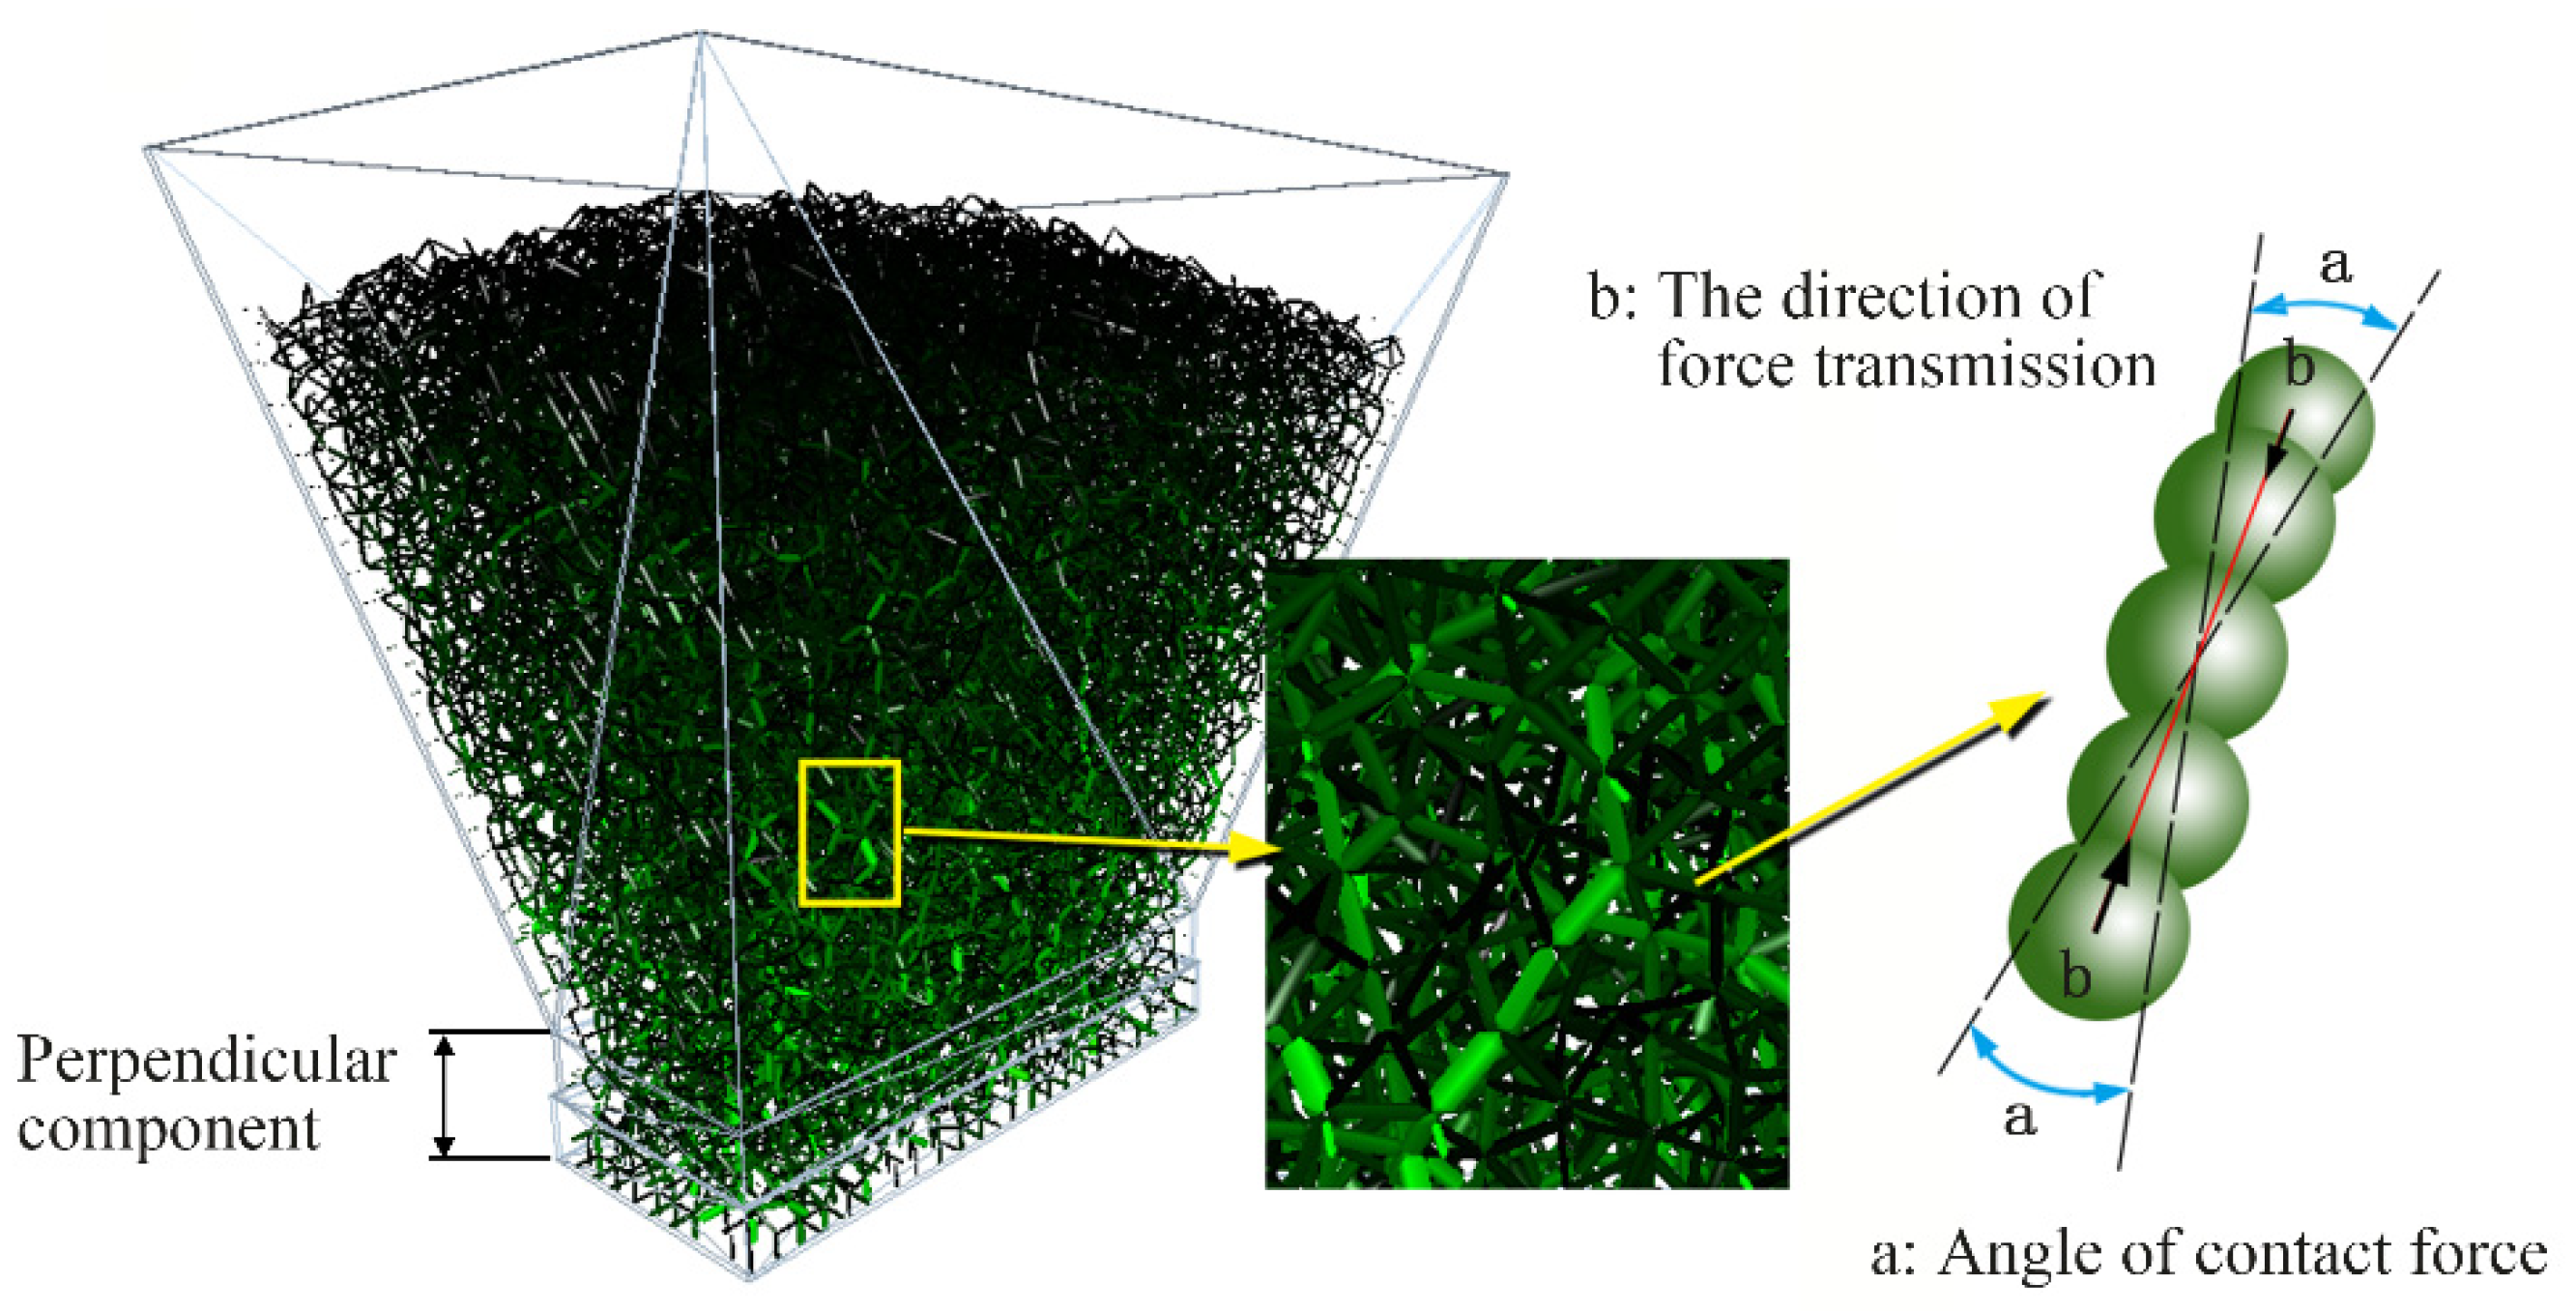
3.2. Evolution Law of Force Chain

As shown in Figure 4, the force chain is usually a stable quasi-linear structure formed by continuous contact of several or dozens of granular particles. The network formed by their interconnections does not uniformly penetrate the granular material. Under the action of gravity or external load, dense granular particles will form strong or weak contact force chains with different contact forces [24]. To observe the distribution of force chains conveniently, strong contact force chains above 3.5 N were selected in green, weak contact force chains below 3.5 N were in black, and super strong chains above 5 N were in red. The particle load is mainly borne by strong contact force chains with the same direction of force and principal stress, and the weak contact force chain is the auxiliary structure of the strong chain [8]. Therefore, the evolution law of strong contact force chains should be mainly observed to study the variation law of material pressure, which clearly shows the transfer law and spatial distribution of the force between particles.
When the feeder moves, the changes of the strong contact force chain in the bin are shown in Figure 5. The spatial distribution regularity of the strong contact force chain in the initial stable state was that the strong chain gradually increases from the top to the bottom of the bin, but the transmission direction had no obvious rule.
As shown in Figure 5a, during the upward movement of the feeder, strong contact force chain density increased, the longitudinal strong contact force chain number increased, and a large number of super contact force chains appeared at the bottom of the bin, which suggested that the upward movement of the feeder at the bottom of the bin caused particles to squeeze upward so that the longitudinal force transmission between particles increased. At the end, strong chain density decreased after the upward movement of the feeder stopped. However, it was still more than the initial strength chain, and the corresponding material pressure increased. As shown in Figure 5b, during the feeder downward movement, the force chain near the bottom of the bin broke, indicating that the granular material above the feeder collapsed, and the number of strong contact force chains pointing to the wall of the bin increased, indicating that the upper part of the material forming the arch structure support did not continue to collapse after the collapse. When the feeder moved downward and reached the final stable state, the strong chain showed the regularity of the distribution of more in the middle as well as less up and down. The strong chain also showed the regularity of the direction of more laterally pointing to the warehouse wall and fewer longitudinal strong chains, reducing the corresponding material pressure.

3.3. Influencing Factors of Material Pressure Changes

It can be seen from Section 3.2. that the evolution of the force chain of the particulate matter in the bin is the root cause of the change in the material pressure before and after the feeder moves. The downward movement of the feeder can cause the materials pressure to decrease. This rule could be used to reduce the initial material pressure of the feeding system. However, the shape and distribution of the force chain in the bin are also affected by the particle size, the slope of the bin body, and the nature of the material. In order to be able to effectively use the change law of the material pressure, a single-factor experiment was designed to study the influence of the ratio of discharge port width to particle diameter (hereinafter referred to as RWD), the slope of the bin body, and the material repose angle on the change of the material pressure. The initial conditions of the single-factor experiment were set as the RWD was 350, the bin body slope was 80°, and the material rest angle was 45°. In the experiment, only one factor was varied, and other factors were kept constant. The material of the bin was steel, and the particle material was coal. Table 3 shows the material parameters.

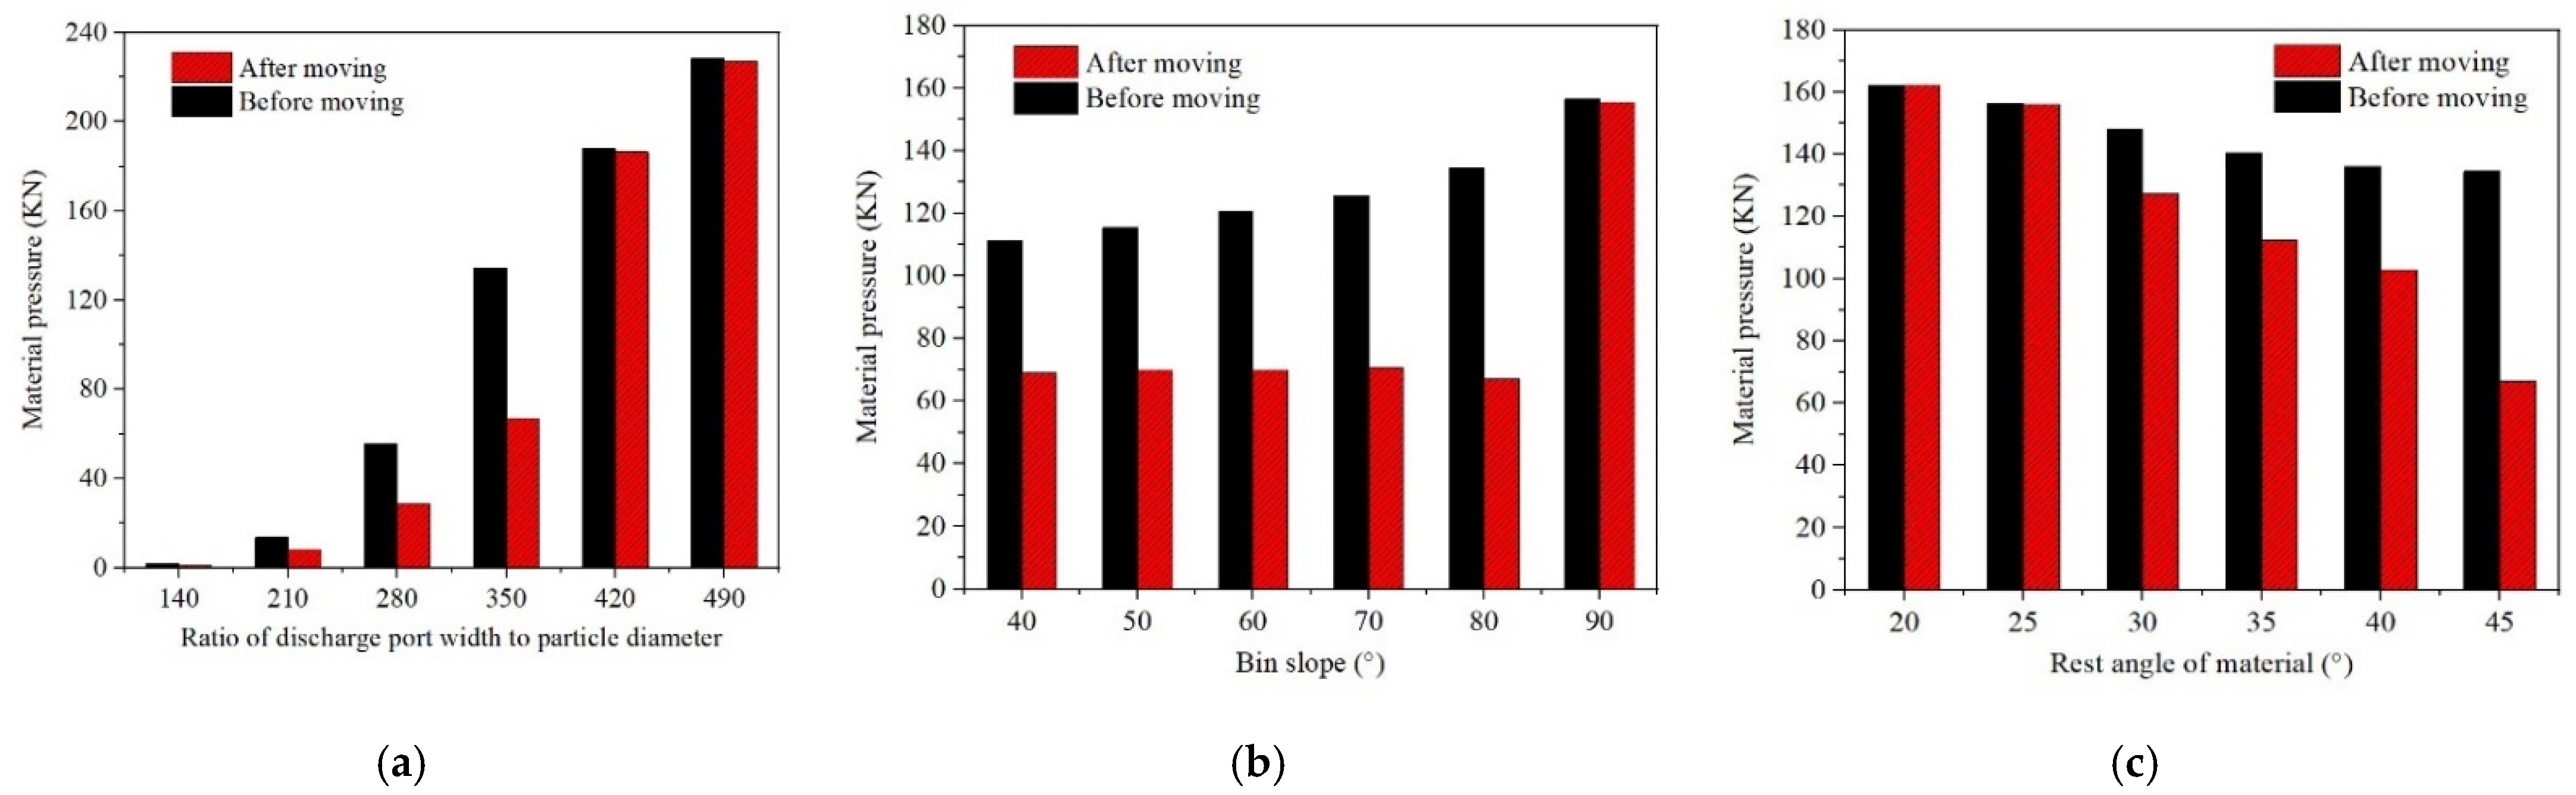
3.3.1. The Influence of Bin Size

The difference in the ratio of the particle size to the size of the bin body results in a different number of particles contained in the bin and a different distribution of the particle force chain, which will inevitably affect the change of the material pressure. In order to study the influence of the ratio of particle size to the size of the bin on the change of the pressure, the particle diameter was kept at 50 mm, and the above bin model was enlarged to 10 times, 15 times, 20 times, 25 times, 30 times, and 35 times, respectively, and then the feeder moving down test was carried out. The RWD was 140, 210, 280, 350, 420, and 490, respectively. The experimental results and the evolution of the force chain is shown in Section 3.3.3.
According to the test results, when the particle size ratio is less than or equal to 350, the feeder can reduce the material pressure by 40–50%, while the downward movement of the feeder will hardly reduce the material pressure when RWD > 350. By observing the force chain distribution in Figure 8a, it was found that when the RWD ≤ 350, the arch structure of force chain was formed after the feeder descends; when the RWD > 350, no arch structure of force chain was formed after the feeder descends. This was because the length of the strong force chain that plays a supporting role was limited. When RWD > 350, the length of the force chain formed by the particles in the bin was not enough to build an arched structure at this distance. In this case, the downward movement of the feeder at the bottom of the bin cannot be used to reduce the material pressure. It should be noted that the particle diameters in each group of experiments were consistent, without considering the combination of different particle size levels.

3.3.2. The Influence of the Bin Body Slope

Industrial storage bins generally have a relatively large slope to prevent materials from sticking to the side walls of the bin and being unable to fall. In this part of the experiment, the slope of bins was designed to be 40°, 50°, 60°, 70°, 80°, and 90°, and the total amount of materials inside each bin was the same. The influence of the bin body slope on the material pressure when the feeder moves down was studied. The experimental results are shown in Figure 7b, and the evolution of the stress chain is shown in Figure 8b.
It can be seen from the experimental results that as the slope of the bin increased, the material pressure increased. Obviously, the steeper the slope of the bin, the smaller the supporting effect of the bin wall on the particulate materials in the bin and the greater the material pressure transferred to the bottom of the bin. When the bin slope was ≤80°, the material pressure after the feeder moves down was about 67 kN, indicating that the slope has little effect on the material pressure after the feeder moved down, when the bin slope is ⩽80°. It can be seen from Figure 8b that since the feeder had the same descending distance and the same size of the discharge port, the force chain of the arch structure formed above the discharge port was also the same, leading to the same material pressure; however, when the slope = 90°, since the arched force chain structure had not been formed, the material pressure did not change significantly after the feeder moved down.

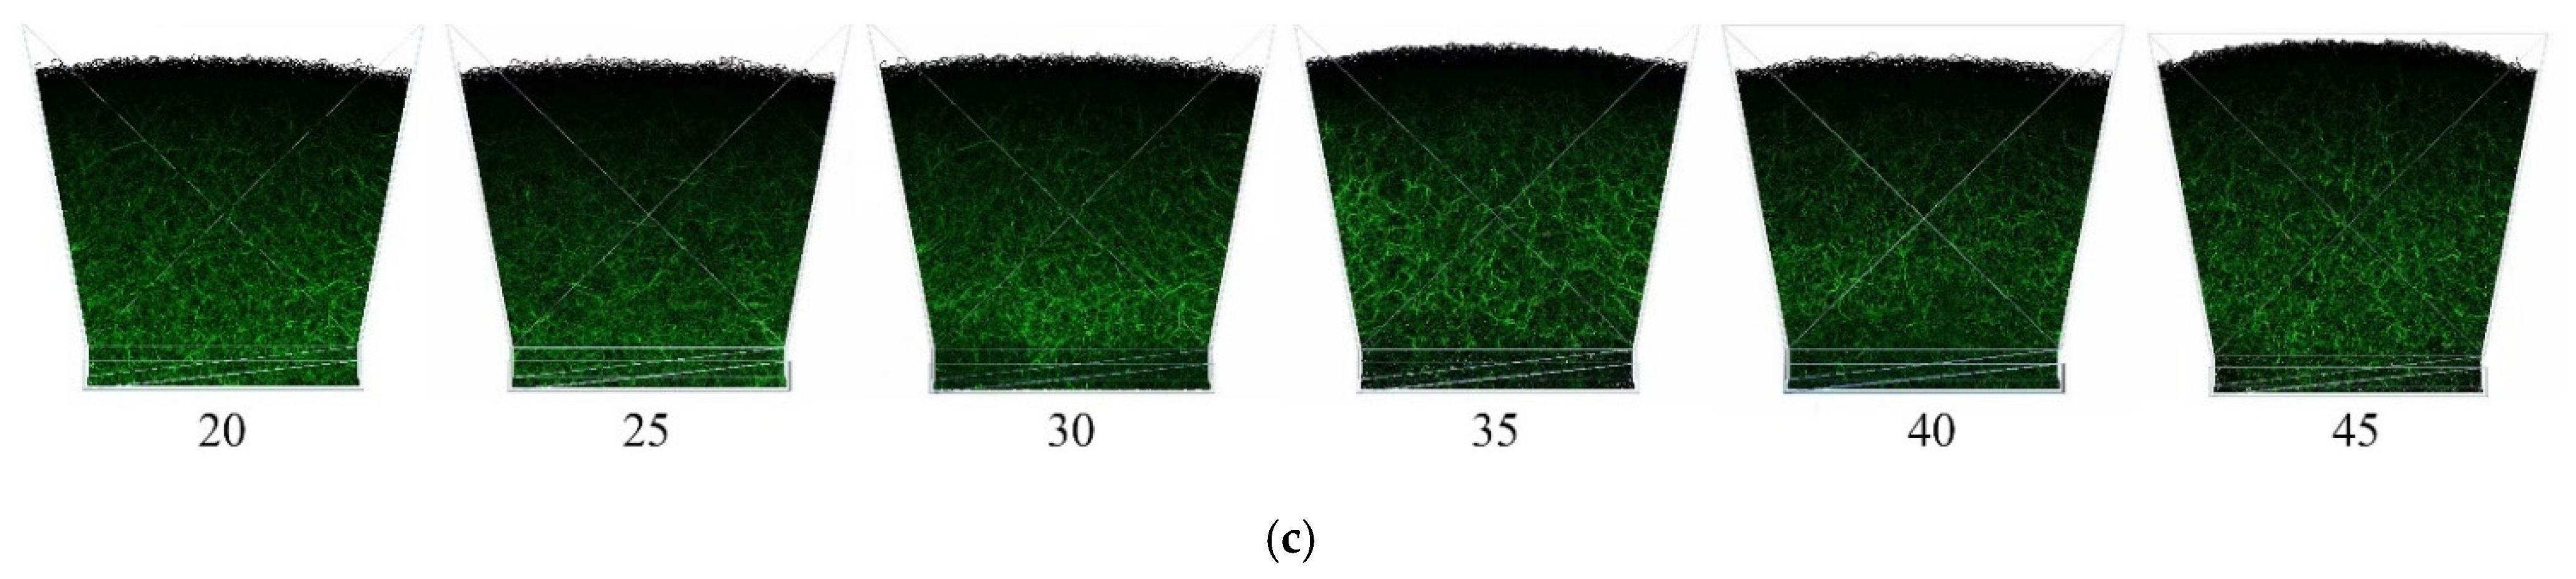
3.3.3. The Influence of Material Resting Angle

Xu et al. [17] proved that the surface adhesion of particles has a large hysteresis effect on the release flow rate. The research of Cleary [18] indicated that the shape of the particles has a greater impact on the flow pattern. However, in actual industrial production, the adhesion force of various particles is not consistent, and the shapes of the particles are also different from each other. Angle of rest is the overall property of particle group determined by the adhesion force between particles, friction force, and particle shape, and it is easier to measure in the production process. Therefore, it is more practically significant to choose angle of rest as the influencing factor to study the material pressure in this paper.
Suitable material inputs can be obtained in the Generic EDEM Material Model (GEMM) database of EDEM for accurate representation of bulk materials. The GEMM database contains thousands of material models representing a wide range of materials such as rocks, soils, and ores. The particle size distribution, bulk density, and angle of repose were selected according to the materials studied. Then, the GEMM database will automatically select the appropriate particle properties (true density, Poisson’s ratio, elastic modulus), shape, and contact properties (restoration value, static friction value, rolling friction value, and cohesive energy value) parameters to ensure that the particle group has the above properties. The materials with rest angles of 20°, 25°, 30°, 35°, 40°, and 45° were set using the GEMM database to study the influence of different rest angles on material pressure. The particle size and shape selected by the GEMM database are shown in Figure 6.
The result is shown in Figure 7c. As the repose angle increases from 25° to 45°, the material pressure decreases from 157.33 kN to 134.57 kN, and the larger the angle of repose, the greater the reduction of the material pressure after the feeder moves down by 0.15 m, while the pressure of the feeder down bin hardly decreases when the angle of repose is less than 30°. Observing the distribution of the force chain in the bin in Figure 8c, it is found that the force chain forms an arched structure only when the material rest angle is ≥30°.
The above studies have further verified that the formation of the arch structure force chain is the root cause of the material pressure reduction, and the force chain arch is also affected by the RWD, the slope of the bin body, and the angle of rest of the material. When the RWD, the slope of the bin body, and the material rest angle exceed a certain range, the material cannot form an arched strong chain support structure, and the material pressure is not significantly reduced. In order to reduce the material pressure, the working conditions of RWD = 350, repose angle = 40, and bin body slope = 80 were chosen in further research to ensure the existence of arching effect.

3.4. Influence Law of Motion State on Material Pressure

Discrete element simulation experiments were used to further explore the influence of different downward motion states of the feeder on the material pressure. Single-factor experiments with different drop distances, falling velocities, and falling accelerations were carried out.

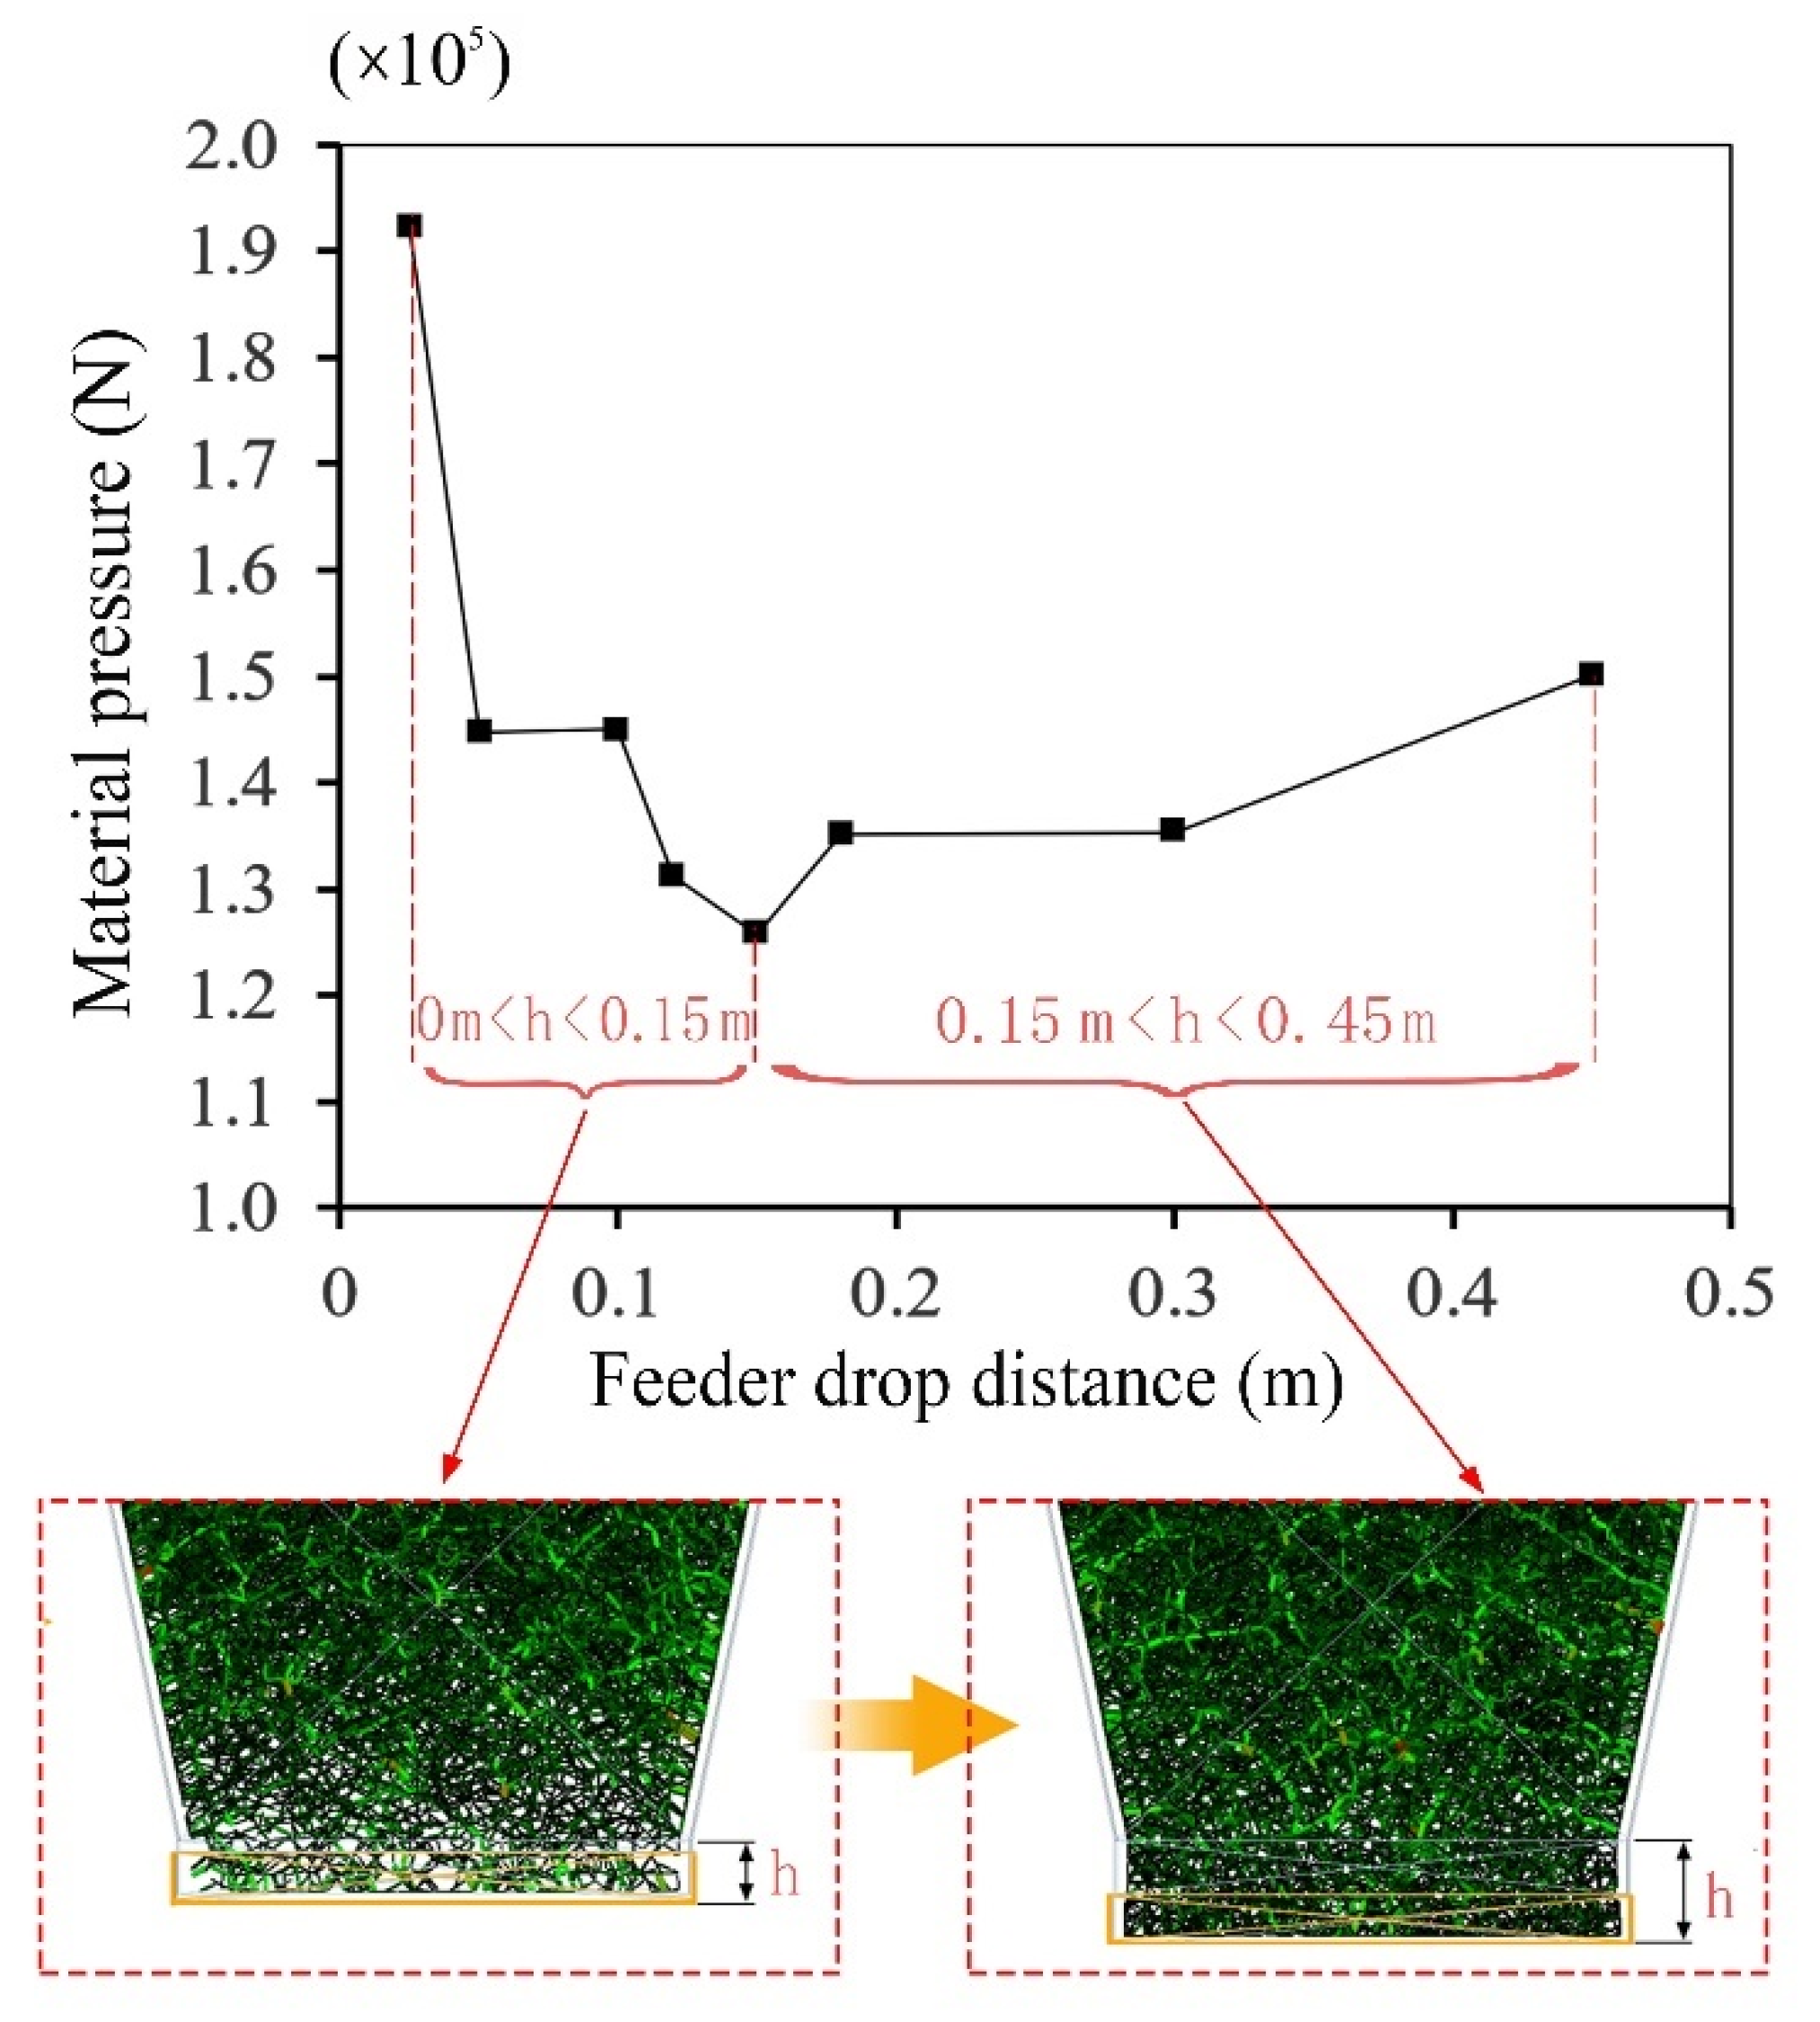
3.4.1. Influence Law of Movement Distance on Material Pressure

The decreasing speed of the feeder was set at 0.45 m/s and the changes of the material pressure at different decreasing distances were simulated. The results are shown in Figure 9. The minimum value of the material pressure was obtained when the decreasing distance was 0.15 m, the material pressure decreased in the range of 0~0.15 m of the decreasing distance and increased in the range of 0.15~0.45 m of the decreasing distance, and the slope of the curve in the interval of 0.15~0.45 m was less than the slope of the curve in the interval of 0~0.15 m.
The reasons for the above experimental results are analyzed as follows. When the drop distance was less than 0.15 m, the particles collapsed and force chains fractured in the vertical section of the bin, and the upper force chain gradually formed an arch structure to play the role of transverse support. With the increase of the drop distance, the longitudinal force chain continued to break, and the transverse force chain continued to produce, leading to the continuous decrease of the material pressure. The material pressure reached the minimum when the drop distance was 0.15 m. With the feeder moving down, the vertical space of the bottom of the bin space increased, the number of particles accumulated in this vertical space increased, and the particles were compacted to formed new strong chains. Therefore, the downward movement after a drop of 0.15 m will lead to the increase of the material pressure, but the rise of the material pressure was small due to the small cross-sectional area of the vertical section.

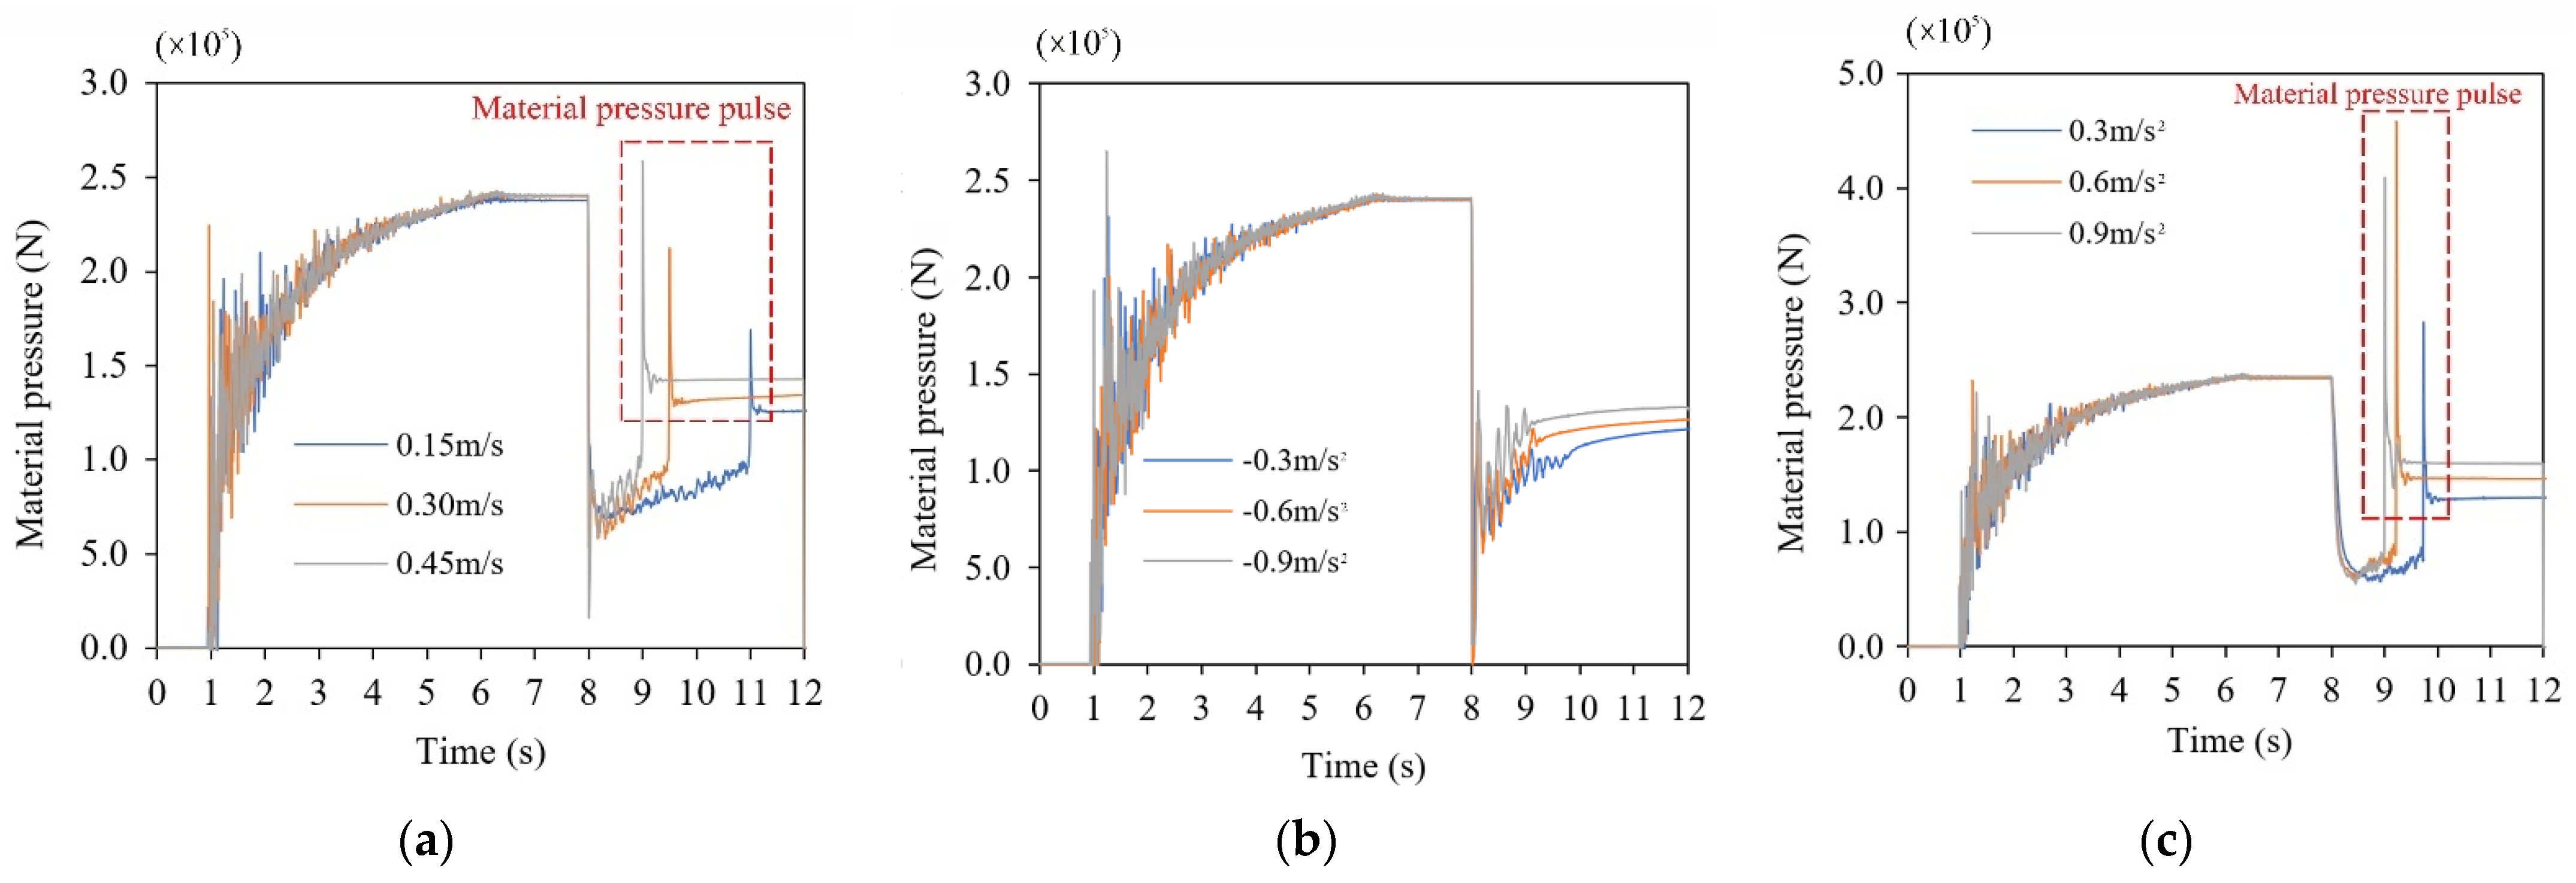
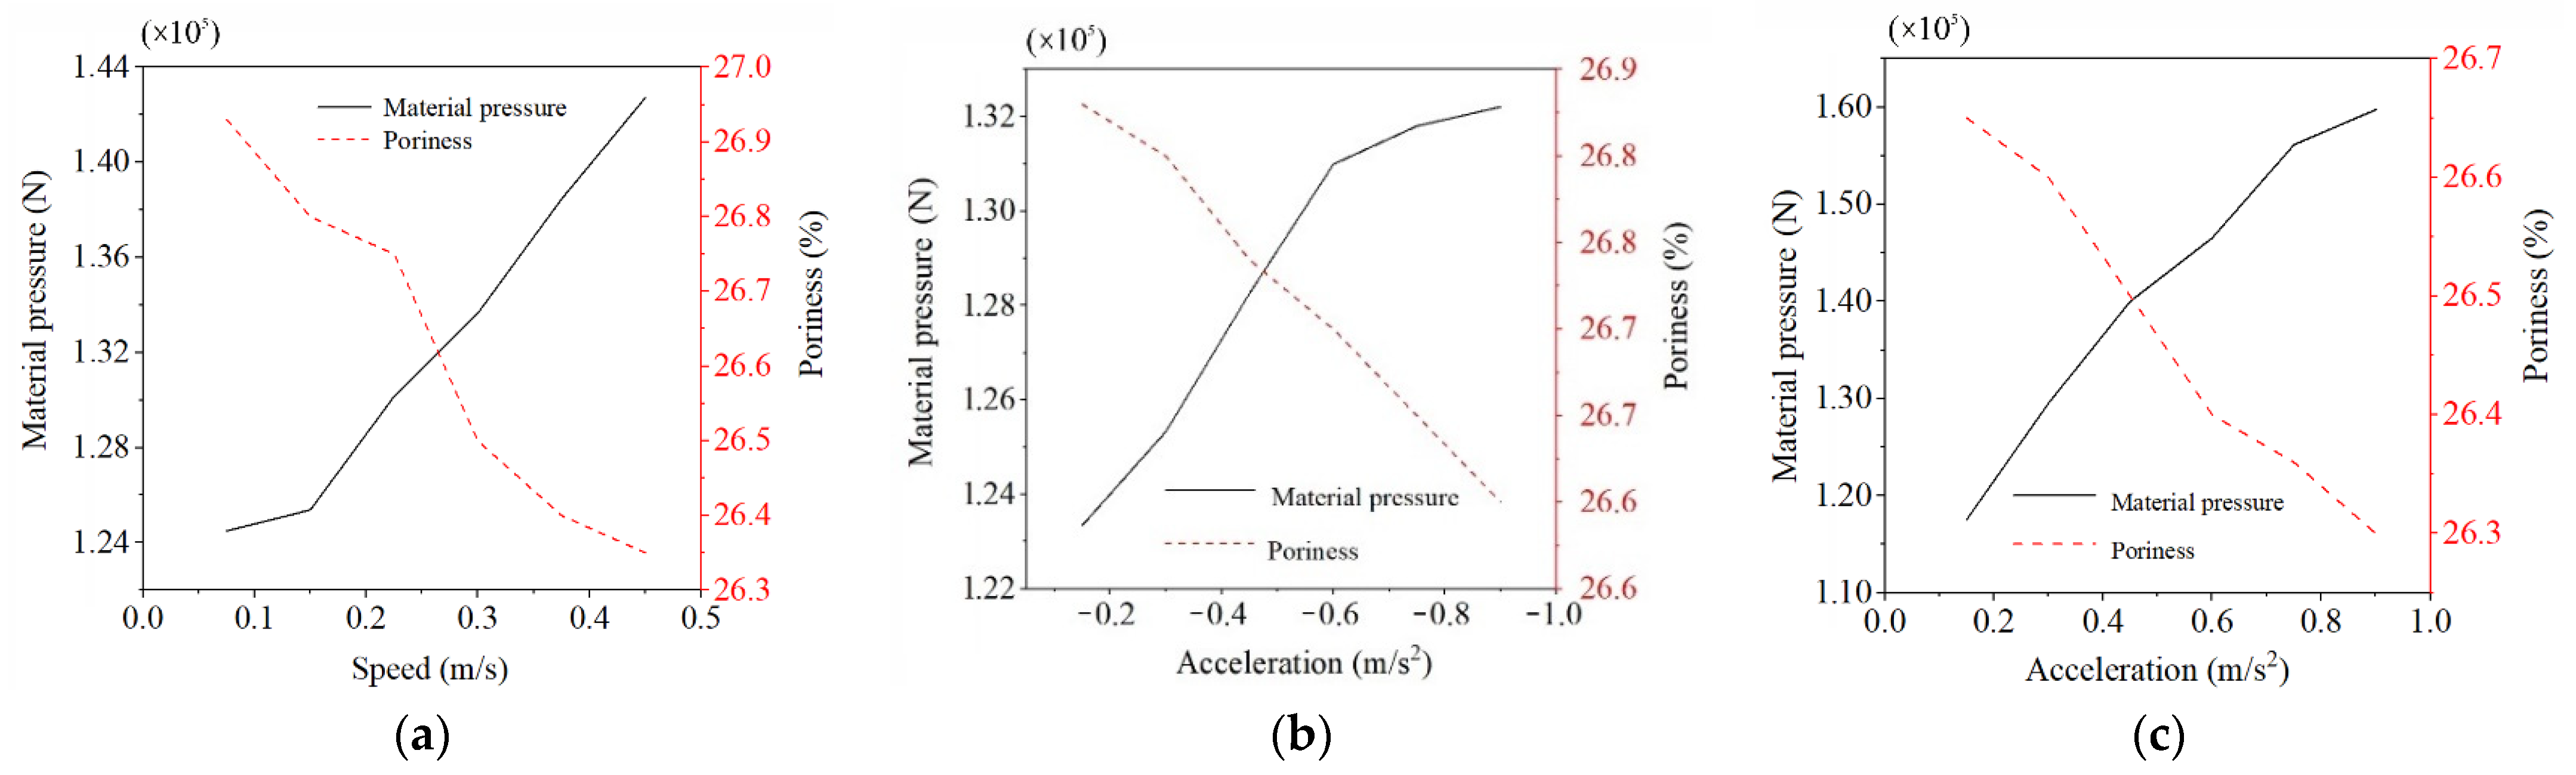
3.4.2. Influence Law of Descending Speed and Acceleration on Material Pressure

When the dropping distance of the feeder was 0.15 m, the changes of material pressure with different dropping speeds and acceleration were simulated. The results are shown in Figure 10 and Figure 11.
It can be seen from Figure 7 that when the feeder movement stopped, regardless of the form of movement of feeder, the material pressure was effectively reduced (the material pressure was reduced by about 50% of the original), but the downward deceleration movement of the feeder had no material pressure pulse compared to the other two cases. This was because the uniform deceleration movement of the feeder continues to impair the overall kinetic energy of the particle group, avoiding the impact on the bottom of the feeder caused by the inertia of material movement when the feeder stops motion.
The porosity is the percentage of the pore volume in the bulk material to the total volume of the material. The smaller the porosity, the closer the contact between the particles, and vice versa, the looser the contact between the particles. As can be seen from Figure 8, within the given range of motion parameters, as the moving speed increased from 0.075 m/s to 0.45 m/s, the porosity decreased from 26.93% to 26.35%, and the material pressure increased from 124 kN to 142 kN. During the deceleration descent, when the acceleration decreased from −0.15 m/s2 to −0.9 m/s2, the porosity decreased from 26.85% to 26.6%, and the material pressure increased from 123 kN to 132 kN. During the accelerating descent, as the acceleration increased from 0.15 m/s2 to 0.9 m/s2, the porosity decreased from 26.65% to 26.3%, and the material pressure increased from 117 kN to 160 kN. This was because the feeder with a larger absolute acceleration or greater absolute speed movement will cause the material to obtain greater kinetic energy. When the feeder stopped falling, the material group was compacted by inertia force. As a result, the porosity of the material decreased and the pressure of the material increased.

3.5. Response Surface BBD Optimization Experiment

From the results in Section 3.1, it can be seen that the downward movement of the feeder under the bin reduced the material pressure. Therefore, based on the working conditions of RWD = 350, repose angle = 40, and bin body slope = 80, a method of the feeder moving downwards to reduce the initial material pressure was designed. According to the conclusion in Section 3.4.2, the descent process of the feeder was specifically set to decelerate to eliminate the impulse impact caused by the inertia of the material. The feeder also needs to have an initial speed, so an accelerated descent process was added before the decelerating process, obtaining a descent that speeds up and then slows down. In this section, the orthogonal rotation test was designed to optimize this process by taking the dropping distance, the dropping acceleration, and the negative acceleration as independent variables, and the stable material pressure as the evaluation index. The level of each factor was designed according to the results of the single-factor experiment. The range of drop distance is 0~3 m, and the range of acceleration is ±0~0.1 m/s2. The test results are shown in Table 4.
The quadratic polynomial regression model of Equation (1) was obtained according to the data samples in Table 4.
F = 92.365 − 46.438H + 84.234A1 − 1.962A2 + 95.078HA1 − 293.175HA2 − 732.68A1A2 + 337.086H2 − 358.228A12 + 396.778A22
where F is the material pressure, H is the drop distance, A1 is the acceleration, and A2 is the negative acceleration.
Analysis of variance was performed on the regression model. The f value of the regression model was 4.84, which means that the model was significant. Lack of fit > 0.05, indicating that the regression model had a high degree of fitting. Adequate precision = 7.075 > 4, which indicates that the fitted regression model had high reliability. According to the p-value, the effect of test factors on the stable material pressure from large to small was in order of drop distance, negative acceleration, and acceleration. The p-value of regression model < 0.05, indicating that the three regression terms had significant interaction in the regression model.
The 3D response surface of the interaction effect of various factors is shown in Figure 12. It can be seen from the response surface diagram, that within the optimization range, the material pressure reaches the minimum value when the movement acceleration of the feeder is 0.001 m/s2, the negative acceleration is 0.1 m/s2, and the drop distance is 0.08 m.
In summary, the method of using the downward moving of the feeder to reduce the pressure is summarized as follows:
  • Investigate the material rest angle, bin body slope, and RWD to determine whether the downward movement of the feeder can cause the material pressure to decrease.
  • Design a reasonable descent process of the feeder; there should be enough deceleration time before the feeder stops to eliminate the inertial impact of the material.
  • Appropriate optimization methods can be applied to optimize the designed descent process.

4. Example Analysis of Feeding System

The scraper feeding system and the vibration feeding system were optimized according to the results of Section 3.4. Discrete element simulations were carried out on the model before and after optimization to explore the optimization effect of material pressure near the actual working conditions. The simplified models of the feeding systems are shown in Figure 13.
Figure 14a and Figure 15a show the change of material pressure during the unoptimized feeding process. When the feeders start, the material pressure of the vibration feeding system rises from 9.5 × 10⁴ N to 1.1 × 10⁵ N, while the material pressure of the scraper feeding system rises from 4.7 × 10⁵ N to 5.3 × 10⁵ N. This may be due to the upward movement of the vibrating feeder and the dislocation between the particles of the scraper feeder, which causes the material to be squeezed and the pressure of the material to increase suddenly. With the discharge of granular materials at the bottom of the bin, the particles in the bin of the two feeding systems experienced the force chain evolution process of collapse into the arch, causing the bin pressure to continue to fall, and finally achieved dynamic stability in a certain range. In the stable working state, the change of material pressure of the vibration feeding system is an approximate sinusoidal curve, while the change of the material pressure of the scraper feeder is a small amplitude of the nonperiodic curve. This is because the two feeders run in different forms. When the vibrating feeder is conveying material, the feeder moves sinusoidal with respect to the bin outlet in the vertical direction, resulting in the bin pressure having approximately sinusoidal changes. The material tank of the scraper feeder was stationary, and the material was carried out by the scraper. Therefore, the material pressure only showed relatively moderate nonlinear change due to the evolution of the force chain.
As shown in Figure 14b and Figure 15b, the initial material pressure of optimized feeding process decreased. The material pressure was very small when the feeder starts. Therefore, in this case, the power required for starting the feeder was reduced, but, as the material was discharged, the material pressure of both feeding systems increased slowly and eventually reached the same state as the unoptimized material pressure.
Material resistance to the feeder during operation is shown in Figure 16, wherein the resistance to the vibrating feeder is the force of the material in the vibration direction, and the resistance to the scraper feeder is the force of the material in the direction of the scraper movement. When the scraper feeder was not running before 10 s, there was no material resistance on its chain plate, so the material resistance before 10 s in Figure 16b was close to zero. While the vibrating feeder was not running, the material on the vibrating feeder tank had an initial pressure.
In the unoptimized feeding process, the material resistance of the vibrating feeder starting is 28.76% higher than that of stable operation, and the material resistance of the hanging plate feeder starting is 27.84% higher than that of stable operation. This caused the actual power of the feeder to be greatly reduced after starting for a while so that the output power of the feeder could not be fully utilized during a long period of stable operation. Comparing Figure 14, Figure 15 and Figure 16, it can be found that the material resistance and the corresponding material pressure change trend are generally consistent, indicating that the material pressure has a strong correlation with the material resistance. Therefore, the optimized feeding systems also reduce the material resistance when the feeders start, avoiding large changes in material resistance.

5. Conclusions

EDEM software was used to analyze the evolution law of the force chain to reveal the mesoscopic mechanism of the change of material pressure. The upward movement of the feeder leads to the upward extrusion of particles in the bin, the longitudinal transfer force between particles is enhanced, and the bin pressure increases. The downward movement of the feeder leads to the collapse of the material and the fracture of the longitudinal force chain close to the bottom of the bin. The particles above the collapsed particles will form the force chain of the arch structure to support the upper part of the material so that it does not continue to collapse, and the material pressure at the discharge port is reduced.
A single-factor experiment was designed to study the influence of the ratio of dis-charge port width to particle diameter, the slope of the bin body, and the material repose angle on the change of the material pressure. The experiment further verified that the formation of the arch structure force chain is the root cause of the material pressure reduction, but when the above factors exceed a certain range, the arched force chain structure will not be formed. The results show that the material pressure can be reduced by downward moving of the feeder within the following conditions: material rest angle = 45, bin body slope = 80, and RWD ≤ 350; material rest angle = 45, RWD = 80, and the bin body slope ≤80; RWD = 80 and bin body slope = 80, material resting angle ≥ 30.
Under the conditions of bin body slope = 80, material rest angle = 45, and RWD = 350, the material pressure under different feeder motion states was analyzed. The results show that when the feeder movement stopped, regardless of the form of movement of feeder, the material pressure was effectively reduced. However, when the absolute value of the downwards acceleration or speed of the feeder was greater, the material pressure after the falling of the feeder was greater, and the downward deceleration movement of the feeder could eliminate the impact of the material. Based on this principle, the motion process of the feeder was designed to accelerate and descend before deceleration, and the response surface method was used to optimize it for this condition. Within the optimization range, the material pressure reached the minimum value when the movement acceleration of the feeder was 0.001 m/s2, the negative acceleration was 0.1 m/s2, and the drop distance was 0.08 m. A method of reducing material pressure in industrial production was proposed.
Vibrating feeder and scraper feeder of the example analysis results showed that the vibrating feeder and scraper feeder material resistance of startup are 27~29% higher than the material resistance of the stable operation. The drop of the feeder before the feeding system begins discharging, reducing the material resistance effectively when the feeders start, optimizing the design of the feeder power and reducing the energy consumption of the feeding system.

6. Patents

A Chinese invention patent is being applied: A method for reducing initial material pressure at the bottom of a large bin, patent number: 202011533634.5.

Author Contributions

N.X.: conceptualization, methodology, software, writing—original draft preparation, writing—reviewing and editing; X.W.: supervision; C.Y.: investigation and visualization; D.L.: data curation; G.Z.: investigation. All authors have read and agreed to the published version of the manuscript.

Funding

This research was funded by the Fundamental Research Funds for the Central Universities, grant number 2020YJSHH17 and 2021YJSHH32; Anhui Province Major Science and Technology Achievements Engineering Research and Development Special Project, grant number 202103c08020007.

Data Availability Statement

Not applicable.

Acknowledgments

This work was supported by the Fundamental Research Funds for the Central Universities (No. 2020 YJSHH17).

Conflicts of Interest

The authors declare no conflict of interest.

References

  1. Han, Y. Discussion on the Influence of Warehouse Pressure Calculation on the Design of Belt Conveyor. Hoisting Conveying Mach. 2012, 2, 55–58. [Google Scholar]
  2. Li, P.; Wang, N.N.; Si, H.; Chang, J.M. Feeding characteristics of a novel double-bin pneumatic feeder of biomass particles. Powder Technol. 2020, 363, 735–744. [Google Scholar] [CrossRef]
  3. Shie, C.Y.; Shu, S.H. The simulation and experimental study of granular materials discharged from a silo with the placement of inserts. Powder Technol. 2001, 120, 244–255. [Google Scholar]
  4. Zhang, Q. An Intermittent Arch Model for Predicting Dynamic Pressures during Discharge in Grain Storage Bins. Trans. ASABE 2014, 57, 1839–1844. [Google Scholar]
  5. Zhang, Q.; Ge, T. Development of a predictive model for arch destruction by vibration in storage bins for cohesive bulk solids. Trans. ASAE 2005, 48, 1905–1910. [Google Scholar]
  6. Sun, Q.; Wang, G.; Hu, K. Considerations on several key problems in the mechanics of particulate matter. Prog. Nat. Sci. 2008, 10, 1104–1110. [Google Scholar]
  7. Wang, J.A.; Liu, Y.; Fei, L.; Wang, C. Force chains in top coal caving mining. Int. J. Rock Mech. Min. Sci. 2020, 127, 104218. [Google Scholar] [CrossRef]
  8. Dai, B.B.; Yang, J.; Liu, F.; Lin, K. Characteristics and mechanism of natural accumulation of granular soil. J. Geotech. Eng. 2019, 41, 57–60. [Google Scholar]
  9. Meng, F.J.; Pang, M.H.; Hua, S.Z.; Liu, H.B.; Cheng, P.F.; Zhang, T.; Wu, Z.Q. Research on Mechanical Mechanism of Powder Metallurgy Uniaxial Pressing Process. Mech. Sci. Technol. Aerosp. Eng. 2020, 39, 1128–1132. [Google Scholar]
  10. Løvoll, G.; Máløy, K.J.; Flekkøy, E.G. Force measurements on static granular materials. Phys. Rev. E 1999, 60, 5872–5878. [Google Scholar] [CrossRef]
  11. Blair, D.L.; Mueggenburg, N.W.; Marshall, A.H.; Jaeger, H.M.; Nagel, S.R. Force distributions in three-dimensional granular assemblies: Effects of packing order and interparticle friction. Phys. Rev. E 2001, 63, 41304. [Google Scholar] [CrossRef] [Green Version]
  12. Peters, J.F.; Muthuswamy, M.; Wibowo, J.; Tordesillas, A. Characterization of force chains in granular material. Phys. Rev. E 2005, 72, 041307. [Google Scholar] [CrossRef] [PubMed]
  13. Jiao, Y.; Zhang, X.X.; Kong, F.C.; Liu, H.S. Discrete element method simulation of collision depolymerization of wet particles. J. Appl. Phys. 2015, 64, 328–337. [Google Scholar]
  14. Yang, Y.; Chen, Y.M.; Wang, J.A. Exploring the contact types within mixtures of different shapes at the steady state by DEM. Powder Technol. 2016, 301, 440–448. [Google Scholar] [CrossRef]
  15. Meng, F.J.; Meng, X.; Hua, S.Z.; Ma, S. Fluctuation and self-diffusion research about dry granular materials under shearing. J. Braz. Soc. Mech. Sci. Eng. 2019, 41, 153. [Google Scholar] [CrossRef]
  16. Wang, W.; Gu, W.; Liu, K. Force chain evolution and force characteristics of shearing granular media in taylor-couette geometry by DEM. Tribol. Trans. 2015, 58, 197–206. [Google Scholar] [CrossRef]
  17. Xu, Y.; Kafui, K.D.; Thornton, C.S. Discharge Simulation with Different Particulate Properties Using the Distinct Element Method. Trans. Chin. Soc. Agric. Eng. 1999, 15, 65–69. [Google Scholar]
  18. Cleary, P.W.; Sawley, M.L. DEM modeling of industrial granular flows:3D case studies and the effect of particle shape on hopper discharge. Appl. Math. Model. 2002, 26, 89–111. [Google Scholar] [CrossRef]
  19. Chen, C.; Liang, X. Analysis on discrete element simulation of discharging in silos. Sci. Technol. Grain Oil Food 2008, 16, 11–13. [Google Scholar]
  20. Tordesillas, A.; Walker, D.M.; Lin, Q. Force cycles and force chains. Phys. Rev. E 2010, 81, 011302. [Google Scholar] [CrossRef] [PubMed]
  21. Staron, L.; Hinch, E.J. The spreading of a granular mass: Role of grain properties and initial conditions. Granul. Matter 2007, 9, 205–217. [Google Scholar] [CrossRef]
  22. Jing, L.; Yang, G.C.; Kwok, C.Y.; Sobral, Y.D. Dynamics and scaling laws of underwater granular collapse with varying aspect ratios. Phys. Rev. E 2018, 98, 042901-1–042901-15. [Google Scholar] [CrossRef]
  23. Girolami, L.; Hergault, V.; Vinay, G.; Wachs, A. A three-dimensional discrete-grain model for the simulation of dam-break rectangular collapses: Comparison between numerical results and experiments. Granul. Matter 2012, 14, 381–392. [Google Scholar] [CrossRef]
  24. Sun, Q.; Wang, G. Distribution of Force Chains in Static Packed Particles. Acta Phys. Sin. 2008, 8, 4667–4674. [Google Scholar]
Figure 1. Preliminary numerical simulation experimental model and size.
Minerals 11 01333 g001
Figure 2. Material pressure test device.
Minerals 11 01333 g002
Figure 3. Material pressure in different directions of feeder movement: (a) the feeder moves upward; (b) the feeder moves down.
Minerals 11 01333 g003
Figure 4. Force chain, the black arrow represents the direction of the force.
Minerals 11 01333 g004
Figure 5. The force chain evolution process when the feeder at the bottom of the bin moves: (a) the feeder moves upward; (b) the feeder moves down.
Minerals 11 01333 g005
Figure 6. Different particle shapes selected by the GEMM database.
Minerals 11 01333 g006
Figure 7. Variation rule of material pressure: (a) Different RWD; (b) Different angles of rest; (c) Different bin slopes.
Minerals 11 01333 g007
Figure 8. Distribution rule of force chains: (a) different RWD; (b) different angles of rest; (c) different bin slopes.
Minerals 11 01333 g008aMinerals 11 01333 g008b
Figure 9. Variation of material pressure at different descending distances when the descending speed is 0.45 m/s.
Minerals 11 01333 g009
Figure 10. Time–domain diagram of material pressure changes when the feeder moves down: (a) a constant process; (b) a deceleration process; (c) an accelerated process. Material pressure pulse is circled by red doted rectangles.
Minerals 11 01333 g010
Figure 11. The final stability of material pressure and porosity: (a) a constant process; (b) a deceleration process; (c) an accelerated process.
Minerals 11 01333 g011
Figure 12. Material pressure 3D response surface: (a) distance–acceleration; (b) distance–negative acceleration; (c) acceleration–negative acceleration.
Minerals 11 01333 g012
Figure 13. EDEM simulation model of feeding system: (a) vibration feeding system; (b) scraper feeding system.
Minerals 11 01333 g013
Figure 14. Vibrating feeding system material pressure: (a) unoptimized; (b) optimized.
Minerals 11 01333 g014
Figure 15. Scraper feeding system material pressure: (a) unoptimized; (b) optimized.
Minerals 11 01333 g015
Figure 16. Material resistance of the feeding system: (a) vibration feeding system; (b) scraper feeding system.
Minerals 11 01333 g016
Table 1. Preliminary numerical simulation experimental material parameters.
ParametersPolypropyleneGlass
Poisson’s ratio0.420.25
Shear modulus (MPa)8.9 × 1061.96 × 107
Density (kg/m3)9202500
Contact ParametersPolypropylene—GlassGlass—Glass
Coefficient of restitution0.50.5
Static friction coefficient0.60.9
Coefficient of rolling friction0.050.05
Table 2. Experimental values and simulated values.
Material PressureInitial Material PressureAfter the Feeder DropsAfter the Feeder Rises
Simulation value (N)47.528.962.3
Experimental value (N)45.227.159.7
Margin of error (%)4.846.234.17
Table 3. Material parameters.
ParametersSteelCoal
Poisson’s ratio0.280.3
Shear modulus (MPa)7 × 10108 × 107
Density (kg/m3)78601400
Contact ParametersSteel—CoalCoal—Coal
Coefficient of restitution0.50.5
Static friction coefficient0.50.7
Coefficient of rolling friction0.010.01
Table 4. Experimental results.
No.Drop Distance (m)Acceleration (m/s2)Negative Acceleration (m/s2)Stable Material Pressure (kN)
10.16250.0010.00193.596
20.30.05050.001116.679
30.16250.10.00198.571
40.30.05050.1106.496
50.0250.05050.00193.161
60.16250.05050.050595.573
70.0250.0010.050593.847
80.16250.10.191.960
90.0250.05050.190.960
100.16250.05050.050596.468
110.30.10.0505107.395
120.30.0010.0505102.238
130.16250.0010.194.166
140.16250.05050.050587.890
150.0250.10.050596.416
160.16250.05050.050596.442
170.16250.05050.050596.020
Publisher’s Note: MDPI stays neutral with regard to jurisdictional claims in published maps and institutional affiliations.

