
Combined Zircon/Apatite U-Pb and Fission-Track Dating by LA-ICP-MS and Its Geological Applications: An Example from the Egyptian Younger Granites


Abstract
:1. Introduction
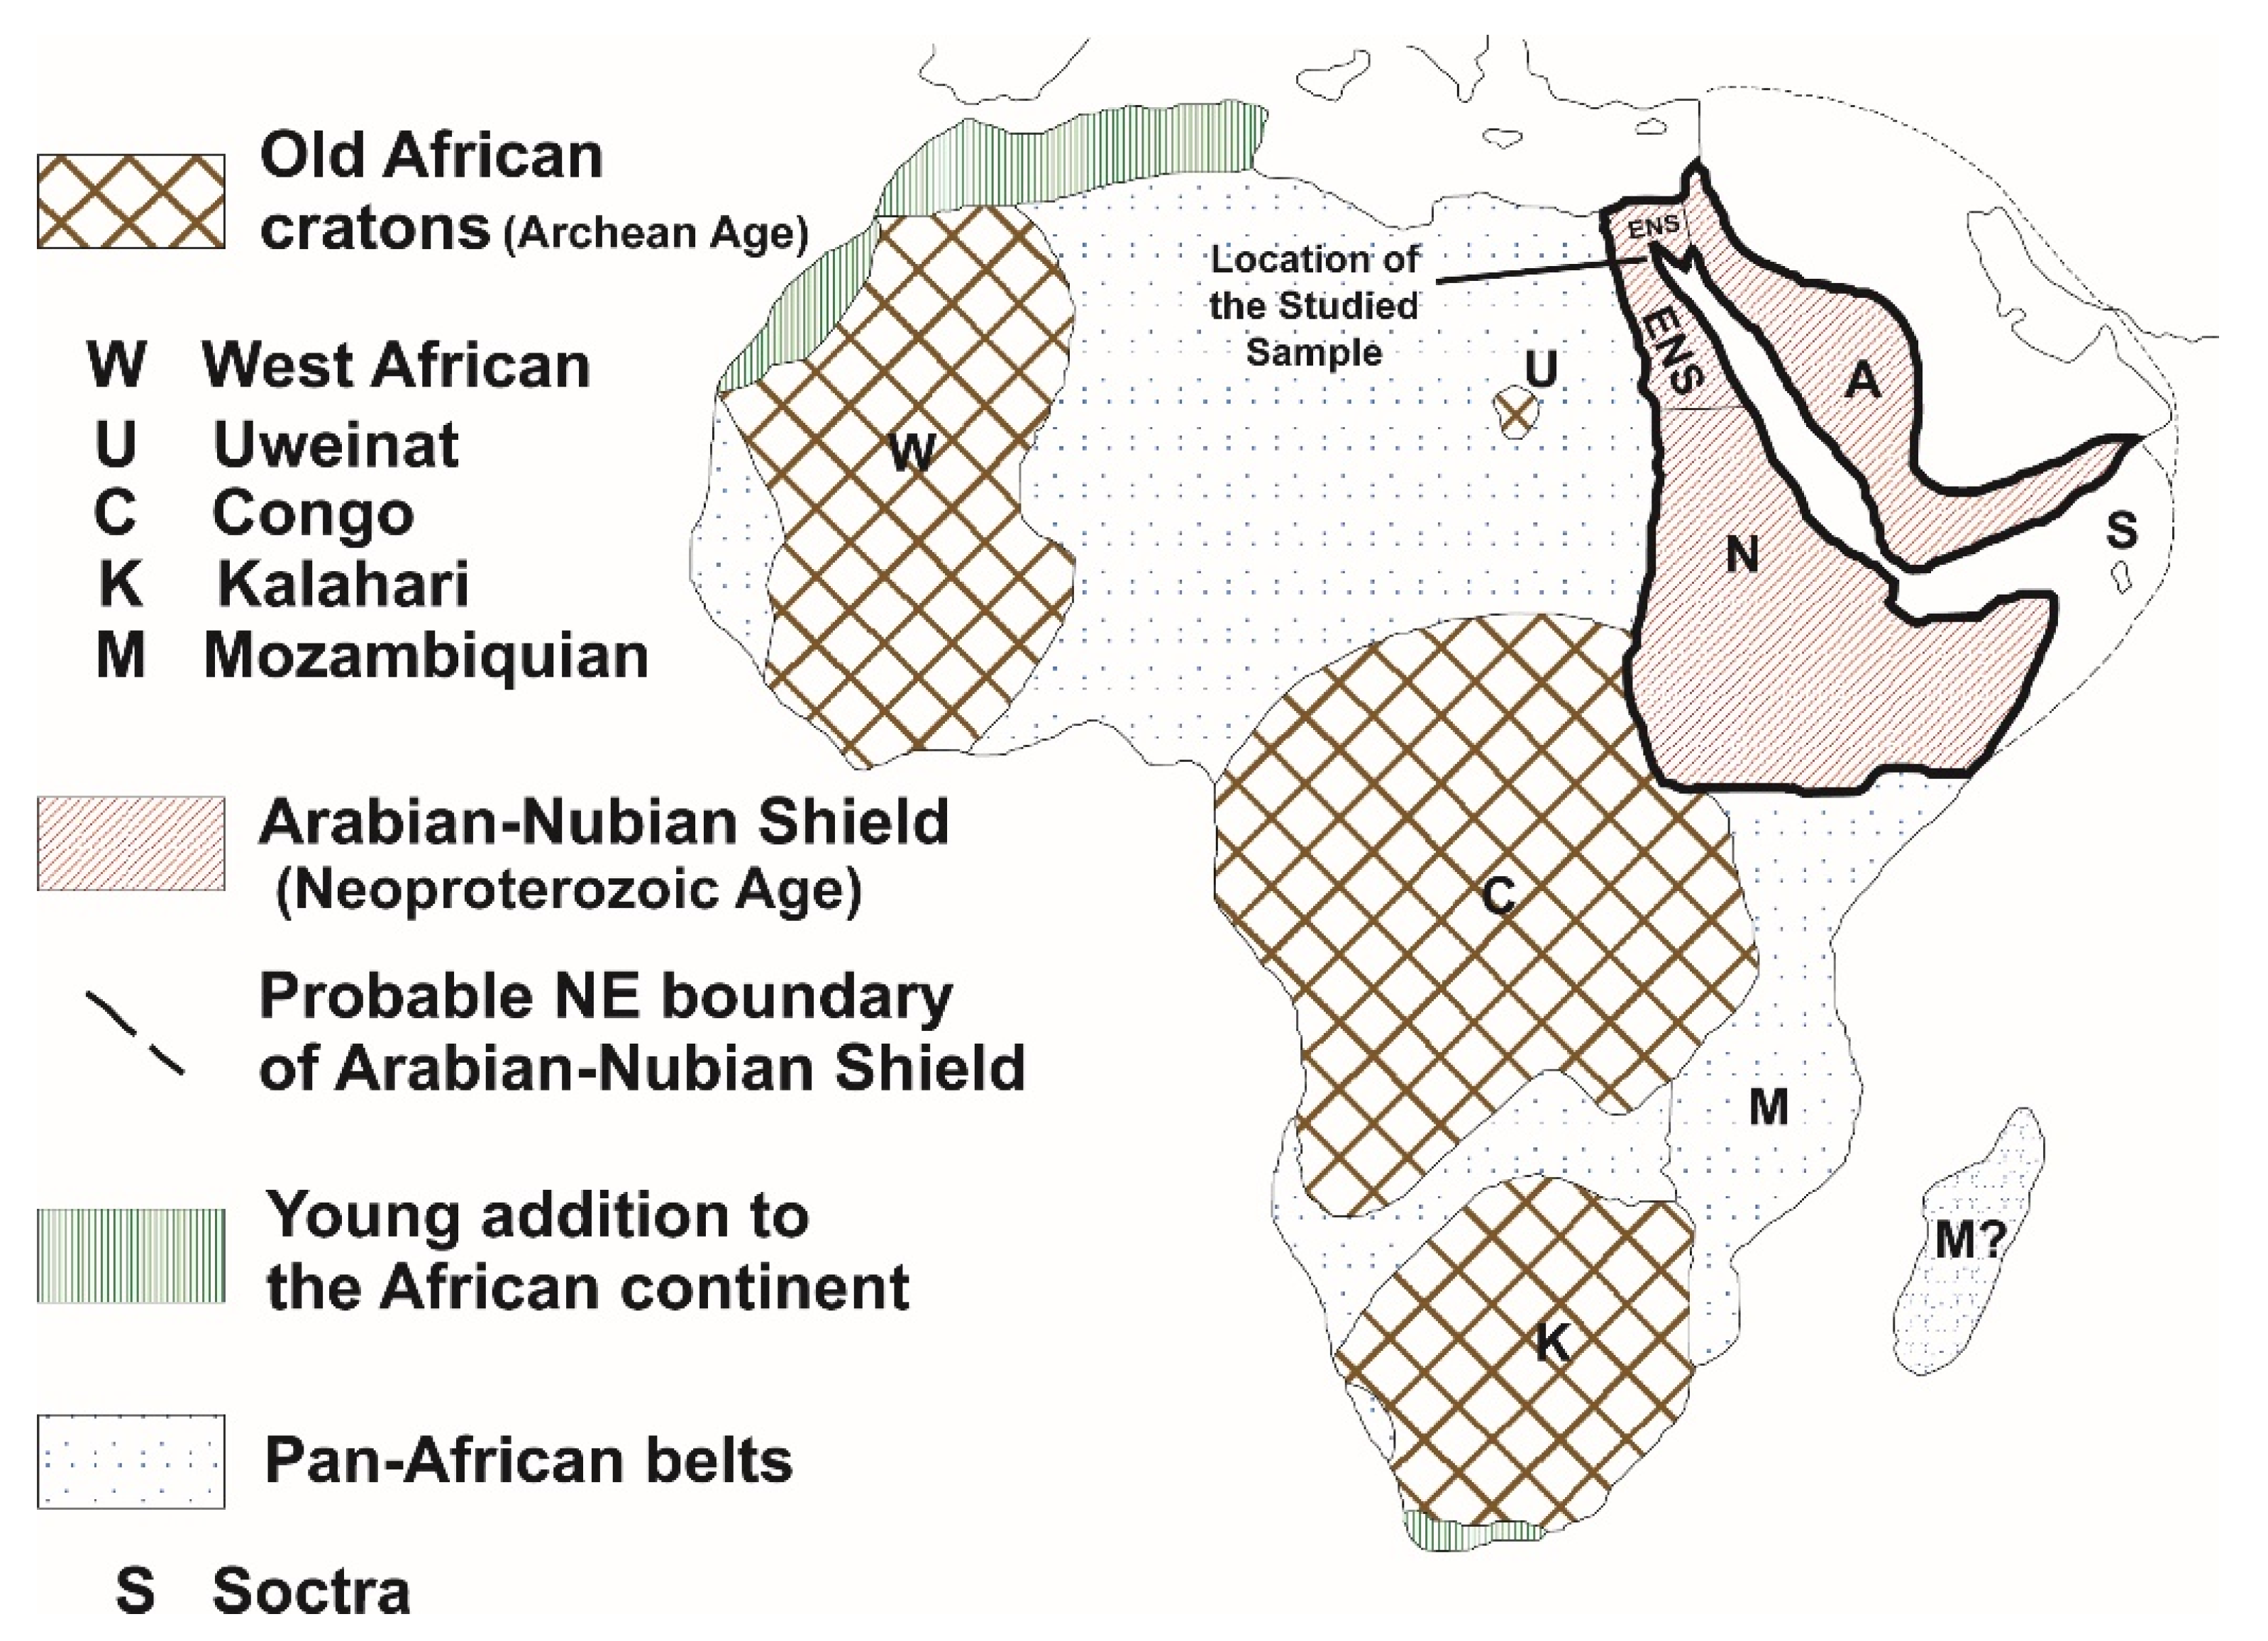
2. The Studied Sample
3. Materials and Methods
4. Results and Discussion
4.1. Zircon (U-Th)/Pb
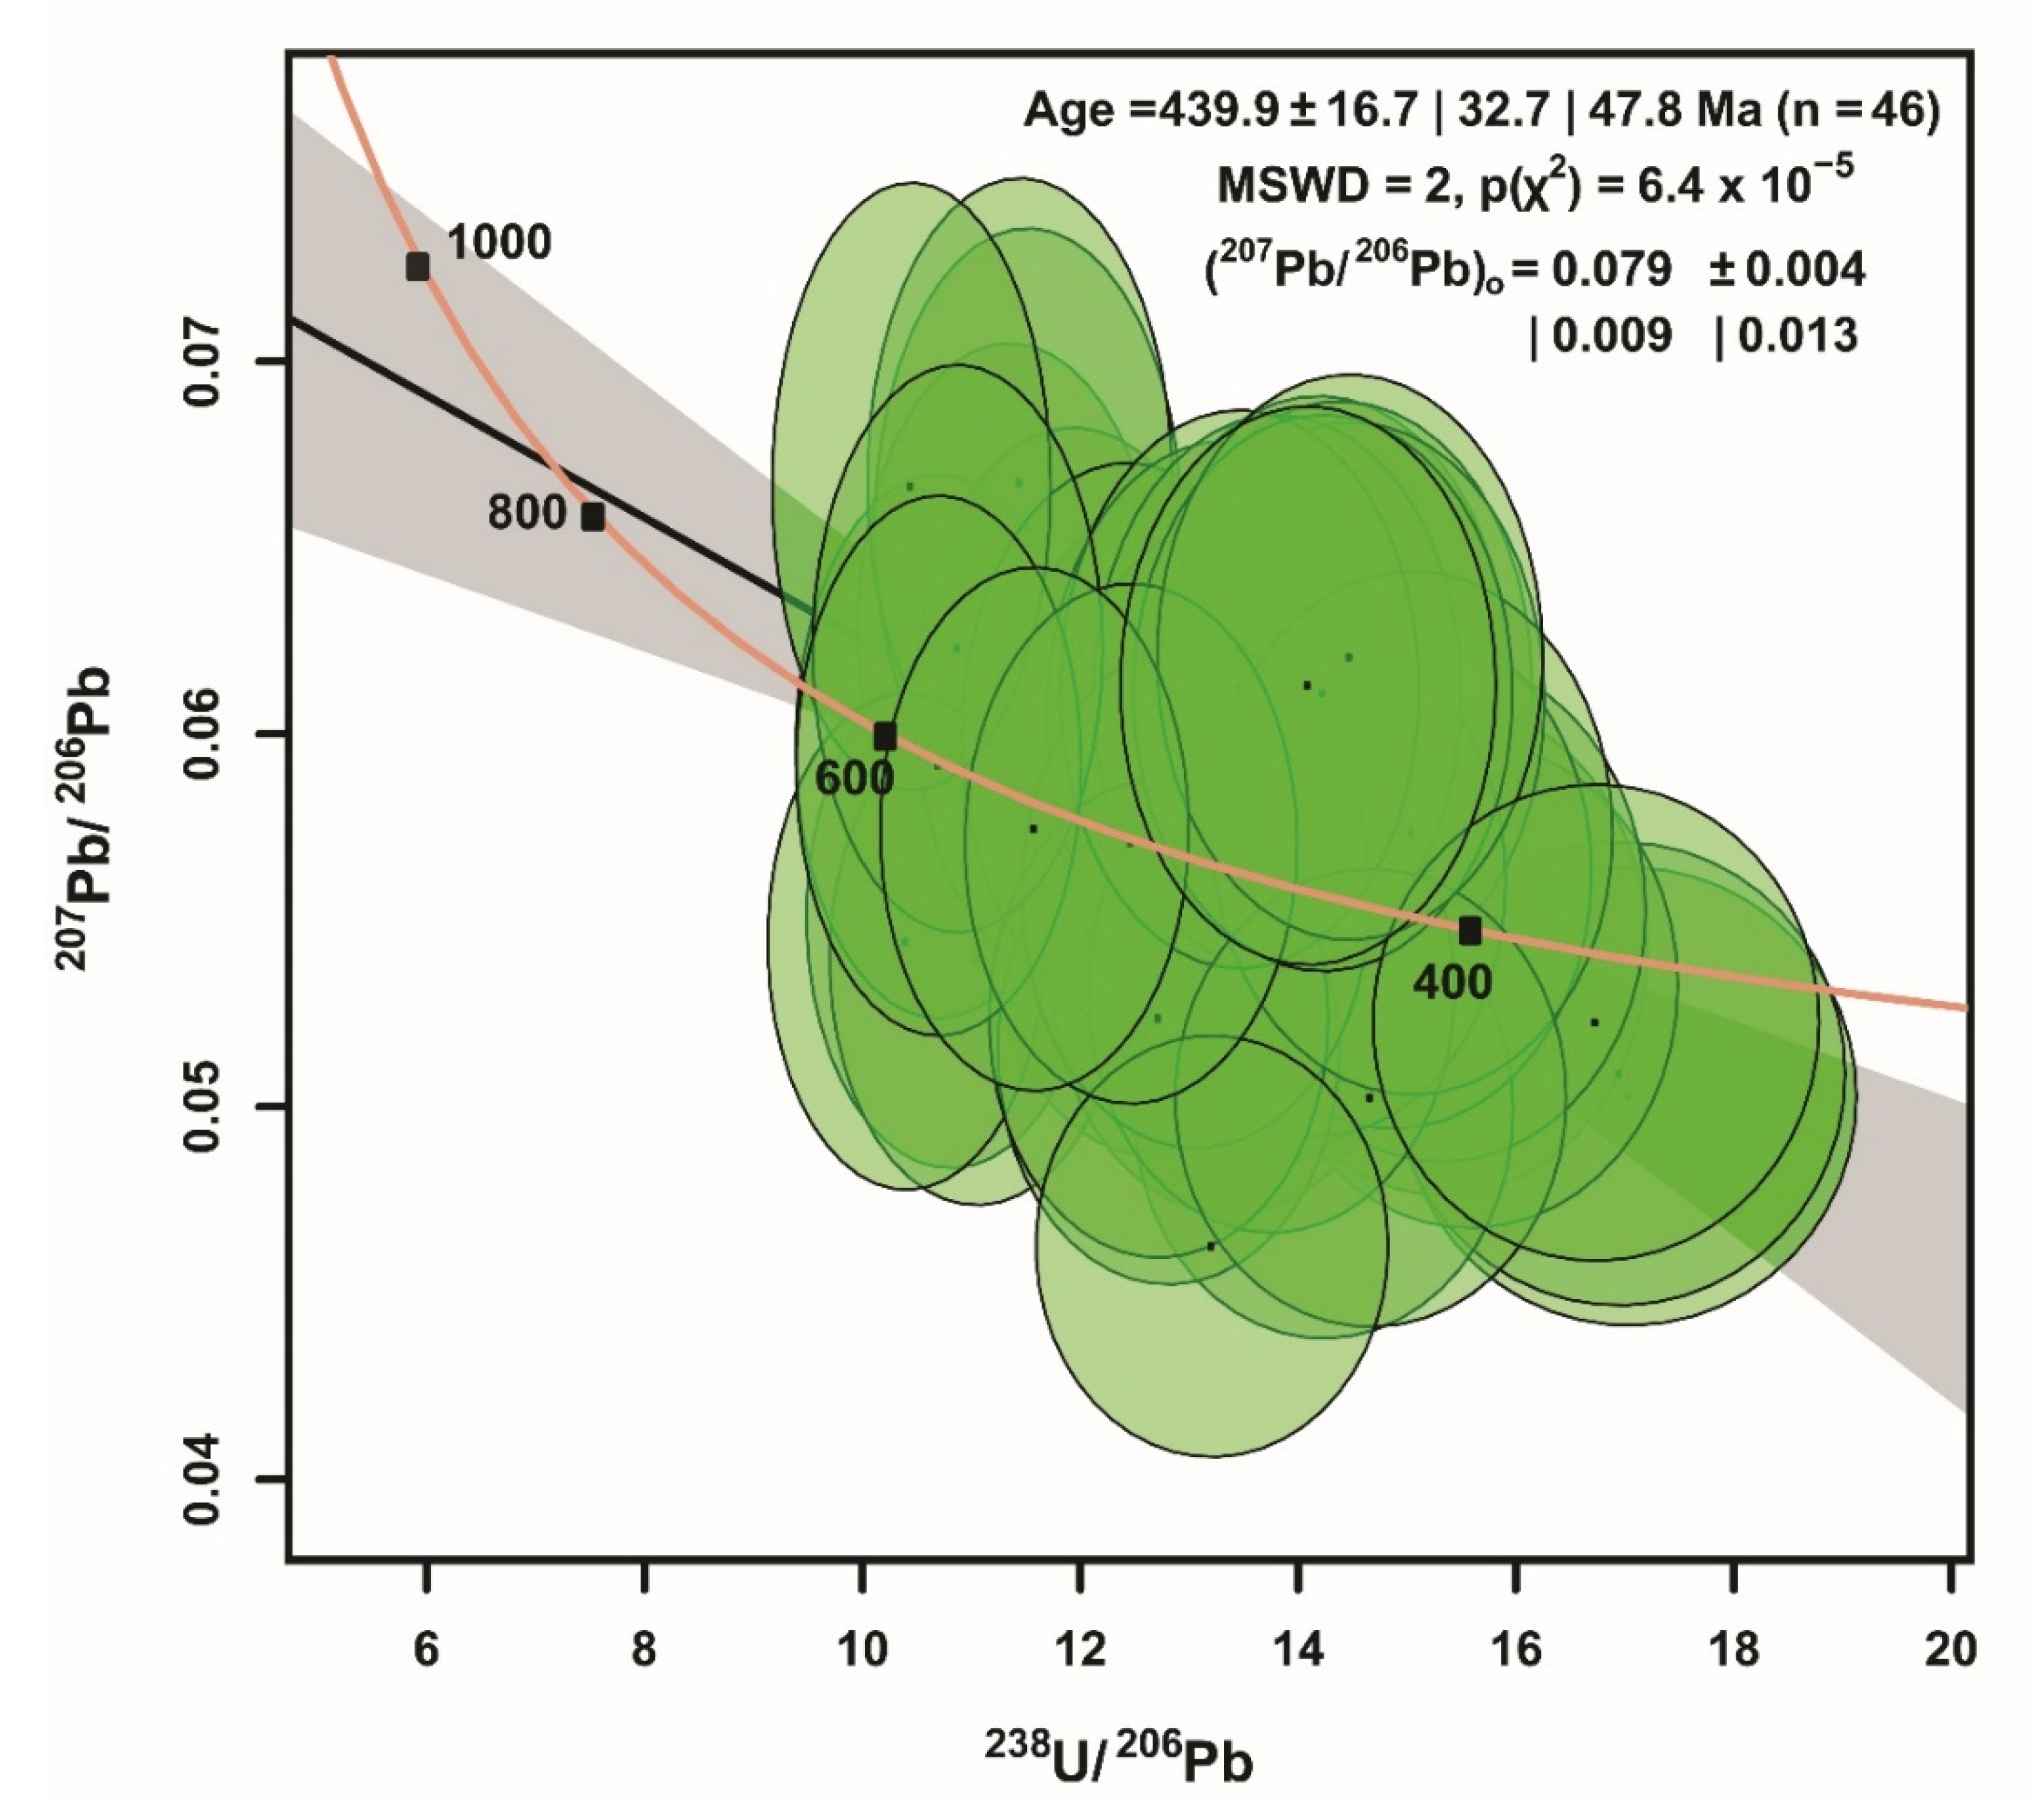
4.2. Apatite U-Pb
4.3. Zircon Fission Track
4.4. Apatite Fission Track
4.5. Time-Temperature Modelling
5. Geological Interpretation
6. Conclusions
Author Contributions
Funding
Data Availability Statement
Acknowledgments
Conflicts of Interest
References
- De Grave, J.; Glorie, S.; Buslov, M.M.; Stockli, D.F.; McWilliams, M.O.; Batalev, V.Y.; Van den haute, P. Thermo-Tectonic History of the Issyk-Kul Basement (Kyrgyz Northern Tien Shan, Central Asia). Gondwana Res. 2013, 23, 998–1020. [Google Scholar] [CrossRef]
- Glorie, S.; Otasevic, A.; Gillespie, J.; Jepson, G.; Danišík, M.; Zhimulev, F.I.; Gurevich, D.; Zhang, Z.; Song, D.; Xiao, W. Thermo-Tectonic History of the Junggar Alatau within the Central Asian Orogenic Belt (SE Kazakhstan, NW China): Insights from Integrated Apatite U/Pb, Fission Track and (U–Th)/He Thermochronology. Geosci. Front. 2019, 10, 2153–2166. [Google Scholar] [CrossRef]
- Grujic, D.; Ashley, K.T.; Coble, M.A.; Coutand, I.; Kellett, D.A.; Larson, K.P.; Whipp, D.M., Jr.; Gao, M.; Whynot, N. Deformational Temperatures Across the Lesser Himalayan Sequence in Eastern Bhutan and Their Implications for the Deformation History of the Main Central Thrust. Tectonics 2020, 39, e2019TC005914. [Google Scholar] [CrossRef]
- Wagner, G.; van den Haute, P. Fission-Track Dating; Solid Earth Sciences Library; Springer: Dordrecht, The Netherlands, 1992; ISBN 978-94-010-5093-7. [Google Scholar]
- Gleadow, A.J.W.; Duddy, I.R.; Green, P.F.; Lovering, J.F. Confined Fission Track Lengths in Apatite: A Diagnostic Tool for Thermal History Analysis. Contrib. Mineral. Petrol. 1986, 94, 405–415. [Google Scholar] [CrossRef]
- Donelick, R.A.; O’Sullivan, P.B.; Ketcham, R.A. 3. Apatite Fission-Track Analysis. In Low-Temperature Thermochronology; Reiners, P.W., Ehlers, T.A., Eds.; De Gruyter: Berlin, Germany, 2005; pp. 49–94. ISBN 978-1-5015-0957-5. [Google Scholar]
- Carlson, W.D.; Donelick, R.A.; Ketcham, R.A. Variability of Apatite Fission-Track Annealing Kinetics; I, Experimental Results. Am. Mineral. 1999, 84, 1213–1223. [Google Scholar] [CrossRef]
- Barbarand, J.; Carter, A.; Wood, I.; Hurford, T. Compositional and Structural Control of Fission-Track Annealing in Apatite. Chem. Geol. 2003, 198, 107–137. [Google Scholar] [CrossRef]
- Ramírez-Calderón, M.; Bedoya, A.; Abdullin, F.; Martini, M.; Solari, L.; Ortega-Obregón, C. Triassic Breakup of Pangea in Southern Mexico: Thermochronological Evidence from the Tianguistengo Formation. Geochemistry 2021, 81, 125776. [Google Scholar] [CrossRef]
- Bernet, M.; Brandon, M.; Garver, J.; Balestieri, M.L.; Ventura, B.; Zattin, M. Exhuming the Alps through Time: Clues from Detrital Zircon Fission-Track Thermochronology. Basin Res. 2009, 21, 781–798. [Google Scholar] [CrossRef]
- Gallagher, K.; Hawkesworth, C.J.; Mantovani, M.S.M. The Denudation History of the Onshore Continental Margin of SE Brazil Inferred from Apatite Fission Track Data. J. Geophys. Res. Solid Earth 1994, 99, 18117–18145. [Google Scholar] [CrossRef]
- Hurford, A.J. Cooling and Uplift Patterns in the Lepontine Alps South Central Switzerland and an Age of Vertical Movement on the Insubric Fault Line. Contrib. Mineral. Petrol. 1986, 92, 413–427. [Google Scholar] [CrossRef]
- Cliff, R.A.; Yardley, B.W.D.; Bussy, F.R. U–Pb and Rb–Sr Geochronology of Magmatism and Metamorphism in the Dalradian of Connemara, Western Ireland. J. Geol. Soc. 1996, 153, 109–120. [Google Scholar] [CrossRef] [Green Version]
- Jess, S.; Koehn, D.; Fox, M.; Enkelmann, E.; Sachau, T.; Aanyu, K. Paleogene Initiation of the Western Branch of the East African Rift: The Uplift History of the Rwenzori Mountains, Western Uganda. Earth Planet. Sci. Lett. 2020, 552, 116593. [Google Scholar] [CrossRef]
- Barbarand, J.; Marques, F.O.; Hildenbrand, A.; Pinna-Jamme, R.; Nogueira, C.R. Thermal Evolution of Onshore West Iberia: A Better Understanding of the Ages of Breakup and Rift-to-Drift in the Iberia-Newfoundland Rift. Tectonophysics 2021, 813, 228926. [Google Scholar] [CrossRef]
- Omar, G.I.; Steckler, M.S.; Buck, W.R.; Kohn, B.P. Fission-Track Analysis of Basement Apatites at the Western Margin of the Gulf of Suez Rift, Egypt: Evidence for Synchroneity of Uplift and Subsidence. Earth Planet. Sci. Lett. 1989, 94, 316–328. [Google Scholar] [CrossRef]
- Gleadow, A.J.W.; Fitzgerald, P.G. Uplift History and Structure of the Transantarctic Mountains: New Evidence from Fission Track Dating of Basement Apatites in the Dry Valleys Area, Southern Victoria Land. Earth Planet. Sci. Lett. 1987, 82, 1–14. [Google Scholar] [CrossRef]
- Hasebe, N.; Barbarand, J.; Jarvis, K.; Carter, A.; Hurford, A.J. Apatite Fission-Track Chronometry Using Laser Ablation ICP-MS. Chem. Geol. 2004, 207, 135–145. [Google Scholar] [CrossRef]
- Khedr, M.Z.; El-Awady, A.; Arai, S.; Hauzenberger, C.; Tamura, A.; Stern, R.J.; Morishita, T. Petrogenesis of the ~740 Korab Kansi Mafic-Ultramafic Intrusion, South Eastern Desert of Egypt: Evidence of Ti-Rich Ferropicritic Magmatism. Gondwana Res. 2020, 82, 48–72. [Google Scholar] [CrossRef]
- Chew, D.; Drost, K.; Marsh, J.H.; Petrus, J.A. LA-ICP-MS Imaging in the Geosciences and Its Applications to Geochronology. Chem. Geol. 2021, 559, 119917. [Google Scholar] [CrossRef]
- Claesson, S. Isotopic Evidence for the Precambrian Provenance and Caledonian Metamorphism of High Grade Paragneisses from the Seve Nappes, Scandinavian Caledonides I. Conventional U-Pb Zircon and Sm-Nd Whole Rock Data. Contrib Mineral Petrol 1987, 97, 196–204. [Google Scholar] [CrossRef]
- Cherniak, D.J.; Watson, E.B. Pb Diffusion in Zircon. Chem. Geol. 2001, 172, 5–24. [Google Scholar] [CrossRef]
- Feng, R.; Machado, N.; Ludden, J. Lead Geochronology of Zircon by LaserProbe-Inductively Coupled Plasma Mass Spectrometry (LP-ICPMS). Geochim. Cosmochim. Acta 1993, 57, 3479–3486. [Google Scholar] [CrossRef]
- Kosler, J.; Tubrett, M.N.; Sylvester, P.J. Application of Laser Ablation ICP-MS to U-Th-Pb Dating of Monazite. Geostand. Geoanal. Res. 2001, 25, 375–386. [Google Scholar] [CrossRef]
- Kosler, J. Present Trends and the Future of Zircon in Geochronology: Laser Ablation ICPMS. Rev. Mineral. Geochem. 2003, 53, 243–275. [Google Scholar] [CrossRef]
- Jackson, S.E.; Pearson, N.J.; Griffin, W.L.; Belousova, E.A. The Application of Laser Ablation-Inductively Coupled Plasma-Mass Spectrometry to in Situ U–Pb Zircon Geochronology. Chem. Geol. 2004, 211, 47–69. [Google Scholar] [CrossRef]
- Xiao, L.; Zhang, H.-F.; Ni, P.-Z.; Xiang, H.; Liu, X.-M. LA-ICP-MS U–Pb Zircon Geochronology of Early Neoproterozoic Mafic-Intermediat Intrusions from NW Margin of the Yangtze Block, South China: Implication for Tectonic Evolution. Precambrian Res. 2007, 154, 221–235. [Google Scholar] [CrossRef]
- Cocherie, A.; Robert, M. Laser Ablation Coupled with ICP-MS Applied to U–Pb Zircon Geochronology: A Review of Recent Advances. Gondwana Res. 2008, 14, 597–608. [Google Scholar] [CrossRef]
- Carr, P.A.; Mercadier, J.; Harlaux, M.; Romer, R.L.; Moreira, E.; Legros, H.; Cuney, M.; Marignac, C.; Cauzid, J.; Salsi, L.; et al. U/Pb Geochronology of Wolframite by LA-ICP-MS; Mineralogical Constraints, Analytical Procedures, Data Interpretation, and Comparison with ID-TIMS. Chem. Geol. 2021, 584, 120511. [Google Scholar] [CrossRef]
- Chen, C.; Lv, X.; Gun, M.; Yang, J. Metallogenic Chronology and Tectonic Setting of the Erdaohe Pb–Zn–Ag Deposit in Inner Mongolia, NE China: Constraints from Sphalerite Rb–Sr Dating, Zircon U–Pb Dating, and Hf Isotope Analysis. Ore Geol. Rev. 2021, 134, 104067. [Google Scholar] [CrossRef]
- Hannon, J.S.; Dietsch, C.; Huff, W.D.; Garway, D. Tracking 40 Million Years of Migrating Magmatism across the Idaho Batholith Using Zircon U-Pb Ages and Hf Isotopes from Cretaceous Bentonites. Minerals 2021, 11, 1011. [Google Scholar] [CrossRef]
- Yang, Y.; Liang, C.; Zheng, C.; Xu, X.; Zhou, J.; Zhou, X.; Cao, C. Metamorphic Evolution of High-Grade Granulite-Facies Rocks of the Mashan Complex, Liumao Area, Eastern Heilongjiang Province, China: Evidence from Zircon U–Pb Geochronology, Geochemistry and Phase Equilibria Modelling. Precambrian Res. 2021, 355, 106095. [Google Scholar] [CrossRef]
- Bentor, Y.K. The Crustal Evolution of the Arabo-Nubian Massif with Special Reference to the Sinai Peninsula. Precambrian Res. 1985, 28, 1–74. [Google Scholar] [CrossRef]
- Kennedy, W.Q. The Structural Differentiation of Africa in the Pan-African (±500 m.y.) Tectonic Episode. Leeds University Research Institute of African Geology and Department of Earth Sciences Annual Report on Scientific Results; Scientific Research: Leeds, UK, 1964. [Google Scholar]
- Kröner, A. Pan African Plate Tectonics and Its Repercussions on the Crust of Northeast Africa. Geol. Rundsch. 1979, 68, 565–583. [Google Scholar] [CrossRef]
- Engel, A.E.J.; Dixon, T.H.; Stern, R.J. Late Precambrian Evolution of Afro-Arabian Crust from Ocean Arc to Craton. Geol. Soc. Am. Bull. 1980, 91, 699. [Google Scholar] [CrossRef]
- Meert, J.G. A Synopsis of Events Related to the Assembly of Eastern Gondwana. Tectonophysics 2003, 362, 1–40. [Google Scholar] [CrossRef]
- Johnson, P.R.; Andresen, A.; Collins, A.S.; Fowler, A.R.; Fritz, H.; Ghebreab, W.; Kusky, T.; Stern, R.J. Late Cryogenian–Ediacaran History of the Arabian–Nubian Shield: A Review of Depositional, Plutonic, Structural, and Tectonic Events in the Closing Stages of the Northern East African Orogen. J. Afr. Earth Sci. 2011, 61, 167–232. [Google Scholar] [CrossRef]
- El-Gaby, S.; El-Nady, O.; Khudeir, A. Tectonic Evolution of the Basement Complex in the Central Eastern Desert of Egypt. Geol. Rundsch. 1984, 73, 1019–1036. [Google Scholar] [CrossRef]
- El Din, G.M.K.; Khudeir, A.A.; Greiling, R.O. Tectonic Evolution of a Pan-African Gneiss Culmination, Gabal El Sibai Area, Central Eastern Desert, Egypt. Zent Bl Geol Palaeont 1991, I11, 2637–2640. [Google Scholar]
- Rashwan, A.A. Petrography, Geochemistry and Petrogenesis of the Migif-Hafifit at Hafifit Mine Area, Egypt. 1991. Available online: https://www.iberlibro.com/9783893360390/Petrography-geochemistry-petrogenesis-MIGIF-HAFAFIT-gneisses-3893360395/plp (accessed on 25 November 2021).
- Gass, I.G. The Evolution of the Pan African Crystalline Basement in NE Africa and Arabia. J. Geol. Soc. 1977, 134, 129–138. [Google Scholar] [CrossRef]
- Nasseef, A.O.; Gass, I.G. Granitic and Metamorphic Rocks of the Taif Area, Western Saudi Arabia. Geol. Soc. Am. Bull. 1977, 88, 1721. [Google Scholar] [CrossRef]
- Hume, W.F. The Later Plutonic and Minor Intrusive Rocks. In Geology of Egypt; Government Press: Cairo, Egypt, 1935. [Google Scholar]
- Schurmann, H.M.E. The Precambrian of the Gulf of Suez Area. Int. Geol. Congr. Algiers CR 1953, 19, 115–135. [Google Scholar]
- El Ramly, M.F.; Akaad, M.K. The Basement Complex in the Central-Eastern Desert of Egypt between Lat. 24°30′ and 25°40′ N. Geol. Surv. Egypt Ann. 1960, 8, 1–35. [Google Scholar]
- El Bahariya, G.A. Geochemistry and Tectonic Setting of Neoproterozoic Rocks from the Arabian-Nubian Shield: Emphasis on the Eastern Desert of Egypt. In Applied Geochemistry with Case Studies on Geological Formations, Exploration Techniques and Environmental Issues; Felipe Mazadiego, L., De Miguel Garcia, E., Barrio-Parra, F., Izquierdo-Díaz, M., Eds.; IntechOpen: London, UK, 2020; ISBN 978-1-78985-884-6. [Google Scholar]
- Ali, B.H.; Wilde, S.A.; Gabr, M.M.A. Granitoid Evolution in Sinai, Egypt, Based on Precise SHRIMP U–Pb Zircon Geochronology. Gondwana Res. 2009, 15, 38–48. [Google Scholar] [CrossRef]
- Moreno, J.A.; Montero, P.; Abu Anbar, M.; Molina, J.F.; Scarrow, J.H.; Talavera, C.; Cambeses, A.; Bea, F. SHRIMP U–Pb Zircon Dating of the Katerina Ring Complex: Insights into the Temporal Sequence of Ediacaran Calc-Alkaline to Peralkaline Magmatism in Southern Sinai, Egypt. Gondwana Res. 2012, 21, 887–900. [Google Scholar] [CrossRef]
- Said, R. The Geology of Egypt, 2nd ed.; A.A. Balkema, Elsevier: Rotterdam, The Netherlands, 1990. [Google Scholar]
- Seilacher, A. Paleozoic Trace Fossils. In Geology of Egypt; A.A. Balkema, Elsevier: Rotterdam, The Netherlands, 1990; pp. 113–156. [Google Scholar]
- Bosworth, W.; Huchon, P.; McClay, K. The Red Sea and Gulf of Aden Basins. J. Afr. Earth Sci. 2005, 43, 334–378. [Google Scholar] [CrossRef]
- Alsharhan, A.S.; Nairn, A.E.M. Sedimentary Basins and Petroleum Geology of the Middle East; Elsevier: Amsterdam, The Netherlands, 1997; ISBN 978-0-444-82465-3. [Google Scholar]
- Gvirtzman, G.; Weissbrod, T. The Hercynian Geanticline of Helez and the Late Palaeozoic History of the Levant. Geol. Soc. Lond. Spec. Publ. 1984, 17, 177–186. [Google Scholar] [CrossRef]
- Stampfii, G.M.; von Raumer, J.F.; Borel, G.D. Paleozoic Evolution of Pre-Variscan Terranes: From Gondwana to the Variscan Collision. In Variscan-Appalachian Dynamics: The Building of the Late Paleozoic Basement; Geological Society of America: Boulder, CO, USA, 2002; ISBN 978-0-8137-2364-8. [Google Scholar]
- Craig, J.; Rizzi, C.; Said, F.; Thusu, B.; Luning, S.; Asbali, A.I.; Keeley, M.L.; Bell, J.F.; Durham, M.J.; Eales, M.H.; et al. Structural Styles and Prospectivity in the Precambrian and Palaeozoic Hydrocarbon Systems of North Africa. Geol. East Libya 2008, 4, 51–122. [Google Scholar]
- Dixon, R.J.; Moore, J.K.S.; Bourne, M.; Dunn, E.; Haig, D.B.; Hossack, J.; Roberts, N.; Parsons, T.; Simmons, C.J. Integrated Petroleum Systems and Play Fairway Analysis in a Complex Palaeozoic Basin: Ghadames-Illizi Basin, North Africa. Geol. Soc. Lond. Pet. Geol. Conf. Ser. 2010, 7, 735–760. [Google Scholar] [CrossRef]
- Hashad, A.H. Present Status of Geochronological Data on the Egyptian Basement Complex. Precambrian Res. 1978, 6, A24–A25. [Google Scholar] [CrossRef]
- Klitzsch, E. Plate Tectonics and Cratonal Geology in Northeast Africa (Egypt, Sudan). Geol. Rundsch. 1986, 75, 755–768. [Google Scholar] [CrossRef]
- Said, R. The Geology of Egypt, 1st ed.; Elsevier: Amsterdam, The Netherlands, 1962. [Google Scholar]
- Dewey, J.F.; Pitman, W.C.; Ryan, W.B.F.; Bonnin, J. Plate Tectonics and the Evolution of the Alpine System. Geol. Soc. Am. Bull. 1973, 84, 3137. [Google Scholar] [CrossRef]
- Awad, G.M. Habitat of Oil in Abu Gharadiq and Faiyum Basins, Western Desert, Egypt. AAPG Bull. 1984, 68, 564–573. [Google Scholar]
- Greiling, R.O.; Kriiner, A.; El Ramly, M.F.; Rashwan, A.A. Structural Relationships between the Southern and Central Parts of the Eastern Desert of Egypt: Details of a Fold and Thrust Belt. In The Pan-African of NE Africa and Adjacent Areas; El Gaby, S., Greiling, R.O., Eds.; Vieweg: Wiesbaden, Germany, 1988; pp. 121–145. [Google Scholar]
- Tawfik, H.A.; Ghandour, I.M.; Maejima, W.; Abdel-Hameed, A.T. Petrography and Geochemistry of the Lower Paleozoic Araba Formation, Northern Eastern Desert, Egypt: Implications for Provenance, Tectonic Setting and Weathering Signature. J. Geosci. Osaka City Univ. 2011, 54, 1–16. [Google Scholar]
- Sabet, A.H. An Example of Photo Interpretation of Crystalline Rocks. In; ITC Publication B.: Delft, The Netherlands, 1962; p. 34. [Google Scholar]
- El Shazly, E.M. On the Classification of the Precambrian and Other Rocks of Magmatic Affiliation in Egypt. In Proceedings of the 22nd International Geological Congress, New Delhi, India, 14 December 1964. [Google Scholar]
- Hassan, M.A.; Hashad, A.H. Precambrian of Egypt. In Geology of Egypt; Said, R., Ed.; Balkema Publications: Rotterdam, The Netherlands, 1990; p. 734. [Google Scholar]
- Abdallah, A.M.; Darwish, M.; El-Aref, M.; Helba, A.A. Lithostratigraphy of the Pre-Cenomanian Clastics of North Wadi Qena, Eastern Desert, Egypt. 1992. Available online: https://pascal-francis.inist.fr/vibad/index.php?action=getRecordDetail&idt=6498128 (accessed on 25 November 2021).
- Moghazi, A.M.; Hassanen, M.A.; Mohamed, F.H.; Ali, S. Late Neoproterozoic Strongly Peraluminous Leucogranites, South Eastern Desert, Egypt—Petrogenesis and Geodynamic Significance. Mineral. Petrol. 2004, 81, 19–41. [Google Scholar] [CrossRef]
- El-Bialy, M.Z.; Streck, M.J. Late Neoproterozoic Alkaline Magmatism in the Arabian–Nubian Shield: The Postcollisional A-Type Granite of Sahara–Umm Adawi Pluton, Sinai, Egypt. Arab. J. Geosci. 2009, 2, 151–174. [Google Scholar] [CrossRef]
- Azer, M.K.; Samuel, M.D.; Ali, K.A.; Gahlan, H.A.; Stern, R.J.; Ren, M.; Moussa, H.E. Neoproterozoic Ophiolitic Peridotites along the Allaqi-Heiani Suture, South Eastern Desert, Egypt. Mineral. Petrol. 2013, 107, 829–848. [Google Scholar] [CrossRef]
- El-Bialy, M.Z. Precambrian Basement Complex of Egypt. In The Geology of Egypt; Hamimi, Z., El-Barkooky, A., Martínez Frías, J., Fritz, H., Abd El-Rahman, Y., Eds.; Regional Geology Reviews; Springer International Publishing: Cham, Switzerland, 2020; pp. 37–79. ISBN 978-3-030-15265-9. [Google Scholar]
- El-Bialy, M.Z. The Ediacaran Post-Collisional Dokhan Volcanics. In The Geology of the Egyptian Nubian Shield; Hamimi, Z., Arai, S., Fowler, A.-R., El-Bialy, M.Z., Eds.; Regional Geology Reviews; Springer International Publishing: Cham, Switzerland, 2021; pp. 267–294. ISBN 978-3-030-49771-2. [Google Scholar]
- Garver, J.I. Etching Zircon Age Standards for Fission-Track Analysis. Radiat. Meas. 2003, 37, 47–53. [Google Scholar] [CrossRef]
- Morishita, T.; Ishida, Y.; Arai, S.; Shirasaka, M. Determination of Multiple Trace Element Compositions in Thin (>30 µM) Layers of NIST SRM 614 and 616 Using Laser Ablation-Inductively Coupled Plasma-Mass Spectrometry (LA-ICP-MS). Geostand. Geoanal. Res. 2005, 29, 107–122. [Google Scholar] [CrossRef]
- Jeffries, T.E.; Pearce, N.J.G.; Perkins, W.T.; Raith, A. Chemical Fractionation during Infrared and Ultraviolet Laser Ablation Inductively Coupled Plasma Mass Spectrometry—Implications for Mineral Microanalysis. Anal. Commun. 1996, 33, 35–39. [Google Scholar] [CrossRef]
- Hirata, T.; Nesbitt, R.W. U-Pb Isotope Geochronology of Zircon: Evaluation of the Laser Probe-Inductively Coupled Plasma Mass Spectrometry Technique. Geochim. Cosmochim. Acta 1995, 59, 2491–2500. [Google Scholar] [CrossRef]
- Longerich, H.P.; Jackson, S.E.; Günther, D. Inter-Laboratory Note. Laser Ablation Inductively Coupled Plasma Mass Spectrometric Transient Signal Data Acquisition and Analyte Concentration Calculation. J. Anal. Spectrom. 1996, 11, 899–904. [Google Scholar] [CrossRef]
- Carpenter, B.S.; Reimer, G.M. Standard Reference Materials: Calibrated Glass Standards for Fission Track Use. 1974. Available online: https://www.osti.gov/biblio/4232790-standard-reference-materials-calibrated-glass-standards-fission-track-use-final-report (accessed on 25 November 2021).
- Pearce, N.J.G.; Perkins, W.T.; Westgate, J.A.; Gorton, M.P.; Jackson, S.E.; Neal, C.R.; Chenery, S.P. A Compilation of New and Published Major and Trace Element Data for NIST SRM 610 and NIST SRM 612 Glass Reference Materials. Geostand. Geoanalytical Res. 1997, 21, 115–144. [Google Scholar] [CrossRef]
- Walder, A.J.; Platzner, I.; Freedman, P.A. Isotope Ratio Measurement of Lead, Neodymium and Neodymium–Samarium Mixtures, Hafnium and Hafnium–Lutetium Mixtures with a Double Focusing Multiple Collector Inductively Coupled Plasma Mass Spectrometer. J. Anal. Spectrom. 1993, 8, 19–23. [Google Scholar] [CrossRef]
- Gagnevin, D.; Daly, J.S.; Waight, T.E.; Morgan, D.; Poli, G. Pb Isotopic Zoning of K-Feldspar Megacrysts Determined by Laser Ablation Multi-Collector ICP-MS: Insights into Granite Petrogenesis. Geochim. Cosmochim. Acta 2005, 69, 1899–1915. [Google Scholar] [CrossRef]
- Deer, W.A.; Howie, R.A.; Zussman, J. Rock Forming Minerals, 2nd ed.; Longman Scientific & Technical: Harlow, Essex, UK; New York, NY, USA, 1982; Volume 1A. [Google Scholar]
- Sokolov, V.A. Arc Furnace Assisted Carbothermal Decomposition of Zircon. Refract. Ind. Ceram. 2005, 46, 208–211. [Google Scholar] [CrossRef]
- Rubatto, D. Zircon: The Metamorphic Mineral. Rev. Mineral. Geochem. 2017, 83, 261–295. [Google Scholar] [CrossRef]
- Vermeesch, P. IsoplotR: A Free and Open Toolbox for Geochronology. Geosci. Front. 2018, 9, 1479–1493. [Google Scholar] [CrossRef]
- Kröner, A.; Eyal, M.; Eyal, Y. Early Pan-African Evolution of the Basement around Elat, Israel, and the Sinai Peninsula Revealed by Single-Zircon Evaporation Dating, and Implications for Crustal Accretion Rates. Geology 1990, 18, 545. [Google Scholar] [CrossRef]
- Kröner, A.; Kröner, J.; Rashwan, A.A.A. Age and Tectonic Setting of Granitoid Gneisses in the Eastern Desert of Egypt and South-West Sinai. Geol. Rundsch. 1994, 83, 502–513. [Google Scholar] [CrossRef]
- Moussa, E.M.M.; Stern, R.J.; Manton, W.I.; Ali, K.A. SHRIMP Zircon Dating and Sm/Nd Isotopic Investigations of Neoproterozoic Granitoids, Eastern Desert, Egypt. Precambrian Res. 2008, 160, 341–356. [Google Scholar] [CrossRef]
- Abu El-Enen, M.M.; Whitehouse, M.J. The Feiran–Solaf Metamorphic Complex, Sinai, Egypt: Geochronological and Geochemical Constraints on Its Evolution. Precambrian Res. 2013, 239, 106–125. [Google Scholar] [CrossRef]
- Eyal, M.; Be’eri-Shlevin, Y.; Eyal, Y.; Whitehouse, M.J.; Litvinovsky, B. Three Successive Proterozoic Island Arcs in the Northern Arabian–Nubian Shield: Evidence from SIMS U–Pb Dating of Zircon. Gondwana Res. 2014, 25, 338–357. [Google Scholar] [CrossRef]
- Chamberlain, K.R.; Bowring, S.A. Apatite–Feldspar U–Pb Thermochronometer: A Reliable, Mid-Range (∼450 °C), Diffusion-Controlled System. Chem. Geol. 2001, 172, 173–200. [Google Scholar] [CrossRef]
- Kohn, B.P.; Feinstein, S.; Foster, D.A.; Steckler, M.S.; Eyal, M. Thermal History of the Eastern Gulf of Suez, II. Reconstruction from Apatite Fission Track and K-Feldspar Measurements. Tectonophysics 1997, 283, 219–239. [Google Scholar] [CrossRef]
- Bojar, A.-V.; Fritz, H.; Kargl, S.; Unzog, W. Phanerozoic Tectonothermal History of the Arabian–Nubian Shield in the Eastern Desert of Egypt: Evidence from Fission Track and Paleostress Data. J. Afr. Earth Sci. 2002, 34, 191–202. [Google Scholar] [CrossRef]
- Vermeesch, P.; Avigad, D.; McWilliams, M.O. 500 m.y. of Thermal History Elucidated by Multi-Method Detrital Thermochronology of North Gondwana Cambrian Sandstone (Eilat Area, Israel). GSA Bull. 2009, 121, 1204–1216. [Google Scholar] [CrossRef] [Green Version]
- Yamada, R.; Tagami, T.; Nishimura, S.; Ito, H. Annealing Kinetics of Fission Tracks in Zircon: An Experimental Study. Chem. Geol. 1995, 122, 249–258. [Google Scholar] [CrossRef]
- Kohn, B.P.; Eyal, M.; Feinstein, S. A Major Late Devonian-Early Carboniferous (Hercynian) Thermotectonic Event at the NW Margin of the Arabian-Nubian Shield: Evidence from Zircon Fission Track Dating. Tectonics 1992, 11, 1018–1027. [Google Scholar] [CrossRef]
- Tewfik, N.; Harwood, C.; Deighton, I. The Miocene, Rudeis and Kareem Formations in the Gulf of Suez: Aspects of Sedimentology and Geochemistry. In Proceedings of the Egyptian General Petroleum Corporation Exploration Seminar, Cairo, Egypt, 7–10 February 1992. [Google Scholar]
- Darwish, M.; El Araby, A. Petrography and Diagenetic Aspects of Some Siliclastic Hydrocarbon Reservoirs in Relation to Rifting of the Gulf of Suez, Egypt. Geodynamics and Sedimentation of the Red Sea—Gulf of Aden Rift System. Egyptian J. Geol. 1994, 3, 1–25. [Google Scholar]
- Gleadow, A.J.W.; Duddy, I.R. A Natural Long-Term Track Annealing Experiment for Apatite. Nucl. Tracks 1981, 5, 169–174. [Google Scholar] [CrossRef]
- Ketcham, R.A. Forward and Inverse Modeling of Low-Temperature Thermochronometry Data. Rev. Mineral. Geochem. 2005, 58, 275–314. [Google Scholar] [CrossRef]
- Garfunkel, Z. Early Paleozoic Sediments of NE Africa and Arabia: Products of Continental-Scale Erosion, Sediment Transport, and Deposition. Isr. J. Earth Sci. 2002, 51, 135–156. [Google Scholar] [CrossRef]
- Kolodner, K.; Avigad, D.; McWILLIAMS, M.; Wooden, J.L.; Weissbrod, T.; Feinstein, S. Provenance of North Gondwana Cambrian–Ordovician Sandstone: U–Pb SHRIMP Dating of Detrital Zircons from Israel and Jordan. Geol. Mag. 2006, 143, 367–391. [Google Scholar] [CrossRef] [Green Version]
- Shehata, A.A.; El Fawal, F.M.; Ito, M.; Aboulmagd, M.A.; Brooks, H.L. Senonian Platform-to-Slope Evolution in the Tectonically-Influenced Syrian Arc Sedimentary Belt: Beni Suef Basin, Egypt. J. Afr. Earth Sci. 2020, 170. [Google Scholar] [CrossRef]
- Kohn, B.P.; Eyal, M. History of Uplift of the Crystalline Basement of Sinai and Its Relation to Opening of the Red Sea as Revealed by Fission Track Dating of Apatites. Earth Planet. Sci. Lett. 1981, 52, 129–141. [Google Scholar] [CrossRef]
- Omar, G.I.; Kohn, B.P.; Lutz, T.M.; Faul, H. The Cooling History of Silurian to Cretaceous Alkaline Ring Complexes, South Eastern Desert, Egypt, as Revealed by Fission-Track Analysis. Earth Planet. Sci. Lett. 1987, 83, 94–108. [Google Scholar] [CrossRef]
- Feinstein, S.; Eyal, M.; Kohn, B.P.; Steckler, M.S.; Ibrahim, K.M.; Moh’d, B.K.; Tian, Y. Uplift and Denudation History of the Eastern Dead Sea Rift Flank, SW Jordan: Evidence from Apatite Fission Track Thermochronometry. Tectonics 2013, 32, 1513–1528. [Google Scholar] [CrossRef]
- Ketcham, R.A.; Donelick, R.A.; Carlson, W.D. Variability of Apatite Fission-Track Annealing Kinetics; III, Extrapolation to Geological Time Scales. Am. Mineral. 1999, 84, 1235–1255. [Google Scholar] [CrossRef]
- Morgan, E.; Boulos, E.K.; Hennin, S.E.; EL-Sheriff, A.A.; Sayed, A.A.; Basta, N.Z.; Melek, Y.S. Heat flow in eastern Egypt: The thermal signature of a continental breakup. J. Geodyn. 1985, 4, 107–131. [Google Scholar] [CrossRef]
- Omar, G.I.; Steckler, M.S. Fission Track Evidence on the Initial Rifting of the Red Sea: Two Pulses, No Propagation. Science 1995, 270, 1341–1344. [Google Scholar] [CrossRef]


| ICP-MS | Detalis |
| Model | Agilent 7500 s |
| Forward power | 1200 W |
| Reflected power | 1 W |
| Carrier gas flow | 1. 31/min−1 (Ar) |
| 0.31/min−1 (He) | |
| Auxiliary gas flow | 1.01/min−1 |
| Plasma gas flow | 151/min−1 |
| Interface | Ni sample cone |
| Ni skimmer cone | |
| Laser | Details |
| Model | MicroLas GeoLas Q plus |
| Wavelength | 193 nm (Excimer ArF) |
| Repetition rate | 5 Hz |
| Pulse energy | 8 J/cm2 |
| Pit diameter | 20 µm |
| Grain No. | Intensities (cps) | Conc. (ppm) | Isotopic Ratios and 1σ Errors | Age (Ma) and 1σ Errors | % dis-c. | ||||||||||||||
|---|---|---|---|---|---|---|---|---|---|---|---|---|---|---|---|---|---|---|---|
| 204Pb | 3σ | 238U | 1σ | Th/U | ±1σ | 206Pb/238U | ±1σ | 207Pb/235U | ±1σ | 208Pb/232Th | ±1σ | 206Pb/238U | ±1σ | 207Pb/235U | ±1σ | 208Pb/232Th | ±1σ | 238U/235U | |
| A1 * | −1 | 79 | 53.5 | 4.5 | 1.03 | 0.039 | 0.308 | 0.005 | 4.902 | 0.157 | 0.093 | 0.002 | 1730 | 76 | 1810 | 60 | 1440 | 39 | 4.0 |
| A8 * | −15 | 136 | 90.8 | 9.8 | 1.11 | 0.006 | 0.306 | 0.001 | 4.926 | 0.010 | 0.100 | 0.001 | 1723 | 76 | 1836 | 60 | 608 | 24 | 4.6 |
| B1 | 9.1 | 119 | 135.3 | 12.4 | 0.84 | 0.002 | 0.103 | 0.001 | 0.975 | 0.010 | 0.036 | 0.001 | 630 | 30 | 688 | 35 | 791 | 25 | 8.8 |
| B6 * | 53.5 | 60 | 266.1 | 10.1 | 0.29 | 0.002 | 0.096 | 0.003 | 0.868 | 0.433 | 0.034 | 6.586 | 591 | 28 | 634 | 33 | 3853 | 236 | 6.8 |
| C7 * | −3 | 73 | 10.6 | 8.7 | 0.04 | 0.002 | 0.220 | 0.001 | 14.550 | 0.008 | 8.140 | 0.001 | 1283 | 58 | 2851 | 68 | 698 | 19 | 54.0 |
| D3 * | 0.3 | 64 | 56.2 | 16.1 | 0.43 | 0.002 | 0.127 | 0.001 | 1.179 | 0.014 | 0.046 | 0.001 | 770 | 36 | 802 | 39 | 506 | 4 | 2.6 |
| D8 | 2.0 | 96 | 269.8 | 15.2 | 0.73 | 0.006 | 0.091 | 0.002 | 0.775 | 0.023 | 0.032 | 0.001 | 560 | 27 | 603 | 32 | 425 | 15 | 3.9 |
| E7 | 13.2 | 76 | 101.2 | 11.3 | 0.37 | 0.009 | 0.098 | 0.001 | 0.820 | 0.006 | 0.033 | 0.001 | 601 | 29 | 626 | 33 | 796 | 13 | 1.1 |
| F1 | 6.9 | 132 | 141.7 | 6.7 | 0.39 | 0.016 | 0.098 | 0.001 | 0.849 | 0.006 | 0.033 | 0.001 | 602 | 29 | 635 | 33 | 596 | 15 | 3.6 |
| G4 | 18.4 | 122 | 102.8 | 6.8 | 1.08 | 0.006 | 0.092 | 0.001 | 0.764 | 0.008 | 0.031 | 0.001 | 567 | 27 | 596 | 32 | 489 | 22 | 1.7 |
| G5 | 1.1 | 71 | 70.9 | 8.5 | 1.10 | 0.008 | 0.099 | 0.001 | 0.790 | 0.022 | 0.034 | 0.001 | 610 | 29 | 617 | 33 | 422 | 6 | −3.2 |
| H7 | 5.5 | 70 | 144.5 | 9.9 | 0.26 | 0.005 | 0.103 | 0.001 | 0.852 | 0.021 | 0.033 | 0.001 | 634 | 30 | 643 | 34 | 540 | 9 | −1.3 |
| Gr. | Intensities (cps) | Conc. (ppm) | Isotopic Ratios and 1σ Errors | Age (Ma) and 1σ Errors | % dis-c. | ||||||||||||||
|---|---|---|---|---|---|---|---|---|---|---|---|---|---|---|---|---|---|---|---|
| 204Pb | 3σ | 238U | 1σ | Th/U | ±1σ | 206Pb/238U | ±1σ | 207Pb/235U | ±1σ | 208Pb/232Th | ±1σ | 206Pb/238U | ±1σ | 207Pb/235U | ±1σ | 207Pb/206Pb | ±1σ | 238U/235U | |
| A2 | 0.09 | 17.9 | 33.5 | 3.3 | 0.32 | 0.02 | 0.07 | 0.009 | 0.488 | 0.008 | 0.021 | 0.009 | 407 | 16 | 403 | 12 | 426 | 11 | −1.0 |
| A3 | 0.11 | 45.9 | 27.6 | 2.8 | 0.10 | 0.01 | 0.08 | 0.010 | 0.602 | 0.010 | 0.025 | 0.010 | 489 | 23 | 479 | 18 | 506 | 13 | −2.2 |
| A6 | 0.03 | 12.4 | 19.6 | 2.0 | 0.20 | 0.01 | 0.103 | 0.012 | 0.703 | 0.012 | 0.027 | 0.011 | 570 | 31 | 540 | 23 | 532 | 13 | −5.6 |
| A7 | 0.09 | 71.2 | 34.2 | 3.3 | 0.06 | 0.01 | 0.07 | 0.009 | 0.598 | 0.010 | 0.023 | 0.009 | 439 | 18 | 476 | 17 | 469 | 12 | 7.7 |
| B1 | 0.10 | 7.0 | 19.7 | 2.0 | 0.16 | 0.01 | 0.09 | 0.012 | 0.763 | 0.013 | 0.027 | 0.011 | 544 | 28 | 576 | 27 | 533 | 13 | 5.4 |
| B2 * | 0.51 | 12.3 | 21.4 | 0.8 | 0.84 | 0.04 | 0.08 | 0.010 | 1.301 | 0.021 | 0.024 | 0.010 | 468 | 21 | 846 | 67 | 480 | 12 | 44.7 |
| B3 | 0.10 | 15.4 | 37.7 | 1.4 | 0.08 | 0.01 | 0.06 | 0.008 | 0.407 | 0.007 | 0.020 | 0.008 | 368 | 13 | 346 | 9 | 396 | 10 | −6.1 |
| B4 | 0.08 | 9.0 | 64.4 | 6.3 | 0.04 | 0.01 | 0.06 | 0.008 | 0.414 | 0.007 | 0.019 | 0.008 | 370 | 13 | 352 | 9 | 388 | 10 | −5.1 |
| B5 | 0.08 | 8.6 | 11.5 | 0.4 | 0.22 | 0.01 | 0.09 | 0.012 | 0.673 | 0.011 | 0.029 | 0.012 | 558 | 30 | 522 | 21 | 576 | 14 | −6.9 |
| B6 | 0.08 | 21.3 | 18.1 | 0.5 | 0.16 | 0.01 | 0.09 | 0.012 | 0.769 | 0.013 | 0.029 | 0.012 | 576 | 32 | 579 | 27 | 581 | 15 | 0.5 |
| B8 | 0.08 | 4.0 | 31.5 | 3.1 | 0.08 | 0.01 | 0.07 | 0.009 | 0.553 | 0.009 | 0.021 | 0.009 | 452 | 19 | 447 | 15 | 426 | 11 | −1.0 |
| B9 | 0.08 | 1.8 | 30.6 | 3.1 | 0.09 | 0.01 | 0.08 | 0.010 | 0.553 | 0.009 | 0.026 | 0.010 | 465 | 20 | 447 | 15 | 509 | 13 | −4.0 |
| C6 | 0.09 | 7.6 | 18.2 | 1.9 | 0.15 | 0.01 | 0.084 | 0.011 | 0.701 | 0.012 | 0.026 | 0.010 | 518 | 26 | 540 | 23 | 518 | 13 | 3.9 |
| C9 | 0.08 | 33.7 | 29.9 | 2.9 | 0.11 | 0.01 | 0.06 | 0.008 | 0.471 | 0.008 | 0.021 | 0.008 | 401 | 15 | 392 | 11 | 423 | 11 | −2.3 |
| D1 | 0.08 | 4.9 | 26.7 | 2.8 | 0.11 | 0.01 | 0.08 | 0.010 | 0.634 | 0.010 | 0.024 | 0.010 | 481 | 22 | 499 | 19 | 489 | 12 | 3.4 |
| D6 * | 0.06 | 17.9 | 94.8 | 2.4 | 0.01 | 0.01 | 0.08 | 0.011 | 0.190 | 0.003 | 0.076 | 0.030 | 498 | 23 | 177 | 2 | 1476 | 37 | −181.9 |
| E3 | 0.08 | 45.9 | 27.6 | 1.0 | 0.18 | 0.01 | 0.08 | 0.010 | 0.635 | 0.011 | 0.022 | 0.009 | 486 | 22 | 499 | 19 | 444 | 11 | 2.7 |
| E6 | 0.51 | 12.4 | 46.0 | 3.1 | 0.56 | 0.03 | 0.09 | 0.011 | 0.784 | 0.013 | 0.026 | 0.010 | 537 | 27 | 588 | 28 | 519 | 13 | 8.7 |
| E8 | 0.09 | 71.2 | 49.8 | 1.1 | 0.06 | 0.01 | 0.09 | 0.011 | 0.804 | 0.013 | 0.029 | 0.012 | 540 | 28 | 599 | 29 | 576 | 14 | 9.8 |
| E10 | 0.09 | 7.0 | 17.0 | 0.5 | 0.66 | 0.03 | 0.10 | 0.013 | 0.721 | 0.012 | 0.030 | 0.012 | 592 | 33 | 551 | 24 | 594 | 15 | −7.3 |
| F5 | 0.12 | 12.3 | 25.9 | 1.0 | 0.30 | 0.01 | 0.07 | 0.009 | 0.588 | 0.010 | 0.021 | 0.008 | 433 | 18 | 470 | 17 | 421 | 11 | 7.8 |
| F7 | 0.10 | 15.4 | 11.1 | 2.1 | 0.11 | 0.01 | 0.07 | 0.009 | 0.497 | 0.008 | 0.022 | 0.009 | 408 | 16 | 410 | 12 | 445 | 11 | 0.5 |
| F9 | 0.10 | 9.0 | 25.3 | 0.8 | 0.49 | 0.02 | 0.07 | 0.010 | 0.556 | 0.009 | 0.024 | 0.010 | 453 | 19 | 449 | 15 | 478 | 12 | −0.9 |
| F10 | 0.08 | 8.6 | 24.3 | 0.7 | 0.08 | 0.01 | 0.08 | 0.011 | 0.664 | 0.011 | 0.028 | 0.011 | 499 | 24 | 517 | 21 | 551 | 14 | 3.6 |
| G2 | 0.10 | 21.3 | 13.9 | 2.0 | 0.13 | 0.01 | 0.08 | 0.010 | 0.602 | 0.010 | 0.024 | 0.010 | 463 | 20 | 479 | 18 | 479 | 12 | 3.2 |
| G3 | 0.12 | 4.0 | 37.1 | 3.7 | 0.12 | 0.01 | 0.07 | 0.009 | 0.483 | 0.008 | 0.024 | 0.009 | 438 | 18 | 400 | 12 | 472 | 12 | −9.4 |
| G4 | 0.08 | 1.8 | 45.3 | 3.7 | 0.35 | 0.02 | 0.08 | 0.010 | 0.626 | 0.010 | 0.023 | 0.009 | 467 | 21 | 493 | 19 | 466 | 12 | 5.4 |
| G5 | 0.11 | 7.6 | 48.1 | 1.8 | 0.23 | 0.01 | 0.07 | 0.009 | 0.522 | 0.009 | 0.020 | 0.008 | 419 | 17 | 426 | 14 | 390 | 10 | 1.6 |
| G6 | 0.41 | 33.7 | 28.9 | 3.0 | 0.49 | 0.02 | 0.07 | 0.009 | 0.579 | 0.010 | 0.023 | 0.009 | 430 | 17 | 464 | 16 | 454 | 11 | 7.3 |
| G7 | 0.08 | 4.9 | 30.1 | 1.1 | 0.07 | 0.01 | 0.07 | 0.009 | 0.545 | 0.009 | 0.024 | 0.010 | 440 | 18 | 442 | 15 | 484 | 12 | 0.5 |
| G8 | 0.12 | 17.9 | 49.7 | 1.5 | 0.63 | 0.03 | 0.08 | 0.010 | 0.555 | 0.009 | 0.025 | 0.010 | 485 | 22 | 448 | 15 | 503 | 13 | −8.2 |
| G9 | 0.08 | 45.9 | 31.0 | 3.0 | 0.08 | 0.01 | 0.07 | 0.010 | 0.532 | 0.009 | 0.025 | 0.010 | 452 | 19 | 433 | 14 | 494 | 12 | −4.4 |
| G10 | 0.10 | 12.4 | 56.8 | 4.6 | 0.07 | 0.01 | 0.07 | 0.010 | 0.610 | 0.010 | 0.024 | 0.010 | 451 | 19 | 483 | 18 | 482 | 12 | 6.7 |
| H2 | 0.08 | 71.2 | 28.8 | 2.9 | 0.08 | 0.01 | 0.08 | 0.010 | 0.588 | 0.010 | 0.025 | 0.010 | 476 | 21 | 469 | 17 | 507 | 13 | −1.3 |
| H3 | 0.07 | 7.0 | 13.8 | 1.5 | 0.15 | 0.01 | 0.10 | 0.013 | 0.879 | 0.015 | 0.030 | 0.012 | 589 | 33 | 640 | 34 | 590 | 15 | 8.0 |
| H4 * | 0.09 | 12.3 | 46.4 | 3.3 | 0.09 | 0.01 | 0.09 | 0.011 | 0.447 | 0.007 | 0.024 | 0.009 | 540 | 28 | 375 | 10 | 474 | 12 | −43.9 |
| H6 | 0.08 | 15.4 | 24.6 | 2.6 | 0.20 | 0.01 | 0.08 | 0.010 | 0.567 | 0.009 | 0.023 | 0.009 | 488 | 23 | 456 | 16 | 458 | 12 | −6.9 |
| H9 | 0.10 | 9.0 | 35.5 | 1.3 | 0.12 | 0.01 | 0.07 | 0.009 | 0.525 | 0.009 | 0.022 | 0.009 | 415 | 16 | 429 | 14 | 435 | 11 | 3.2 |
| I1 | 0.09 | 8.6 | 69.3 | 1.9 | 0.07 | 0.01 | 0.07 | 0.010 | 0.626 | 0.010 | 0.023 | 0.009 | 462 | 20 | 494 | 19 | 456 | 11 | 6.5 |
| I2 | 0.08 | 21.3 | 10.9 | 1.1 | 0.20 | 0.01 | 0.09 | 0.012 | 0.789 | 0.013 | 0.029 | 0.011 | 567 | 31 | 591 | 28 | 572 | 14 | 4.0 |
| I3 | 0.58 | 4.0 | 22.0 | 2.2 | 0.87 | 0.04 | 0.07 | 0.009 | 0.472 | 0.008 | 0.022 | 0.009 | 425 | 17 | 393 | 11 | 430 | 11 | −8.3 |
| I4 | 0.08 | 1.8 | 32.2 | 3.0 | 0.11 | 0.01 | 0.07 | 0.009 | 0.592 | 0.010 | 0.023 | 0.009 | 438 | 18 | 472 | 17 | 449 | 11 | 7.2 |
| I9 | 0.08 | 7.6 | 12.4 | 1.5 | 0.28 | 0.01 | 0.09 | 0.012 | 0.762 | 0.013 | 0.030 | 0.012 | 576 | 32 | 575 | 27 | 595 | 15 | −0.2 |
| I10 * | 0.09 | 337.0 | 37.3 | 3.3 | 0.15 | 0.01 | 0.08 | 0.010 | 0.483 | 0.008 | 0.016 | 0.006 | 470 | 21 | 400 | 12 | 314 | 8 | −17.7 |
| J2 | 0.10 | 4.9 | 19.7 | 2.0 | 0.14 | 0.01 | 0.08 | 0.011 | 0.631 | 0.010 | 0.029 | 0.012 | 497 | 23 | 497 | 19 | 582 | 15 | −0.2 |
| J5 | 0.12 | 7.0 | 68.8 | 2.1 | 0.06 | 0.01 | 0.07 | 0.009 | 0.591 | 0.010 | 0.024 | 0.010 | 431 | 17 | 471 | 17 | 477 | 12 | 8.6 |
| J6 | 0.08 | 12.3 | 16.0 | 0.7 | 0.21 | 0.01 | 0.09 | 0.011 | 0.684 | 0.011 | 0.023 | 0.009 | 534 | 27 | 529 | 22 | 452 | 11 | −0.9 |
| J9 | 0.09 | 15.4 | 41.6 | 4.4 | 0.18 | 0.01 | 0.06 | 0.008 | 0.430 | 0.007 | 0.019 | 0.008 | 374 | 13 | 363 | 10 | 380 | 10 | −3.0 |
| A2 | 0.08 | 9.0 | 22.6 | 0.8 | 0.23 | 0.01 | 0.07 | 0.009 | 0.599 | 0.010 | 0.022 | 0.009 | 442 | 18 | 477 | 17 | 442 | 11 | 7.3 |
| Gr. | 238U | 1σ | Ns | A | ρs | Age | 1σ |
|---|---|---|---|---|---|---|---|
| [ppm] | (×103 Track/cm2) | [Ma] | |||||
| A1 | 92.7 | 4.5 | 113 | 8 | 14.6 | 319 | 39 |
| A8 | 209.4 | 9.8 | 105 | 6 | 18.1 | 369 | 64 |
| B1 | 266.1 | 12.4 | 117 | 4 | 30.2 | 330 | 42 |
| B6 | 217.4 | 10.1 | 118 | 5 | 24.4 | 346 | 40 |
| C7 | 187.5 | 8.7 | 132 | 6 | 22.7 | 372 | 69 |
| D3 | 345.5 | 16.1 | 139 | 7 | 20.5 | 350 | 63 |
| D8 | 326.4 | 15.2 | 97 | 4 | 25.1 | 334 | 69 |
| E7 | 243.2 | 11.3 | 91 | 3 | 31.3 | 349 | 47 |
| F1 | 144.5 | 6.7 | 77 | 3 | 26.5 | 354 | 21 |
| G4 | 144.9 | 6.8 | 193 | 4 | 49.8 | 351 | 15 |
| G5 | 182.2 | 8.5 | 71 | 4 | 18.3 | 351 | 54 |
| H7 | 212.5 | 9.9 | 124 | 8 | 16.0 | 335 | 26 |
| Weighted Mean ZFT Age | 347 | 16 | |||||
| Gr. | 238U | 1σ | Ns | A | ρs | CTL | SD | θ | Dpar | SD | Age | 1σ |
|---|---|---|---|---|---|---|---|---|---|---|---|---|
| [µg/g] | (×103 Track/cm2) | [µm] | [µm] | ° | [µm] | [Ma] | ||||||
| A2 | 33.5 | 3.3 | 59 | 12 | 5.1 | 10.2 | 0.6 | 48 | 1.5 | 0.02 | 290 | 48 |
| A3 | 27.6 | 2.8 | 31 | 8 | 4.0 | 9.1 | 2.1 | 63 | 1.5 | 0.20 | 277 | 57 |
| A6 | 19.6 | 2.0 | 18 | 6 | 3.1 | 10.3 | 1.4 | 40 | 1.5 | 0.16 | 302 | 77 |
| A7 | 34.2 | 3.3 | 35 | 8 | 4.5 | 10.8 | 1.9 | 40 | 1.5 | 0.11 | 253 | 50 |
| B1 | 19.7 | 2.0 | 15 | 6 | 2.6 | 10.7 | 2.8 | 60 | 1.6 | 0.08 | 251 | 69 |
| B2 | 21.4 | 0.8 | 12 | 4 | 3.1 | 9.8 | 0.4 | 60 | 1.7 | 0.19 | 277 | 85 |
| B3 | 37.7 | 1.4 | 30 | 6 | 5.2 | 10.4 | 3.2 | 47 | 1.5 | 0.04 | 262 | 55 |
| B4 | 64.4 | 6.3 | 111 | 12 | 9.6 | 7.3 | 1.5 | 65 | 1.6 | 0.06 | 283 | 39 |
| B5 | 11.5 | 0.4 | 10 | 6 | 1.7 | 8.6 | 0.5 | 63 | 1.6 | 0.19 | 287 | 95 |
| B6 | 18.1 | 0.5 | 11 | 4 | 2.8 | 9.4 | 0.4 | 45 | 1.6 | 0.18 | 299 | 95 |
| B8 | 31.5 | 3.1 | 322 | 6 | 55.4 | 9.6 | 3.2 | 75 | 1.5 | 0.09 | 292 | 63 |
| B9 | 30.6 | 3.1 | 102 | 20 | 5.3 | 10.3 | 0.4 | 54 | 1.6 | 0.14 | 327 | 37 |
| C6 | 18.2 | 1.9 | 28 | 12 | 2.4 | 10.8 | 0.7 | 50 | 1.5 | 0.12 | 254 | 54 |
| C9 | 29.9 | 2.9 | 32 | 9 | 3.7 | 9.2 | 1.5 | 67 | 1.5 | 0.17 | 236 | 48 |
| D1 | 26.7 | 2.8 | 23 | 6 | 4.0 | 9.5 | 0.3 | 55 | 1.6 | 0.10 | 284 | 66 |
| D6 | 94.8 | 2.4 | 222 | 18 | 12.7 | 10.1 | 0.5 | 66 | 1.5 | 0.07 | 257 | 20 |
| E3 | 27.6 | 1.0 | 38 | 9 | 4.4 | 9.3 | 0.9 | 57 | 1.4 | 0.06 | 302 | 58 |
| E6 | 46.0 | 3.1 | 26 | 4 | 6.7 | 10.4 | 4.2 | 75 | 1.5 | 0.10 | 279 | 61 |
| E8 | 49.8 | 1.1 | 62 | 8 | 8.0 | 8.9 | 2.5 | 52 | 1.4 | 0.05 | 307 | 50 |
| E10 | 17.0 | 0.5 | 18 | 8 | 2.3 | 10.0 | 0.3 | 41 | 1.7 | 0.13 | 261 | 67 |
| F5 | 25.9 | 1.0 | 28 | 9 | 3.2 | 9.7 | 1.5 | 23 | 1.5 | 0.07 | 238 | 51 |
| F7 | 11.1 | 2.1 | 7 | 4 | 1.8 | 12.1 | 2.5 | 50 | 1.5 | 0.05 | 310 | 121 |
| F9 | 25.3 | 0.8 | 34 | 9 | 3.9 | 10.9 | 0.7 | 44 | 1.5 | 0.02 | 294 | 58 |
| F10 | 24.3 | 0.7 | 12 | 4 | 3.1 | 9.1 | 1.2 | 67 | 1.6 | 0.14 | 244 | 75 |
| G2 | 13.9 | 2.0 | 13 | 6 | 2.2 | 9.4 | 0.2 | 63 | 1.5 | 0.07 | 307 | 90 |
| G3 | 37.1 | 3.7 | 44 | 10 | 4.5 | 9.6 | 1.5 | 74 | 1.4 | 0.15 | 235 | 36 |
| G4 | 45.3 | 3.7 | 98 | 16 | 6.3 | 9.4 | 1.3 | 55 | 1.6 | 0.15 | 267 | 30 |
| G5 | 48.1 | 1.8 | 65 | 9 | 7.5 | 9.9 | 3.1 | 75 | 1.5 | 0.14 | 296 | 38 |
| G6 | 28.9 | 3.0 | 51 | 12 | 4.4 | 9.7 | 2.6 | 78 | 1.5 | 0.17 | 290 | 50 |
| G7 | 30.1 | 1.1 | 50 | 12 | 4.3 | 9.9 | 0.8 | 47 | 1.4 | 0.04 | 273 | 47 |
| G8 | 49.7 | 1.5 | 165 | 20 | 8.5 | 11.6 | 2.6 | 50 | 1.7 | 0.07 | 327 | 31 |
| G9 | 31.0 | 3.0 | 41 | 9 | 4.7 | 11.4 | 1.8 | 57 | 1.5 | 0.08 | 290 | 54 |
| G10 | 56.8 | 4.6 | 116 | 15 | 8.0 | 10.4 | 1.1 | 56 | 1.3 | 0.05 | 269 | 33 |
| H2 | 28.8 | 2.9 | 29 | 6 | 5.0 | 9.9 | 2.1 | 49 | 1.4 | 0.04 | 330 | 70 |
| H3 | 13.8 | 1.5 | 32 | 12 | 2.2 | 9.8 | 1.2 | 68 | 1.5 | 0.12 | 304 | 54 |
| H4 | 46.4 | 3.3 | 53 | 8 | 6.1 | 10.0 | 0.8 | 54 | 1.6 | 0.07 | 251 | 43 |
| H6 | 24.6 | 2.6 | 37 | 6 | 3.8 | 10.7 | 2.6 | 73 | 1.2 | 0.27 | 296 | 57 |
| H9 | 35.5 | 1.3 | 31 | 15 | 5.3 | 10.2 | 2.1 | 56 | 1.3 | 0.09 | 287 | 59 |
| I1 | 69.3 | 1.9 | 55 | 9 | 9.5 | 11.0 | 2.4 | 61 | 1.7 | 0.36 | 261 | 44 |
| I2 | 10.9 | 1.1 | 14 | 10 | 1.6 | 9.8 | 0.5 | 54 | 1.6 | 0.16 | 281 | 80 |
| I3 | 22.0 | 2.2 | 11 | 6 | 2.8 | 11.8 | 1.2 | 47 | 1.5 | 0.29 | 247 | 79 |
| I4 | 32.2 | 3.0 | 48 | 6 | 5.5 | 10.7 | 2.3 | 47 | 1.6 | 0.09 | 326 | 57 |
| I9 | 12.4 | 1.5 | 17 | 9 | 2.0 | 10.1 | 2.5 | 73 | 1.5 | 0.18 | 301 | 79 |
| I10 | 37.3 | 3.3 | 20 | 4 | 5.2 | 12.6 | 2.6 | 55 | 1.4 | 0.05 | 265 | 65 |
| J2 | 19.7 | 2.0 | 24 | 9 | 3.1 | 9.6 | 0.7 | 63 | 1.4 | 0.22 | 301 | 64 |
| J5 | 68.8 | 2.1 | 71 | 9 | 9.2 | 10.7 | 1.1 | 67 | 1.4 | 0.07 | 255 | 40 |
| J6 | 16.0 | 0.7 | 37 | 4 | 2.5 | 10.4 | 1.7 | 47 | 1.4 | 0.12 | 303 | 50 |
| J9 | 41.6 | 4.4 | 57 | 8 | 5.9 | 12.0 | 1.7 | 63 | 1.5 | 0.09 | 271 | 39 |
| Weighted Mean AFT Age | 283 | 7 | ||||||||||
Publisher’s Note: MDPI stays neutral with regard to jurisdictional claims in published maps and institutional affiliations. |
© 2021 by the authors. Licensee MDPI, Basel, Switzerland. This article is an open access article distributed under the terms and conditions of the Creative Commons Attribution (CC BY) license (https://creativecommons.org/licenses/by/4.0/).
Share and Cite
Mansour, S.; Hasebe, N.; Azab, E.; Elnaggar, A.Y.; Tamura, A. Combined Zircon/Apatite U-Pb and Fission-Track Dating by LA-ICP-MS and Its Geological Applications: An Example from the Egyptian Younger Granites. Minerals 2021, 11, 1341. https://doi.org/10.3390/min11121341
Mansour S, Hasebe N, Azab E, Elnaggar AY, Tamura A. Combined Zircon/Apatite U-Pb and Fission-Track Dating by LA-ICP-MS and Its Geological Applications: An Example from the Egyptian Younger Granites. Minerals. 2021; 11(12):1341. https://doi.org/10.3390/min11121341
Chicago/Turabian StyleMansour, Sherif, Noriko Hasebe, Ehab Azab, Ashraf Y. Elnaggar, and Akihiro Tamura. 2021. "Combined Zircon/Apatite U-Pb and Fission-Track Dating by LA-ICP-MS and Its Geological Applications: An Example from the Egyptian Younger Granites" Minerals 11, no. 12: 1341. https://doi.org/10.3390/min11121341
APA StyleMansour, S., Hasebe, N., Azab, E., Elnaggar, A. Y., & Tamura, A. (2021). Combined Zircon/Apatite U-Pb and Fission-Track Dating by LA-ICP-MS and Its Geological Applications: An Example from the Egyptian Younger Granites. Minerals, 11(12), 1341. https://doi.org/10.3390/min11121341