Quantification of Kaolinite and Halloysite Using Machine Learning from FTIR, XRF, and Brightness Data
Abstract
:1. Introduction
1.1. Regional and Local Geological Setting
1.2. Kaolinite and Halloysite Mineralisation
2. Materials and Methods
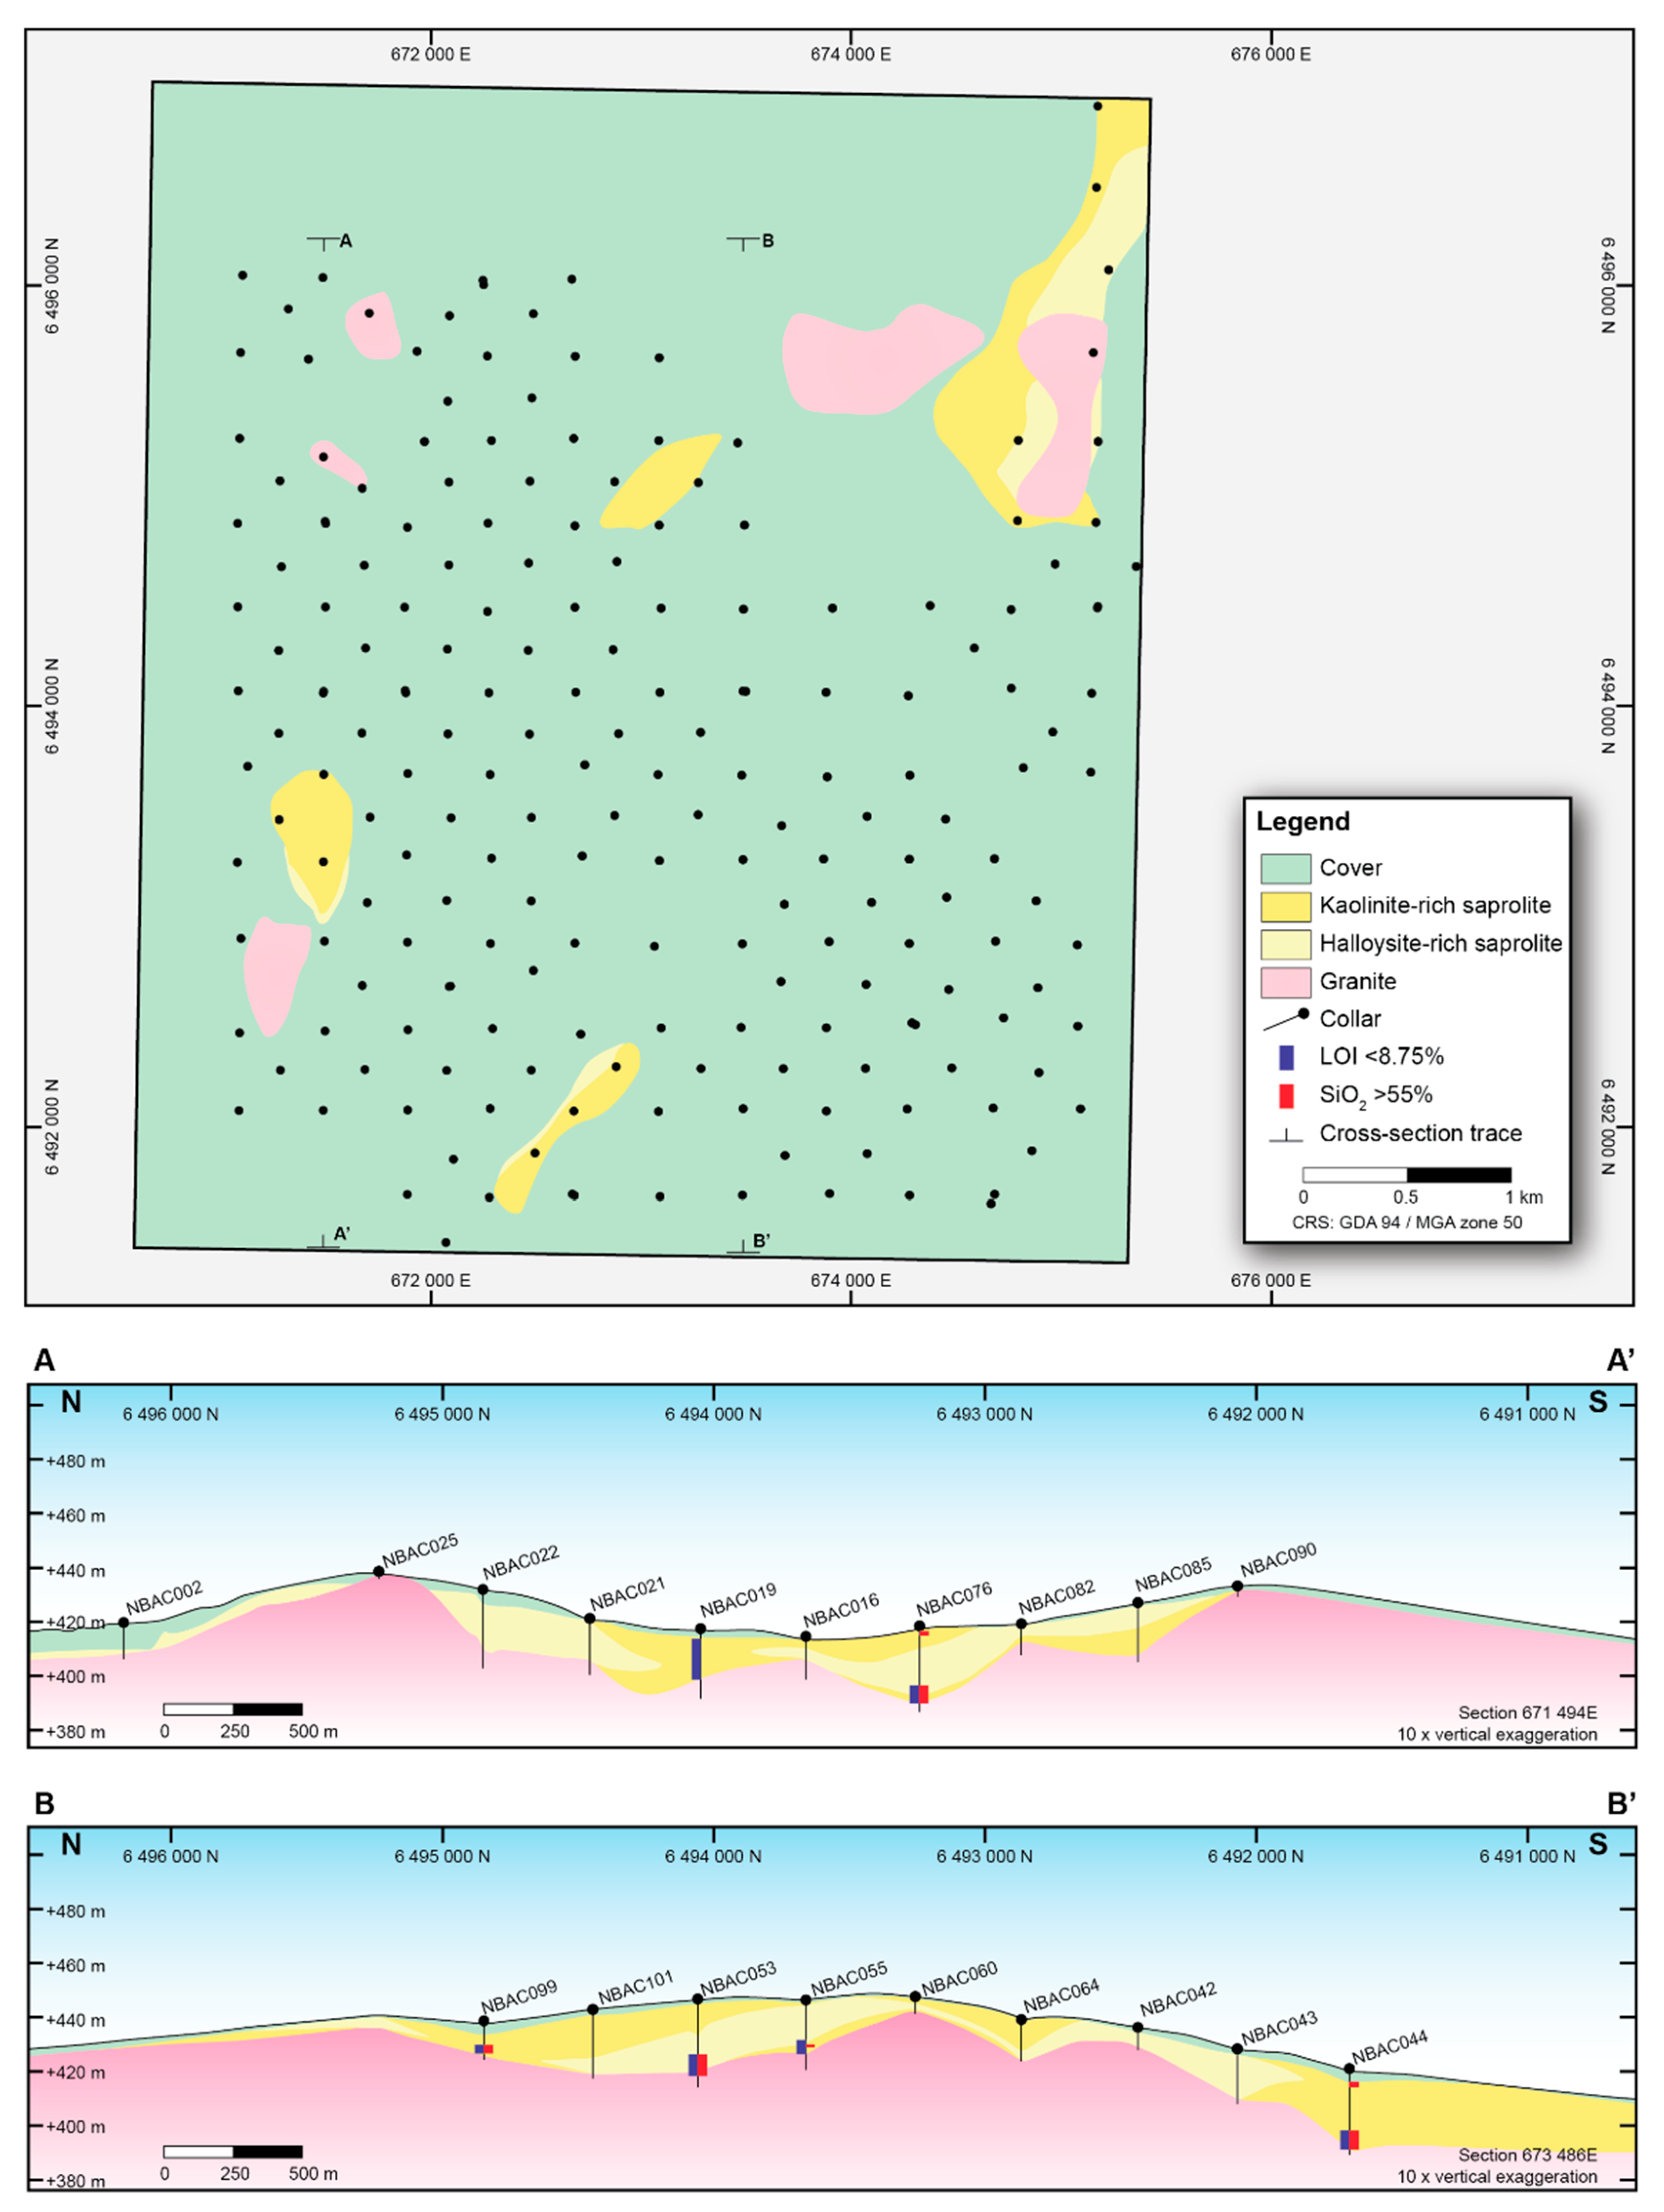
2.1. Drill Samples
2.2. Sample Preparation
2.3. X-ray Diffraction (XRD)
2.4. X-ray Fluorescence (XRF)
2.5. Fourier Transform Infrared (FTIR) Spectroscopy
2.6. Brightness Analysis
2.7. Machine-Learning (ML) Prediction
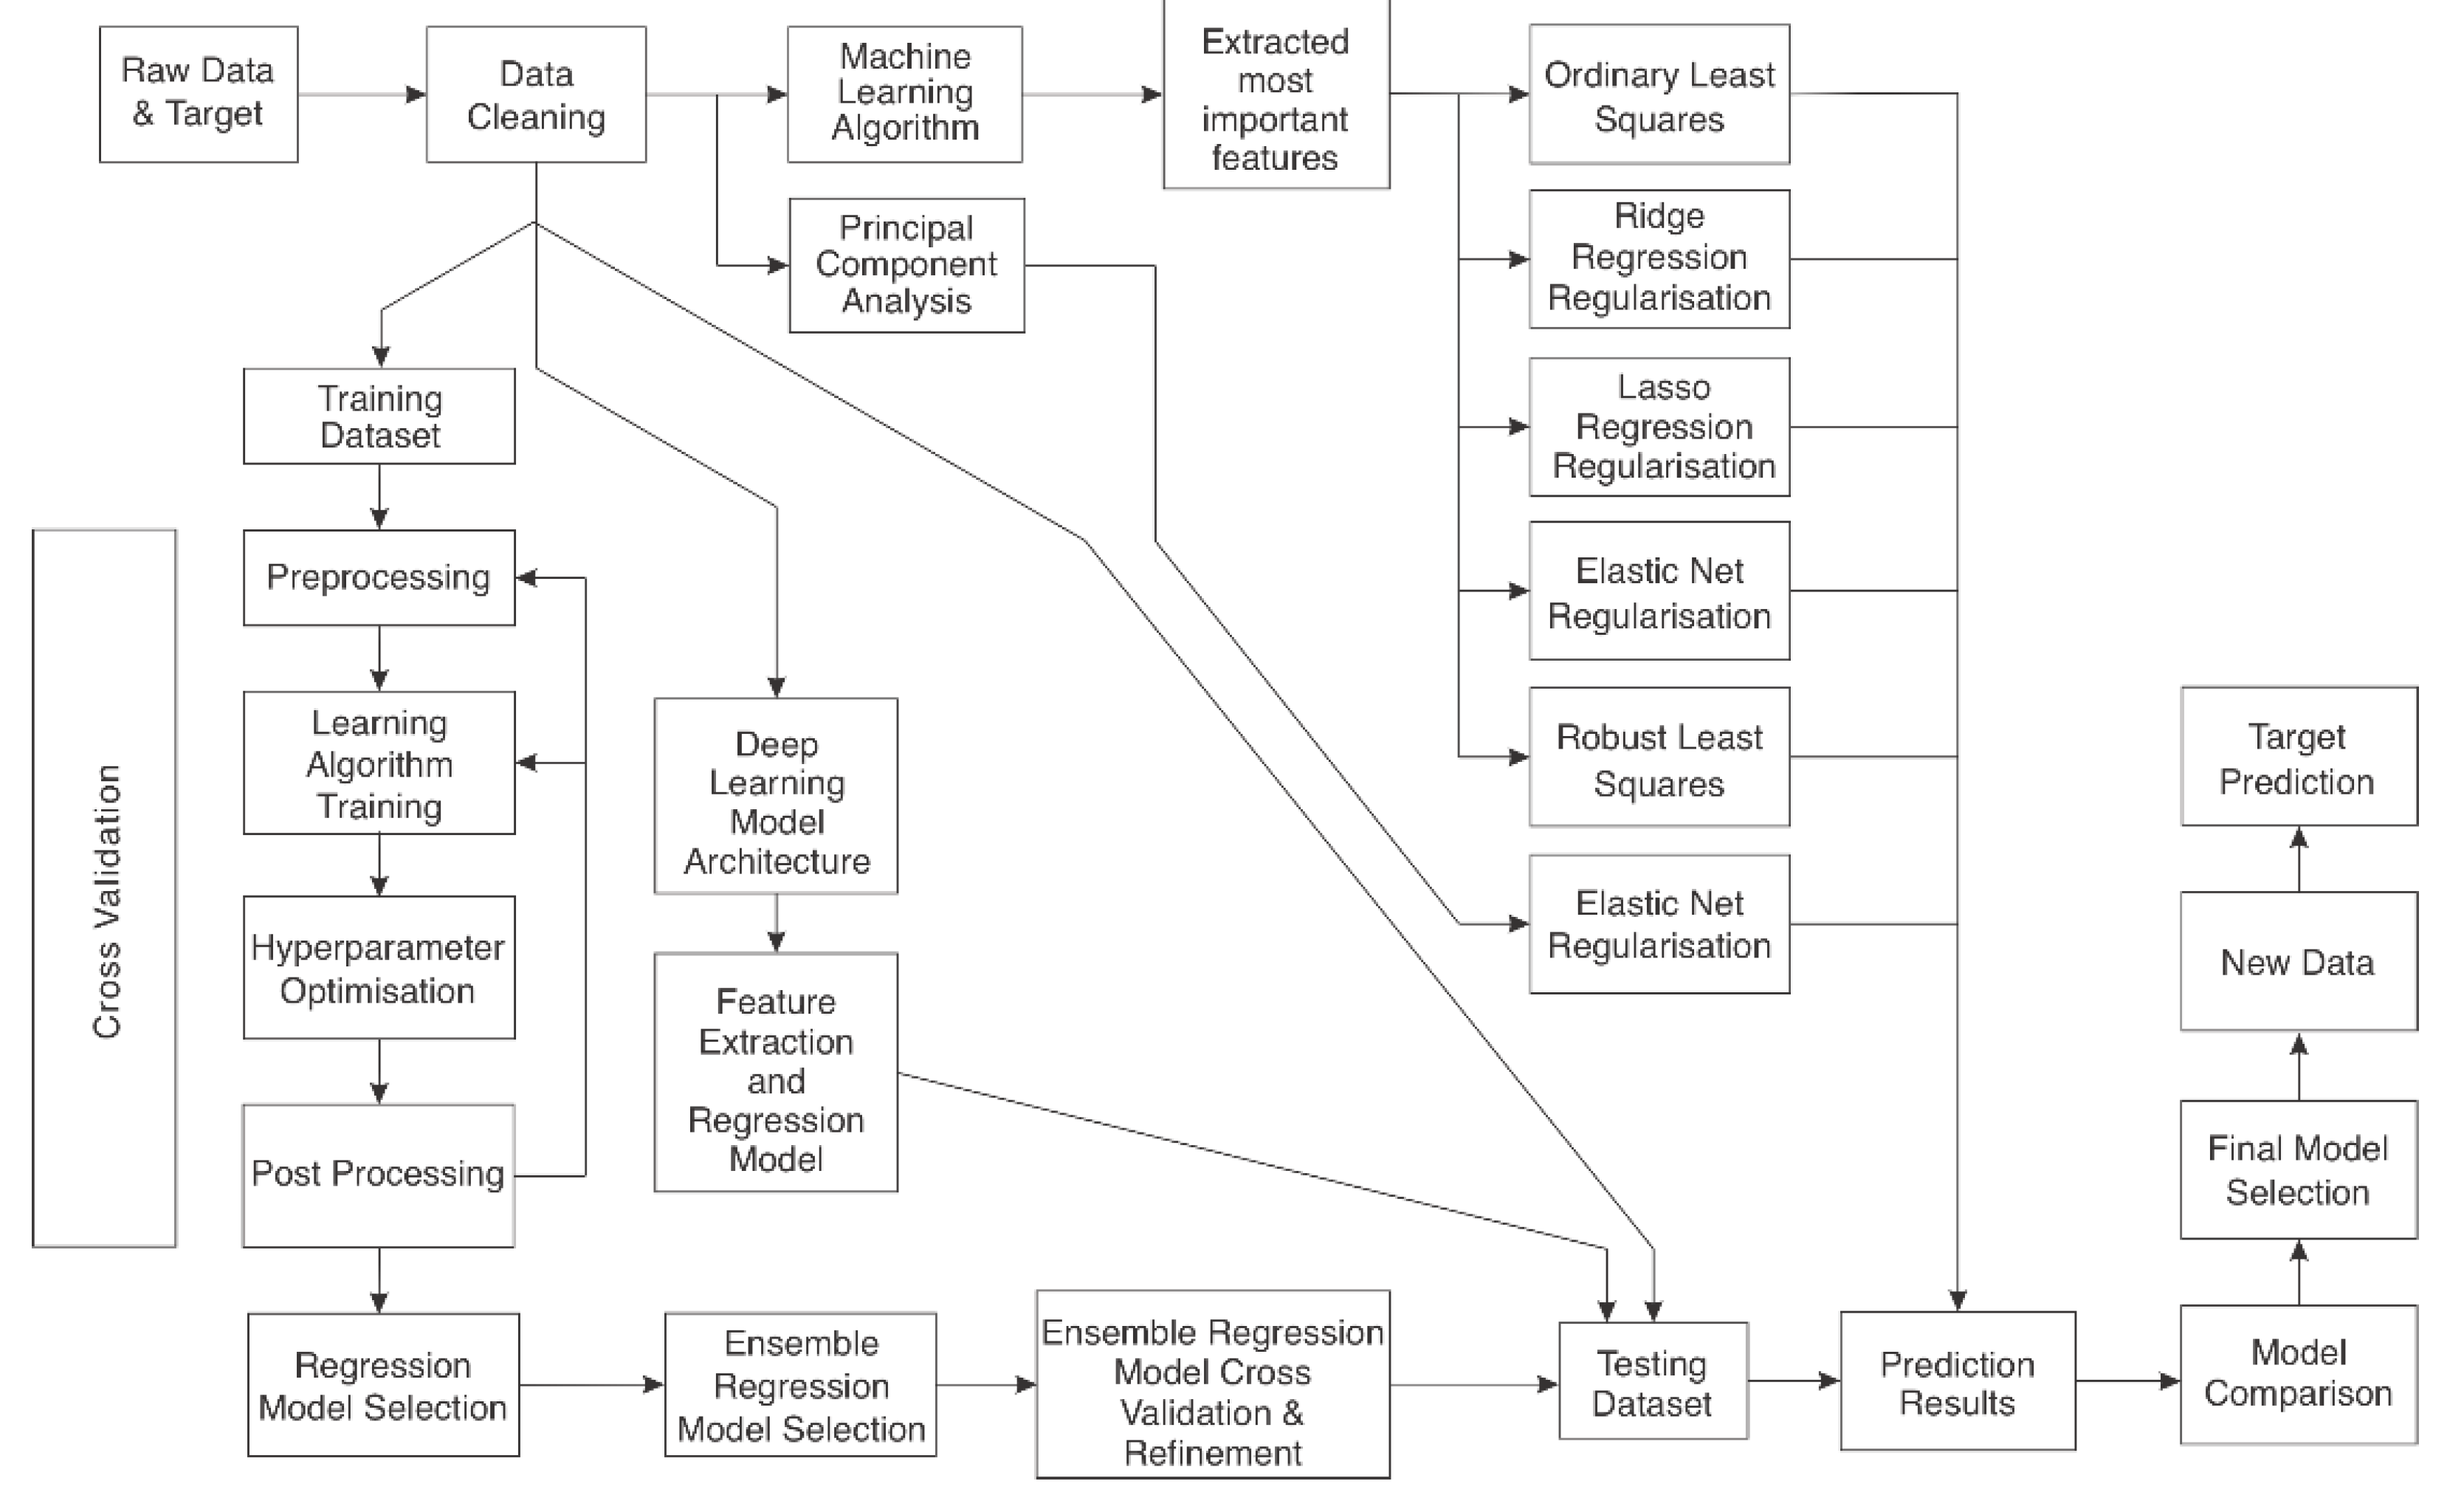
- ML was employed to determine the most important features of the regression models. These features were then used in ordinary least square (OLS), robust least squares (RLS), and regularisation lasso, ridge, and elastic net models.
- Principal components analysis was employed on the merged kaolinite, chemistry, and spectral dataset, and elastic net regularisation was employed to reduce the model complexity further.
3. Results
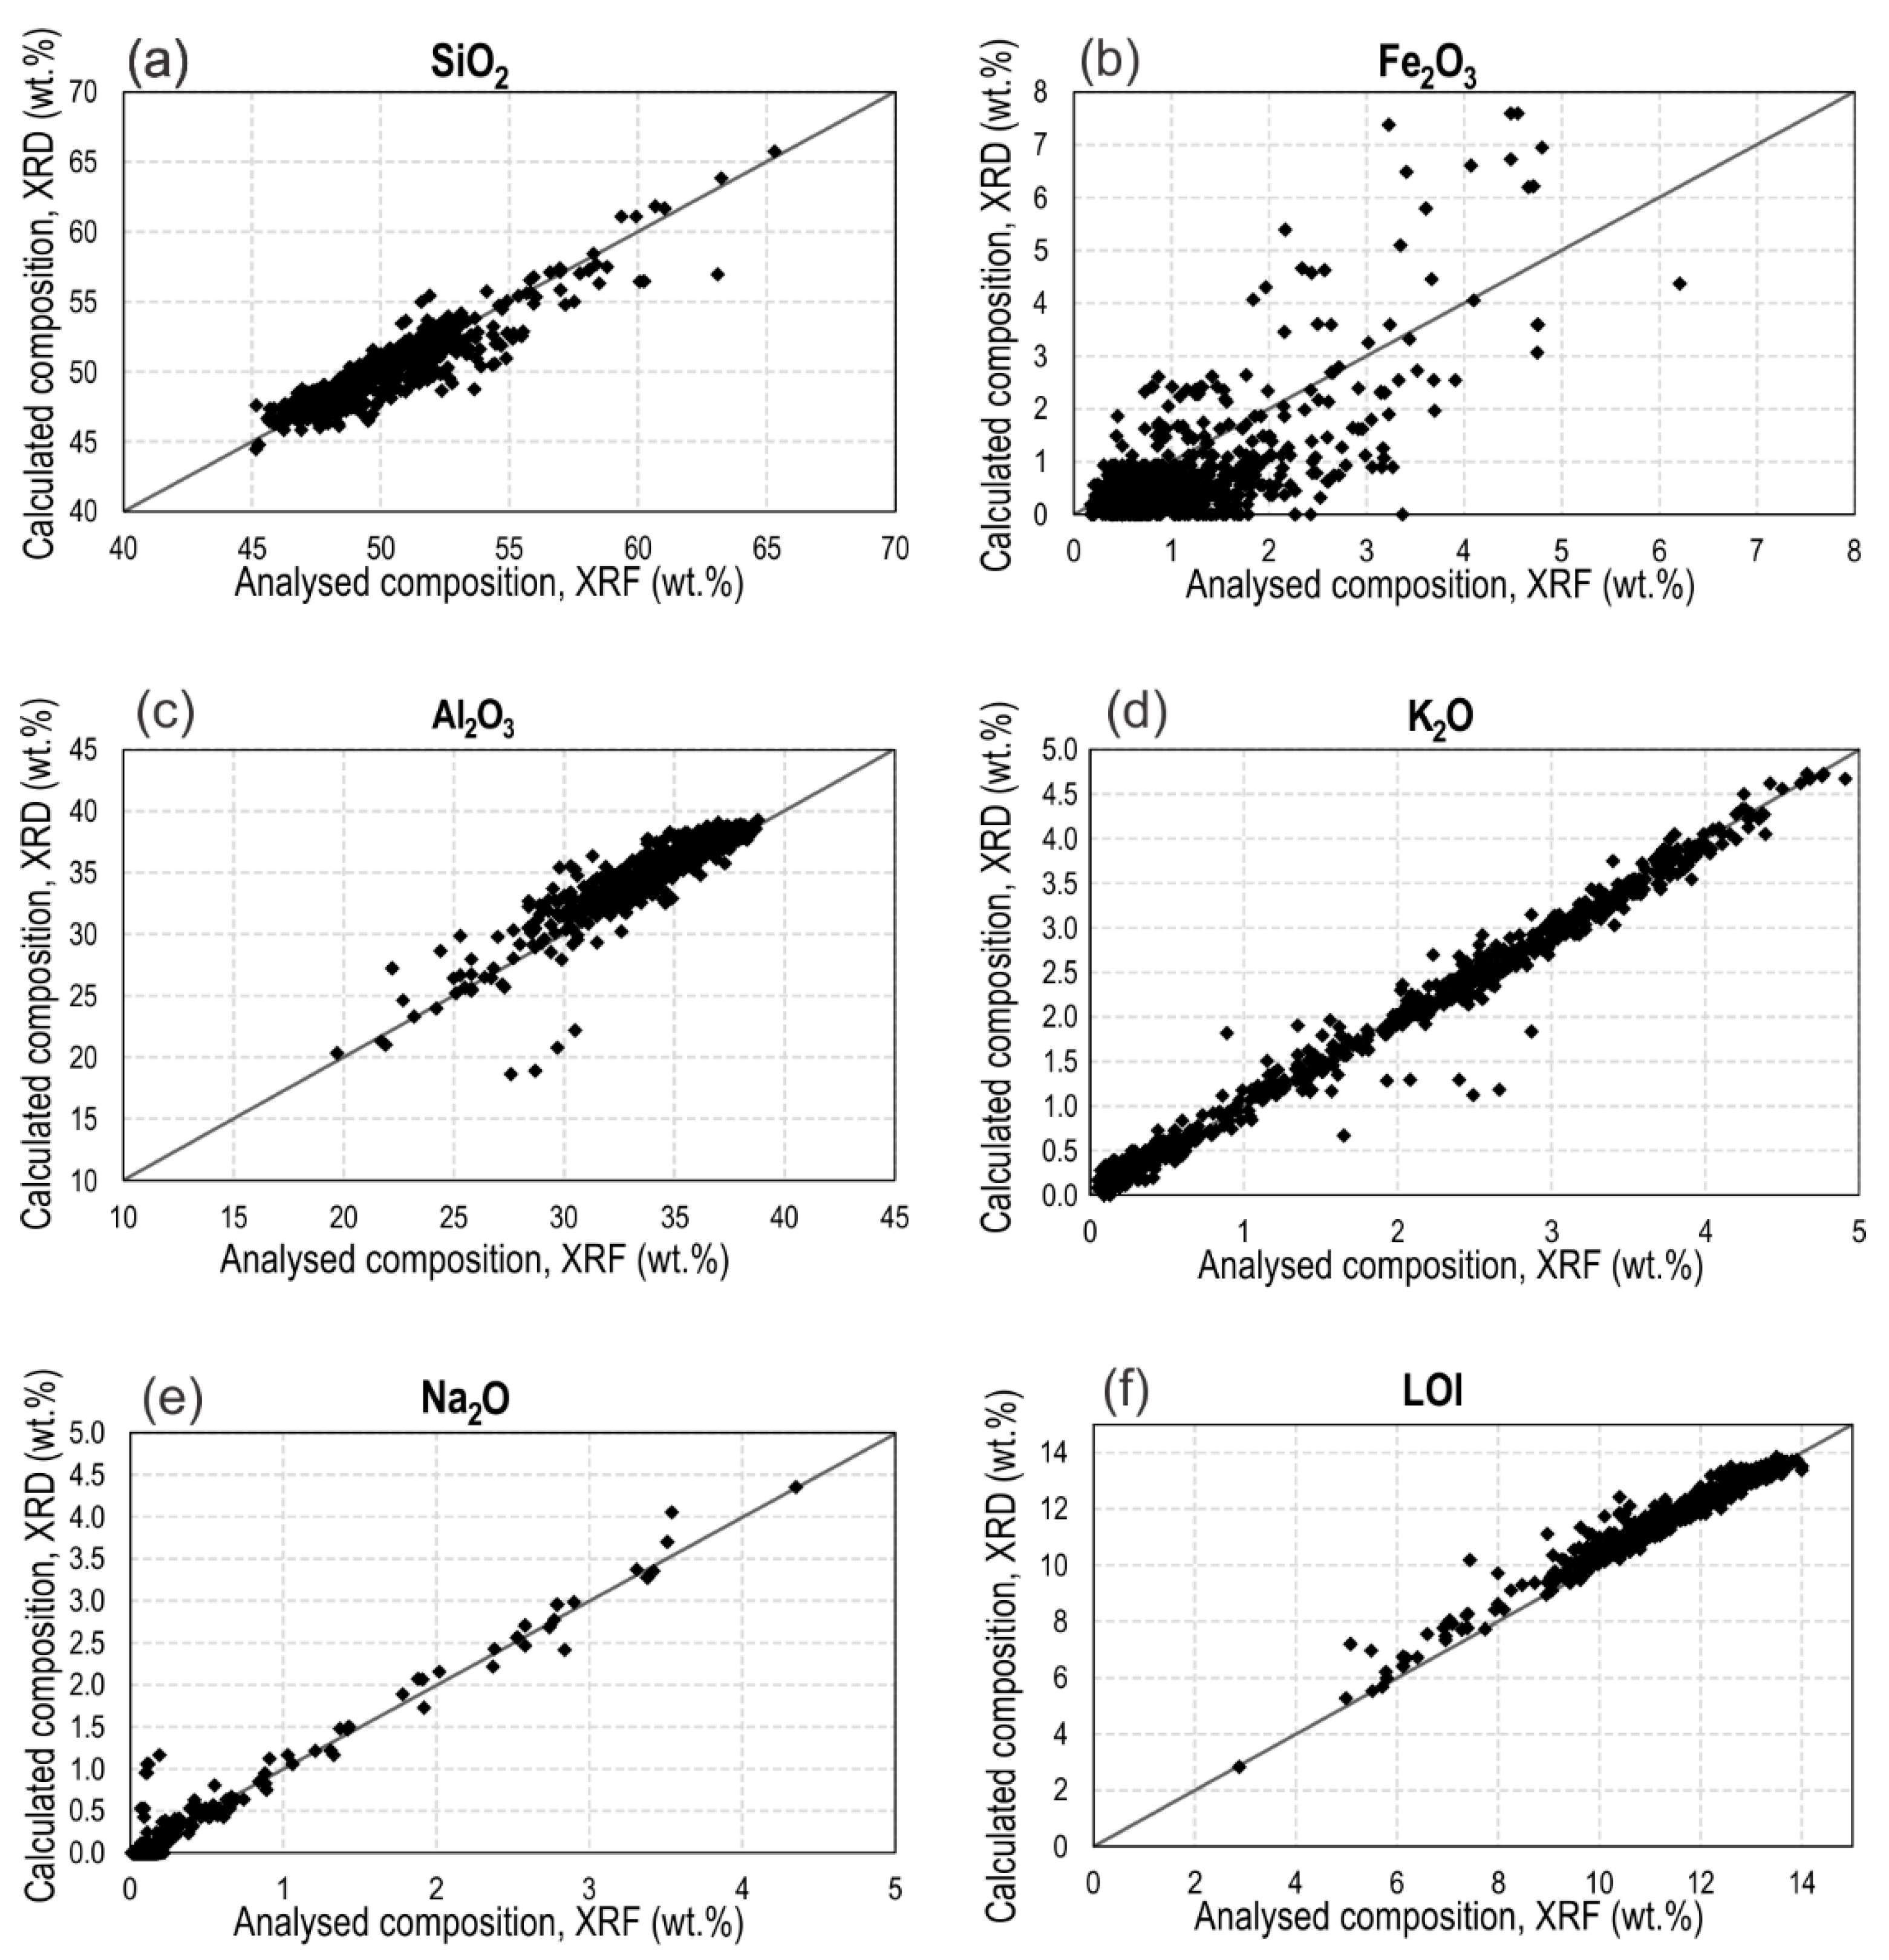
3.1. XRD Data Validation
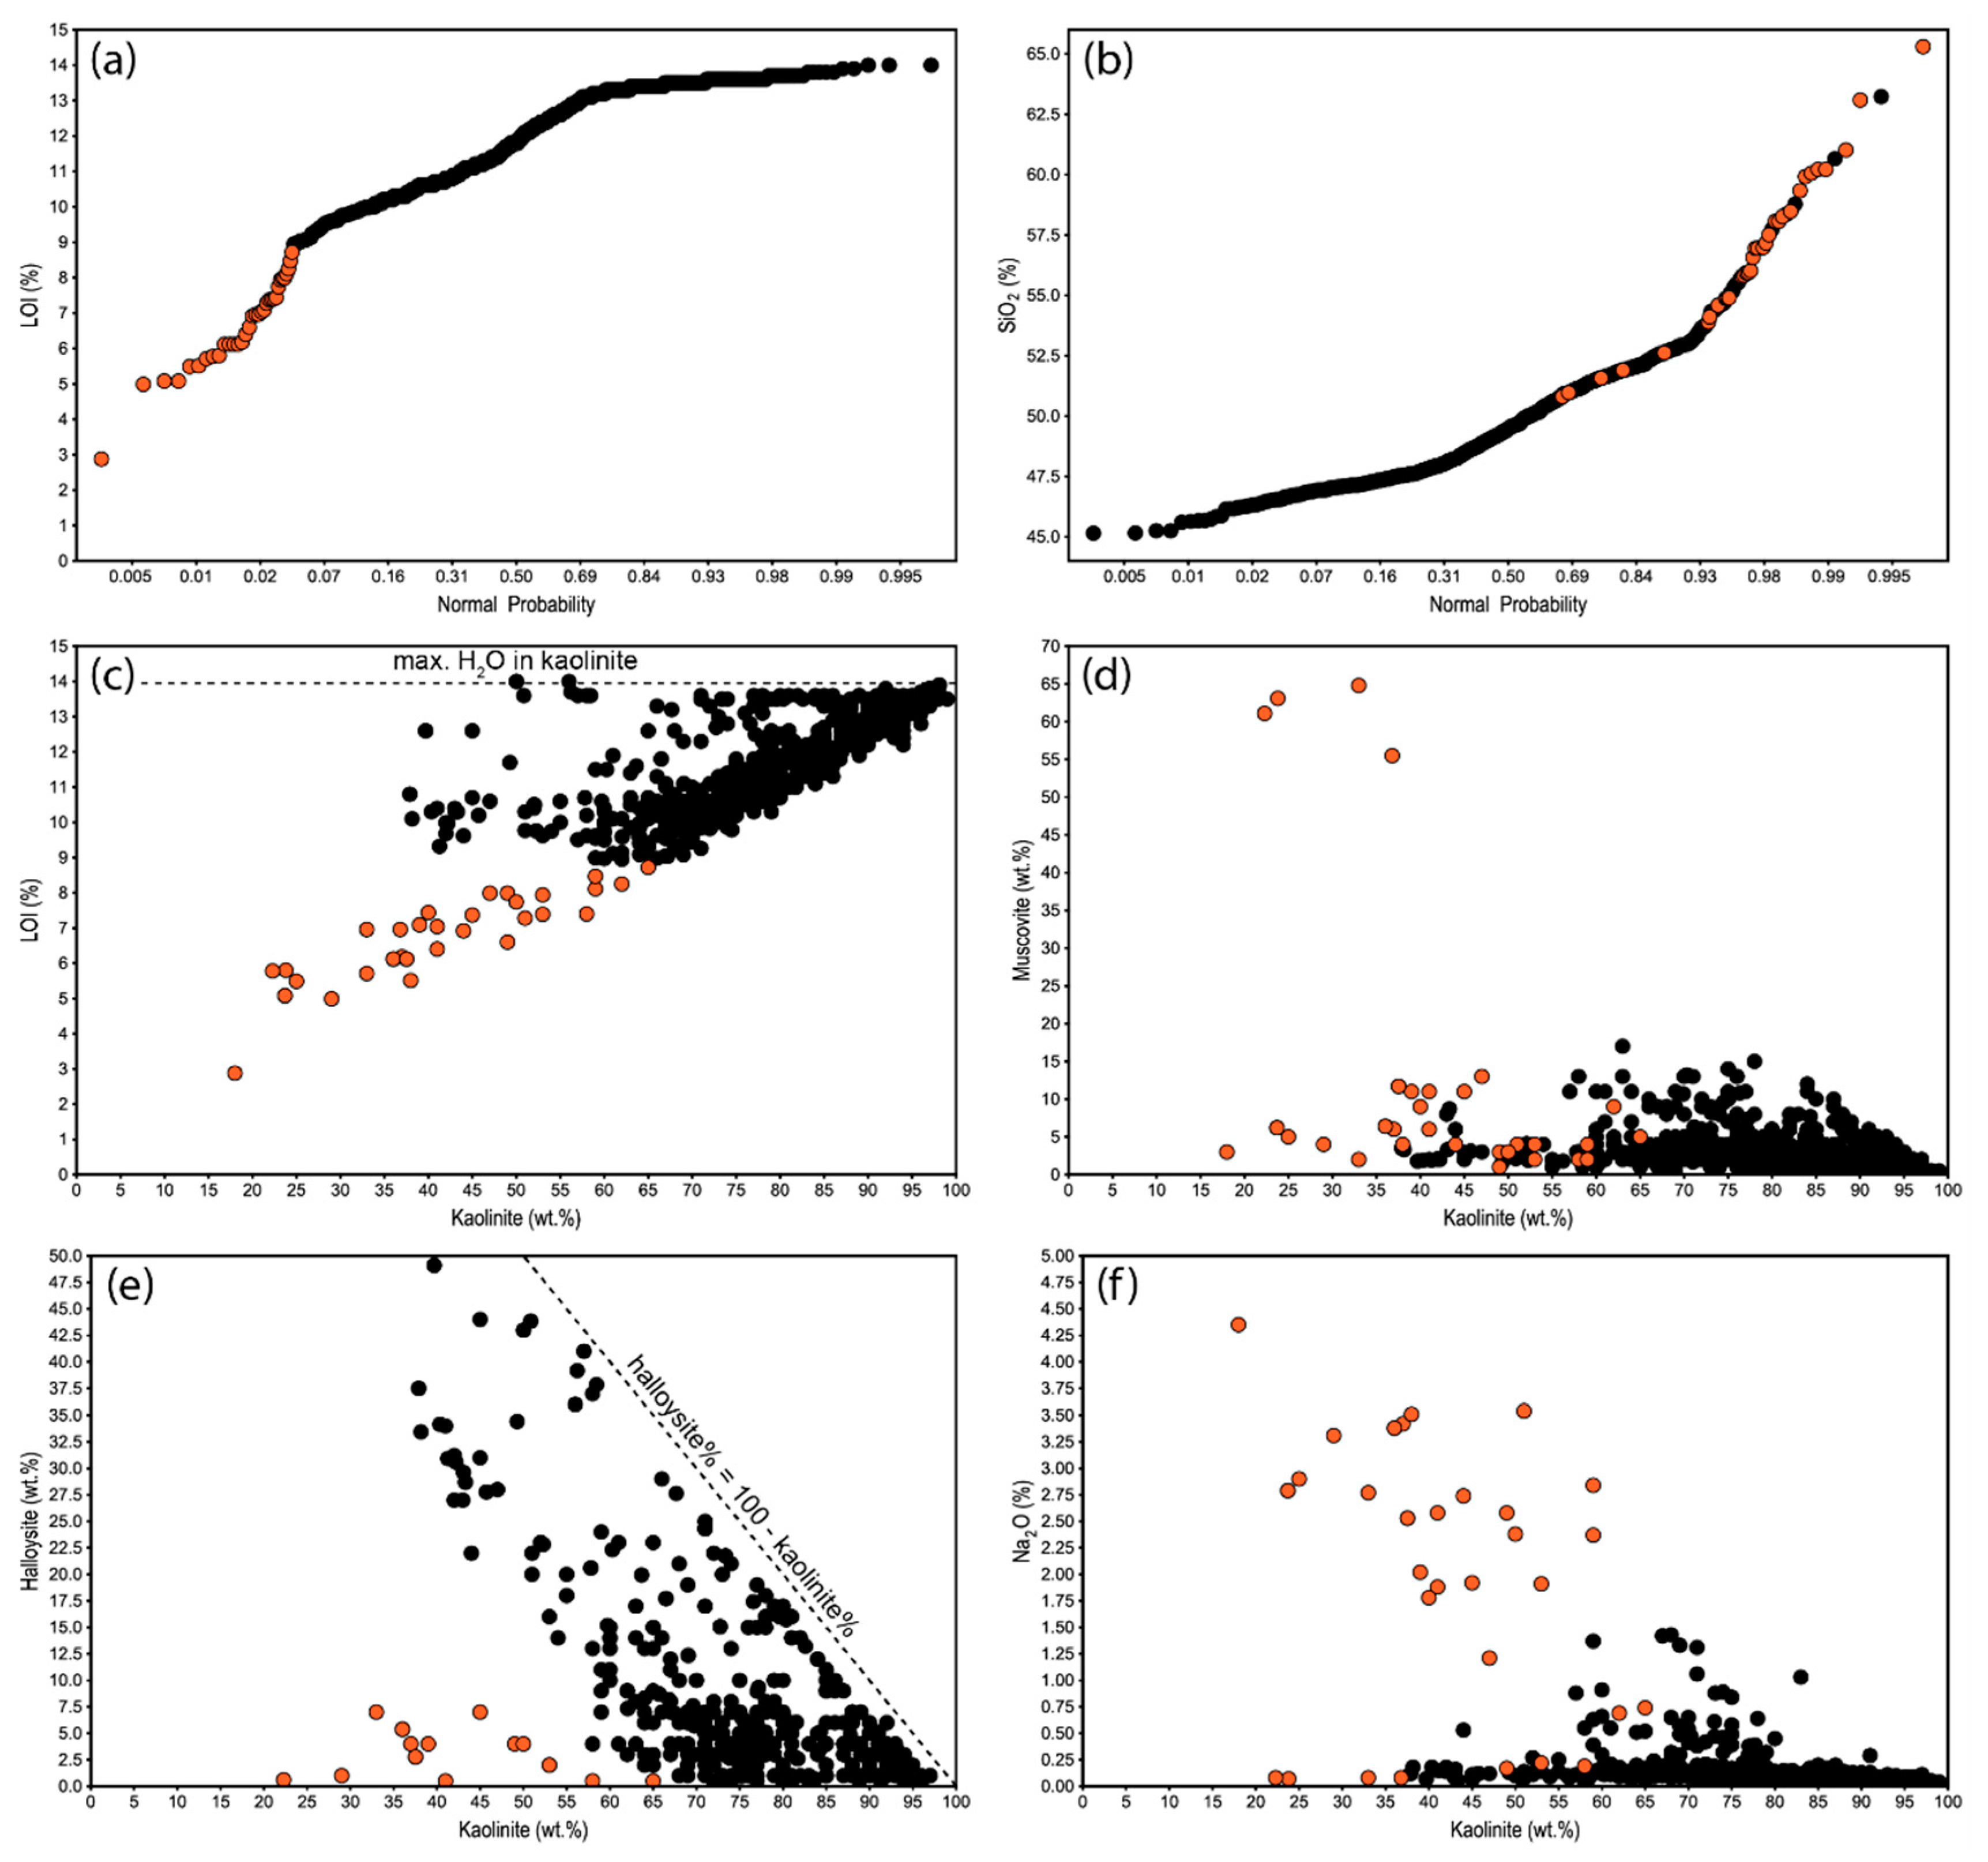
3.2. Mineral and Chemical Relationships
3.3. FTIR Spectra
3.4. Kaolinite Machine-Learnt Model
3.5. Halloysite Machine-Learnt Model
4. Discussion and Implications
Author Contributions
Funding
Data Availability Statement
Acknowledgments
Conflicts of Interest
References
- Theng, B.; Churchman, G.; Whitton, J.; Claridge, G. Comparison of intercalation methods for differentiating halloysite from kaolinite. Clays Clay Miner. 1984, 32, 249–258. [Google Scholar]
- Janik, L.J.; Keeling, J.L. Quantitative Determination of Halloysite Using Ft-Ir Pls Analysis and Its Application to the Characteri-Sation of Kaolins from North-Western Eyre Peninsula, South Australia; Division of Soils Divisional Report; CSIRO Publishing: Canberra, Australia, 1996; p. 129. [Google Scholar]
- Linker, R.; Shmulevich, I.; Kenny, A.; Shaviv, A. Soil identification and chemometrics for direct determination of nitrate in soils using FTIR-ATR mid-infrared spectroscopy. Chemosphere 2005, 61, 652–658. [Google Scholar] [CrossRef] [PubMed]
- Terra, F.S.; Demattê, J.A.; Rossel, R.V. Spectral libraries for quantitative analyses of tropical Brazilian soils: Comparing vis–NIR and mid-IR reflectance data. Geoderma 2015, 255–256, 81–93. [Google Scholar] [CrossRef]
- Recena, R.; Fernández-Cabanás, V.M.; Delgado, A. Soil fertility assessment by Vis-NIR spectroscopy: Predicting soil functioning rather than availability indices. Geoderma 2019, 337, 368–374. [Google Scholar] [CrossRef]
- Xu, X.; Du, C.; Ma, F.; Shen, Y.; Wu, K.; Liang, D.; Zhou, J. Detection of soil organic matter from laser-induced breakdown spectroscopy (LIBS) and mid-infrared spectroscopy (FTIR-ATR) coupled with multivariate techniques. Geoderma 2019, 355, 113905. [Google Scholar] [CrossRef]
- Goydaragh, M.G.; Taghizadeh-Mehrjardi, R.; Golchin, A.; Jafarzadeh, A.A.; Lado, M. Predicting weathering indices in soils using FTIR spectra and random forest models. CATENA 2021, 204, 105437. [Google Scholar] [CrossRef]
- Goydaragh, M.G.; Taghizadeh-Mehrjardi, R.; Jafarzadeh, A.A.; Triantafilis, J.; Lado, M. Using environmental variables and Fourier Transform Infrared Spectroscopy to predict soil organic carbon. CATENA 2021, 202, 105280. [Google Scholar] [CrossRef]
- Barra, I.; Haefele, S.M.; Sakrabani, R.; Kebede, F. Soil Spectroscopy with the Use of Chemometrics, MACHINE learning and Pre-processing Techniques in Soil Diagnosis: Recent advances—A review. Trends Anal. Chem. 2020, 135, 116166. [Google Scholar] [CrossRef]
- Laukamp, C.; Rodger, A.; LeGras, M.; Lampinen, H.; Lau, I.; Pejcic, B.; Stromberg, J.; Francis, N.; Ramanaidou, E. Mineral Physicochemistry Underlying Feature-Based Extraction of Mineral Abundance and Composition from Shortwave, Mid and Thermal Infrared Reflectance Spectra. Minerals 2021, 11, 347. [Google Scholar] [CrossRef]
- Desta, F.; Buxton, M.; Jansen, J. Data Fusion for the Prediction of Elemental Concentrations in Polymetallic Sulphide Ore Using Mid-Wave Infrared and Long-Wave Infrared Reflectance Data. Minerals 2020, 10, 235. [Google Scholar] [CrossRef] [Green Version]
- Rodger, A.; Fabris, A.; Laukamp, C. Feature Extraction and Clustering of Hyperspectral Drill Core Measurements to Assess Potential Lithological and Alteration Boundaries. Minerals 2021, 11, 136. [Google Scholar] [CrossRef]
- Kaufhold, S.; Hein, M.; Dohrmann, R.; Ufer, K. Quantification of the mineralogical composition of clays using FTIR spectroscopy. Vib. Spectrosc. 2012, 59, 29–39. [Google Scholar] [CrossRef]
- Deer, W.; Howie, R.; Zussman, J. An Introduction to the Rock-Forming Minerals, 2nd ed.; Longman Scientific and Technical: Harlow, UK, 1992; p. 696. [Google Scholar]
- Janik, L.J.; Keeling, J. FT-IR Partial Least-Squares Analysis of Tubular Halloysite in Kaolin Samples from the Mount Hope Kaolin Deposit. Clay Miner. 1993, 28, 365–378. [Google Scholar] [CrossRef]
- Haest, M.; Cudahy, T.; Laukamp, C.; Gregory, S. Quantitative Mineralogy from Infrared Spectroscopic Data. II. Three-Dimensional Mineralogical Characterization of the Rocklea Channel Iron Deposit, Western Australia. Econ. Geol. 2012, 107, 229–249. [Google Scholar] [CrossRef]
- Barker, R.D.; Barker, S.L.; Cracknell, M.J.; Stock, E.D.; Holmes, G. Quantitative Mineral Mapping of Drill Core Surfaces II: Long-Wave Infrared Mineral Characterization Using μXRF and Machine Learning. Econ. Geol. 2021, 116, 821–836. [Google Scholar] [CrossRef]
- Chen, T.; Zhang, T.; Li, H. Applications of laser-induced breakdown spectroscopy (LIBS) combined with machine learning in geochemical and environmental resources exploration. TrAC Trends Anal. Chem. 2020, 133, 116113. [Google Scholar] [CrossRef]
- De La Rosa, R.; Khodadadzadeh, M.; Tusa, L.; Kirsch, M.; Gisbert, G.; Tornos, F.; Tolosana-Delgado, R.; Gloaguen, R. Mineral quantification at deposit scale using drill-core hyperspectral data: A case study in the Iberian Pyrite Belt. Ore Geol. Rev. 2021, 139, 104514. [Google Scholar] [CrossRef]
- Cassidy, K.; Champion, D.; Krapez, B.; Barley, M.; Brown, S.; Blewett, R.; Groenewald, P.B.; Tyler, I.M. A Revised Geological Framework for the Yilgarn Craton, Western Australia; Record 2006/8; Geological Survey of Western Australia: East Perth, Australia, 2006.
- Cassidy, K.F.; Champion, D.C.; McNaughton, N.; Fletcher, I.; Whitaker, A.J.; Bastrakova, I.V.; Budd, A. Characterisation and Metallogenic Significance of Archaean Granitoids of the Yilgarn Craton, Western Australia: Results of Research Carried Out as MERlWA Project No. M281 at the Key Centre for Strategic Mineral Deposits, the University of Western Australia and Australian Geological Survey Organisation; Minerals and Energy Research Institute of Western Australia: East Perth, Australia, 2002. [Google Scholar]
- Barley, M.E.; Brown, S.J.A.; Cassidy, K.; Champion, S.J.; Krapez, B. An Integrated Geological and Metallogenic Framework for the Eastern Yilgarn Craton: Developing Geodynamic Models of Highly Mineralised Archaean Granite-Greenstone Terranes; AMIRA Project; Australian Minerals Industry Research Association: East Perth, Australia, 2003; p. 624. [Google Scholar]
- Griffin, W.; Belousova, E.; Shee, S.; Pearson, N.; O’Reilly, S.Y. Archean crustal evolution in the northern Yilgarn Craton: U–Pb and Hf-isotope evidence from detrital zircons. Precambrian Res. 2004, 131, 231–282. [Google Scholar] [CrossRef]
- Jones, P.; Trendall, A. Southern Cross 1:250 000 Geological Series Map, Sheet SH 50-16; Geological Survey of Western Australia: East Perth, Australia, 1981.
- Kretzschmar, R.; Robarge, W.; Amoozegar, A.; Vepraskas, M. Biotite alteration to halloysite and kaolinite in soil-saprolite profiles developed from mica schist and granite gneiss. Geoderma 1997, 75, 155–170. [Google Scholar] [CrossRef]
- Murray, H.H. Kaolin minerals: Their genesis and occurrences; Chapter 4. In Hydrous Phyllosilicates; De Gruyter: Boston, MA, USA, 1988; pp. 67–90. [Google Scholar] [CrossRef]
- Abeysinghe, P.; Fetherston, J.M. Kaolin in Western Australia; Geological Survey of Western Australia: East Perth, Australia, 1999.
- Churchman, G.; Carr, R. The definition and nomenclature of halloysites. Clays Clay Miner. 1975, 23, 382–388. [Google Scholar] [CrossRef]
- Hillier, S.; Ryan, P. Identification of halloysite (7 Å) by ethylene glycol solvation: The ‘MacEwan effect’. Clay Miner. 2002, 37, 487–496. [Google Scholar] [CrossRef]
- Drits, V.A.; Sakharov, B.A.; Hillier, S. Phase and structural features of tubular halloysite (7 Å). Clay Miner. 2018, 53, 691–720. [Google Scholar] [CrossRef] [Green Version]
- Hillier, S.; Drummond-Brydson, R.; Delbos, E.; Fraser, T.; Gray, N.; Pendlowski, H.; Phillips, I.; Robertson, J.; Wilson, I. Correlations among the mineralogical and physical properties of halloysite nanotubes (HNTs). Clay Miner. 2016, 51, 325–350. [Google Scholar] [CrossRef]
- Yuan, J. Clay Mineralogy and Its Influence on Industrial Uses of Some Kaolin Clay Deposits from South China and Eastern Washington-Idaho, United States of America. Ph.D. Thesis, Indiana University, Bloomington, IN, USA, 1994. [Google Scholar]
- Churchman, G.J.; Pasbakhsh, P.; Lowe, D.; Theng, B. Unique but diverse: Some observations on the formation, structure and morphology of halloysite. Clay Miner. 2016, 51, 395–416. [Google Scholar] [CrossRef]
- Stoch, L.; Sikora, W. Transformations of micas in the process of kaolinitization of granites and gneisses. Clays Clay Miner. 1976, 24, 156–162. [Google Scholar] [CrossRef]
- Singh, B.; Gilkes, R. Weathering of a chromian muscovite to kaolinite. Clays Clay Miner. 1991, 39, 571–579. [Google Scholar] [CrossRef]
- Nagasawa, K.; Noro, H. Mineralogical properties of halloysites of weathering origin. Chem. Geol. 1987, 60, 145–149. [Google Scholar] [CrossRef]
- Noro, H. Hexagonal platy halloysite in an altered tuff bed, Komaki City, Aichi Prefecture, Central Japan. Clay Miner. 1986, 21, 401–415. [Google Scholar] [CrossRef]
- Wada, S.-I.; Mizota, C. Iron-rich halloysite (10A) with crumpled lamellar morphology from Hokkaido, Japan. Clays Clay Miner. 1982, 30, 315–317. [Google Scholar] [CrossRef]
- Hillier, S. Use of an air brush to spray dry samples for X-ray powder diffraction. Clay Miner. 1999, 34, 127–135. [Google Scholar] [CrossRef]
- South African Pulp and Paper Industries. Understanding Paper Brightness. 2017. Available online: https://cdn-s3.sappi.com/s3fs-public/sappietc/Understanding%20Paper%20Brightness.pdf (accessed on 18 August 2021).
- Technical Association of the Pulp and Paper Industry. Brightness of Clay and Other Mineral Pigments (d/0 Diffuse); TAPPI Press: Atlanta, GA, USA, 2003; p. 9. [Google Scholar]
- Kokaly, R.; Clark, R.; Swayze, G.; Livo, K.; Hoefen, T.; Pearson, N.; Wise, R.A.; Benzel, W.M.; Lowers, H.A.; Driscoll, R.L.; et al. USGS Spectral Library Version 7; US Geological Survey data release; United States Geological Survey (USGS): Reston, VA, USA, 2017.
- Bowitz, J.; Ehling, A. Non-destructive infrared analyses: A method for provenance analyses of sandstones. Environ. Earth Sci. 2008, 56, 623–630. [Google Scholar] [CrossRef]

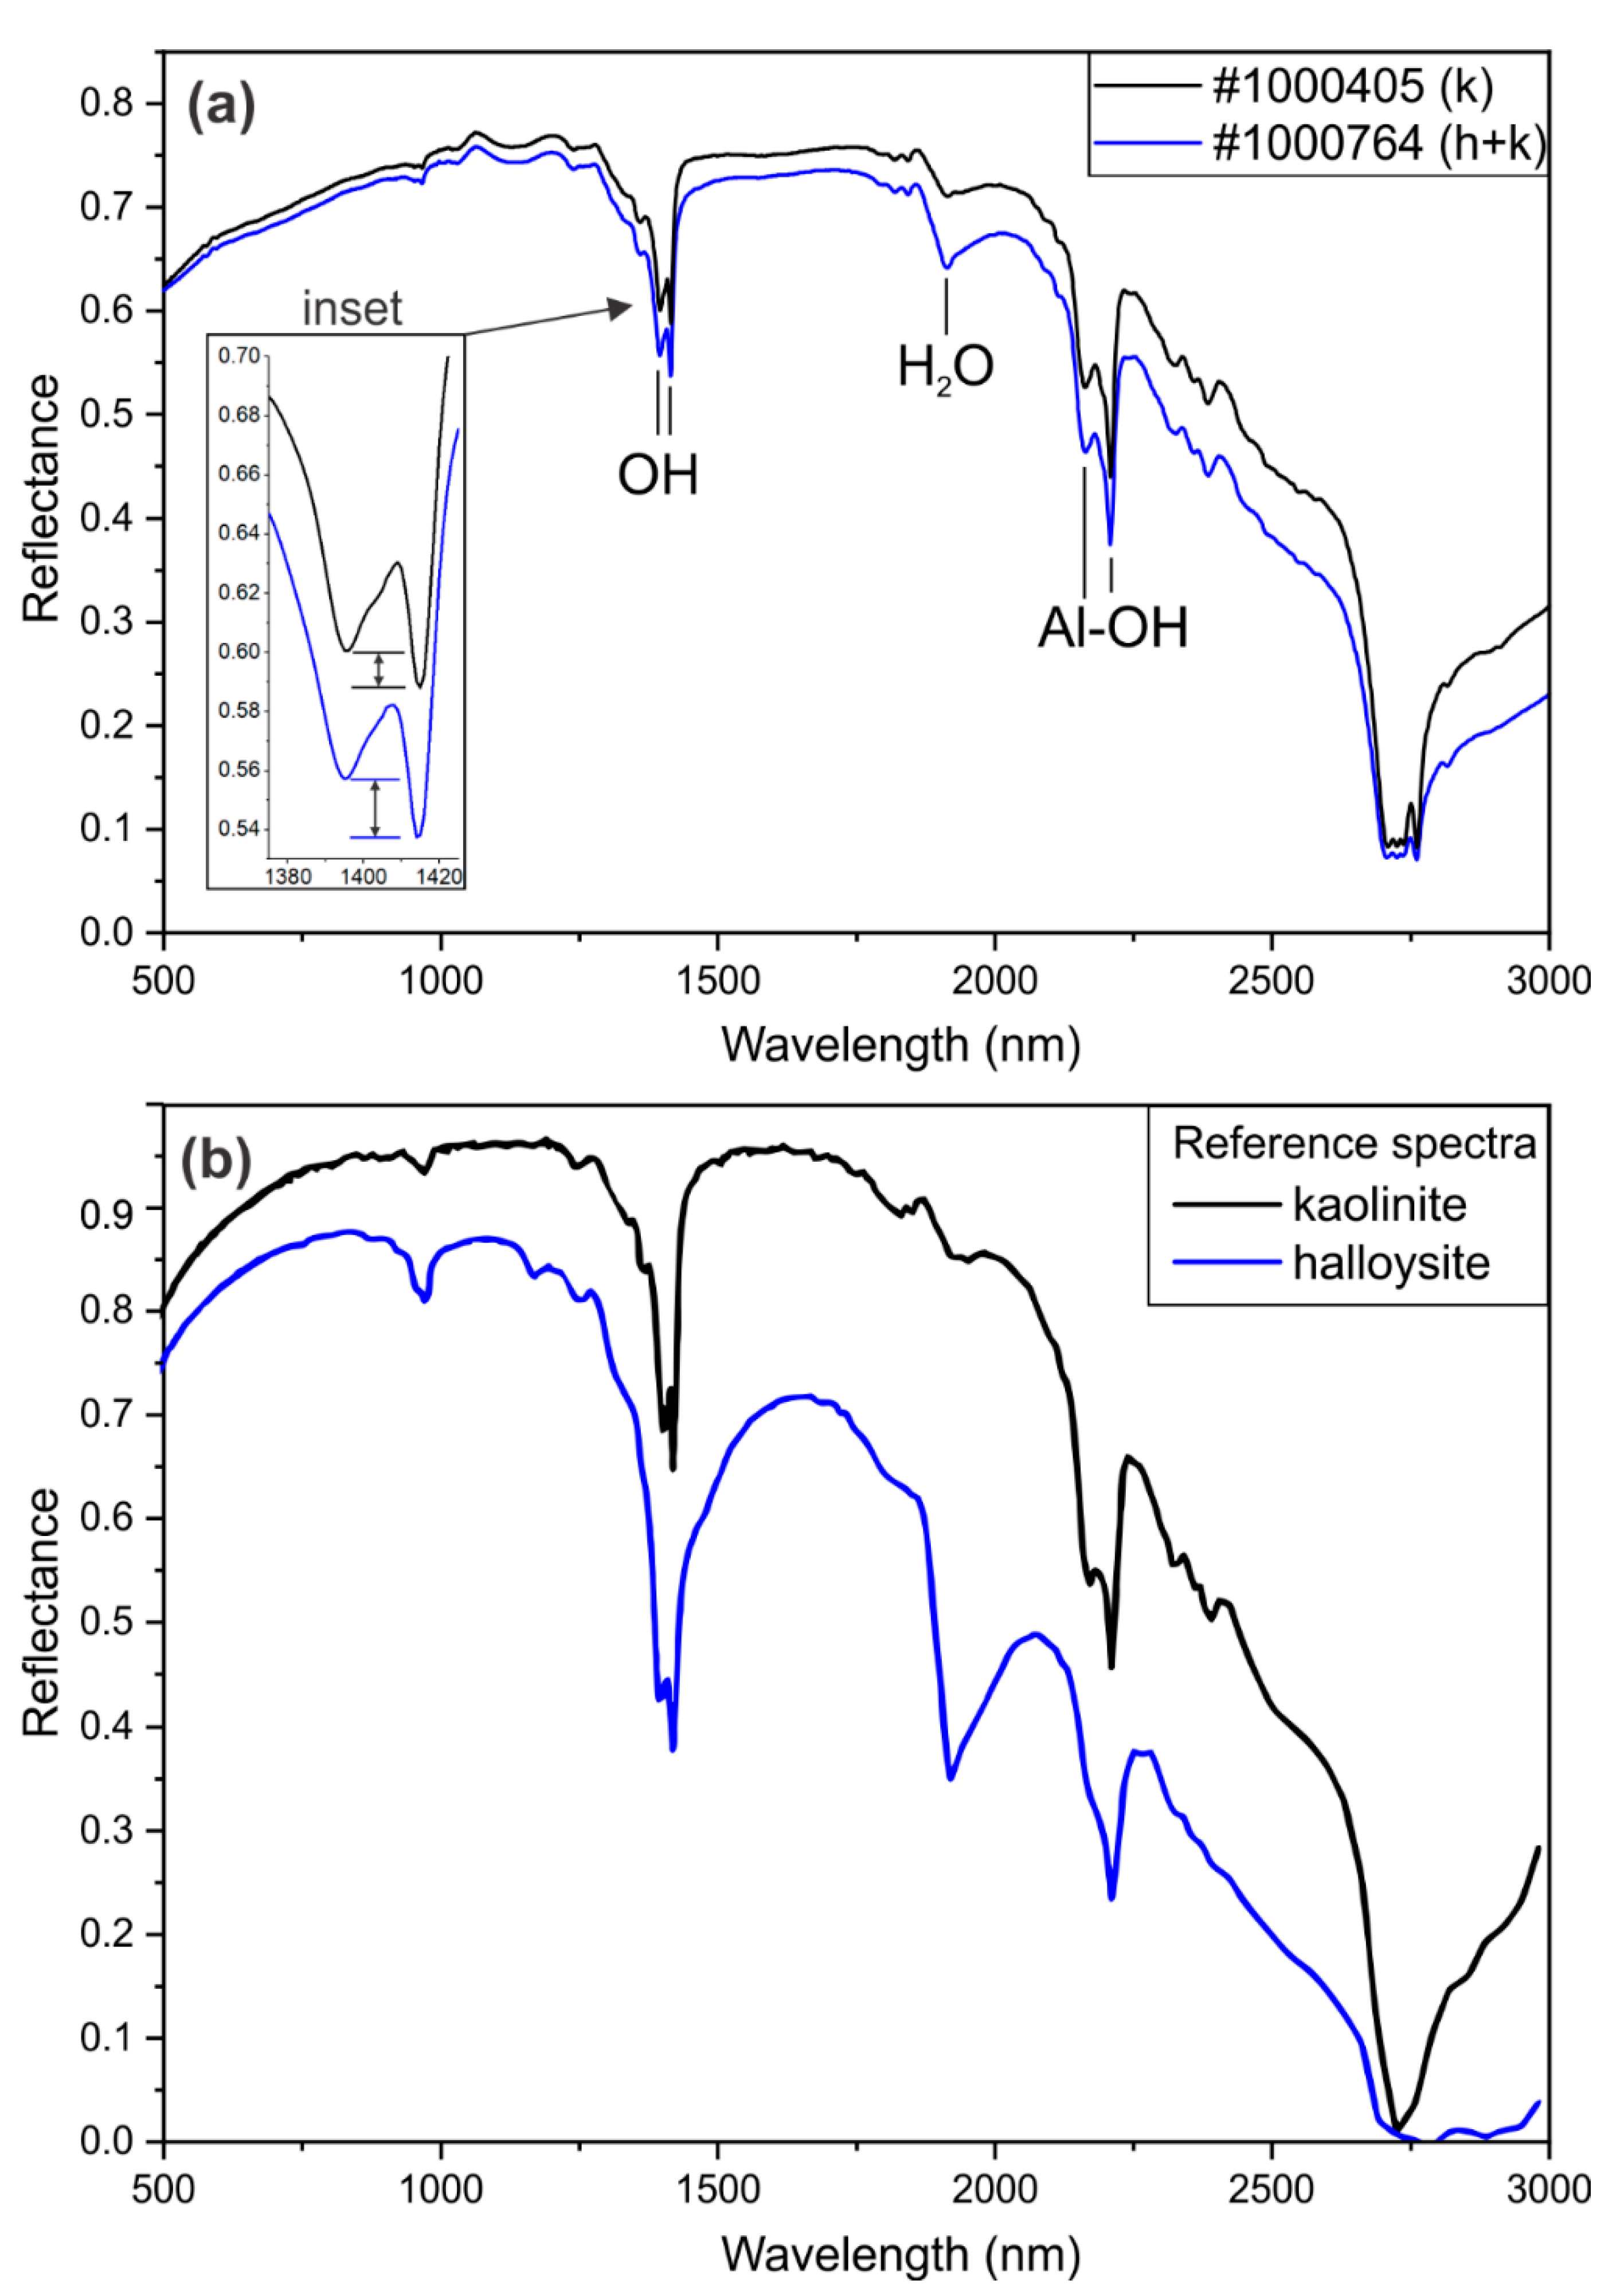

| Sample | Mineralogy | OH-Doublet (nm) | H2O (nm) | Al-OH-Doublet (nm) | ||
|---|---|---|---|---|---|---|
| 1000681 | k | 1395 | 1415 | 1915 | 2163 | 2208 |
| 1000405 | k | 1395 | 1415 | 1914 | 2163 | 2208 |
| 1000679 | k | 1395 | 1415 | 1915 | 2162 | 2208 |
| 1000601 | k + h | 1395 | 1414 | 1913 | 2163 | 2208 |
| 1000735 | k + h | 1395 | 1414 | 1912 | 2163 | 2208 |
| 1000764 | k + h | 1395 | 1414 | 1912 | 2162 | 2208 |
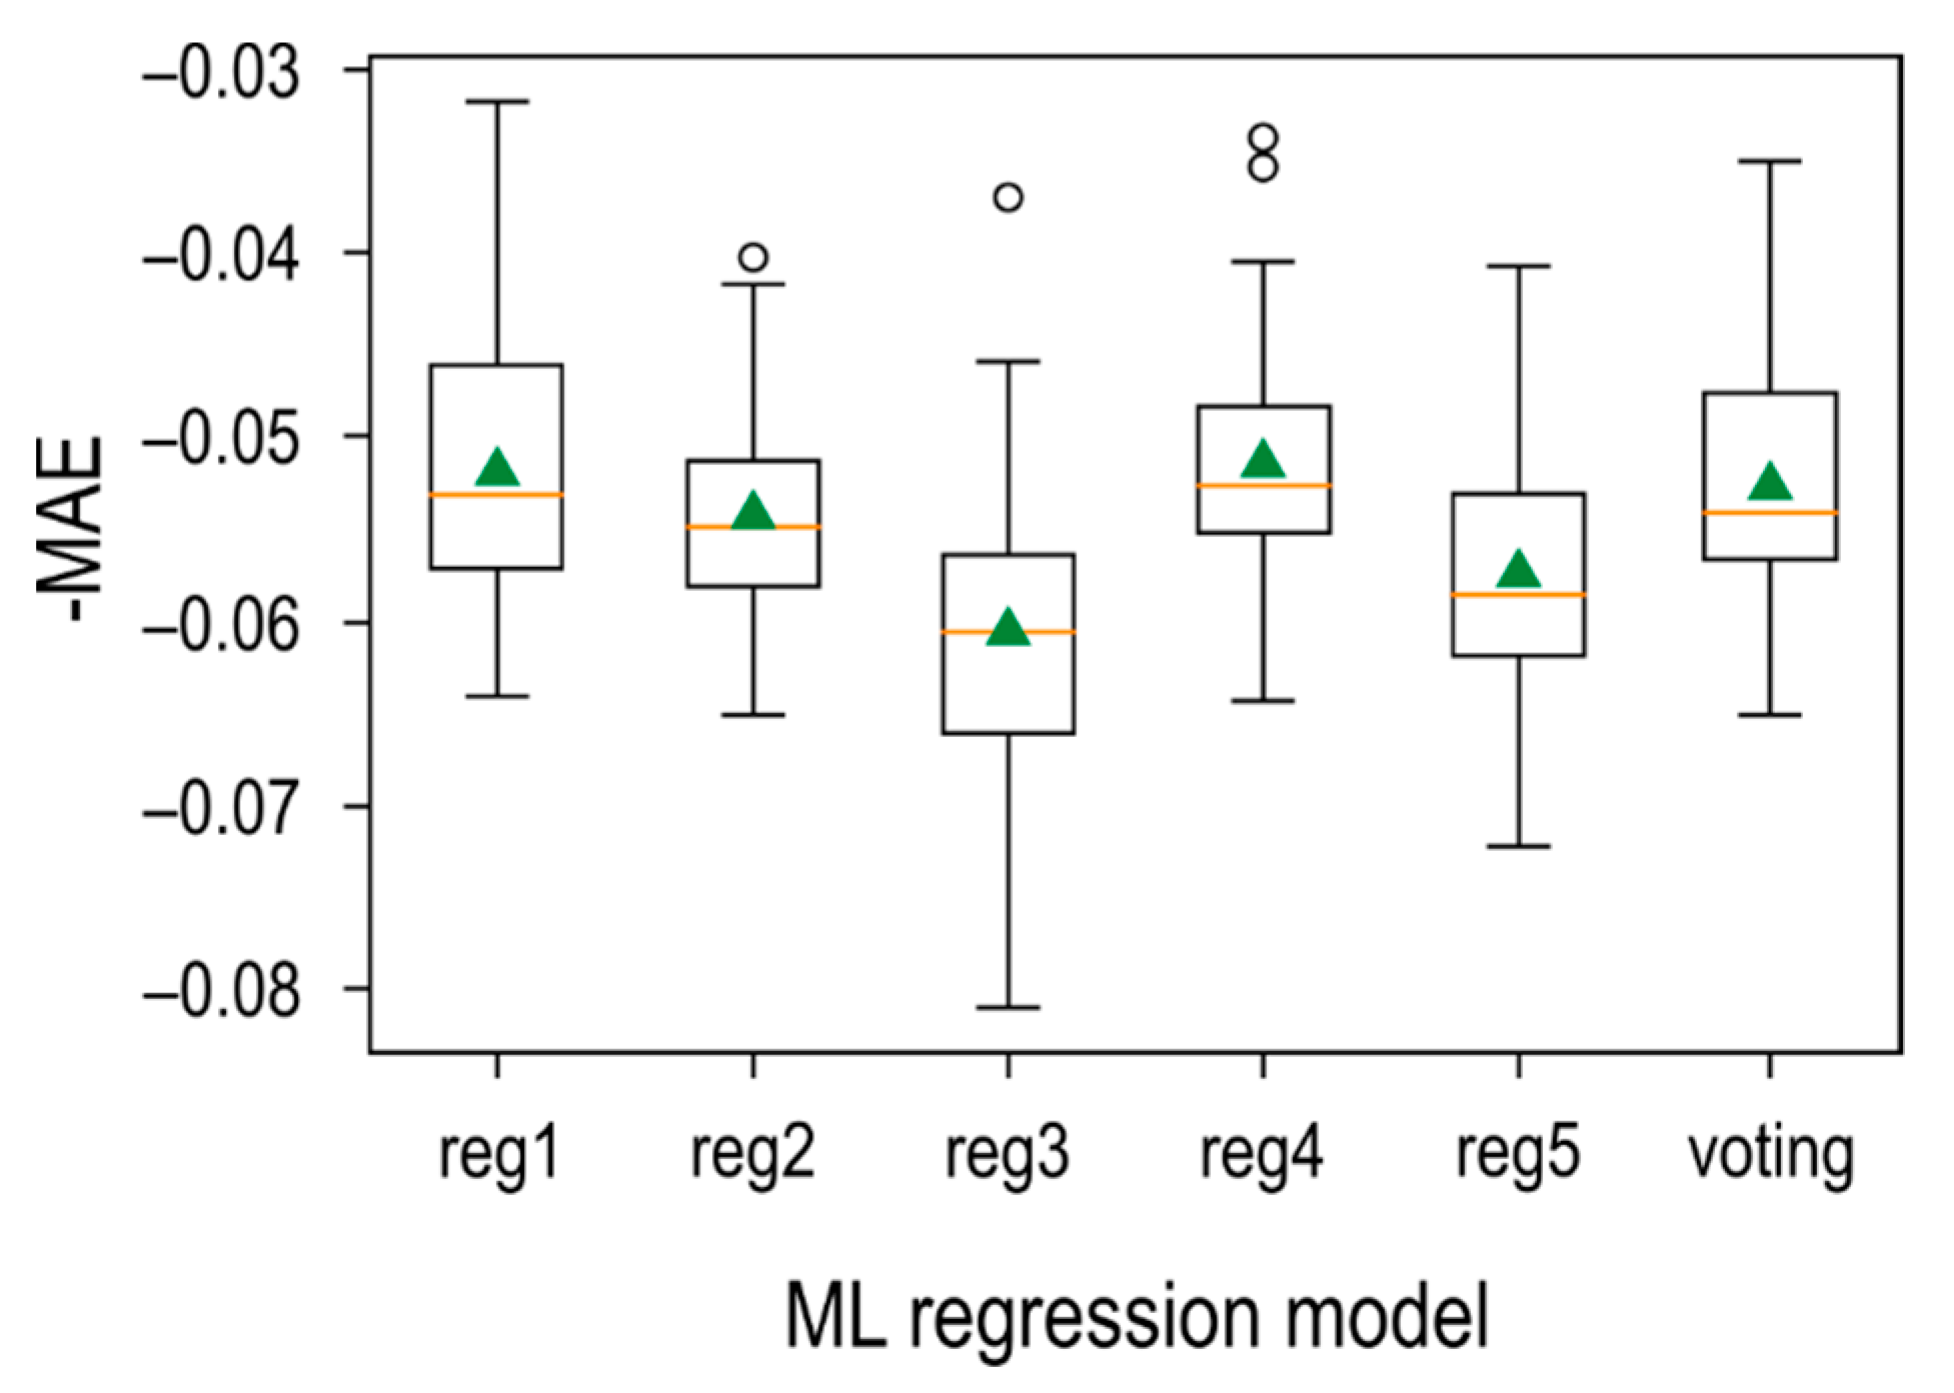
| Model | R2 | MAE | Description of Models |
|---|---|---|---|
| ML ensemble | 0.97 | −0.052 | Ensemble ML: create multiple models and then combine them to produce improved results. |
| RLS | 0.85 | −0.076 | ML to derive most important features followed by robust least squares |
| EN | 0.65 | −0.081 | ML to derive most important features followed by elastic net regularisation |
| Lasso | 0.65 | −0.082 | ML to derive most important features followed by lasso regression regularisation |
| RR | 0.64 | −0.082 | ML to derive most important features followed by ridge regression regularisation |
| OLS | 0.65 | −0.082 | ML to derive most important features followed by ordinary least squares |
| EN PCA 5 | 0.47 | −0.104 | Principal component analysis on all features followed by elastic net regularisation |
Publisher’s Note: MDPI stays neutral with regard to jurisdictional claims in published maps and institutional affiliations. |
© 2021 by the authors. Licensee MDPI, Basel, Switzerland. This article is an open access article distributed under the terms and conditions of the Creative Commons Attribution (CC BY) license (https://creativecommons.org/licenses/by/4.0/).
Share and Cite
Du Plessis, P.I.; Gazley, M.F.; Tay, S.L.; Trunfull, E.F.; Knorsch, M.; Branch, T.; Fourie, L.F. Quantification of Kaolinite and Halloysite Using Machine Learning from FTIR, XRF, and Brightness Data. Minerals 2021, 11, 1350. https://doi.org/10.3390/min11121350
Du Plessis PI, Gazley MF, Tay SL, Trunfull EF, Knorsch M, Branch T, Fourie LF. Quantification of Kaolinite and Halloysite Using Machine Learning from FTIR, XRF, and Brightness Data. Minerals. 2021; 11(12):1350. https://doi.org/10.3390/min11121350
Chicago/Turabian StyleDu Plessis, Pieter I., Michael F. Gazley, Stephanie L. Tay, Eliza F. Trunfull, Manuel Knorsch, Thomas Branch, and Louis F. Fourie. 2021. "Quantification of Kaolinite and Halloysite Using Machine Learning from FTIR, XRF, and Brightness Data" Minerals 11, no. 12: 1350. https://doi.org/10.3390/min11121350
APA StyleDu Plessis, P. I., Gazley, M. F., Tay, S. L., Trunfull, E. F., Knorsch, M., Branch, T., & Fourie, L. F. (2021). Quantification of Kaolinite and Halloysite Using Machine Learning from FTIR, XRF, and Brightness Data. Minerals, 11(12), 1350. https://doi.org/10.3390/min11121350


