1. Introduction
In recent decades, open stoping methods of underground mining have become widespread and are used in a variety of mining operations. Nevertheless, besides their ease of use and efficiency in operation, external dilution is a major issue to consider. In this manner, the estimations of the stability conditions, overbreaks and spalling failures that could inflict potential external dilution are required to ensure the optimal design of the exploitation. Efforts were made using empirical models and nomograms and relevant methodologies were proposed, so as to provide principal design guidelines, which were mainly qualitative. On the other hand, numerical models, although complicated and time-consuming, can be used to depict failure conditions and yielding areas.
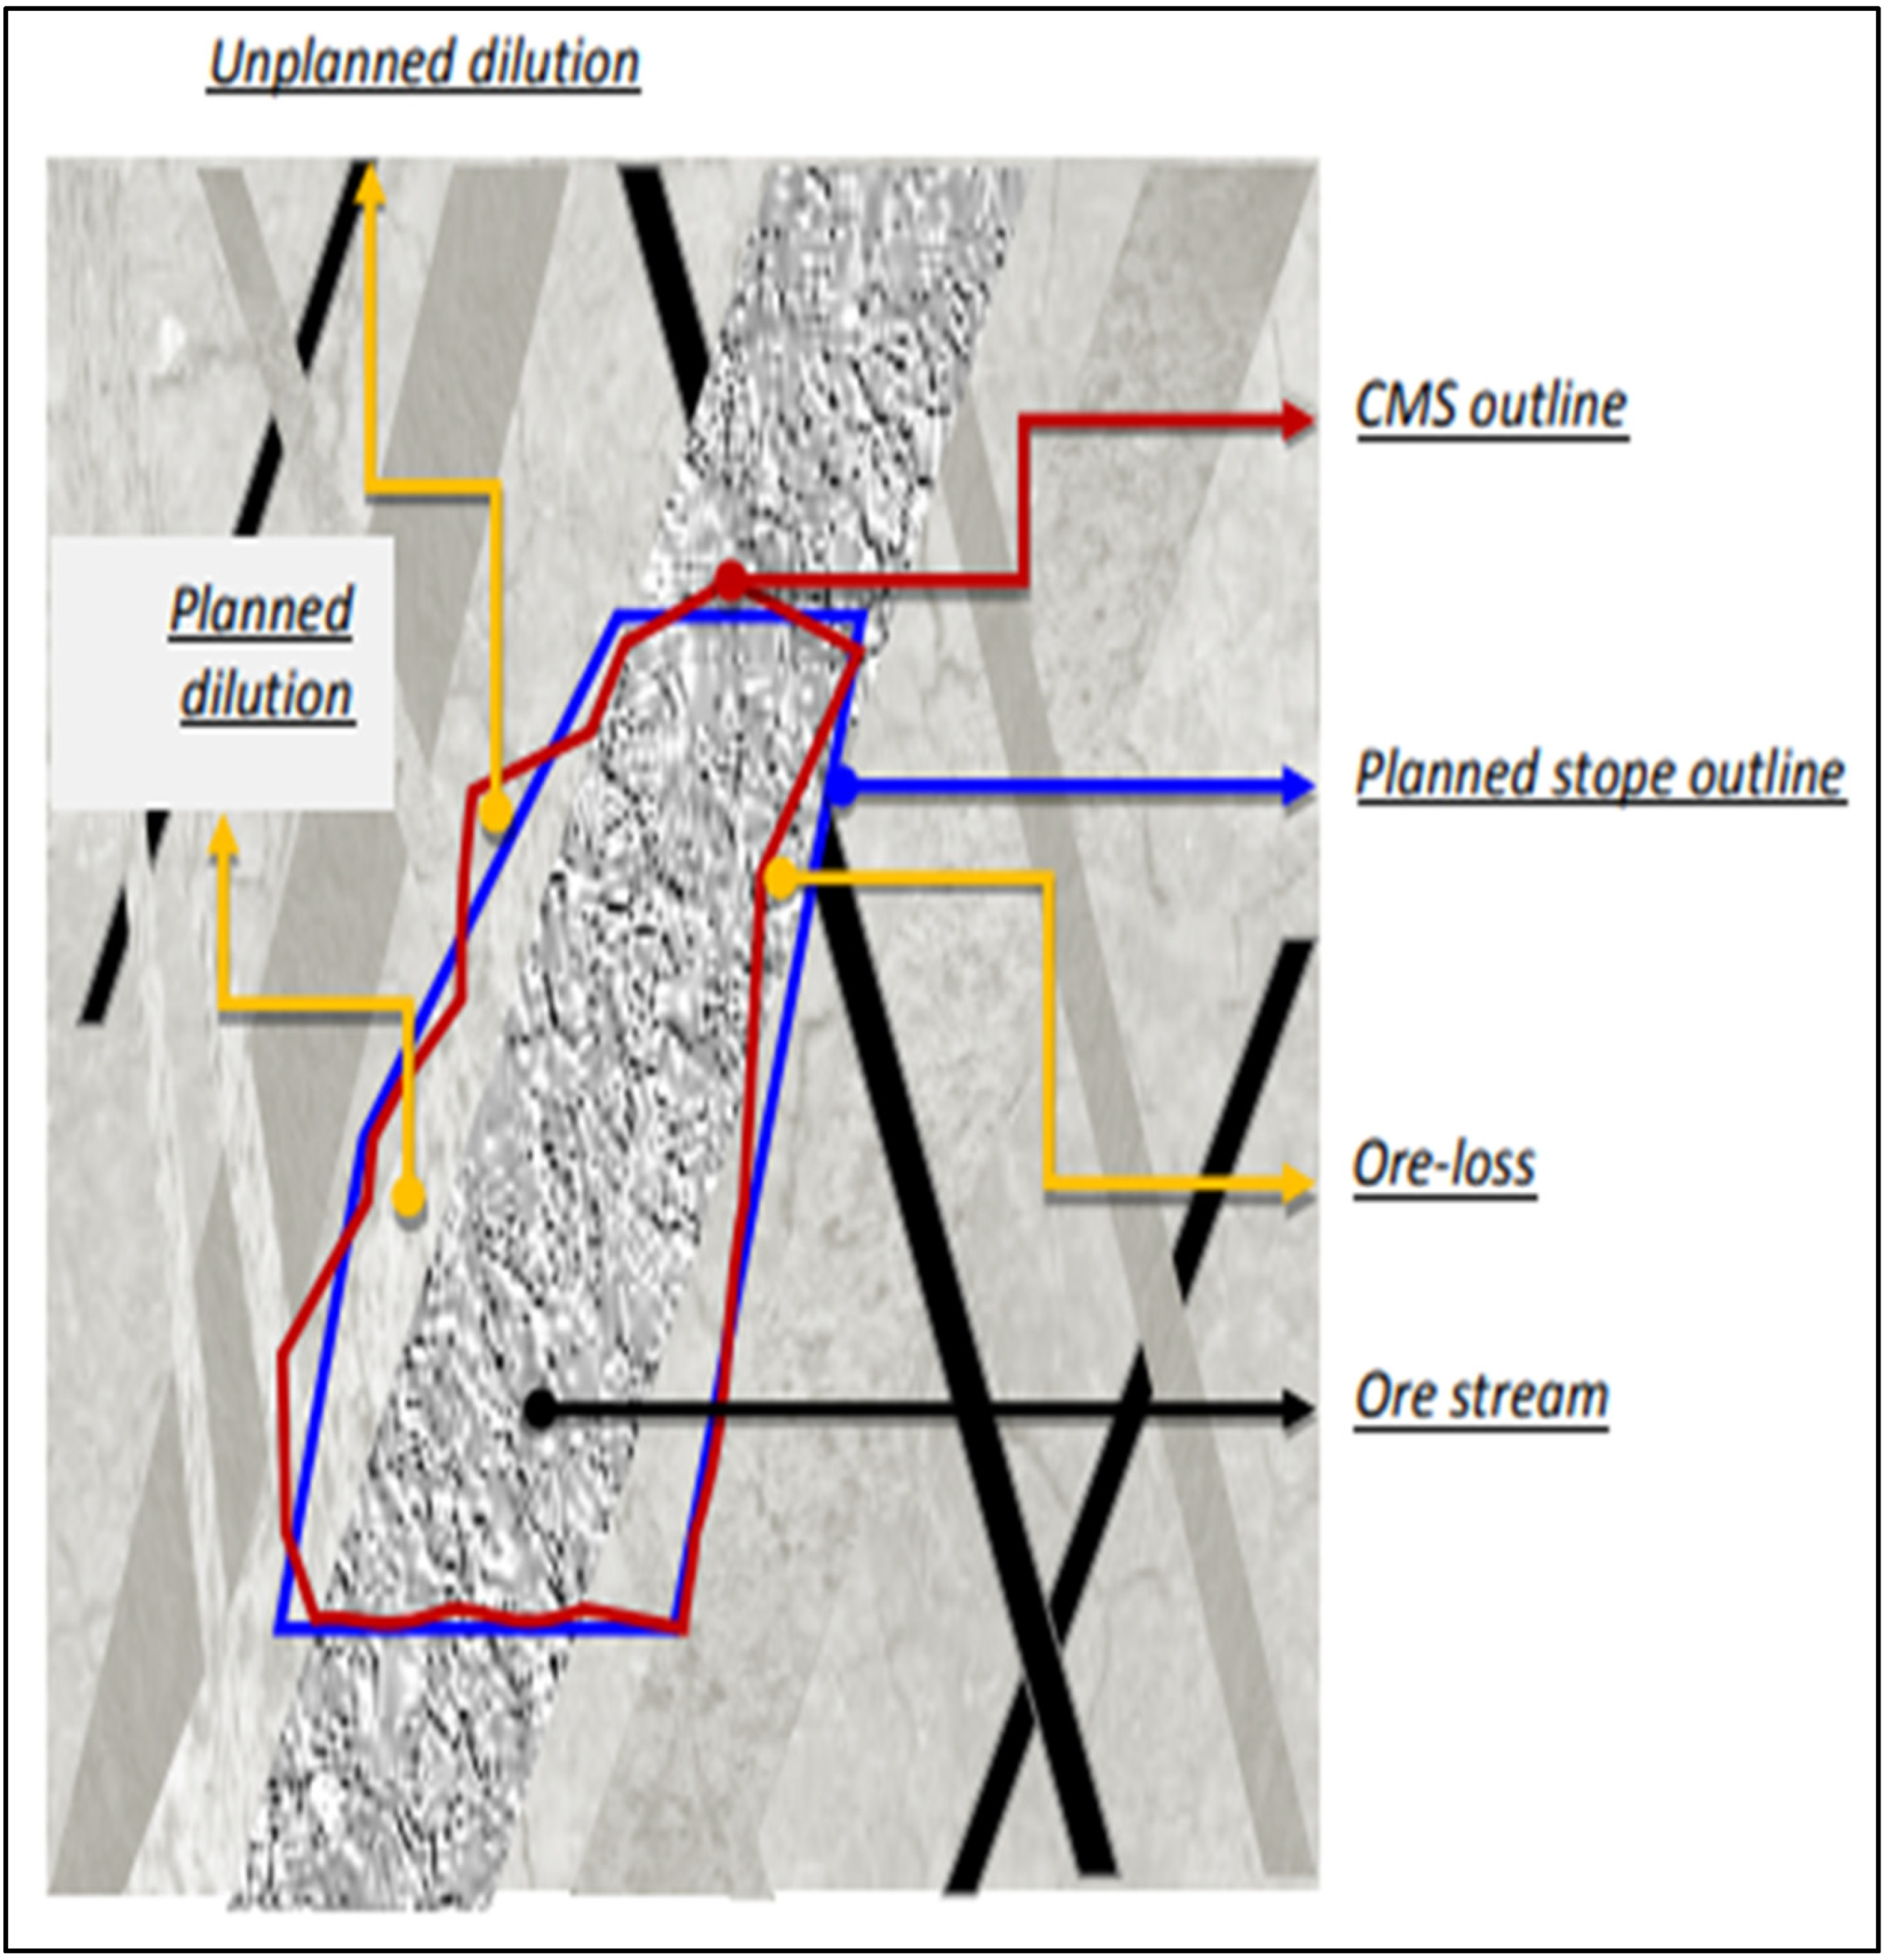
Ore dilution refers to the waste material (sterile material or material with small amounts of useful content) that is not separated from the ore [
1]. Hence, it mixes and interferes with the ore, increasing the mined tonnage that requires handling while decreasing its grade. Ore dilution can be divided into internal dilution, external dilution and ore loss (
Figure 1). External dilution in underground open-stoping exploitations is a matter of paramount importance for the proper operation and cost-effectiveness of the mining process.
Dilution can be defined as the ratio of the tonnage of waste mined and sent to the mill to the total tonnage. Several mathematical definitions have been formulated over time to define and to explicitly calculate the dilution rate, as given by Pakalnis [
2]:
Figure 1.
Ore dilution categorization by Jang [
3].
Figure 1.
Ore dilution categorization by Jang [
3].
Various factors contribute to the occurrence of external (or secondary) dilution and ore loss. A general basic categorization of these factors, according to Jang [
3], is given below:
According to Planeta and Bourgoin [
4], increasing the dilution rate by about 13% could reduce the total revenue by 15% and could even reduce the total gross profit by 60%, as well. Furthermore, the effect of the same amount of sterile intermediate material on the final cost of the extraction process decreases as the width of the ore increases, as pointed out by Stewart and Trueman [
5] through their analysis.
One of the issues to consider for the management and control of external dilution is the proper design of the exploitation in terms of stability. The failures and overbreaks associated with poor stability conditions not only pose a threat to the overall safety of the workers and the mine but contribute, to a great extent, to the presence of waste inclusions within the mined ore.
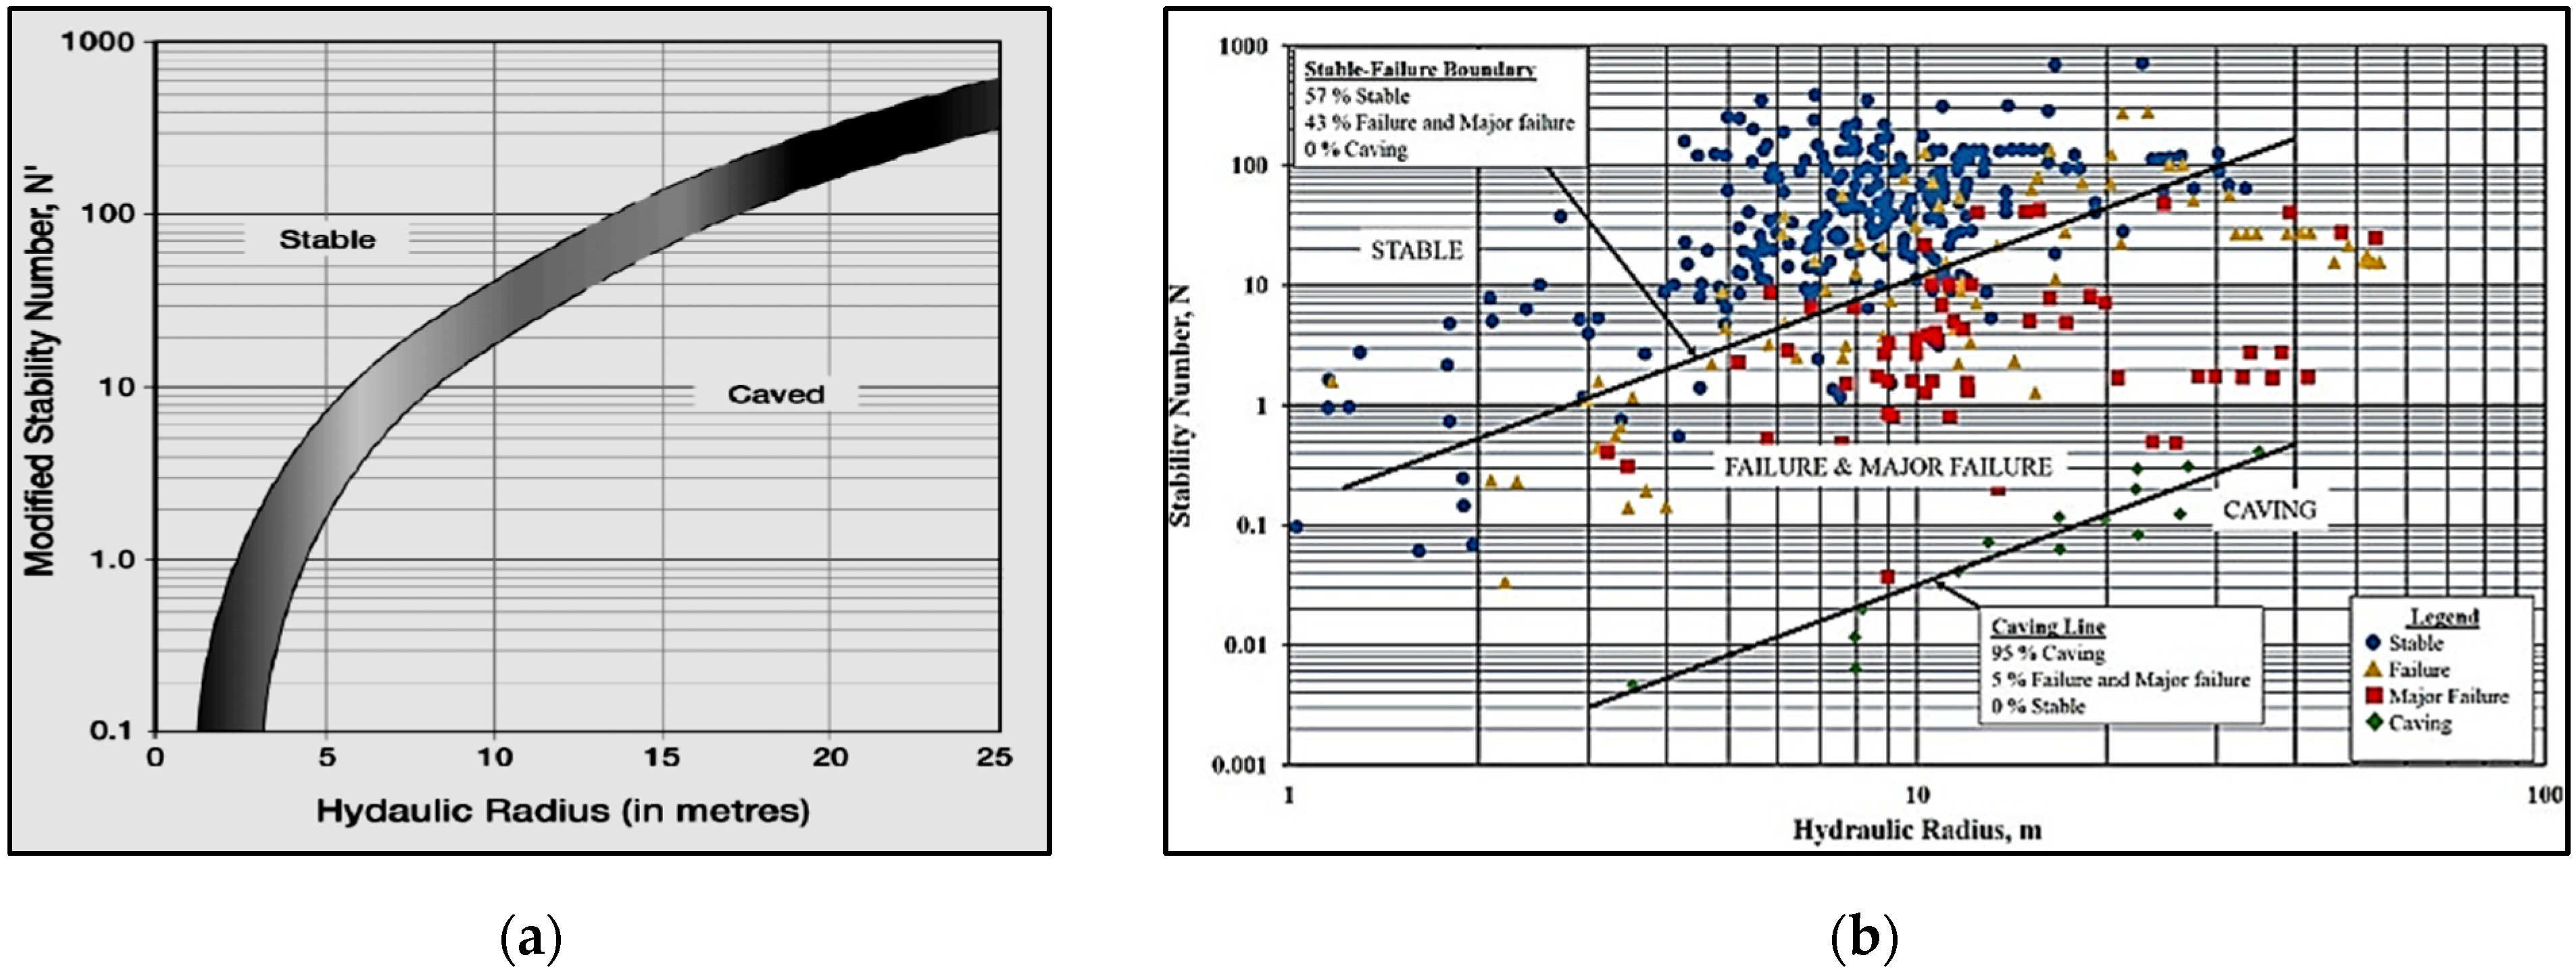
One of the traditional tools that has been developed to control such issues is the empirical stability graph, as introduced by various researchers (e.g., Suorineni [
6]). Empirical stability graphs have proved to be very useful for the early assessment of an open stope’s stability condition. The determination of the ore’s external dilution rates is made possible through modifications that were made by focusing on the phenomenon. Such estimates regarding the theoretical quantification of an overbreak are an important step to the optimal design of an ore exploitation that can be readily available from the initial design stages of a project.
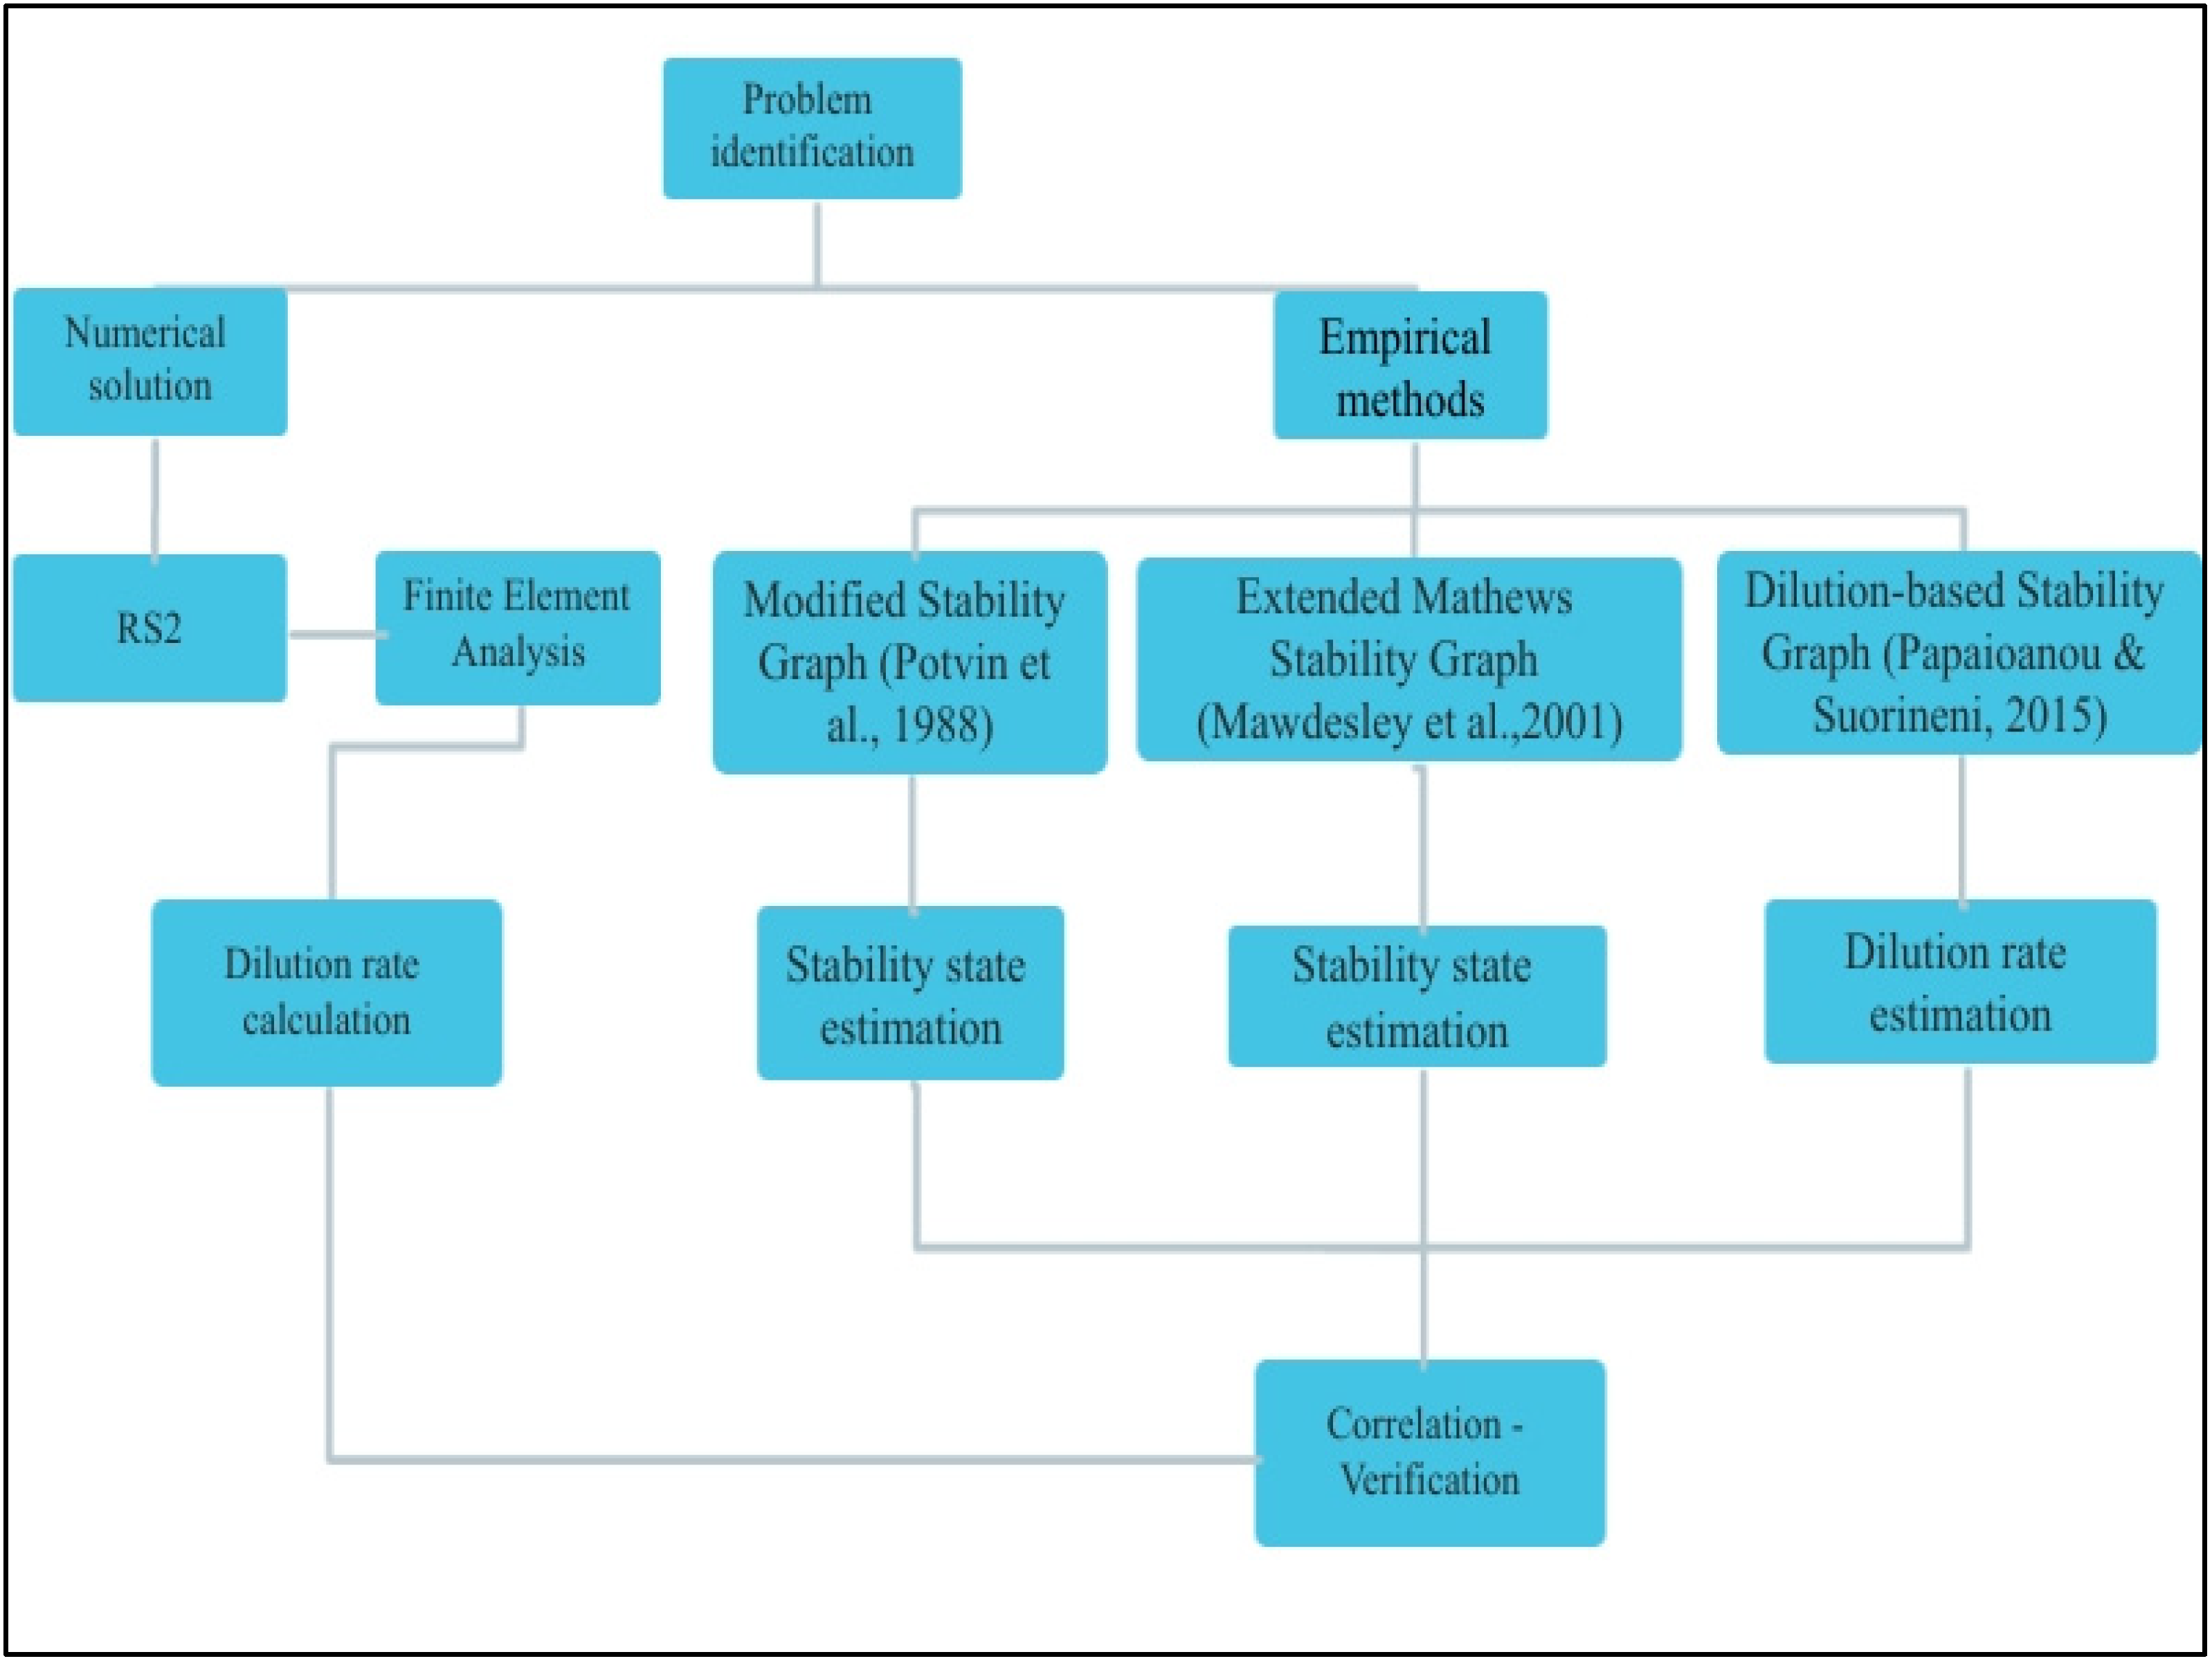
The present research has two basic aims. The first purpose is obtaining the correlation between the empirical theoretical methods for the estimation of an open stope’s stability performance with the dilution characteristics arising from the finite element analysis models. The second scope of the research is the creation of easy-to-use mathematical tools for the preliminary calculation of an open stope’s dilution rate. These approaches are exported through the research data processing and are empirical. Empirical tools provide the opportunity to receive an immediate and reliable performance assessment of stopes’ different design parameter sets. Every empirical formula or chart is validated for a specific range of parameter values.
Typical stability graphs consist of two coefficients, related to the overall rock mass conditions and the extent of the mine opening. These factors are the stability number, N (or its modified type N′), and the hydraulic radius, HR. The stability number is calculated by:
where A, B and C are defined as the stress factor, the adjustment orientation factor and the gravity factor, respectively, while Q′ is the modified rock mass quality index by Barton et al. [
7] in which J
w and SRF are both equal to 1. The difference between the N and the N′ coefficients lies in the choice of the set of the empirical nomograms for the determination of the values of the parameters A, B and C.
A number of researchers have contributed to the development of the stability graph nomograms that assess whether the selected mining stope will remain stable or if it will experience failures. Starting from Mathews et al. [
8], who first introduced them and Nickson [
9], one of the most notable and widely used stability graph nomograms was developed by Potvin [
10] (
Figure 2a). Such developments were continued by various other researchers, enriched by new datasets such as the datasets by Mawdesley et al. [
11] (
Figure 2b) and Papaioanou and Suorineni [
12] (
Figure 2c), that used the nomograms to further investigate other properties in the open stope exploitation.
Each newly modified form of the original idea of the diagram was intended to address some of the weaknesses of this basic approach.
Table 1 presents the most prevalent stability graph modifications that were observed in recent decades, according to Suorineni [
13]. Special mention should be made of the works of Le Roux and Stacey [
14] and Papaioannou and Suorineni [
12]. More specifically, by following similar methodologies, they provided mathematical equations for the estimation of the ore’s external dilution rate, which focus on each of the examined open stopes’ surfaces, creating a very promising dilution-based stability graph approach.
Besides the above empirical design approaches, lately, the use of numerical codes has made possible the quick and reliable assessment of the stability conditions in underground excavations. As such, the estimation of an overbreak located in a stope’s hanging wall (HW), foot wall (FW) or crown area can be estimated. Consequently, the external dilution rate can be estimated, to an extent, as well.
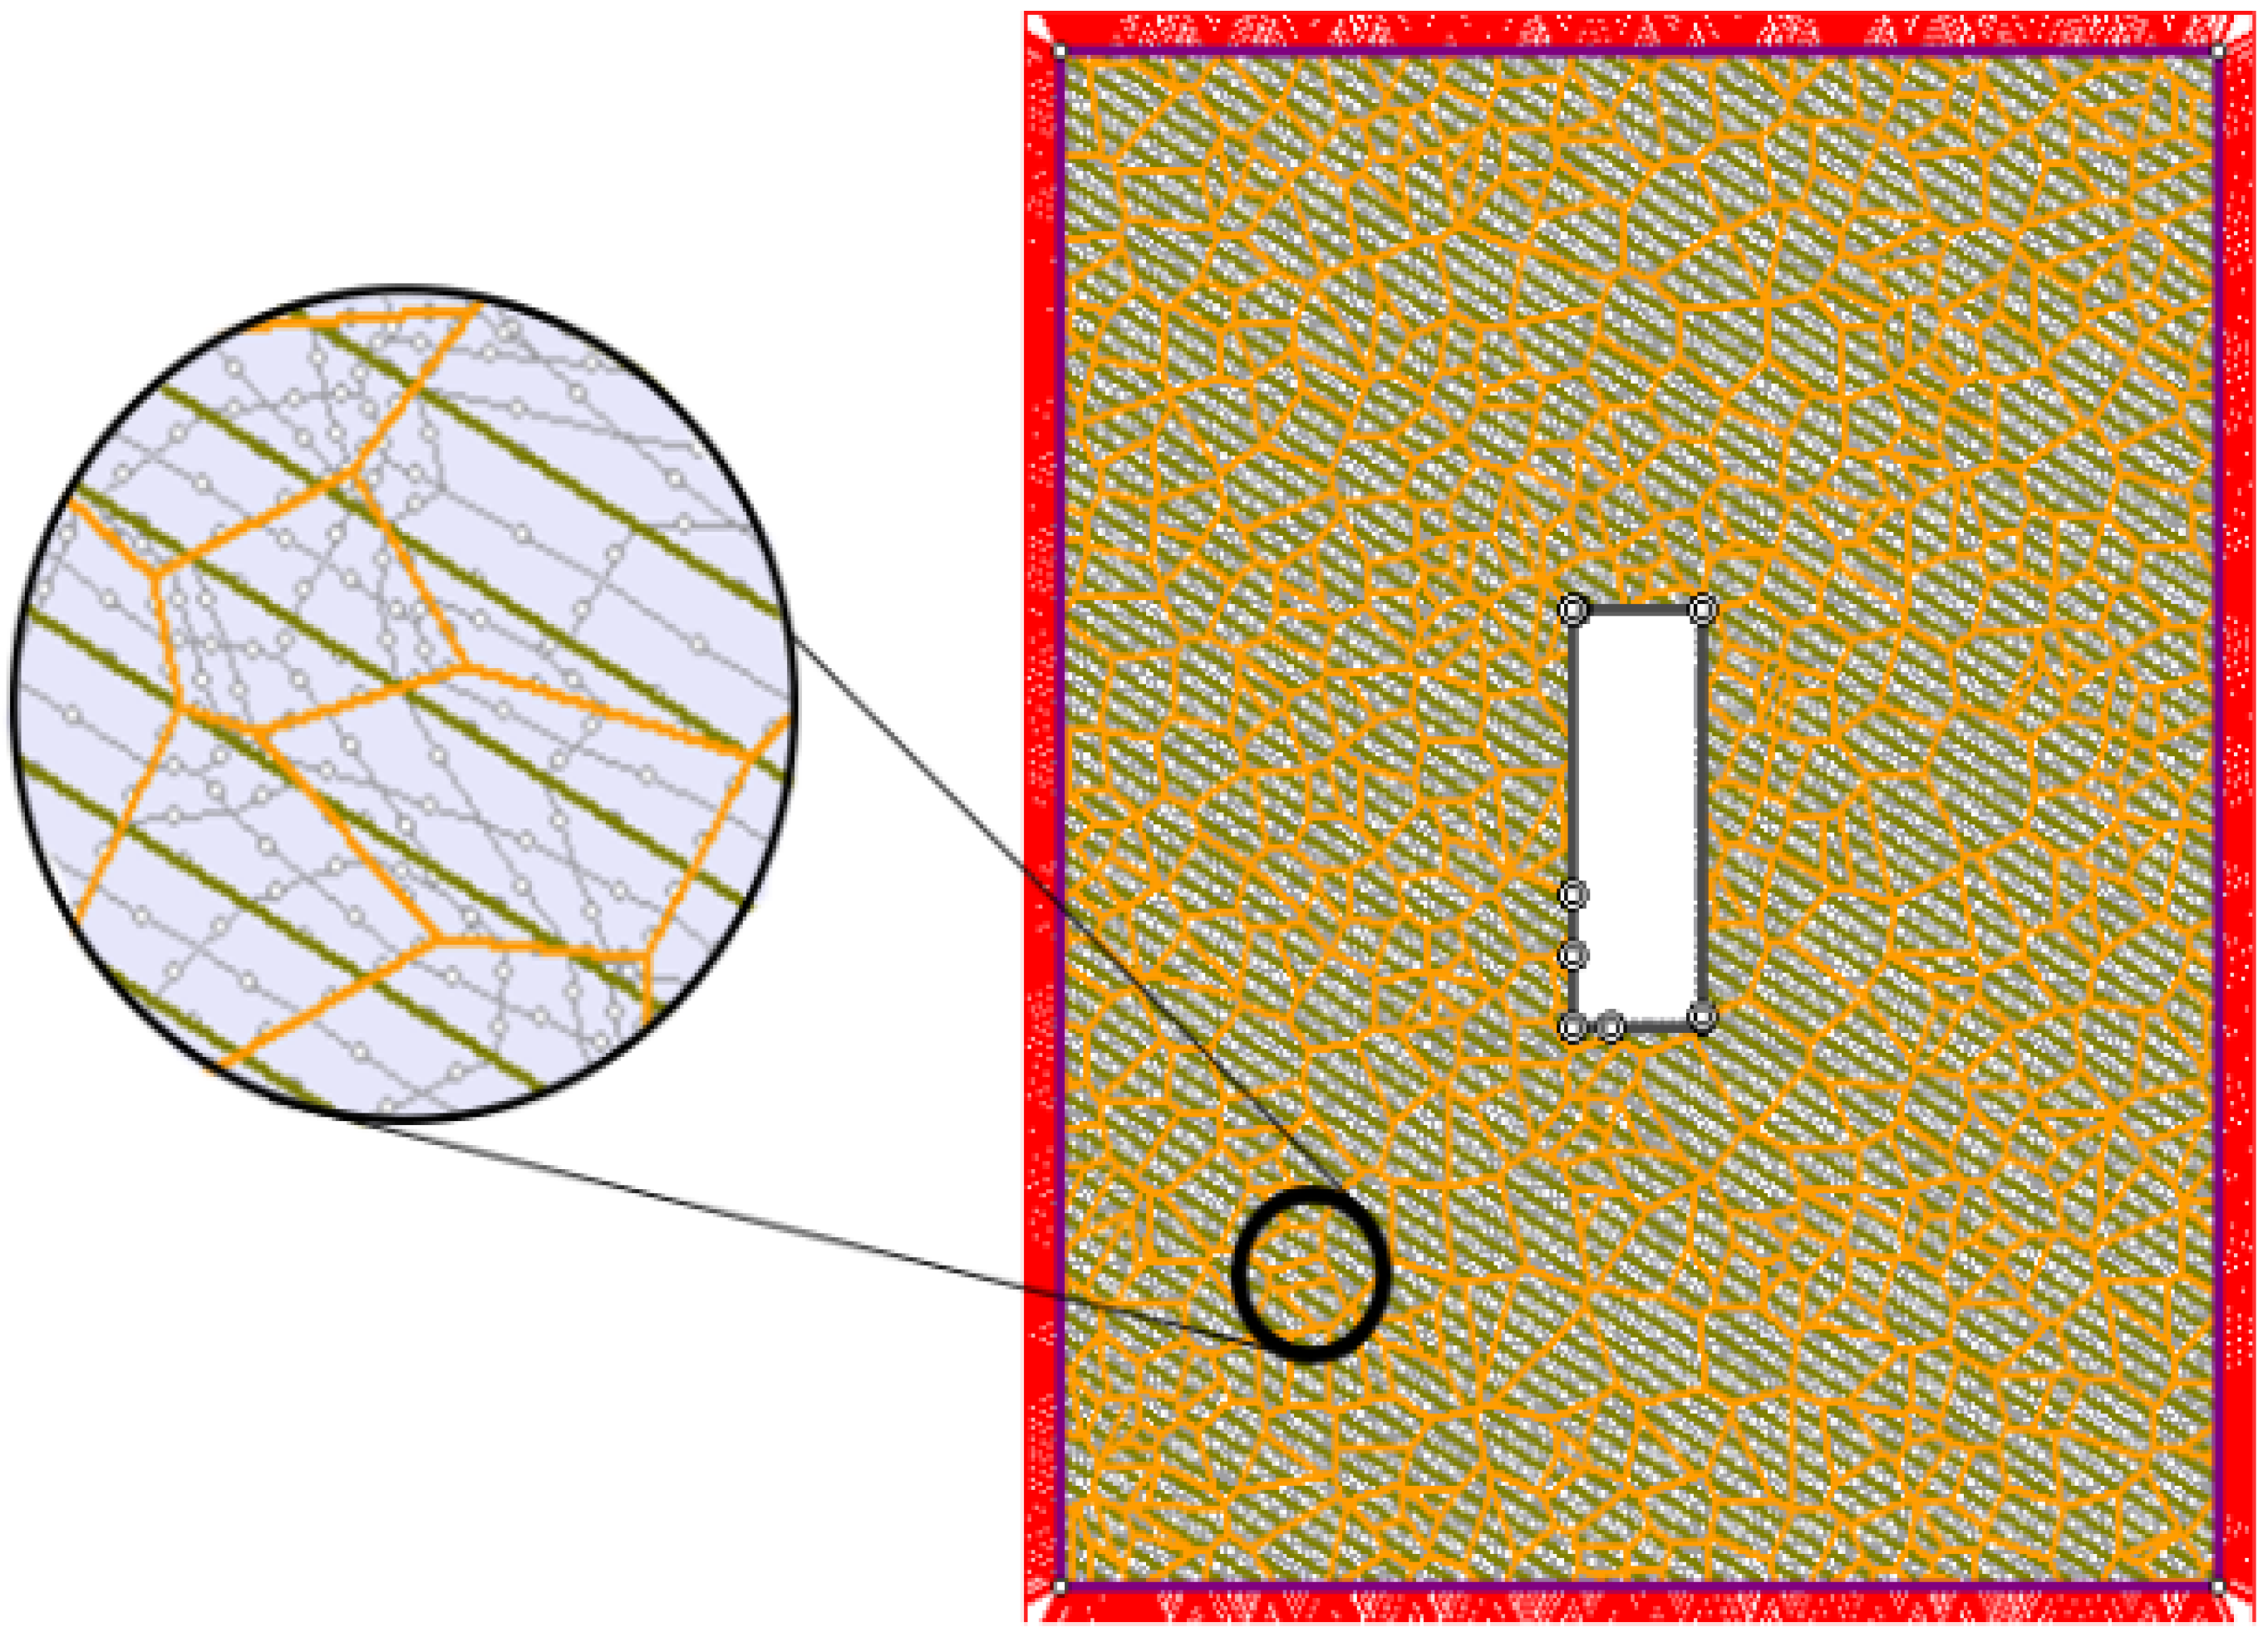
In this paper, the latter approach was employed to assess the extent of the failure around the stope and to correlate the findings with the ones derived from the stability graphs. Several analyses were conducted with the use of the Rocscience RS
2 finite elements code (Rocscience [
30]) to produce a representative number of cases from the worst to best geotechnical conditions and from small to extensive mining stopes. With these parametric analyses, firstly, the stability condition, and secondly, the open stopes’ walls’ overbreak rates were evaluated and linked to the expected external dilution rates. It is noted that this research focused on external dilution analysis while internal dilution and ore loss were considered negligible during the numerical analysis process.
3. Results
In the context of this original research report, it is not possible to exhibit the full list of the final results. Thus, some important approaches which arose through the processing of the output data are presented in this section.
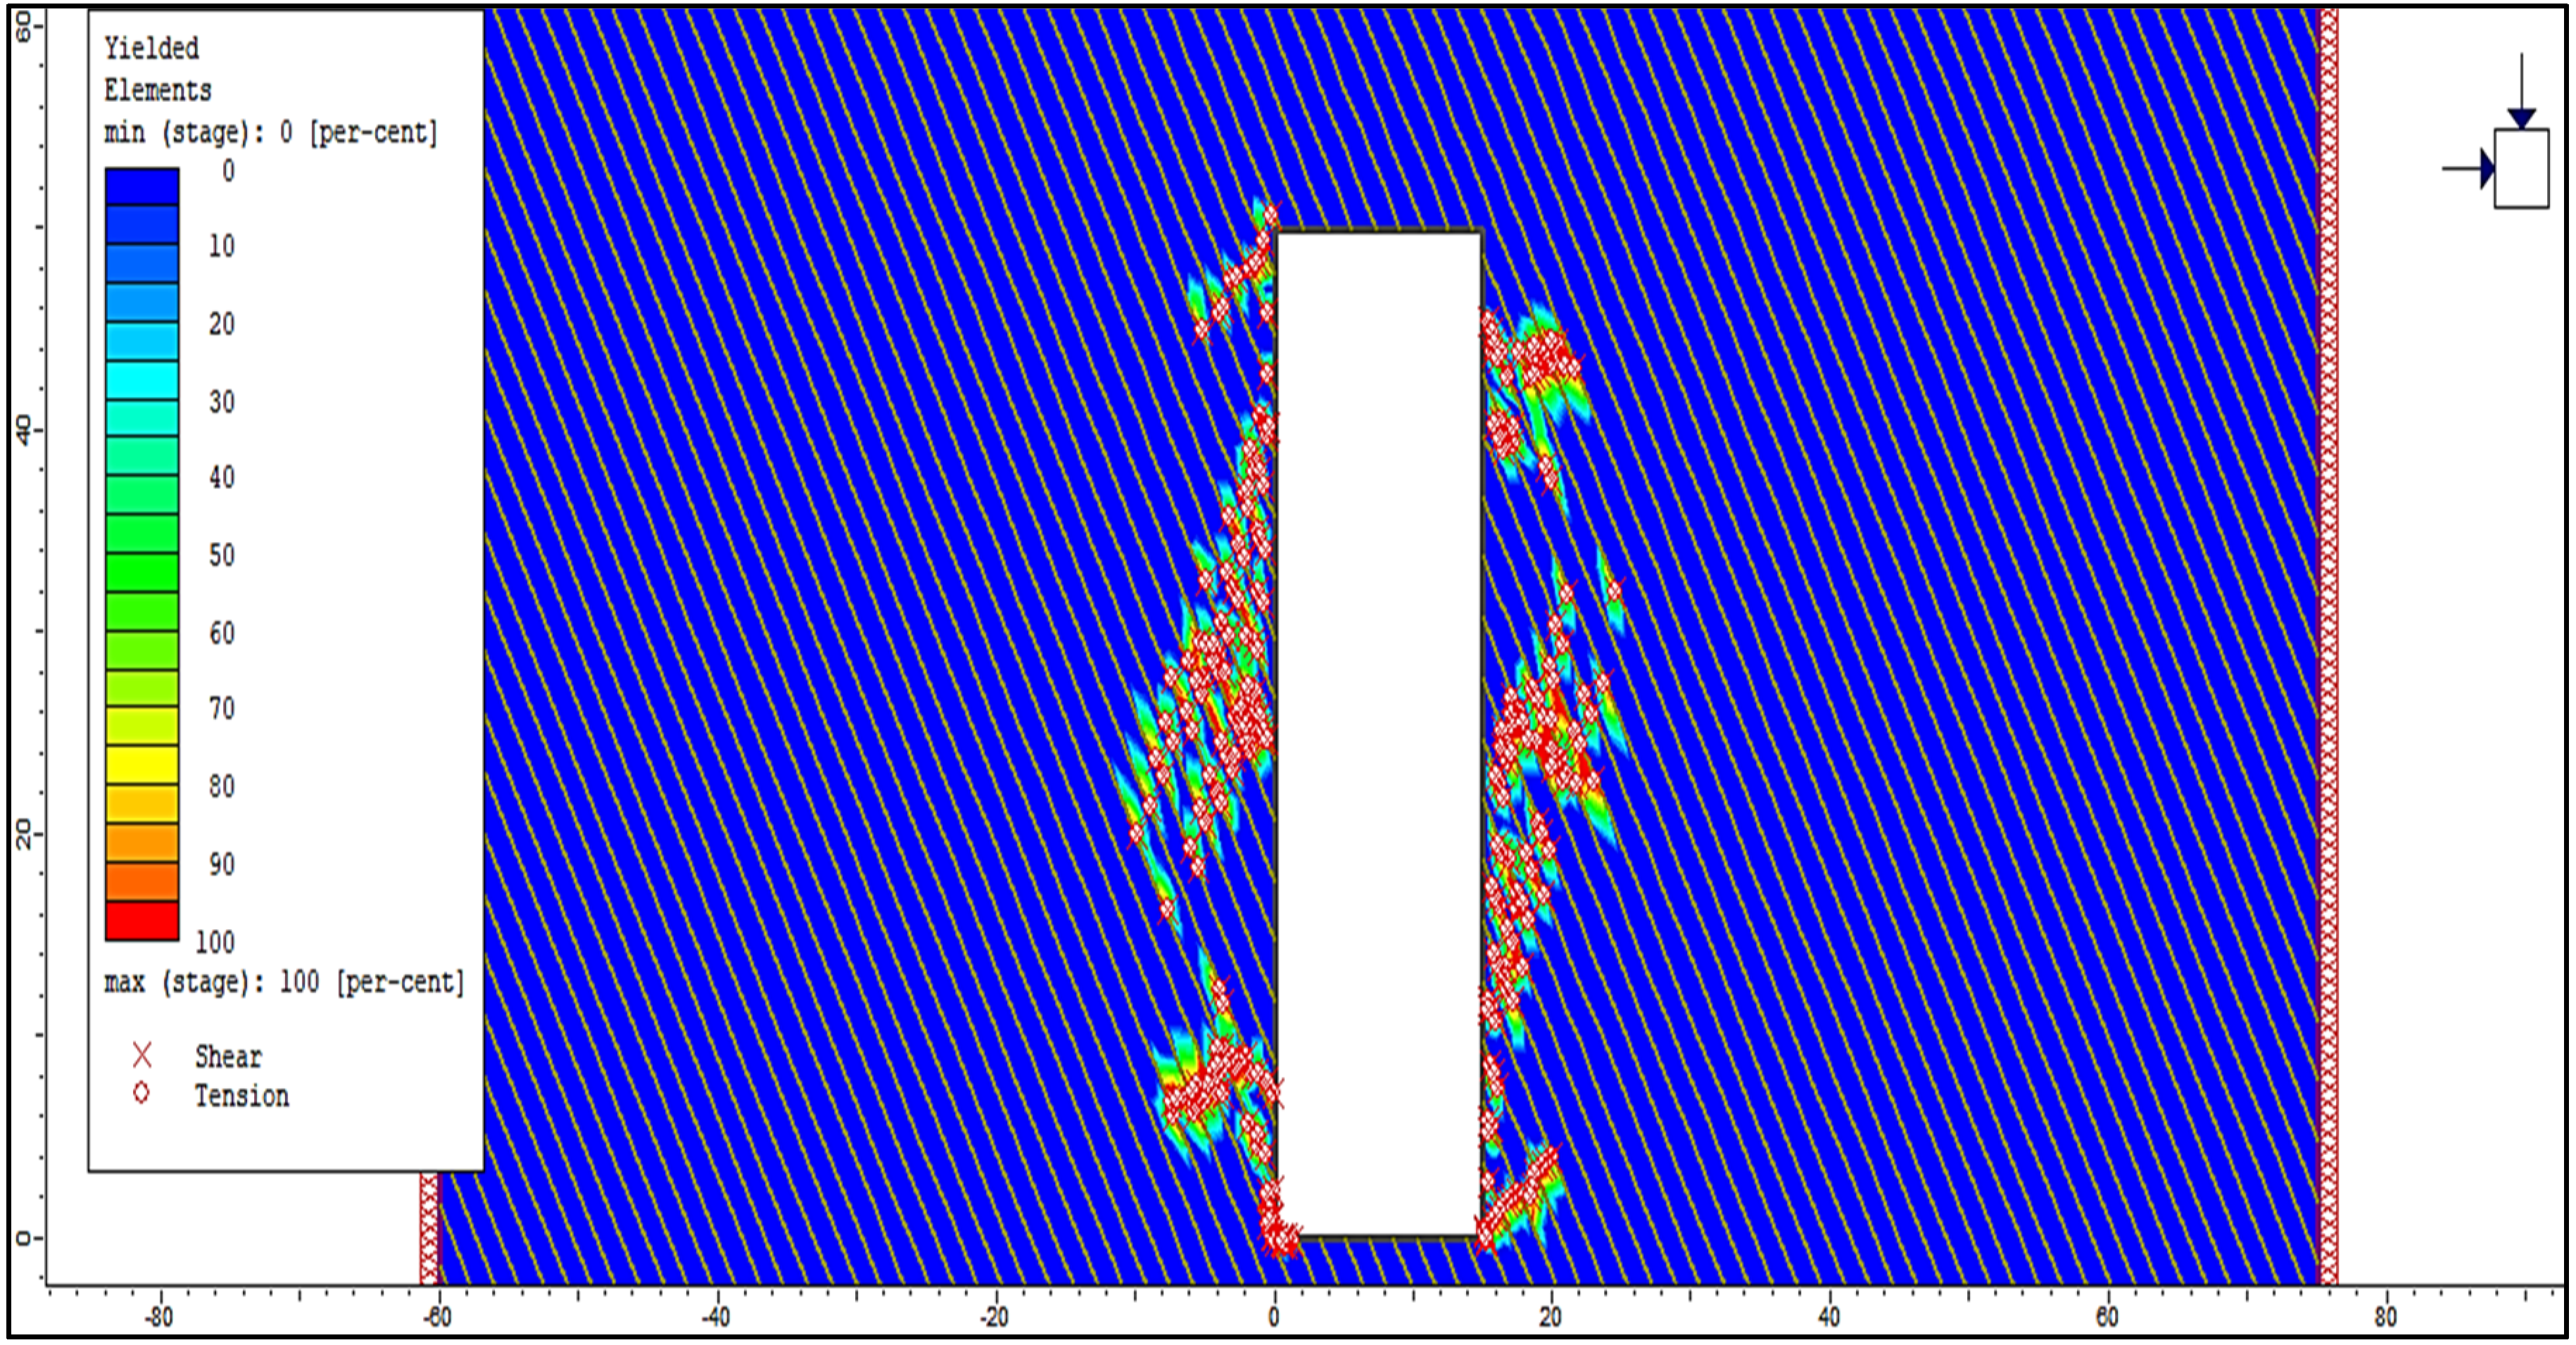
The survey data of case study #12 were selected to be presented below. In
Figure 6, the “Yielded Elements” distribution is displayed for this simulation model. Furthermore, the basic stability parameters and the results of the two types of analyses are summarized in
Table 6.
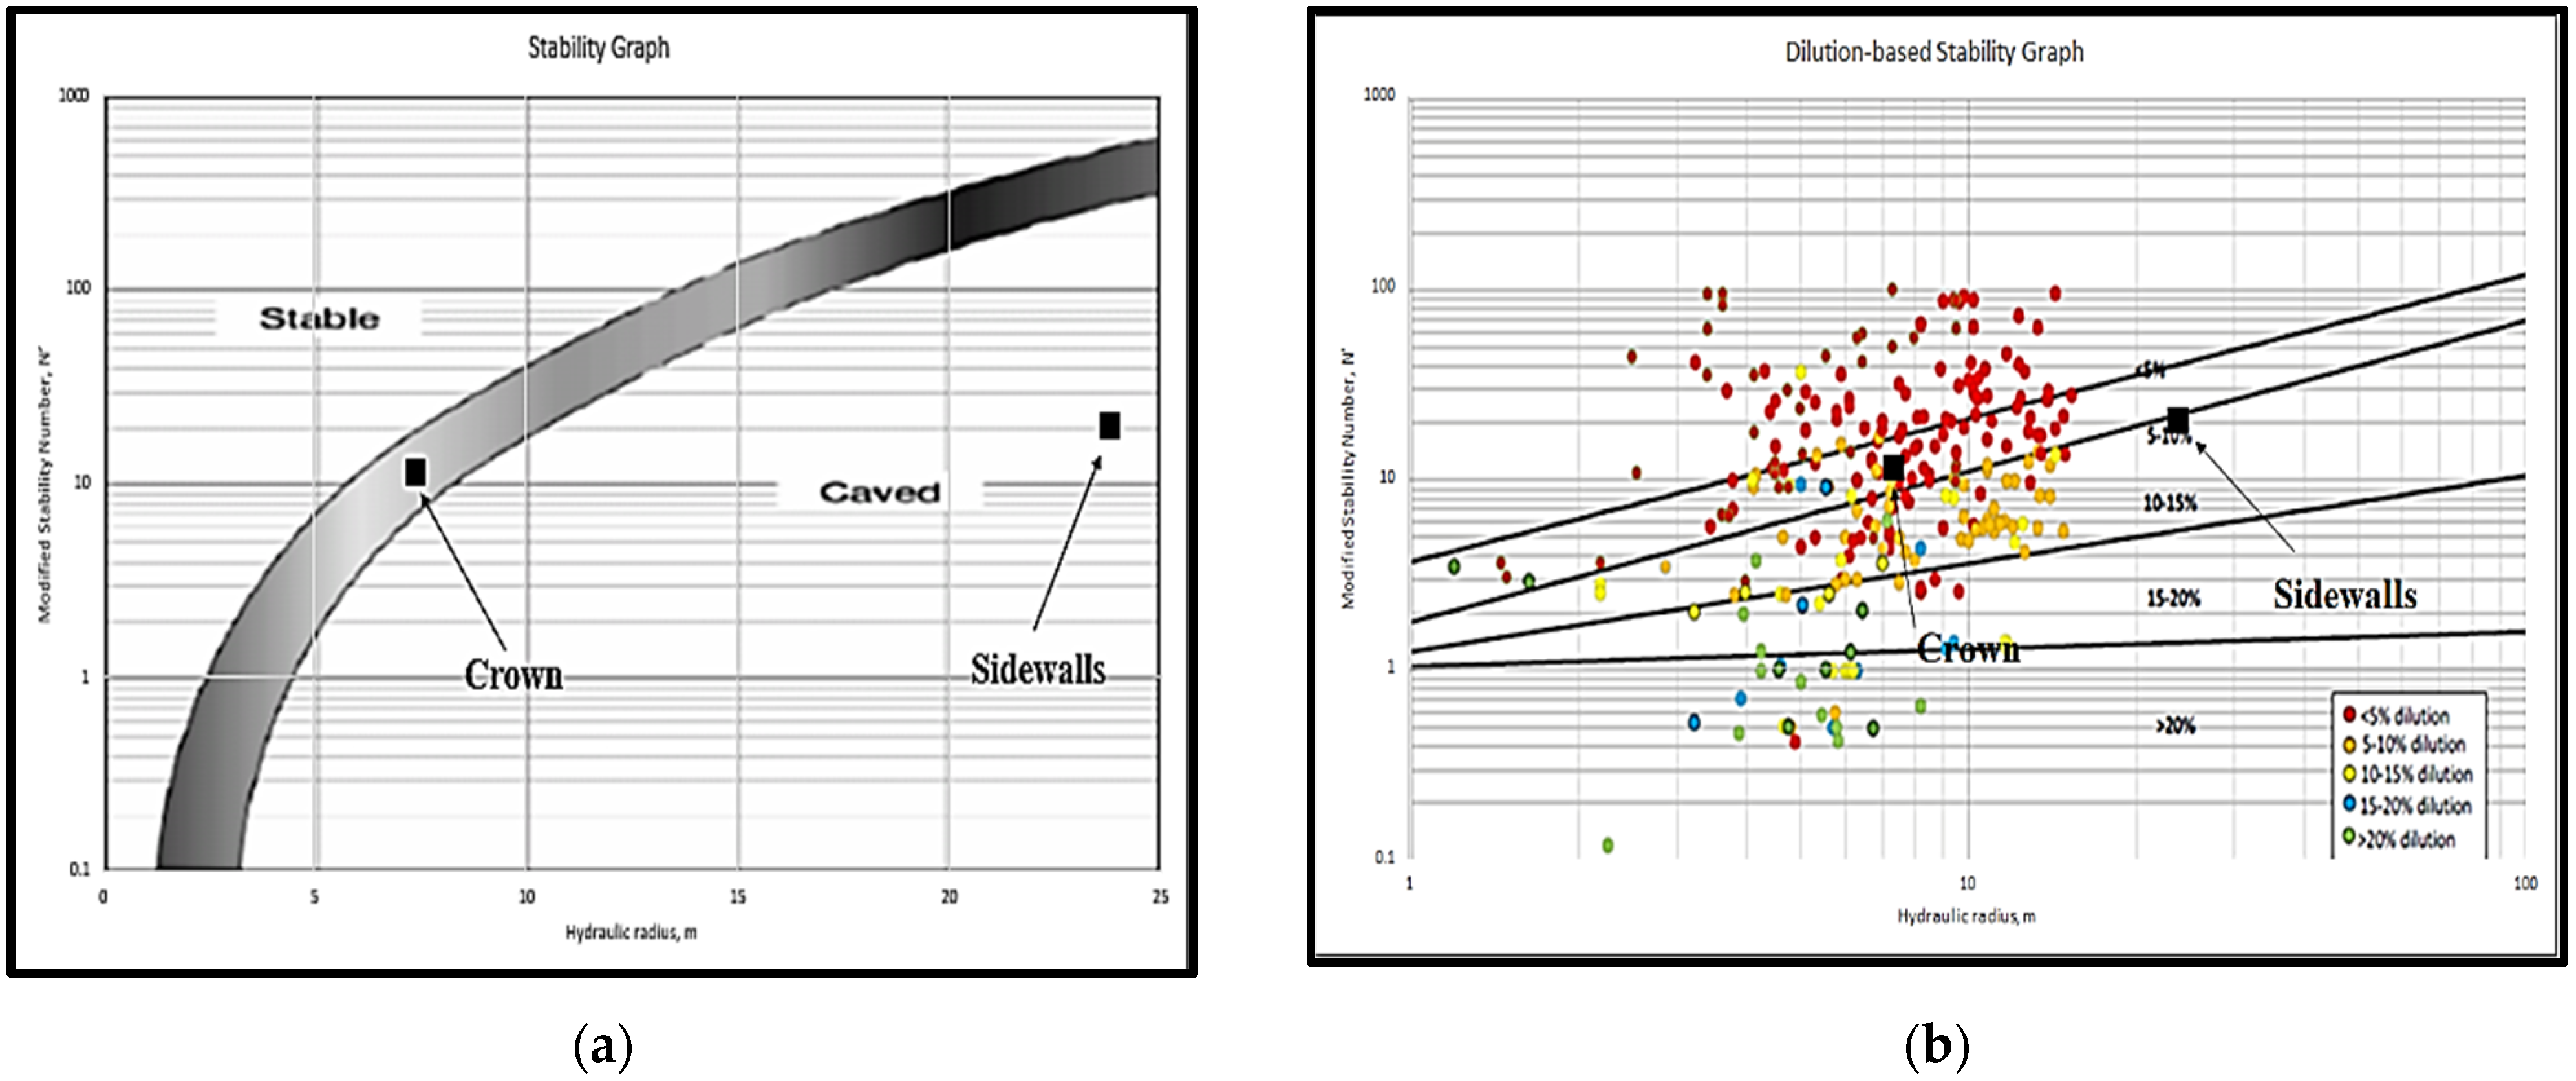
In
Figure 7, the results of the analysis through the examined empirical stability graphs (
Figure 7a,b) are shown for the selected case study (#12).
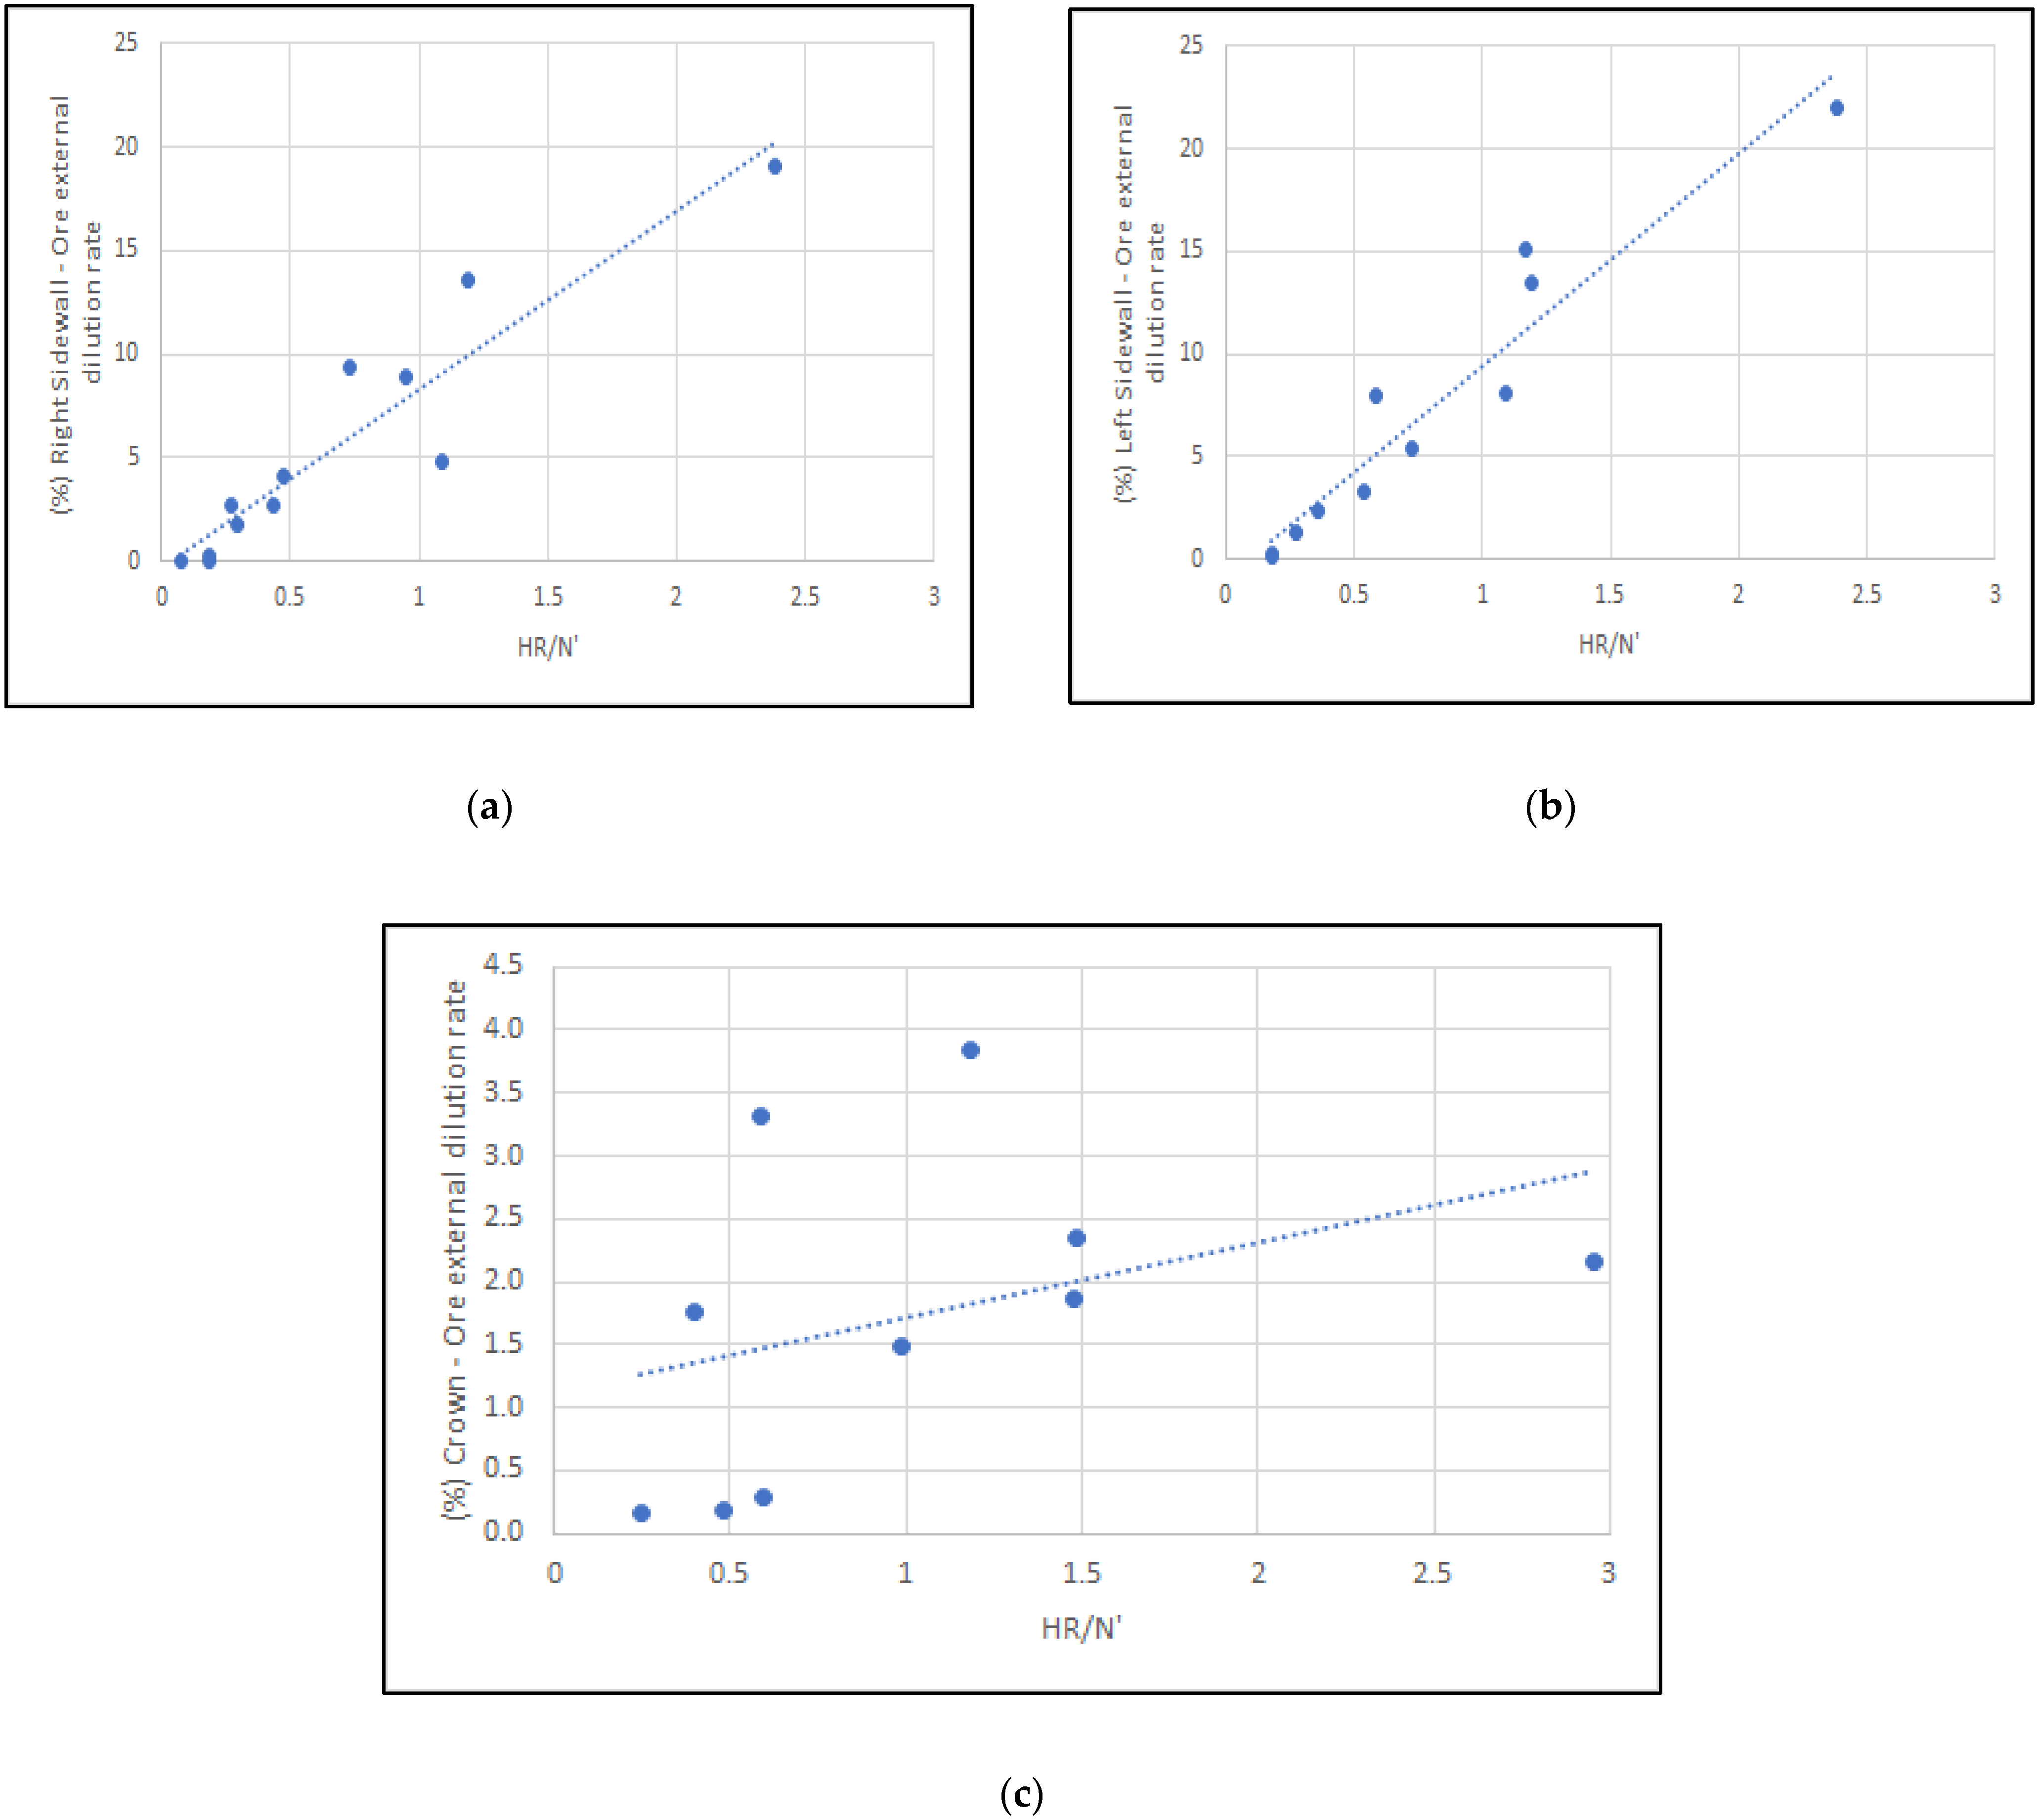
Using the output data and following a similar methodology as Le Roux and Stacey [
14], a chart that correlates the evaluated ore’s external dilution rates and the HR/N′ ratio was created for each of the examined open stope’s surfaces (crown, left sidewall, right sidewall). These charts (
Figure 8) include only the examined cases on which the calculated dilution rates were greater than zero. Three equations for the estimation of the ore’s external dilution rates were formulated by a linear regression of the datasets of each chart, as given below:
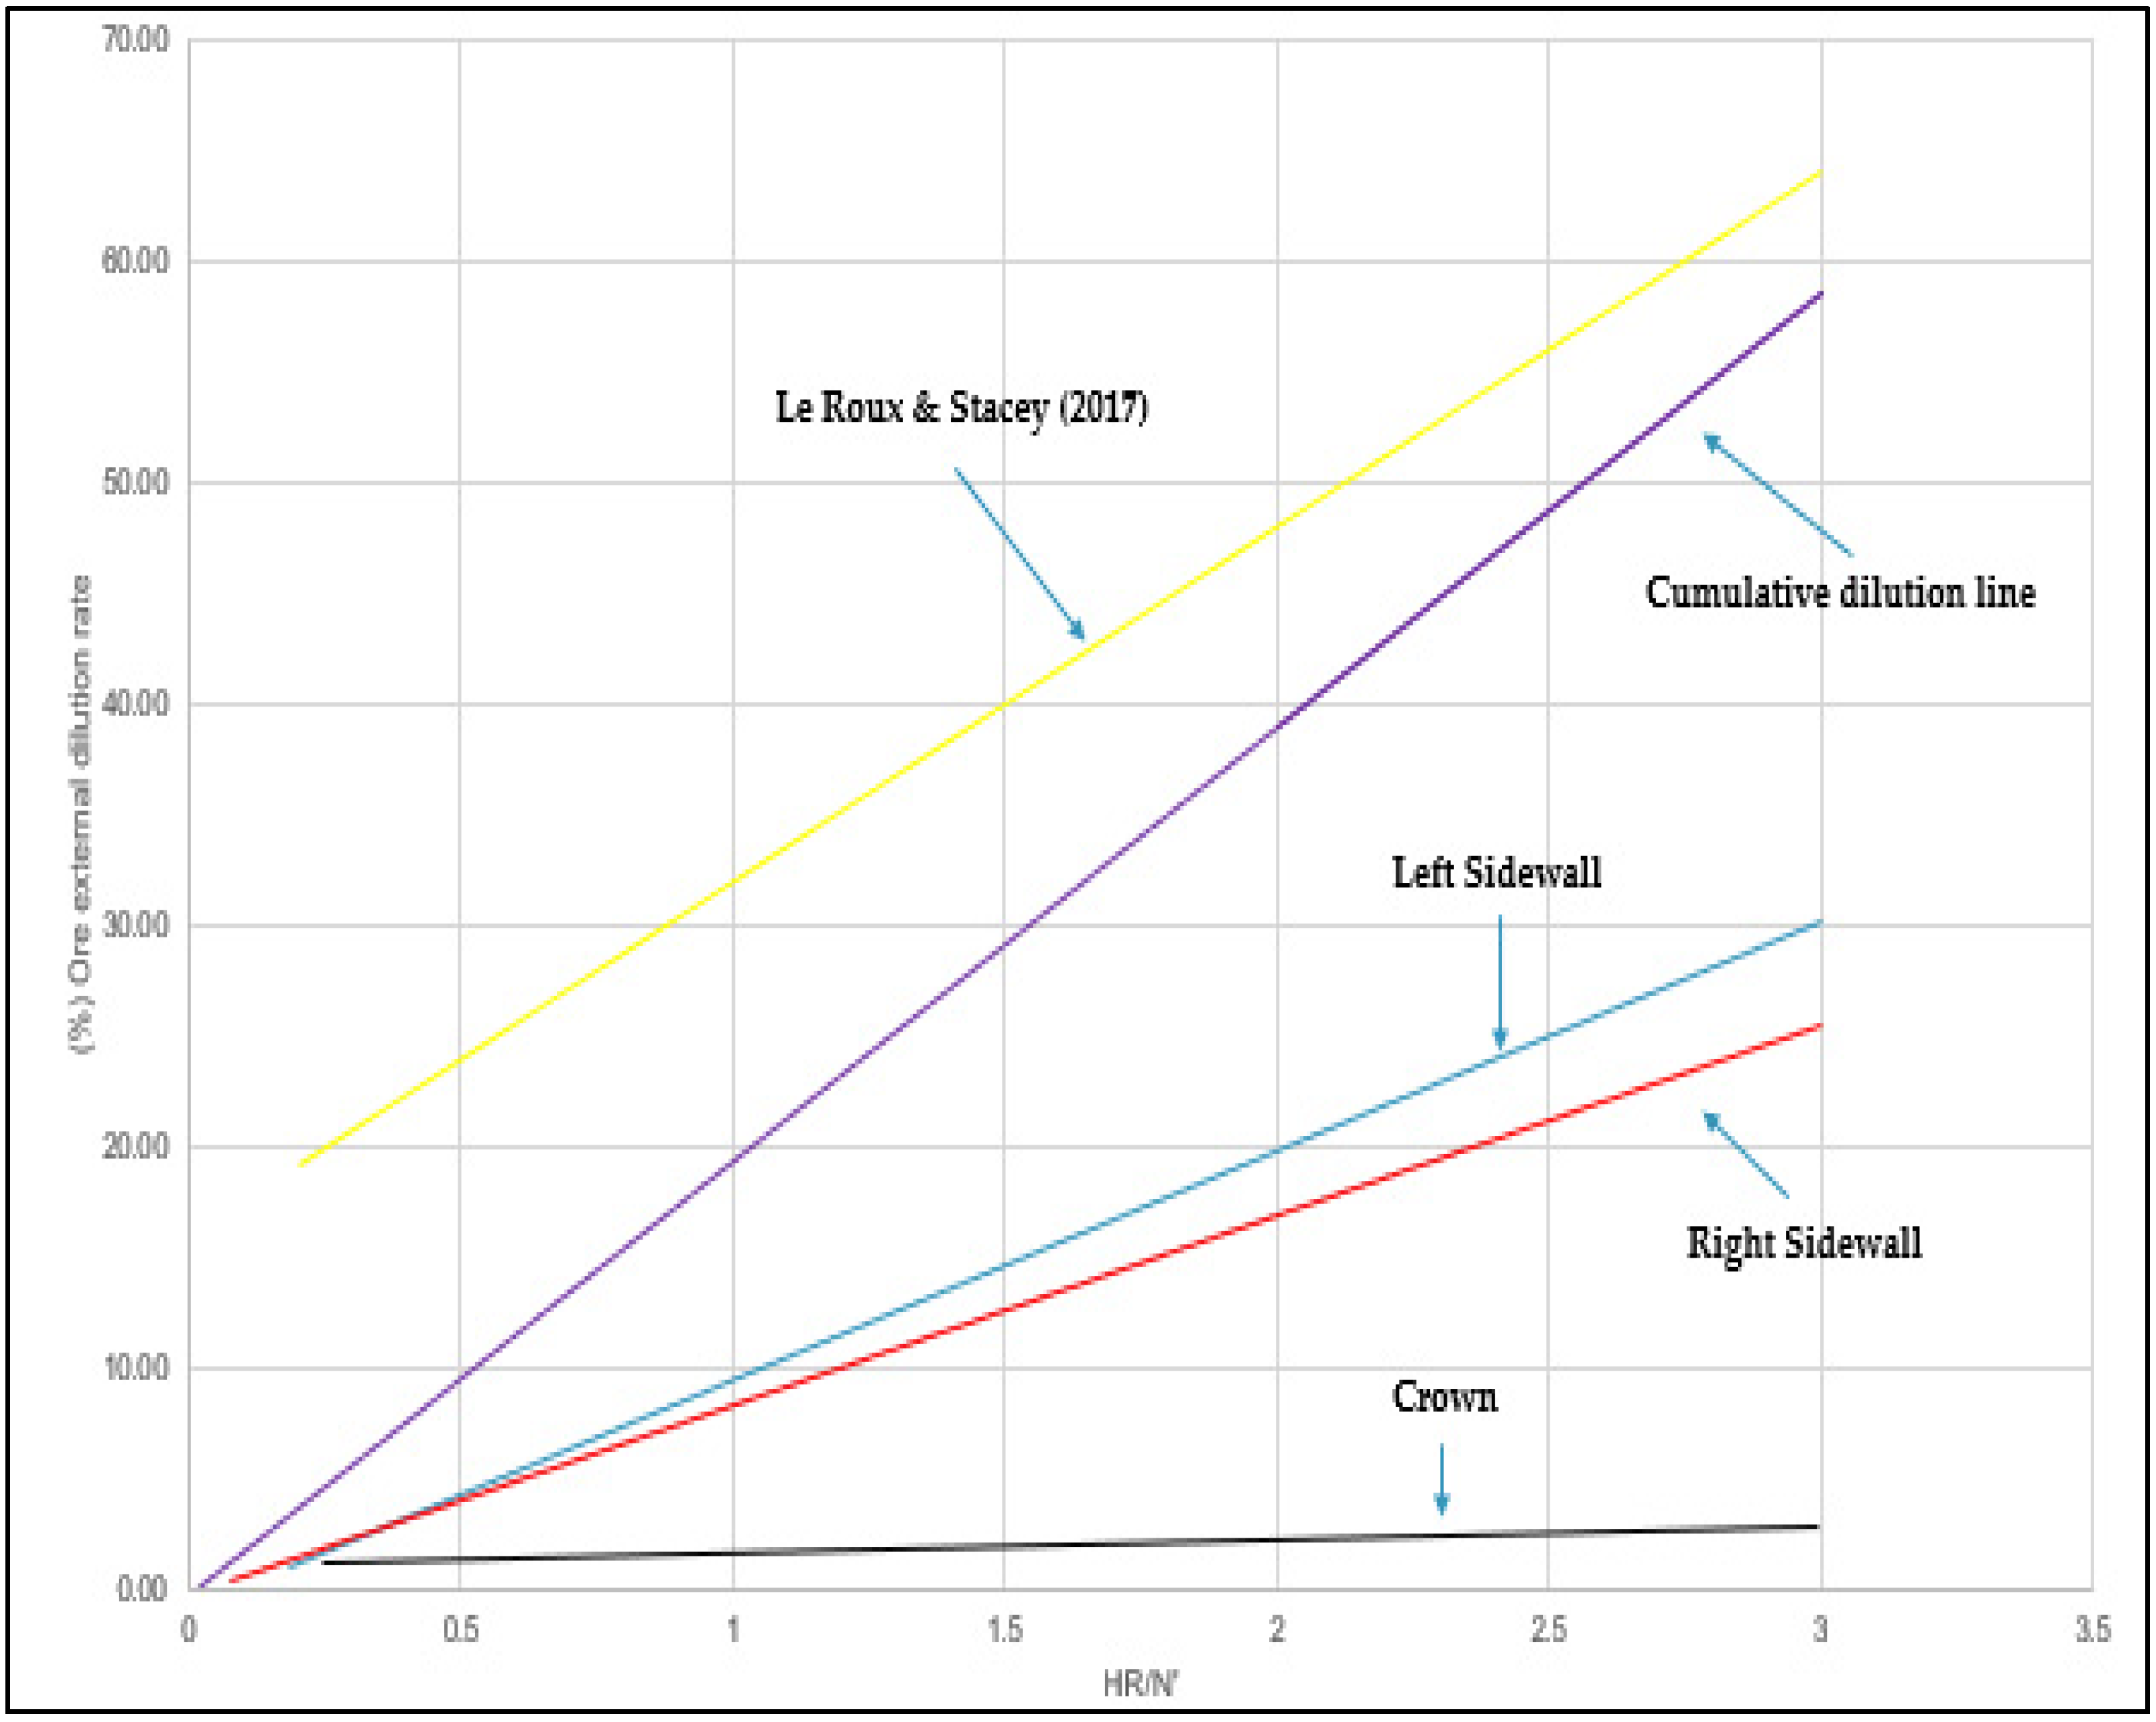
The model’s performance was validated against the findings and empirical proposals of Le Roux and Stacey [
14] and the results are presented for the values of the HR/N′ ratio between 0 and 3, in
Figure 9. As can be seen, there was a good correlation between the cumulative dilution line and the Le Roux and Stacey line, especially for larger values of the HR/N′ ratio, with an upper limit HR/N′ value, for the current analysis, equal to 3. Provided that the crown’s dilution issues that were experienced in the analysis are resolved, the correlation of these two approaches (Le Roux and Stacey line and cumulative dilution line) could be further improved.
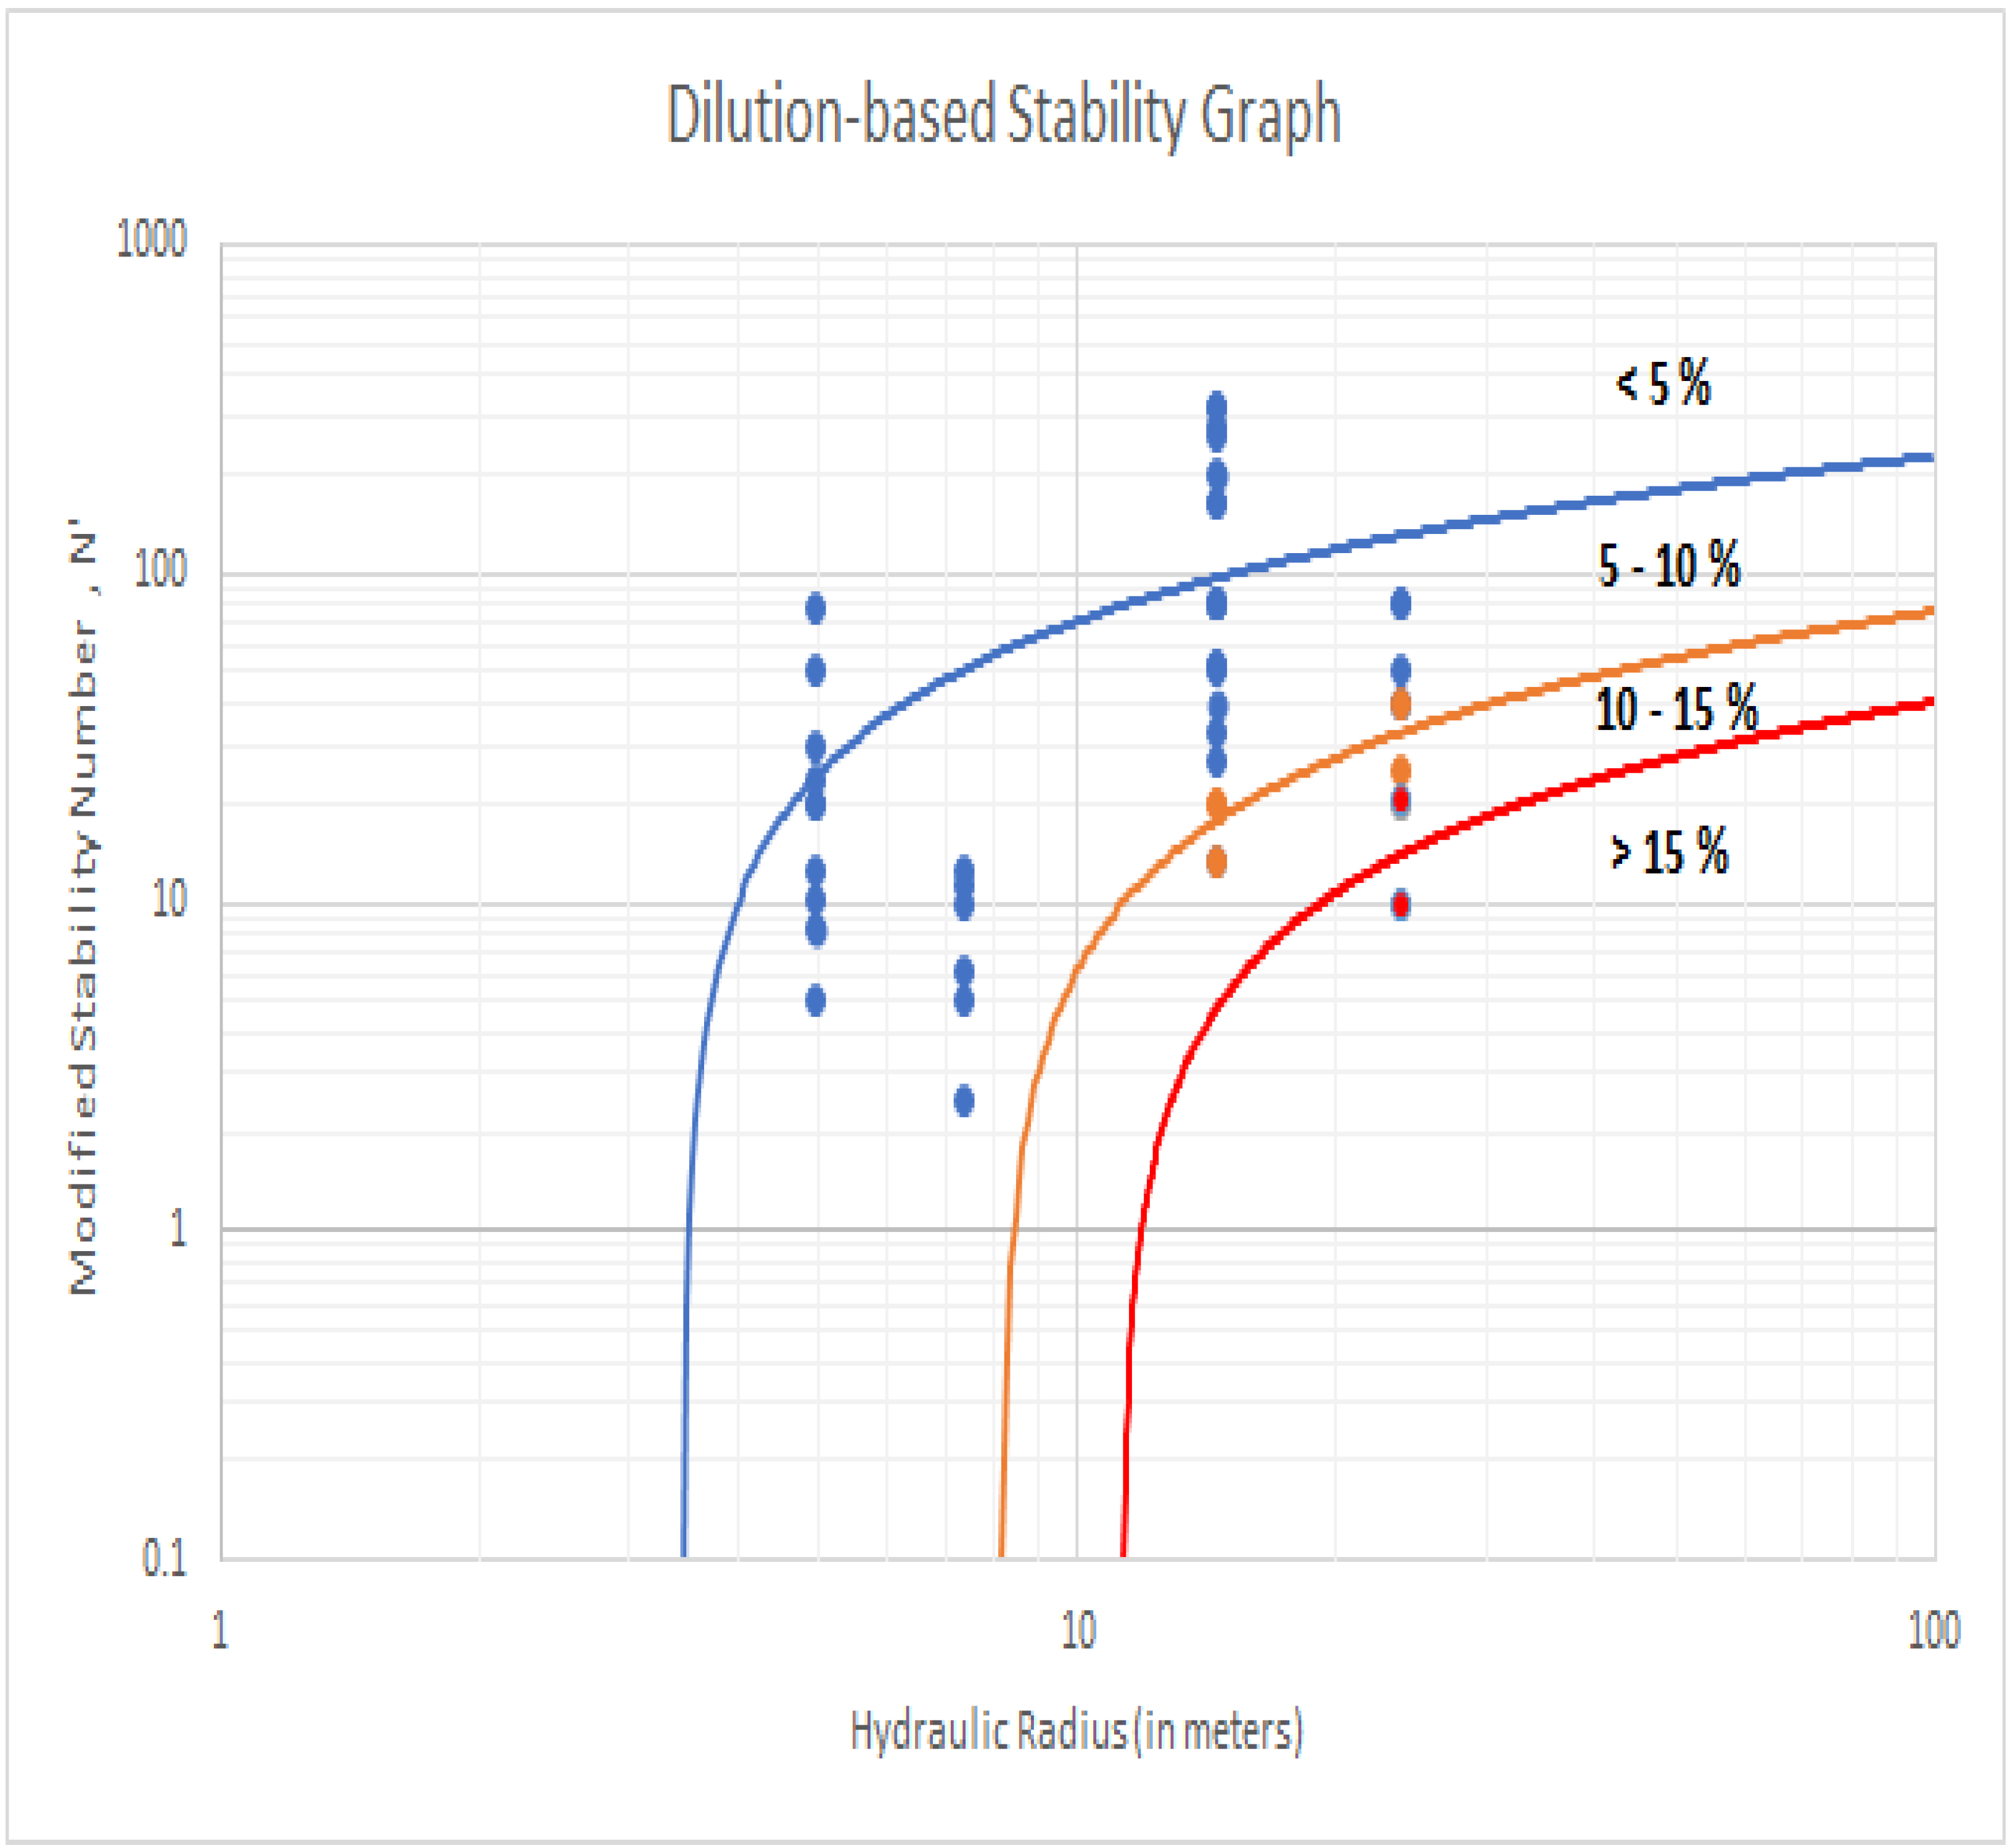
Furthermore, using the output data from the numerical analysis and following a similar methodology as Papaioanou and Suorineni [
12], a dilution-based stability graph approach was formed (
Figure 10) for the examined cases. This special SG form makes it possible to estimate a potential ore’s external dilution rate caused by an open stope’s surface overbreak by using basic stability parameters (N′ and HR). The trend lines on the chart were chosen to be logarithmic, providing a better fit with the scatter of the examined points of the chart. The provided diagram was divided into four dilution-percentage zones. This segregation was achieved through the use of three boundary lines. The first (Line 1 shown in blue in
Figure 10) separates the points of the database belonging to the group with a dilution rate <5%, the second (Line 2 shown in orange in
Figure 10) corresponds to a 10% dilution rate and the third (Line 3 shown in red in
Figure 10) corresponds to a dilution rate of 15%. The equations of the logarithmic boundary lines are:
As may easily be understood, this stability graph was created from a limited number of cases. Therefore, the database of the present research should be enlarged with additional case studies in order to make this approach universally applicable.
4. Discussion
During the performance of the parametric analysis, a variety of empirical property calculation equations were used, as well as data from valid and reliable databases. In addition, it was necessary to obtain assumptions for the completion of the simulation models. Basic assumptions were found during the quantification of the geomechanical characteristics of the geological formations and also in the definition of the design parameters of the excavation. Finally, the processing of the output data yielded important conclusions about the degree of correlation between the empirical and numerical analyses, while some empirical approaches were constructed to evaluate the expected dilution rate.
One of the most important virtues of the empirical formulas and diagrams arising from the mentioned research is their ability to have an almost instant and reliable result. This is a preliminary assessment of the examined stope’s performance. The combined use of these formulas and diagrams could contribute to the optimization of the design parameters of the excavation area, always taking into account the characteristics of the mineral deposit and its cut-off grade.
Optimizing the design features of the open stope leads to significant benefits for the entire mining process. First, reducing the dilution rate of the ore has as a direct benefit the increase of the economic value of the produced material, with a simultaneous reduction of the production process cost. In addition, it reduces the cost for the removal of sterile material from the useful material. This procedure includes tasks such as the secondary crushing and milling, as well as the commitment of mechanical equipment to convey the material. Finally, the reduction of the ore impurities indirectly alleviates the operating costs of the production process, due to the limitation of the required support measures for the containment of failure.
It has been found that the presented analysis yielded very satisfactory results for the two lateral surfaces of the open stoping area. Furthermore, their equations for the preliminary estimation of the ore’s external dilution showed a good fit and correlation with the scatter of the examined points of the charts. On the other hand, the results of the crown’s analysis presented a low correlation with respect to the values estimated from the empirical approaches. However, this could be justified to some extent, due to the principal failure mechanism of this surface (mostly gravity fall) and the continuum nature of the numerical analysis, as well. In terms of the overall instability and dilution potential, the obtained results are directly comparable with the ones proposed by other researchers, especially for the upper values of the HR/N′ ratio.
Additionally, using 2D continuous-media analysis software to simulate a discontinuous-medium problem was risky but was considered to be quite a successful approach. However, the use of 3D discrete-element analysis software is very likely to lead to an equally satisfactory simulation.
5. Conclusions
Empirical models incorporate the lessons learned from a number of past cases and historic records. The stability graph models that have been presented by various researchers are broadly considered to have fairly accurate estimations for stability conditions of open stope mining. Nevertheless, the use of numerical modelling can be further used to depict the stability conditions with great accuracy. This could allow for quantified assessments in cases beyond the exact past examples and could be beneficial in challenging conditions, further extending the applicability of such approaches. This is the very aim of the paper. In addition, the selection of the optimal rock mass failure criterion is critical. In the context of the present research, it was decided that the representation of the points that appear to fail on tension or shear around the planned excavation boundaries would be used. According to the RS2 software’s analysis, this representation is given through the “Yielded Elements” contour. However, several possible failure criteria were examined in the early stages of the investigation.
The simulation of different geomechanical conditions in the examined area caused different stability conditions in the excavation surfaces. This pluralized the output data and eventually led to a wider range of stability-parameter values.
The final approaches for estimating the dilution rates of the ore are considered to be particularly important. These were created through the careful statistical processing of the output data and could prove to be useful tools for the optimization of an open stope’s design parameters, based on the instability-reduction issues.
Nevertheless, it is necessary to carry out a broader verification analysis with the utilization of 3D numerical codes while also having more direct and explicit in situ field data. This could further calibrate and fine tune the proposed models and come up with a more accurate assessment of the ore’s expected external dilution rates.


