Article

Organic Petrographic and Geochemical Evaluation of the Black Shale of the Duwi Formation, El Sebaiya, Nile Valley, Egypt

1
Geological Sciences Department, National Research Centre, Dokki, Giza 12622, Egypt
2
Exploration Department, Egyptian Petroleum Research Institute (EPRI), 1 Ahmed El Zomor St. Nasr City, Cairo 11727, Egypt
3
Nuclear Materials Authority, Maadi, Cairo 530, Egypt
4
Core Laboratories, 6316 Windfern Road, Houston, TX 77040, USA
*
Author to whom correspondence should be addressed.
Minerals 2021, 11(12), 1416; https://doi.org/10.3390/min11121416
Submission received: 24 October 2021 / Revised: 28 November 2021 / Accepted: 8 December 2021 / Published: 14 December 2021

Abstract

:
This study evaluates the palynologic, organic, inorganic, and petrographic properties of organic-rich black shale (Mahamid Mine) in the El Sebaiya area, Nile Valley, Egypt. Black shale is composed of quartz (50%), calcite (10%), kaolinite (25%) and montmorillonite (15%). Organic and inorganic analyses revealed that this shale was deposited under oxic to anoxic marine conditions during strong chemical weathering. Black shale has poor to very good organic richness, and poor to fair hydrocarbon potential. Organic petrography indicates that the kerogen is mixed types II/III and III and is immature to marginally mature (%VRo is 0.44 and 0.53). Liptinite macerals consist of alginite, cutinite, and bituminite. The hydrocarbon products to be generated at higher maturity are expected to be oil and gas.

1. Introduction

The rapid growth of urban regions and industrial demand has led to a greater consumption of conventional petroleum resources., which has resulted in the decline in conventional petroleum reserves [1]. The decline in petroleum has led to the search for unconventional resources based on fossil energy (e.g., oil shale, shale oil, shale gas) and non-fossil energy (e.g., wind energy and sun power). Black shale (organically rich) has become one of the important sources of unconventional oil/gas exploration [2]. Organic-rich shales are widely deposited in Cretaceous deep marine settings, especially in the Tethys region [3]. Egypt was situated on the southern margin of the Tethys throughout the late Cretaceous to Paleogene period. The deposition of marine deposits, such as a widespread sequence of carbonates and claystone, occurred in this area. This sequence played an important role as the chief host of organic-rich sedimentary rocks.
In Egypt, the above time interval is economically important as it contains the main episodes that led to the formation of the black shale and phosphorites of the Duwi Formation [4]. Phosphatic accumulations are associated with organic-rich strata and cherts, and indicate high productive surface waters [1,4]. The province holds the greatest accumulation of phosphorites in geological history, possibly in excess of 70 billion metric tons; the phosphate resources in Egypt alone exceed 3 billion metric tons [5]. These phosphorites represent the late Cretaceous Tethyan phosphorite belt and occupy a vast region that extends from North Africa to the Middle East [6]. In Egypt, black shale deposits are mostly associated with phosphorites deposits, as shown by Troger [7], who stated that the phosphate belt in the Eastern Desert, Nile Valley and Southern Western Desert, contains a huge source of black shale. The above study concluded that black shale is concentrated along many places, among them the Nile Valley in the Esna-Idfu region. Hassan et al. [8] indicated that the black shale of the Duwi and Dakhla formations and the Lower Calcareous shale member of the Esna Formation are characterized by mud bands and pseudomorph of iron-oxides. This resulted from the deposition of oscillating shallow marine conditions in an outer neritic to inner neritic and reducing environment that also contains muddy argillaceous sediments.
El Kammar [9] recommended that additional exploration activity is needed in the Nile Valley area to better understand the same geologic events that led to the formation of oil shale deposits in Jordan, and which extended into Egypt. It is of importance to note that published data on the quality and characteristics of fresh (subsurface) black shale of the Nile Valley occurrence is very limited and has not been explored as a source of energy. Therefore, the work presented here is the first detailed and comprehensive study that combines inorganic, organic geochemical, and petrographic analyses for the evaluation of the black shale belt in the Nile Valley with a focus on the Dawi Formation in the El Sebaiya area.

2. Geologic Setting

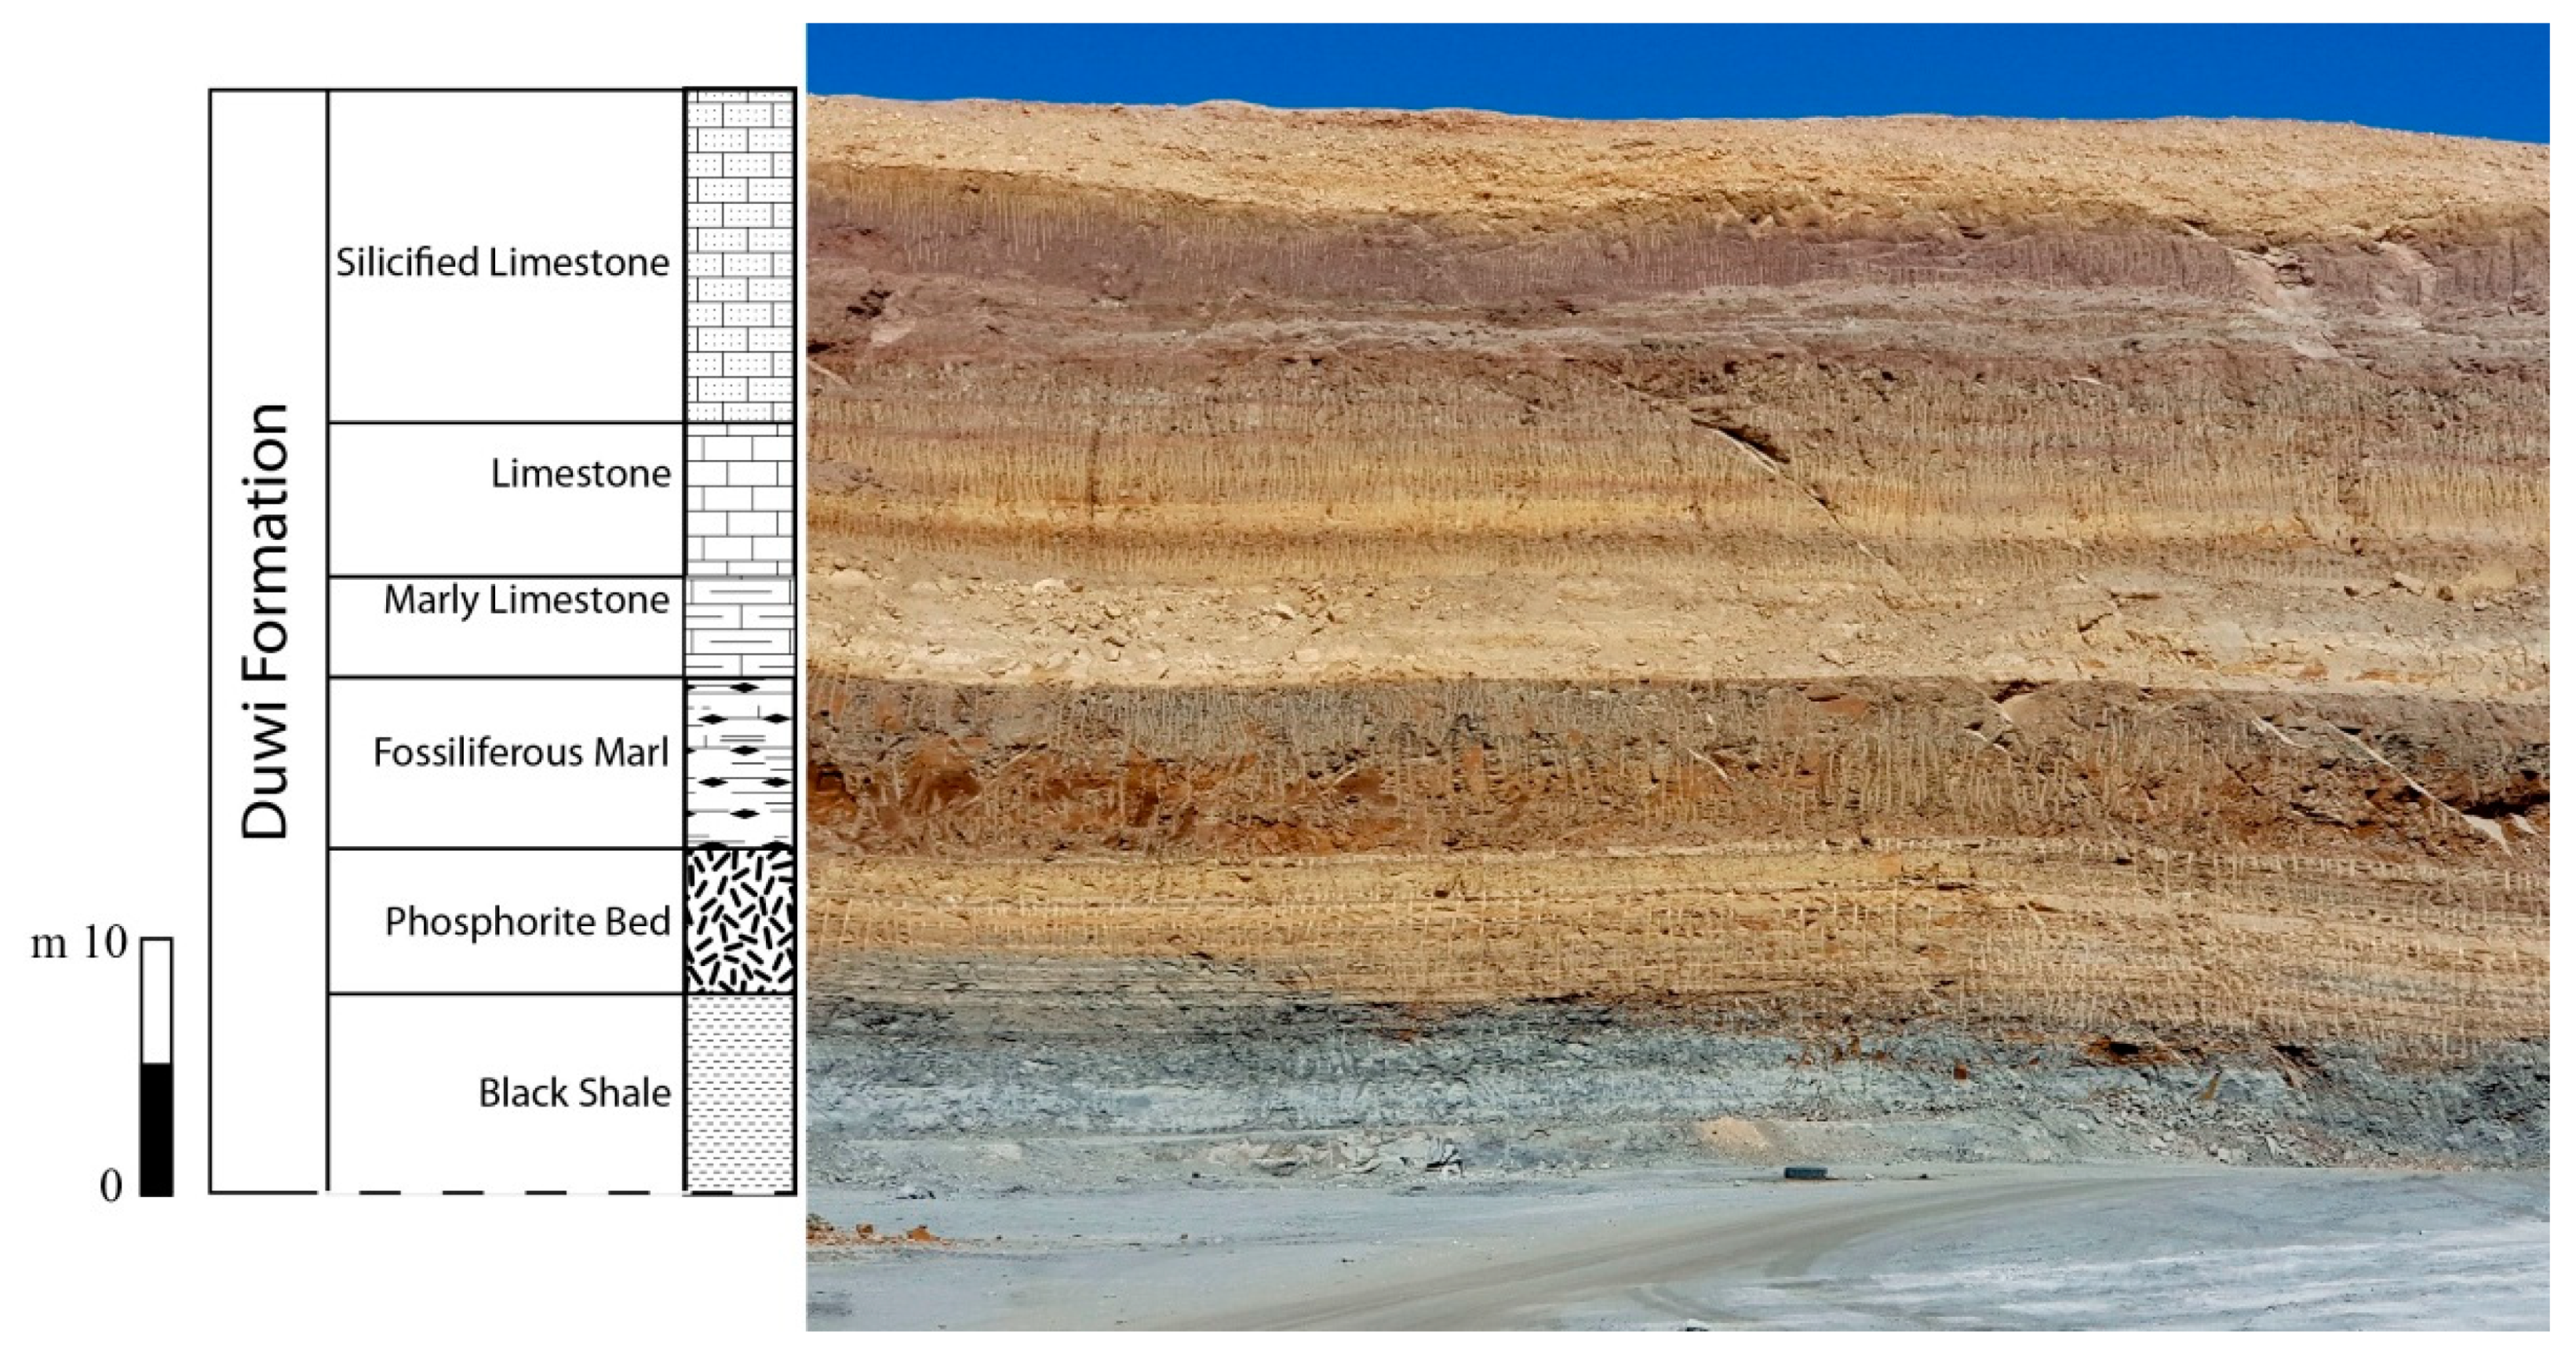
In the Nile Valley, the Duwi Formation in the Qena-Idfu region was subdivided into three members. They are, from top to bottom, the Adayma, Sebaiya, and Mahamid Phosphate members [10]. They are separated from each other by marl and Oyster limestone beds [11]. The studied black shale in the Sebaiya area (Mahamid mine) are located between longitudes 32°38′0.4″ E, 33°1′33″ E and latitudes 25°01′3.4″ N, 25°14′22.8″ N on the south-eastern side of the Nile Valley (Figure 1). The studied sequence is late Campanian-early Paleocene and considered as a division of the dominated black and variegated shales that are extensively dispersed in Upper Egypt. This succession extends from the New Valley (Western Desert) to Safaga–El Qussier district (Red Sea Coastal Plain) through Aswan at Nile Valley Figure 1. The study sequence consists of black shale (late Campanian–early Maastrichtian) of the Duwi Formation. The formation overlies a fluvial variegated shale succession of the Qusseir Member of the older Nubian Formation by an erosion contact [12]. The complete sequence was conformably overlaid by the deeper marine laminated gray to black shale of the Dakhla Formation (late Maastrichtian-early Paleocene) (Figure 2).
Generally, the black shale of the Duwi Formation in El Sebaiya is well compacted. The lower bed is yellowish grey, but the middle bed is dark grey. The color of the shale beds of the Duwi Formation east of the Nile Valley varies from yellowish grey at the base to pale yellow (with pseudomorphboidal pyrite) at the top. Dark blackish grey colors confirm the oscillating depositional environment from littoral to inner to outer sublittoral conditions [13]. However, the color of the shale beds of the Duwi Formation west of the Nile Valley varies from yellowish dark grey to yellowish red pale grey from base to top. This resulted mainly from oxidation, which formed hematite and limonite iron oxides and black goethite cubes.

3. Materials and Methods

3.1. Sampling, Chemical and Mineralogy Techniques

A well-constrained Global Positioning System (GPS) was used for navigation and to locate the sampling sites accurately. Seven composite representative black shale samples were collected. Six samples (Samples 2–6) taken from an open-cut mine from El Sebaiya (Mahamid mine), Aswan, from the phosphate mines of the El Nasser Company and one sample (Sample No. 1) was taken from an outcrop of the black shale bed situated approximately 25 km to the south of the mine (Figure 1). Approximately 2 kg per sample were taken. The six samples collected from the black shale horizon (Figure 2) were scattered horizontally along the bed over a distance of about 70 m. All the collected rock samples were prepared for chemical composition analysis using an Axios Sequential WD-XRF Spectrometer (named Analytical 2005), located in the National Research Centre Laboratory, Egypt. All the collected rock samples were prepared for chemical composition analysis using an Axios Sequential WD-XRF Spectrometer named Analytical 2005, located in the National Research Center Lab. Two samples were analyzed by X-ray diffractometry at the Egyptian Mineral Resources Authority (Dokki, Egypt) using a PAN analytical X-Ray Diffraction equipment model X′Pert PRO with Secondary Monochromator. The morphology and size of the samples were characterized via SEM, coupled with energy-dispersive spectroscopy EDAX (SEM Model Quanta FEG 250) at the National Research Center laboratories. A Leica DM4 microscope equipped with a 50× oil immersion objective lens was used for the organic petrographic analysis (vitrinite reflectance). A camera was attached to the microscope for photomicrographing. A mercury (Hg) lamp was used to generate blue light for fluorescence.
Trace element enrichment in the studied samples was assessed by enrichment factor (EF) and contamination factor (CF). The Upper Continental Crust (UCC) [14] was used as the background (Bm) in this study.
The enrichment factor (EF) is given by the following equation [15]:
EF = (Cm/Bm)/(Rs/Rc)
The Contamination Factor (CF), was determined using the following equations [16]:
CF = Cm/Bm
where, Cm is content of the examined element in the shale, Bm is content of the examined element in the UCC, Rs is content of the reference element in the shale and Rc is content of the reference element in the UCC. In this study, zirconium was used as a conservative tracer to differentiate natural from anthropogenic components. Zirconium is generally considered as mainly originated from natural lithogenic sources (rock weathering of mineral zircon) and has no significant anthropogenic source [17,18]. The classes of the occurrence of elements based on EF and CF are illustrated in Table 1.

3.2. TOC Analysis and Open-System Pyrolysis

Organic geochemical analysis was carried out for seven (7) samples. A cut of each sample was thoroughly washed in cold water and any large quantities of contaminants were removed. The sample was air dried at room temperature to prevent loss of free hydrocarbons, and subsequently crushed to a homogeneous powder and passed through a 40 mm-mesh sieve. Total Organic Carbon (TOC) determination was carried out according to the following procedures. Between 20.0 and 200.0 mg of pulverized rock were accurately weighed into a Pyrex beaker and reacted with 10% (vol.) concentrated HCl to dissolve carbonate mineral species. The acid mixture was heated to 70 °C to remove dolomite if present. Once the reaction was complete, the sample was transferred to a microfiber filter paper using a Millipore filter apparatus. The filter paper was then transferred to a LECO crucible and dried. An accelerator was added, per manufacture’s recommendation, and the sample was combusted in a LECO model C230 apparatus in an oxygen atmosphere to produce CO2. Moisture and particulate matter were filtered out and the CO2 gas was measured by a solid-state infrared (IR) detector.
The samples were also crushed and pulverized into fine powder, whereby an aliquot of ca. 60 mg of powdered fractions was analyzed through a Rock-Eval 6® instrument. The samples were analyzed using the Basic/Bulk-Rock method to measure the group of parameters, including TOC, S1 (free hydrocarbons), S2 (thermally cracked hydrocarbons), S3 (CO and CO2), S4 (CO and CO2), and S5 (mineral carbon), Tmax (temperature at maximum S2), along with other calculated parameters of hydrogen index (HI), oxygen index (OI), and production index (PI). Combustion of samples occurred in a nitrogen atmosphere, whereby the released hydrocarbons were measured by an IR detector. Pyrolysis analysis started with 300 °C isothermal stage for 3 min that followed by a gradual temperature increase up to 650 °C by 25 °C/min [19,20,21,22].

3.3. Palynology

The basic aim of the palynofacies analysis investigation is to determine the nature of the disseminated organic constituents or organic matter (OM), sedimentation conditions, and paleo-environmental conditions prevailed during the deposition of the investigated samples. For palynofacies and organic petrographic analysis, the sample was split into two portions. The first portion was crushed to about 1 mm grain size and digested in acids (HCl 10% and HF 40%, respectively) to remove the minerals [23]. The residue was used to examine palynofacies and to observe the organic particles.

3.4. Organic Petrography

The second portion was crushed to about 2 and 1.5 cm size grains. About 10 g of the grains were crushed to ca. 840 µm (−20 mesh) and well-mixed with an epoxy resin and hardener. The polished pellets were then ground by a combination of 320 µm and 600 µm cloths. This was followed by a polishing of surfaces by alumina powder and water with two stages of 0.3 µm and 0.05 µm, respectively. A Zeiss Axio Imager® A2m reflected light microscope was used to investigate the pellets, which equipped with a UV light source and a digital camera. Oil immersion objective of 50× (noil = 1.514 at 23 °C) provided a magnification of 500×, was used for reflectance measurements. Random reflectance values on primary vitrinite and bitumen were measured using a glass standard having Ro% of 0.477. For further details of sample preparation techniques, the reader can refer to the International Organization for Standardization (ISO) standards [24,25] and to the Amer- ican Society for Testing and materials (ASTM) [26].

4. Results and Discussion

4.1. Mineralogy and SEM

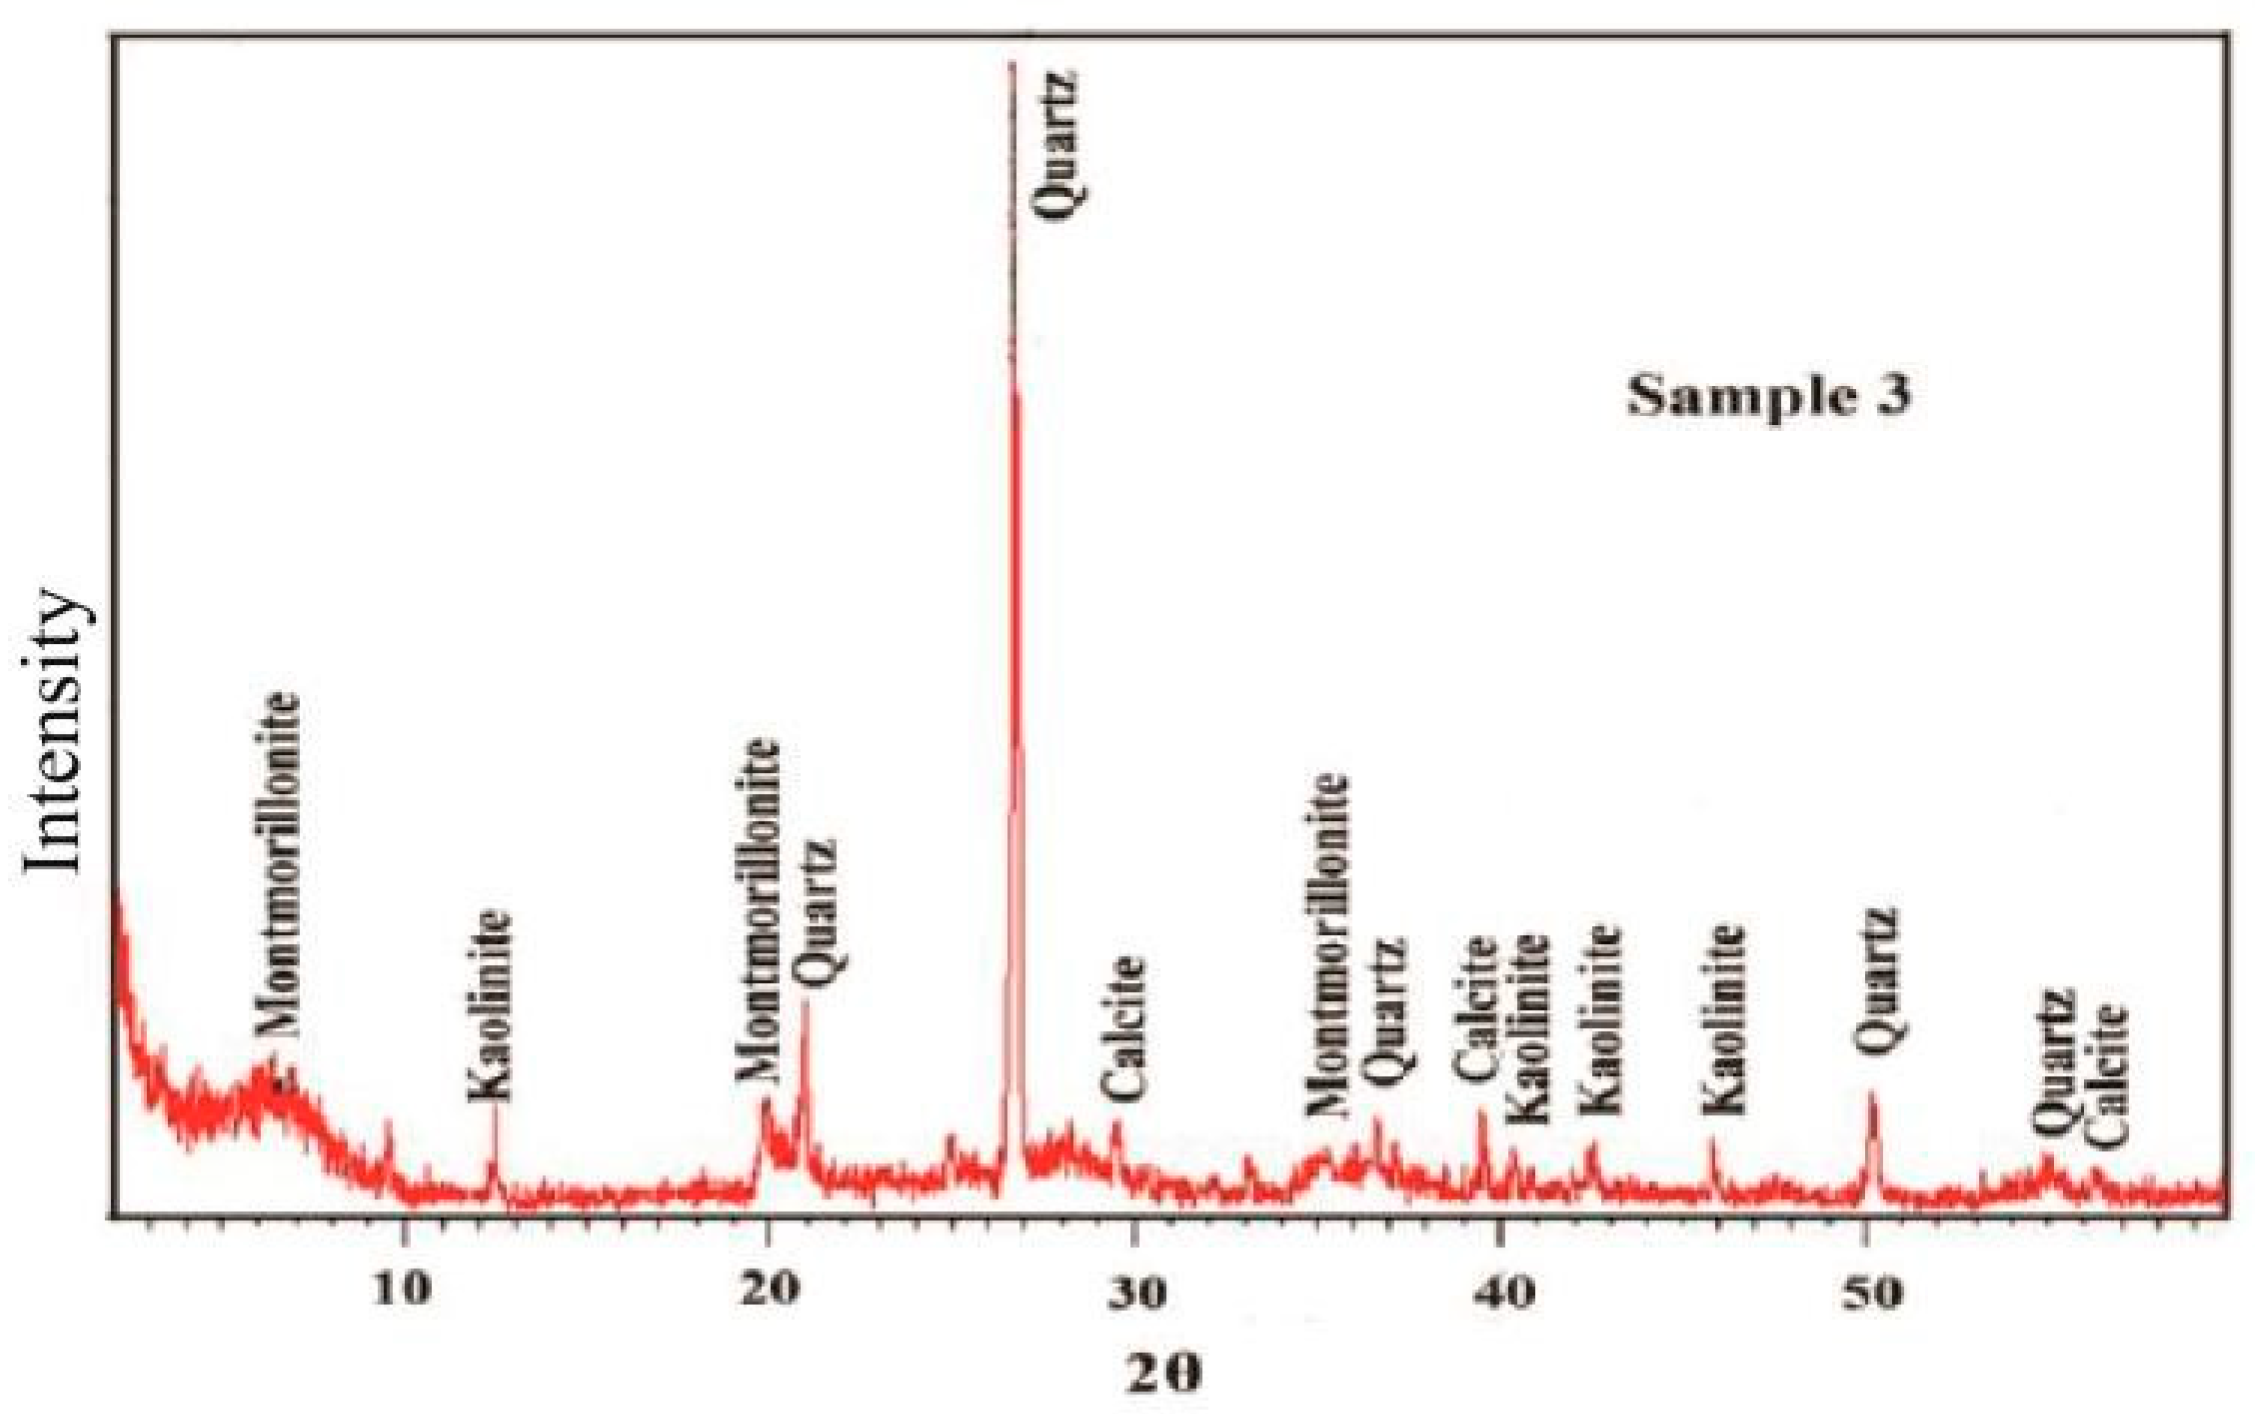
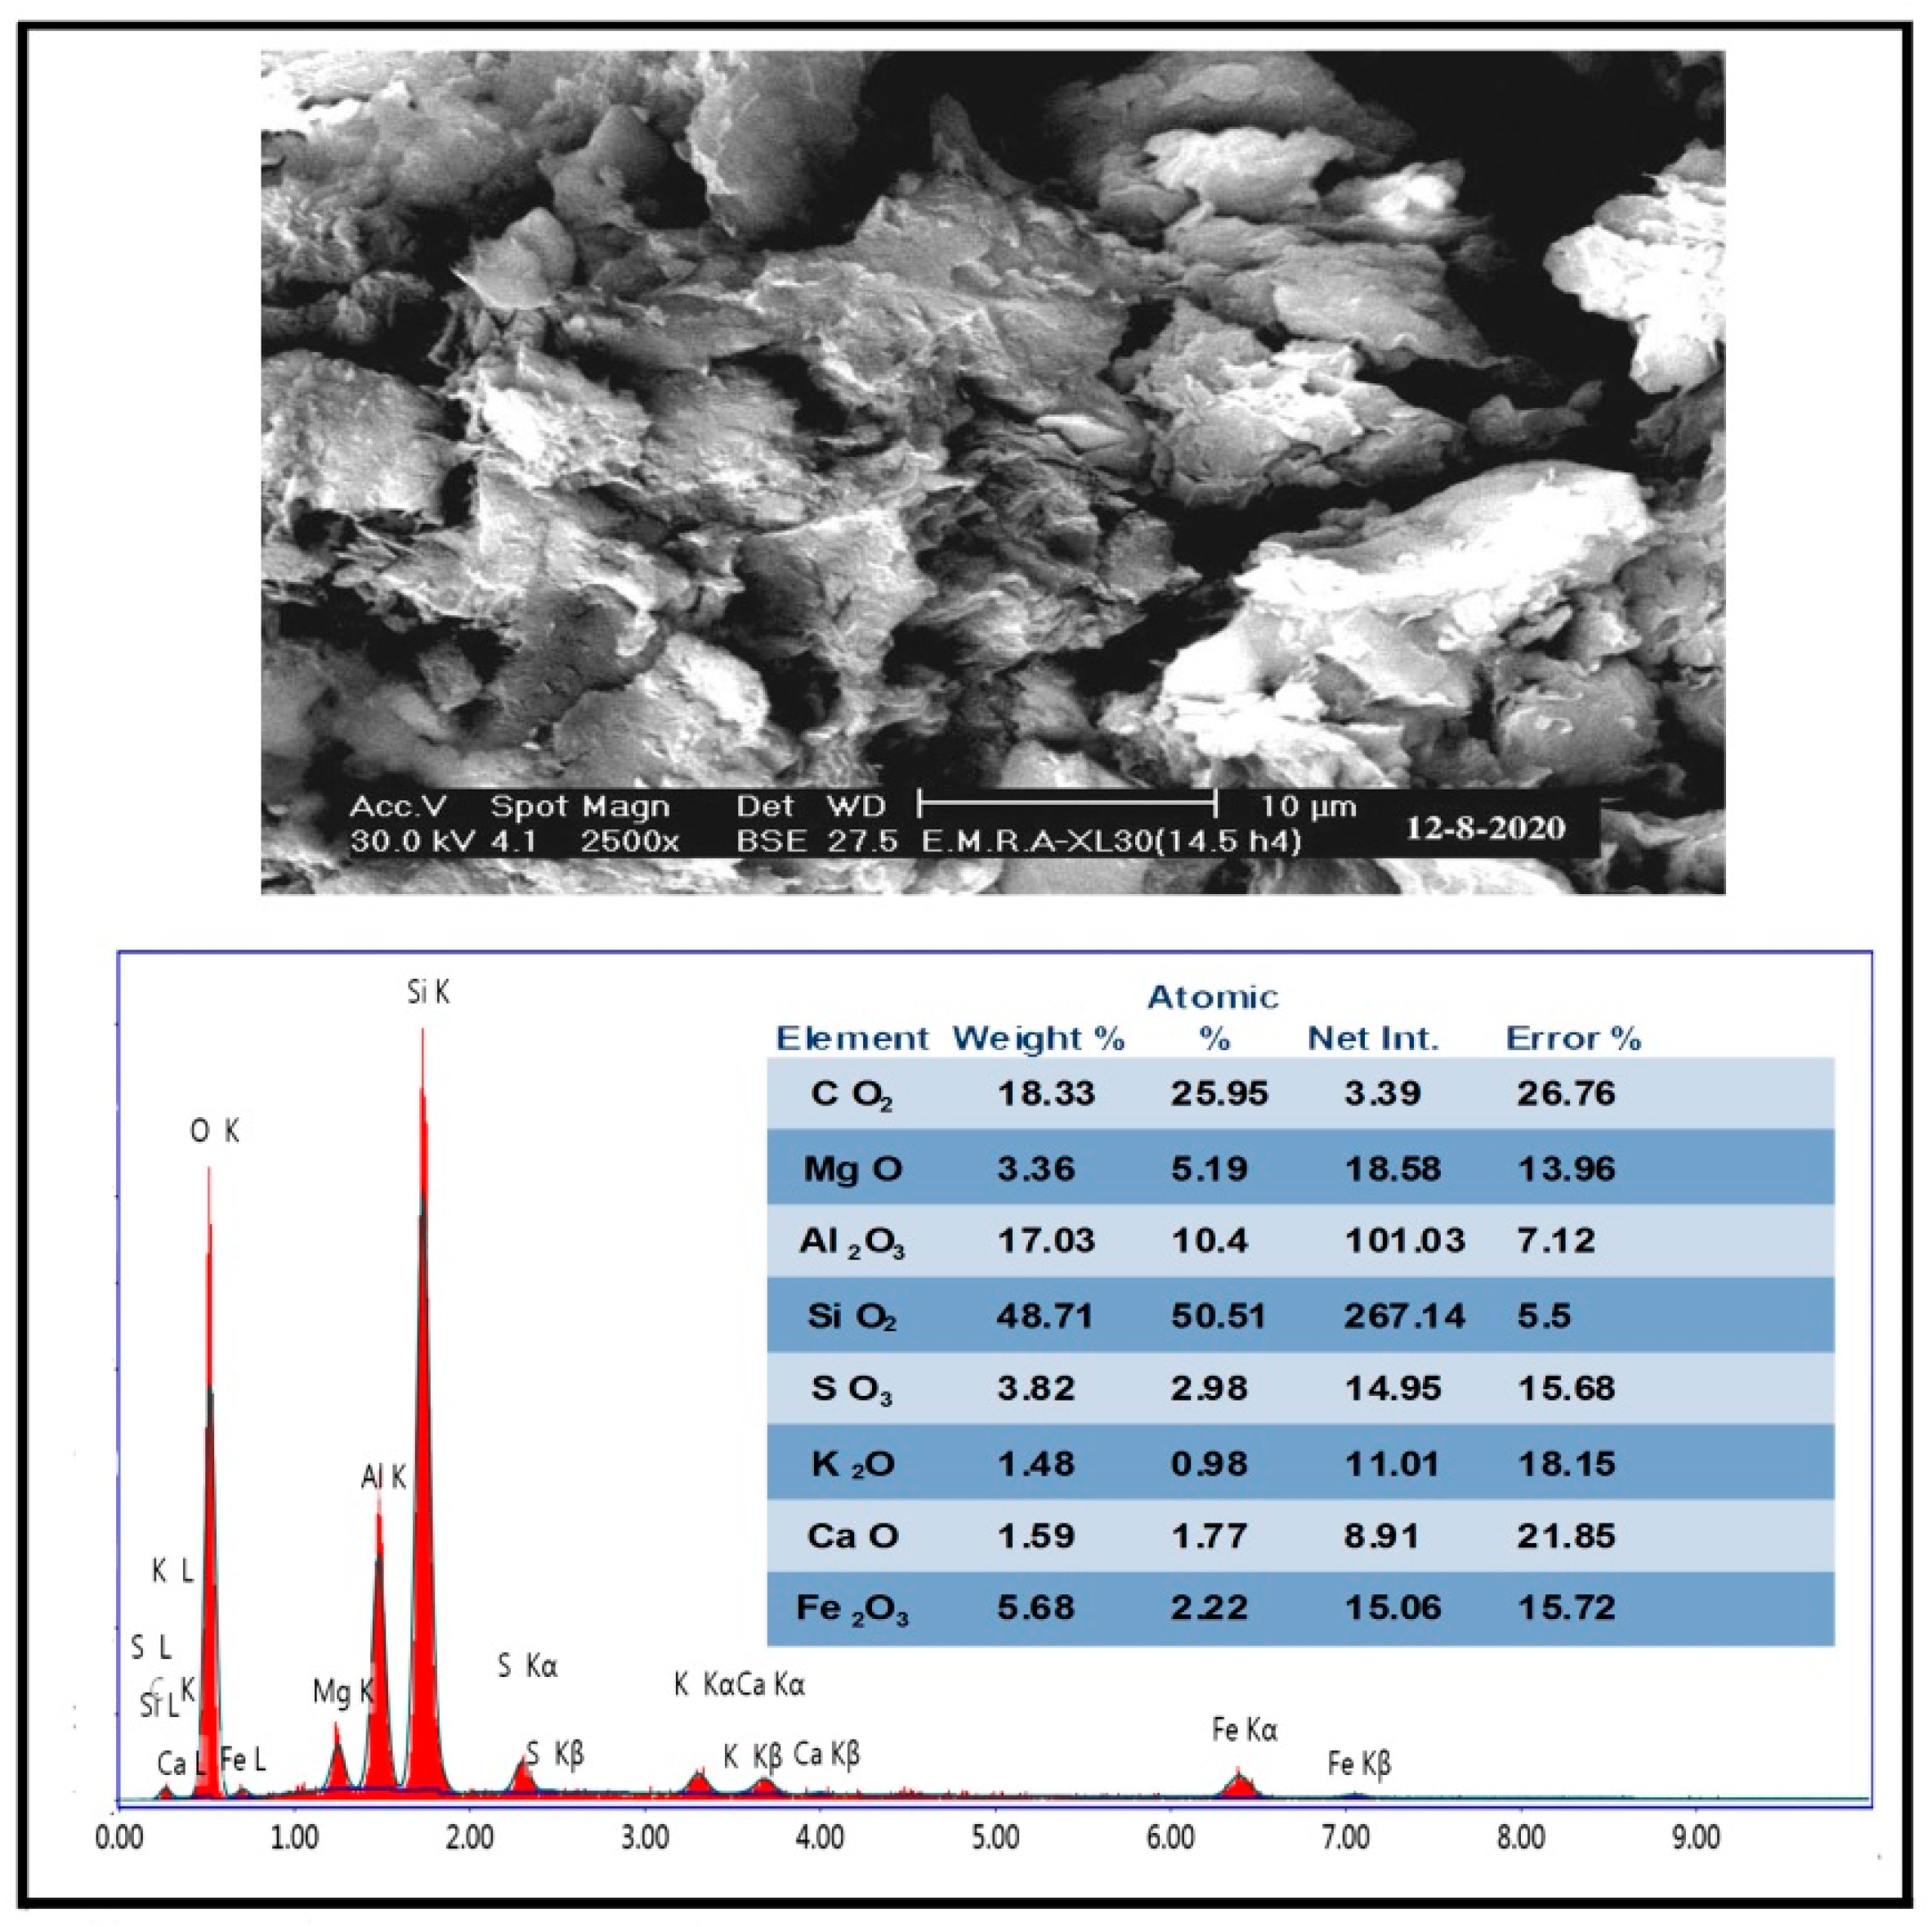
The minerals identified by X-ray diffraction in the El Sebaiya black shale samples are quartz (50%), calcite (10%), and clay minerals (40%). Clay minerals are composed of kaolinite (25%) and montmorillonite (15%) (Figure 3). The crystallinity characters of the investigated clay minerals, as reflected from the shape of their diffraction peaks, indicate moderate to high status of crystallinity. Most of the analyzed samples show moderately to well-developed sharp diffraction peaks. Montmorillonite generally has a marked moderate crystallinity. On the other hand, kaolinite exhibits moderate to high degree of crystallinity. The results obtained from the SEM investigation support those recorded from XRD patterns (Figure 4).
SEM examination of the shale samples showed coarse to medium sized particles and aggregates, and moderately crystallized kaolinite (Figure 4). The morphology and crystallinity character of the recorded clay minerals as the shape and the edges of the particles of clay minerals revealed that they are of detrital origin. This was confirmed with the XRD analysis as their diagram displayed intense and sharp peaks. The clay minerals recorded are like those identified by Abou El-Anwar and Samy [27].

4.2. Inorganic Geochemistry

4.2.1. Major and Trace Elements

Generally, the most abundant elements in the black shale samples are Si, Al, and Fe. Their corresponding oxides, namely SiO2, Al2O3, and Fe2O3 are shown in Table 2. This suggests that the main mineral components are clay minerals and quartz, as identified by XRD analysis. Sulfur represents the next most abundant element, ranging from 0.14 to 5.75% and averaging 3.16%. Calcium, K, Na, Mg, Ti and P are the third most abundant group of elements (Table 2). The El Sebaiya black shale samples show great loss on ignition (11.66%–16.62%) with an average of 14.02% (Table 2). This suggests that silica, alumina, and iron make up the non-LOI (Loss-On-Ignition) components (average 54.16%, 13.95% and 6.35%; respectively) (Table 2). The concentration of P is used for interpreting paleo-redox conditions through the TOC/P ratio calculation [28] (TOC=Total Organic Carbon). TOC/P ratio values of <10, 10–150, and >150 indicate oxic, dysoxic, and anoxic conditions, respectively [29]. The calculated TOC/P ratio in our samples is <10 (Table 2) indicating oxic conditions.
Immobile elements such as Al, Fe, Ti, Cr, Th, Pd, Sc, Co, Zr, Nb, Y, Ga and Se, are important indicators of provenance, such as weathering, transportation, and sorting [30]. Strong and moderate positive correlations between Al2O3 and Fe, Ti, Co, Cu, Zr and Pb (r = 0.62, 0.71, 0.80, 0.79 and 0.36; respectively) (Table 3) revealed that these elements were accumulated by weathering processes [31,32,33,34]. The Al/Si ratio of the studied black shale samples is low (0.2–0.28), which indicates that Si has another source in addition to clay minerals.
Uranium content in the studied samples varied from 1.5 to 4.8 ppm. As a result, these samples can be classified as uraniferous black shale. Generally, U in marine black shales is accumulated from sea water and may be deposited in a hydrogen sulfide environment [35]. Arning et al. [36] stated that the U/Mo ratio can be used to distinguish between anoxic non-sulfidic and anoxic sulfidic conditions. The low U/Mo ratios obtained (average 0.28, Table 2) indicate that the black shales in the El Sebaiya mine (Nile Valley) formed in an anoxic sulfidic environment [37]. Strong positive correlations were obtained between U and Cr, Mo, Ni, and Zn (r = 0.97, 0.96, 0.6 and 0.56; respectively) and a moderate correlation with V (r = 0.32). Thus, U may be freed during weathering, be immobile and become fixed quickly in new phases [37,38]. Uranium is strongly positively correlated with P and Si (r = 0.77 and 0.84; respectively). Thus, it can also be associated with phosphates and sand grains. Bots and Behrends [39] and Bata [40] stated that U may be coupled with heavy metals and trace elements during chemical weathering under anoxic conditions.
Black shales are commonly rich in trace elements relative to global crustal averages in concentrations such that economic extraction is viable [41,42]. The enrichment of the studied shale with trace elements was evaluated by EF and CF (Table 4). The calculated EF values demonstrate that Cd is the only enriched element in the black shale sediments of the study area. on the other hand, all the other trace elements show depletion with respect to UCC. The depletion of these elements was likely the result of weathering. The enrichment of black shale with Cd was confirmed by the very high CF values (>6). These results add economic value to the studied black shale through the extraction of Cd.

4.2.2. Distribution of Trace Elements and Redox Conditions

The values of Zr, Cd, Zn, Pb, V, U, Th, and Mo in the studied samples are higher than those in the Upper Continental Crust (UCC) [14] and the Post Archaean Australian Shale (PAAS) [28] (Figure 5).
Moderately positive correlations between Ni, V, Cu and Cr with Mo (r = 0.66, 0.49, 0.25 and 0.21; respectively) point out to the important function of the dolomitization process in the accumulation of these elements in the studied samples (Table 3). The occurrence of Pb, Zn, Cu, Ni, Cd, Mo, and Co in the samples indicates the role of hydrothermal solutions in the study area [43].
Authigenic U and some trace elements and their ratios can be signifying the redox environment of rocks [28,29,44]. The V/Ni ratio (average 2.43) in the studied El Sebaiya black shale indicates that they were deposited under a dysoxic to oxic environment with terrigenous organic matter mixed with marine organic matter (Table 2). However, the ratios: Ni/Co (2.74), V/Cr (1.12), and V(V + Ni) = 0.53 indicate mainly oxic conditions [29,45,46]. Thus, the results point to an oxic to anoxic environment in which the studied black shales were deposited [37,47]. The above ratios should be used with caution when weathering is suspected because some elemental abundance ratios that are used as environmental proxies, including U/Th, Ni/Co and V/Cr, could be altered [29].
A moderate positive correlation (r = 0.54) between Sr and Fe2O3 revealed that the studied samples were deposited under the effect of bacterial activity (Table 3), which agrees with Abou El-Anwar [32,48,49,50,51,52,53] and Abou El-Anwar et al. [54,55,56]. This is supported by the low TOC content (Table 5), which is typical of such environments.
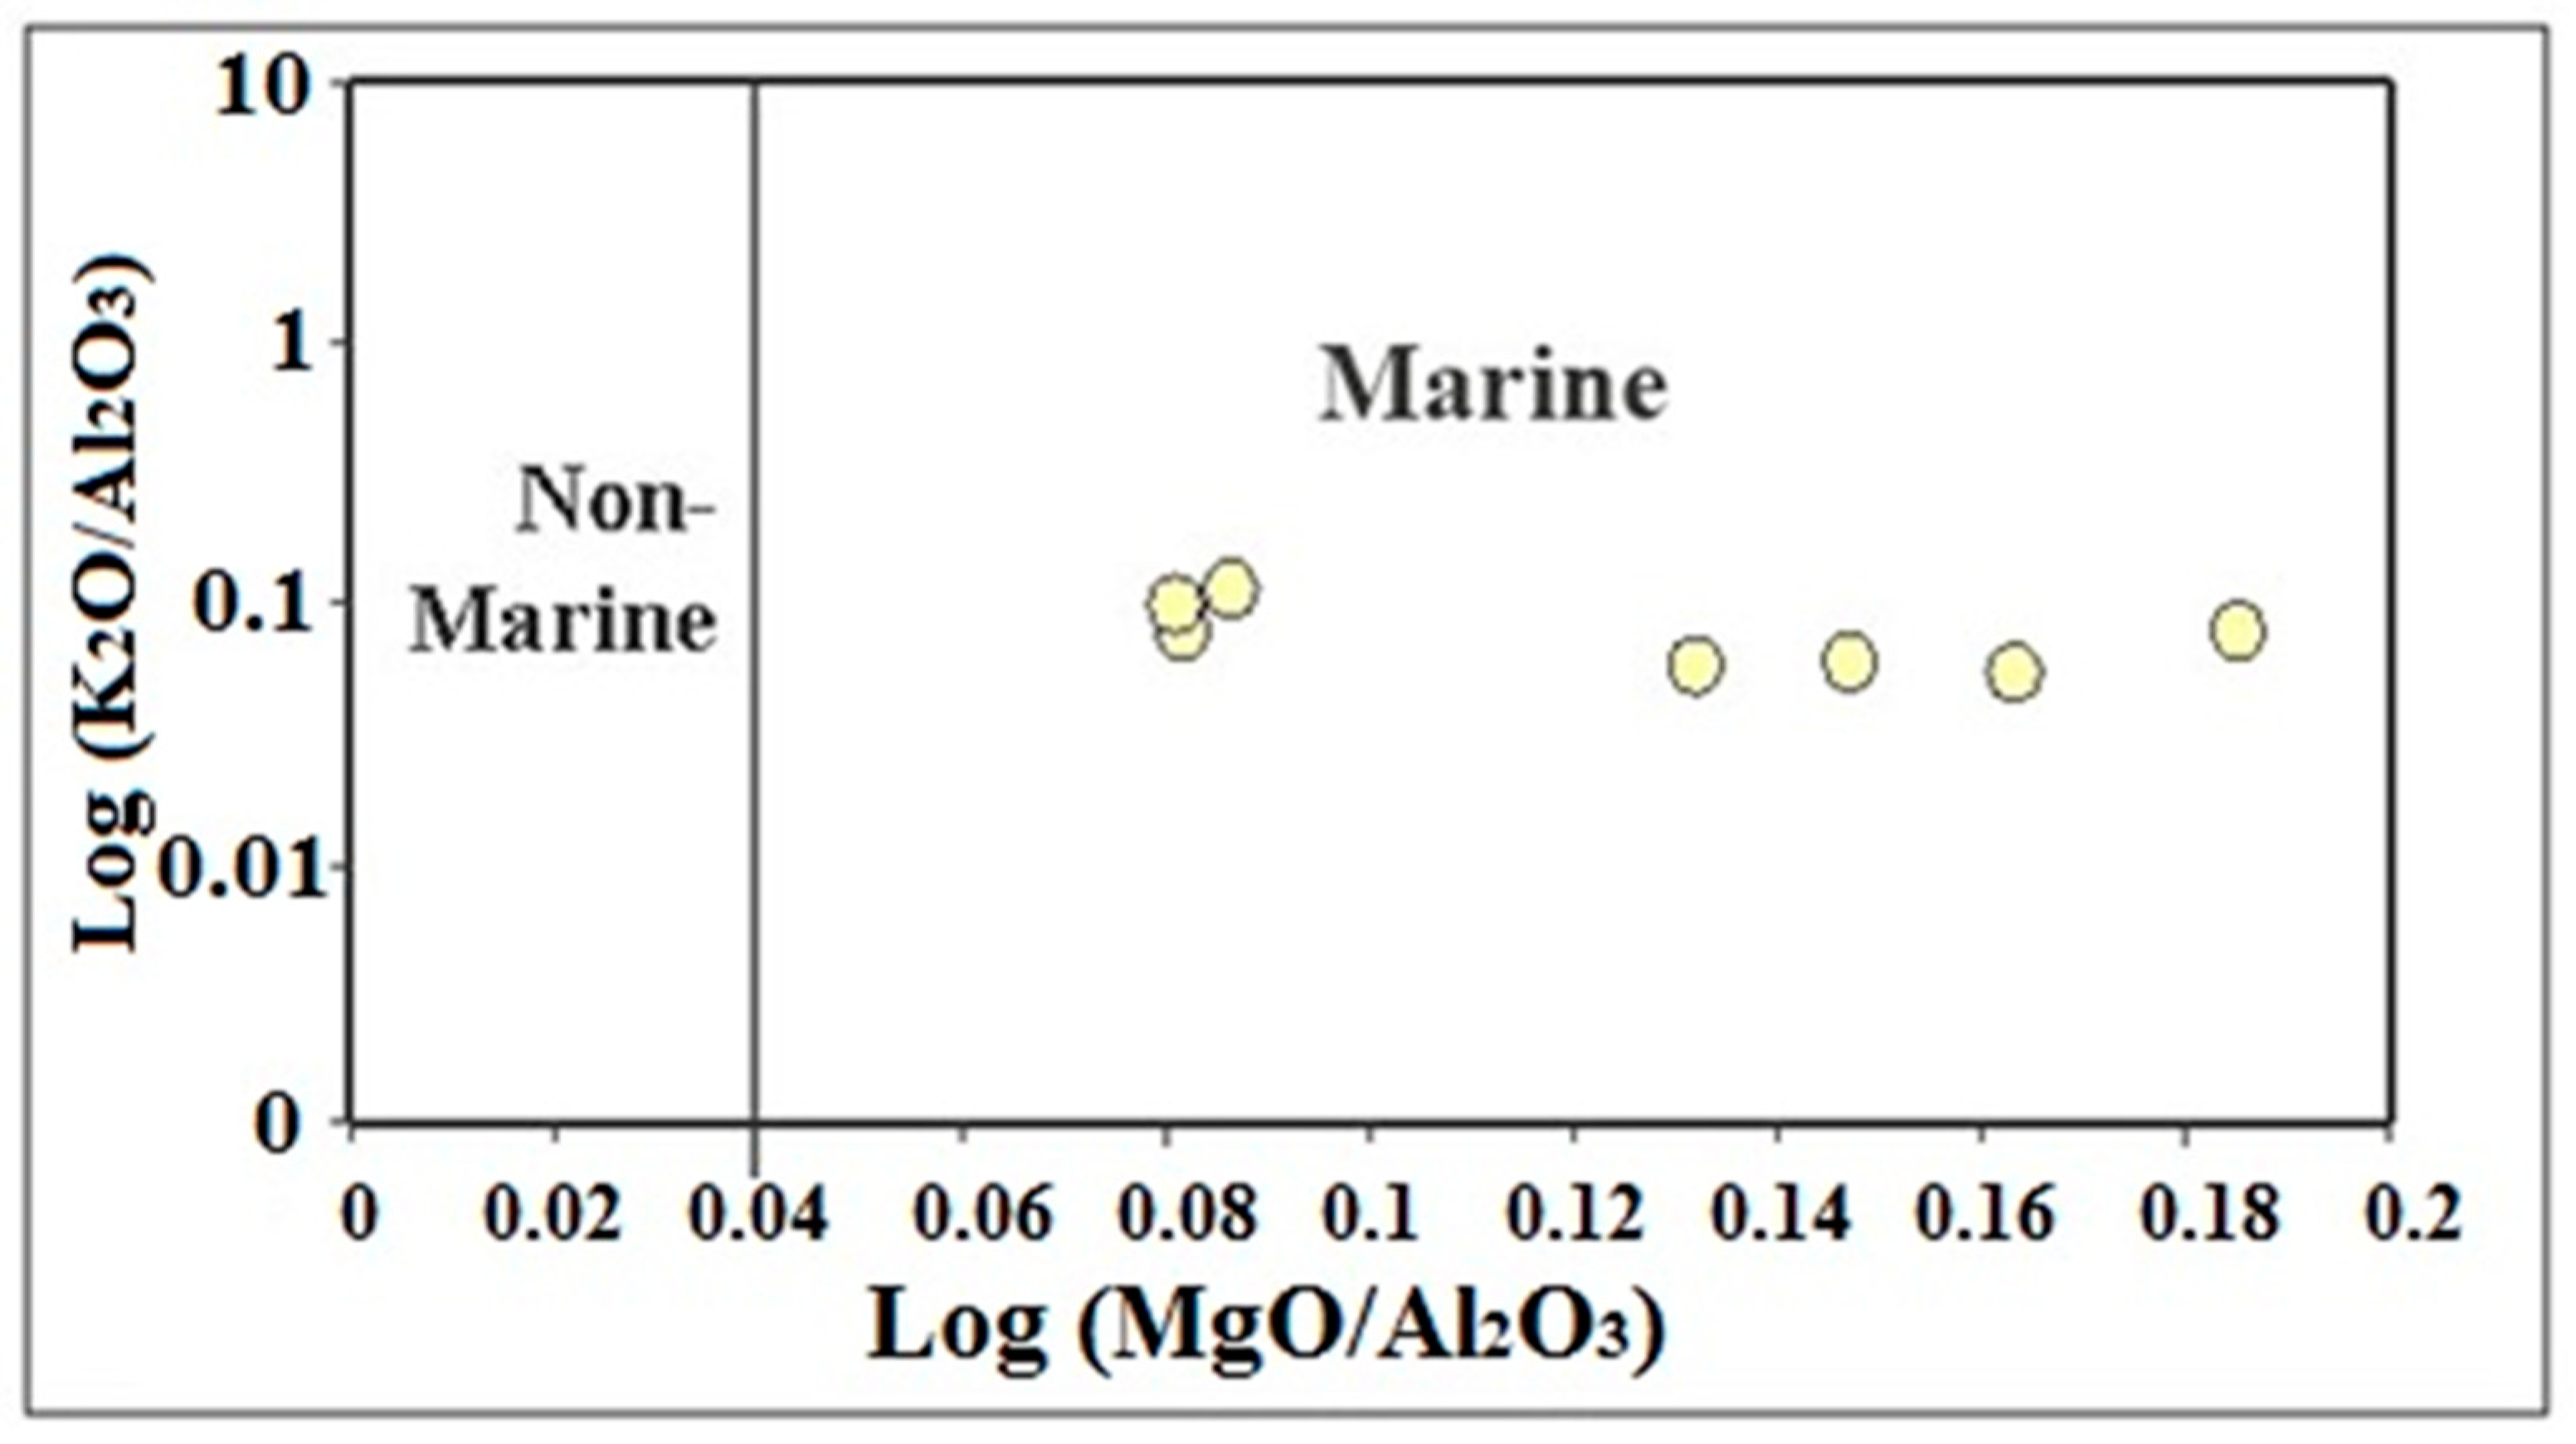
Roaldset [57] concluded that the relationship between K2O/Al2O3 and MgO/Al2O3 can be used to differentiate between marine and non-marine sediments. Applying this relationship (Figure 6) revealed that all studied black shale samples plot in the marine water field, in agreement with Abou El-Anwar and Samy [27] and Abou El-Anwar et al. [51]. Al2O3 is a significant indicator for the extent of detrital influx. The low values of the K2O/Al2O3 ratio (0.07 to 0.09) are attributed to the marked presence of kaolinite. The positive correlation of Al2O3 with TiO2 (r = 0.71) suggests that TiO2 is a necessary trace constituent of clay minerals. The positive correlation (r = 0.57) between Al2O3 and K2O can be explained by the occasional presence of illite, which was not detected by XRD.
Hayashi et al. [58] mentioned that the Al2O3/TiO2 ratio increases from 3 to 8 for mafic, from 8 to 21 for intermediate, and from 21 to70 for felsic igneous rocks. In the studied El-Sebaiya black shale, the values of Al2O3/TiO2 range from 9.59 to 19.95, average 15.39 (Table 2), which suggests inheritance from intermediate rocks.
Cox et al. [59] emphasized that the K2O/Al2O3 ratio of sediments can be used as a marker of the origin composition of early sediments. K2O/Al2O3 ratios in the alkali feldspars range from 0.3 to 0.9, in illite the ratio is about 0.3, and in other clay minerals it is almost zero. K2O/Al2O3 > 0.5 suggests the presence of alkali feldspars as compared to other minerals in the original shales. K2O/Al2O3 ˂ 0.3 suggests minimal alkali feldspar contents. In the studied black shales samples, the K2O/Al2O3 ratio ranges from 0.07 to 0.09 and averages 0.08 (Table 2), which suggests the presence of traces of K-feldspars.
P2O5, Cr, Zn, Mo and U have strong positive correlations with total organic matter (r = 0.72 to 0.82), which indicates that these elements are mostly associated with organic matter, and a moderate one with Ni (r = 0.43). Positive correlations between Al2O3 with Fe2O3, Na2O and K2O (r = 0.62, 0.81 and 0.57; respectively) revealed that these elements are associated with clay minerals. Manganese, Co, Cu, Rb, Pd, Zr and La have strong positive correlations with Al2O3 indicating that these trace elements are associated with clay minerals.
TiO2 has strong positive correlation coefficients with Al2O3, Fe2O3, K2O, and SO3, (r = 0.71, 0.72, 0.40, 0.94 and 0.67; respectively), which suggests an association with clay and sulfide minerals. Additionally, SO3 showed strong to moderate correlations with Rb, Pd, Zr, La and Cd (r = 0.81, 0.59, 0.68, 0.45 and 0.45; respectively), thus indicating that these elements can be related to sulfide minerals.

4.2.3. Paleoclimate

The paleoclimatic conditions can be defined by the Chemical Index Alteration (CIA) [60]:
CIA = 100 × Al2O3/(Al2O3 + CaO + Na2O + K2O)
with CaO coming only from silicates.
Nesbitt and Young [60] and McLennan [61] indicated that 50 to 65% CIA points to weak chemical weathering, 65 to 85% reveals warm and humid climate during moderate chemical weathering, while 85 to 100% suggests a hot and humid climate during strong chemical weathering. CIA values of the investigated black shales varied from 80.78 to 84.61, with an average 82.86% (Table 2). This value suggests that these rocks possibly accumulated during a period of strong intensity chemical weathering. Immobile elements can be used as indicators of origin such as weathering [28]. Hence, the strong positive correlation between Al2O3 and Fe, Ti, Mn, Co, Rb and Zr (r = 0.62., 0.71, 0.75, 0.80, 0.62, and 0.79; respectively, Table 3) as well as a moderate correlation with Cu, Pb and La (r = 0.52, 0.36 and 0.22; respectively) indicate that these immobile elements accumulated because of weathering processes [31]. Weathering processes can also occur after deposition on early diagenetic to late diagenetic stage [29].

4.3. Organic Geochemistry

Seven samples collected from the Duwi Formation in the El Sebaiya area, Nile Valley, were analyzed to determine their organic geochemical characteristics, such as organic richness, hydrocarbon potentiality, and thermal maturity (Table 5).

4.3.1. Organic Richness

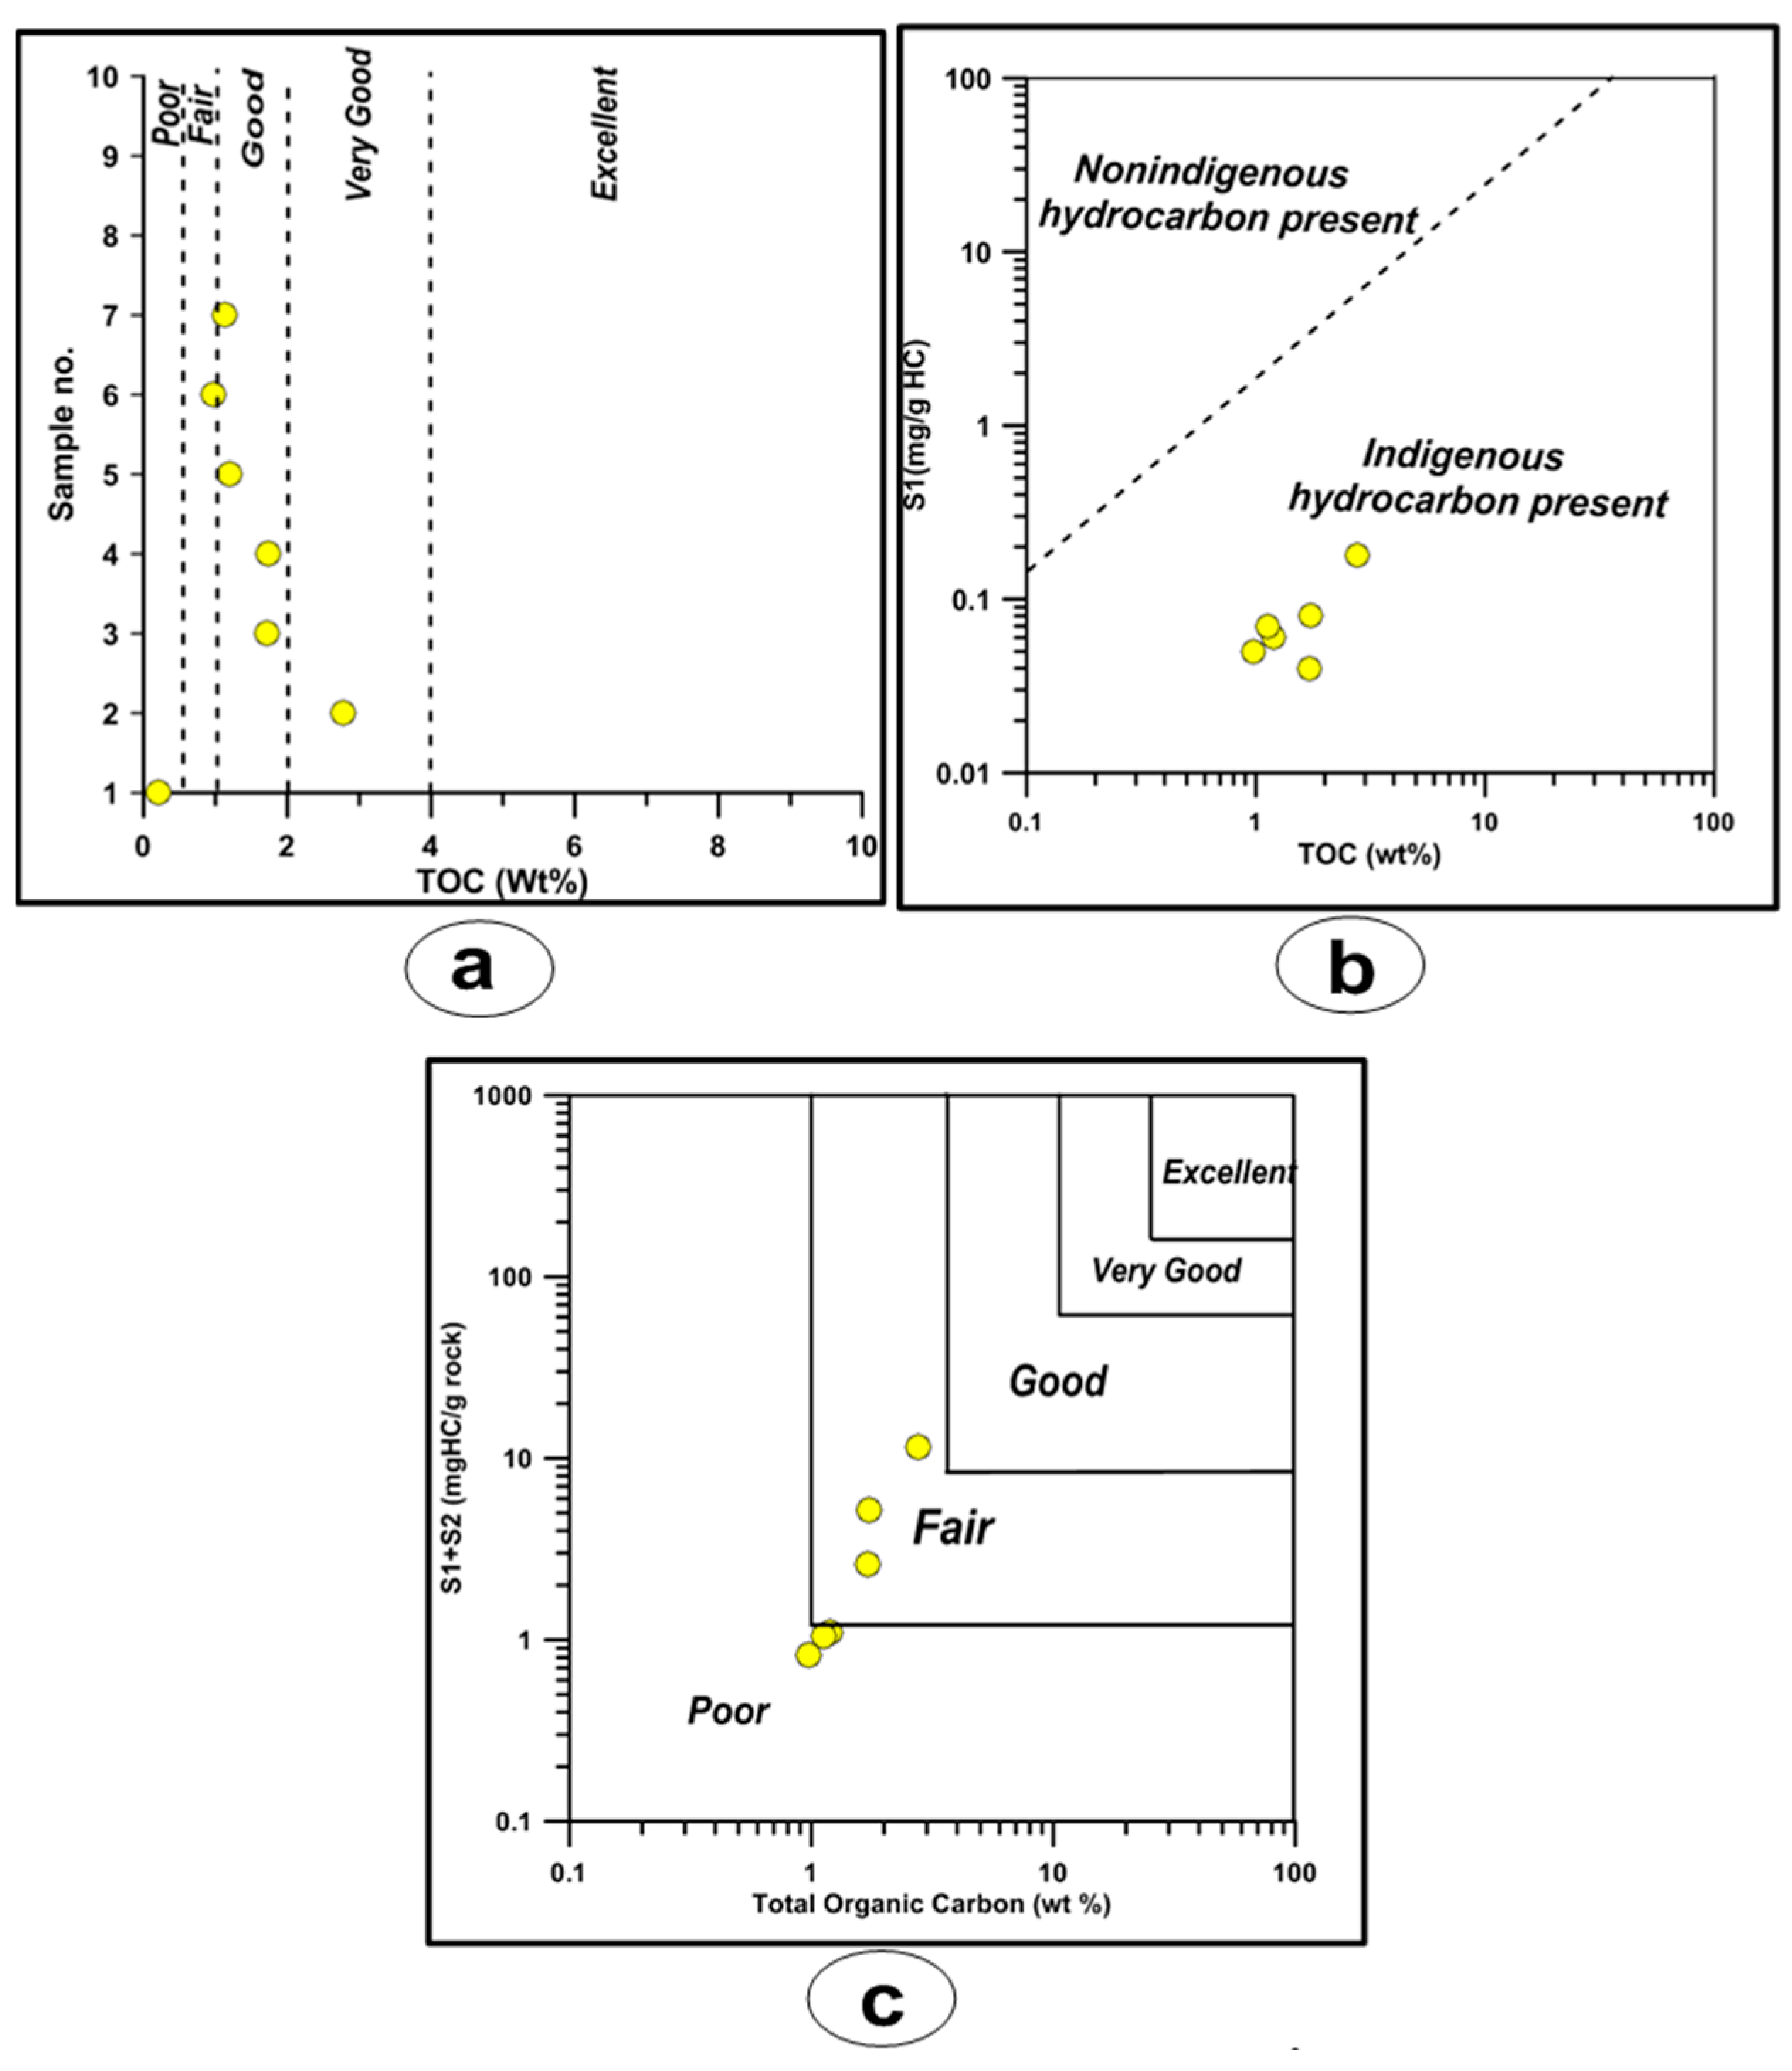
The El Sebaiya samples have total organic carbon (TOC) values ranging from 0.21 to 2.77 wt.%, which indicates poor to good organic content [20] (Table 5 and Figure 7a). The lowest TOC value was recorded in the outcrop layer, owing to the impact of the weathering process. The relationship between TOC wt.% and S1 can determine the origin of hydrocarbons present, whether they are indigenous or non-indigenous [62]. Figure 7b shows that the S1 hydrocarbons in the El Sebaiya samples are indigenous. The hydrocarbon generating potential of a source rock also can be estimated from the relationships between TOC (wt.%) vs. S1 + S2. The El Sebaiya samples have poor to fair hydrocarbon potential according to Dembicki [63] (Figure 7c).

4.3.2. Kerogen Type and Generation Capability

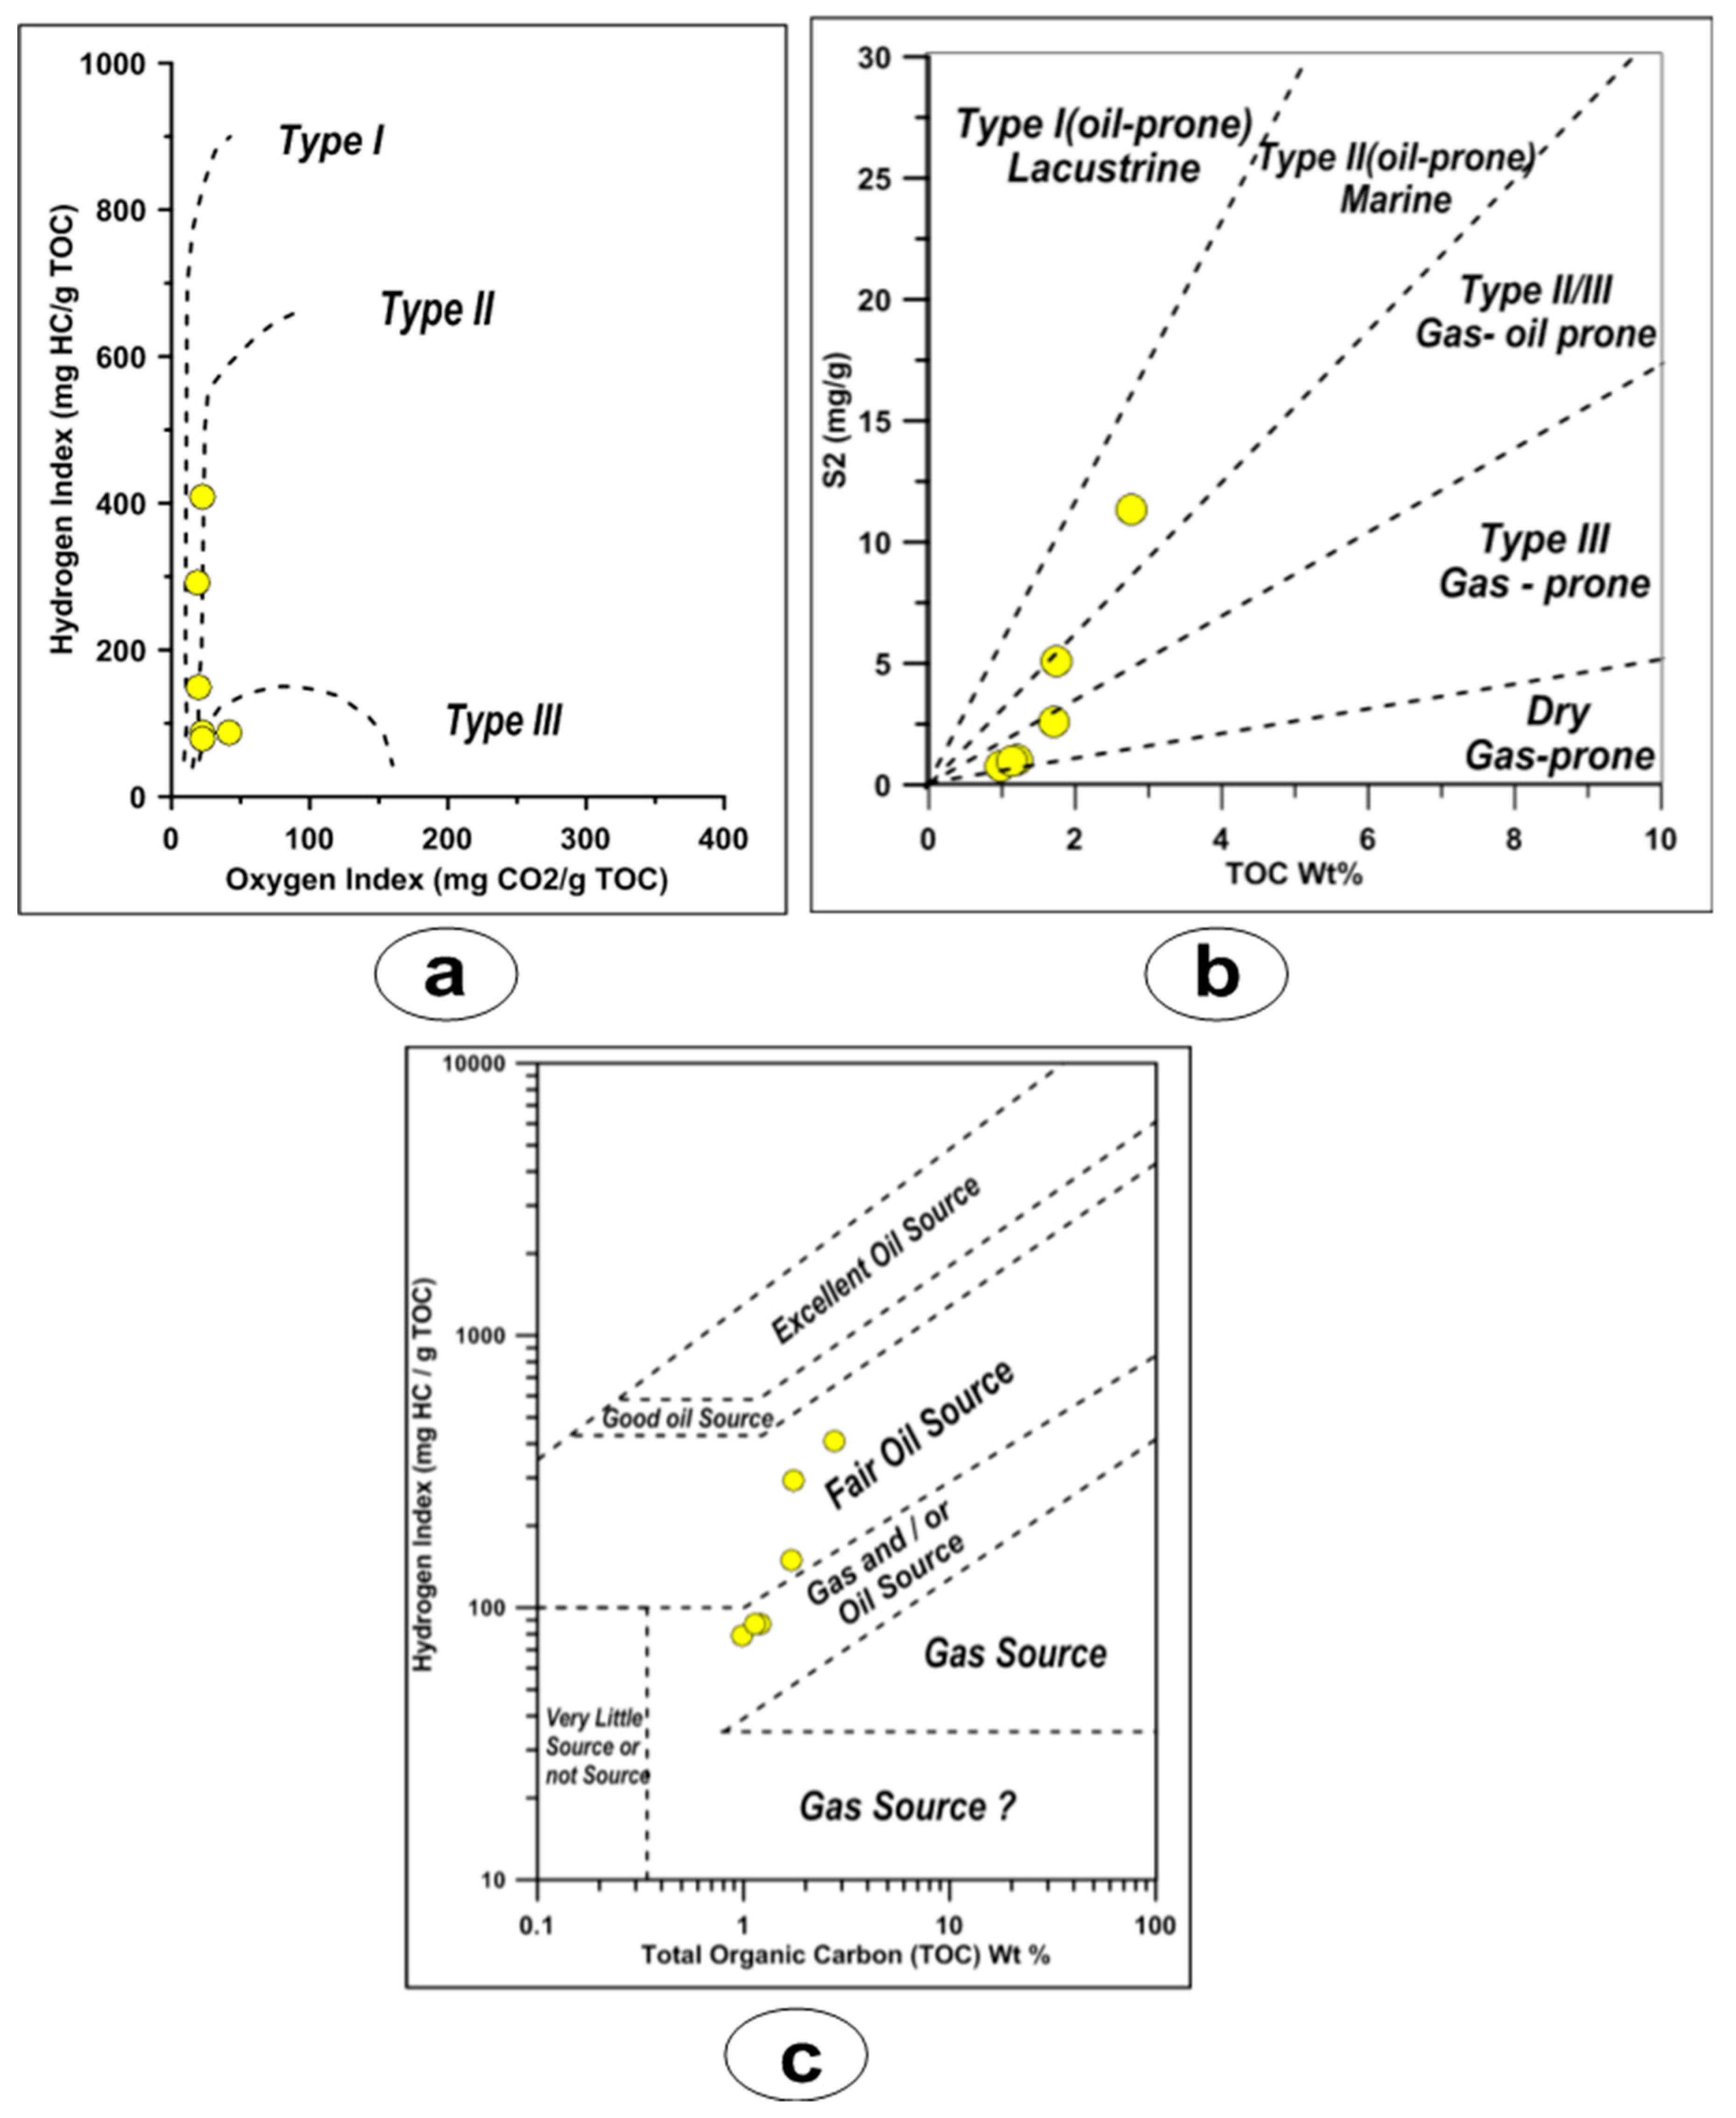
The El Sebaiya samples contain type II/III and type III kerogen, as represented in the modified Van Krevelen diagram [13] (Figure 8a). This is also confirmed by the S2/S3 values, which range from 2.09 to 18.59 (Table 5) [20]. The plot of TOC vs. S2 (Figure 8b) confirmed this and revealed the expected hydrocarbon products will likely consist of a mixture of oil and gas. The plot of TOC vs. HI (Figure 8c [64]) also confirms the above assertion.

4.3.3. Thermal Maturity

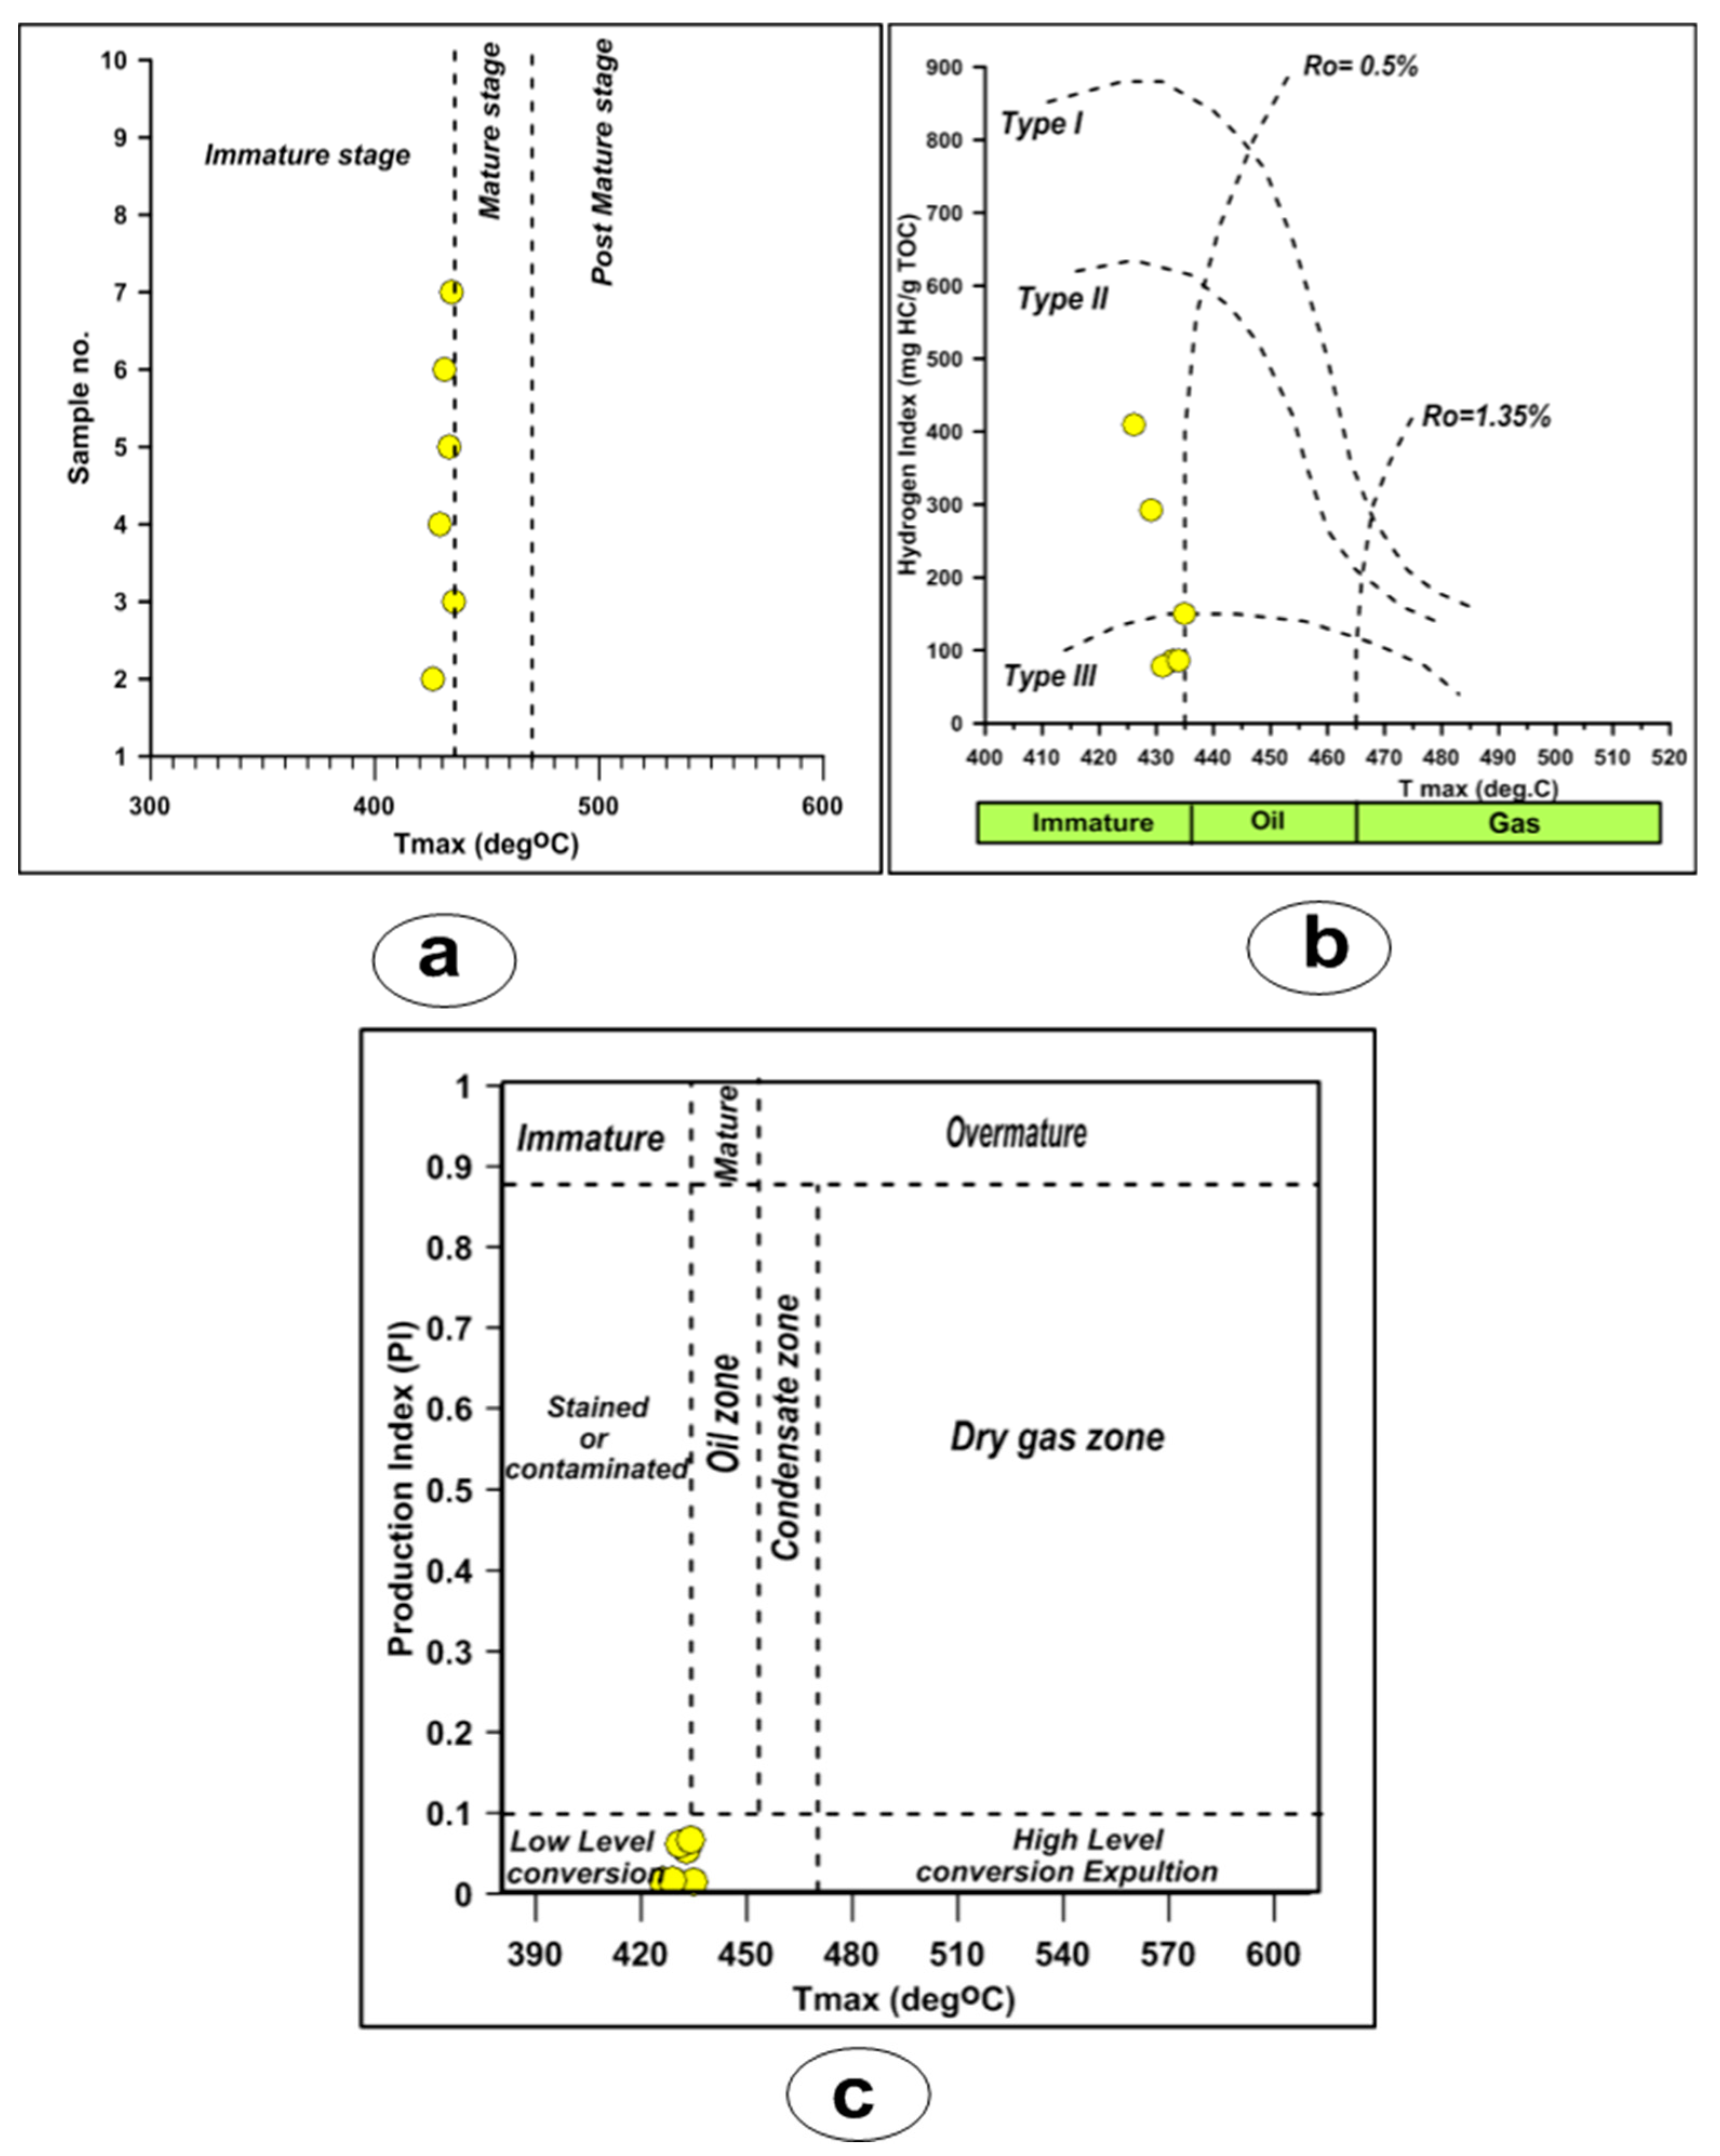
Tmax, Production Index (PI), and Vitrinite Reflectance (%Ro) can be used to evaluate the thermal maturation of El Sebaiya samples. Tmax in the El Sebaiya samples ranges from 426 to 435 °C (Table 5), which indicates that the organic matter is immature to marginally mature (Figure 9a).
According to Espitalié et al. [63], the plot of the hydrogen index versus Tmax of Duwi Formation samples in El Sebaiya (Figure 9b) refers to the control of defined kerogen type based on HI values, as the variation in Tmax is narrow. The above plot confirms the immature to marginally mature nature of the organic matter. This indicates that the organic matter in the shale requires greater maturation to produce oil. Additionally, this conclusion is confirmed by the modified diagram by Langford and Blank-Valleron [65] (Figure 9c), which uses Tmax vs. the production index (PI) values and by the measured vitrinite reflectance (Ro%) values, which are 0.44 to 0.53 (Table 5).

4.3.4. Organic Petrography and Microscopic Composition of Organic Matter

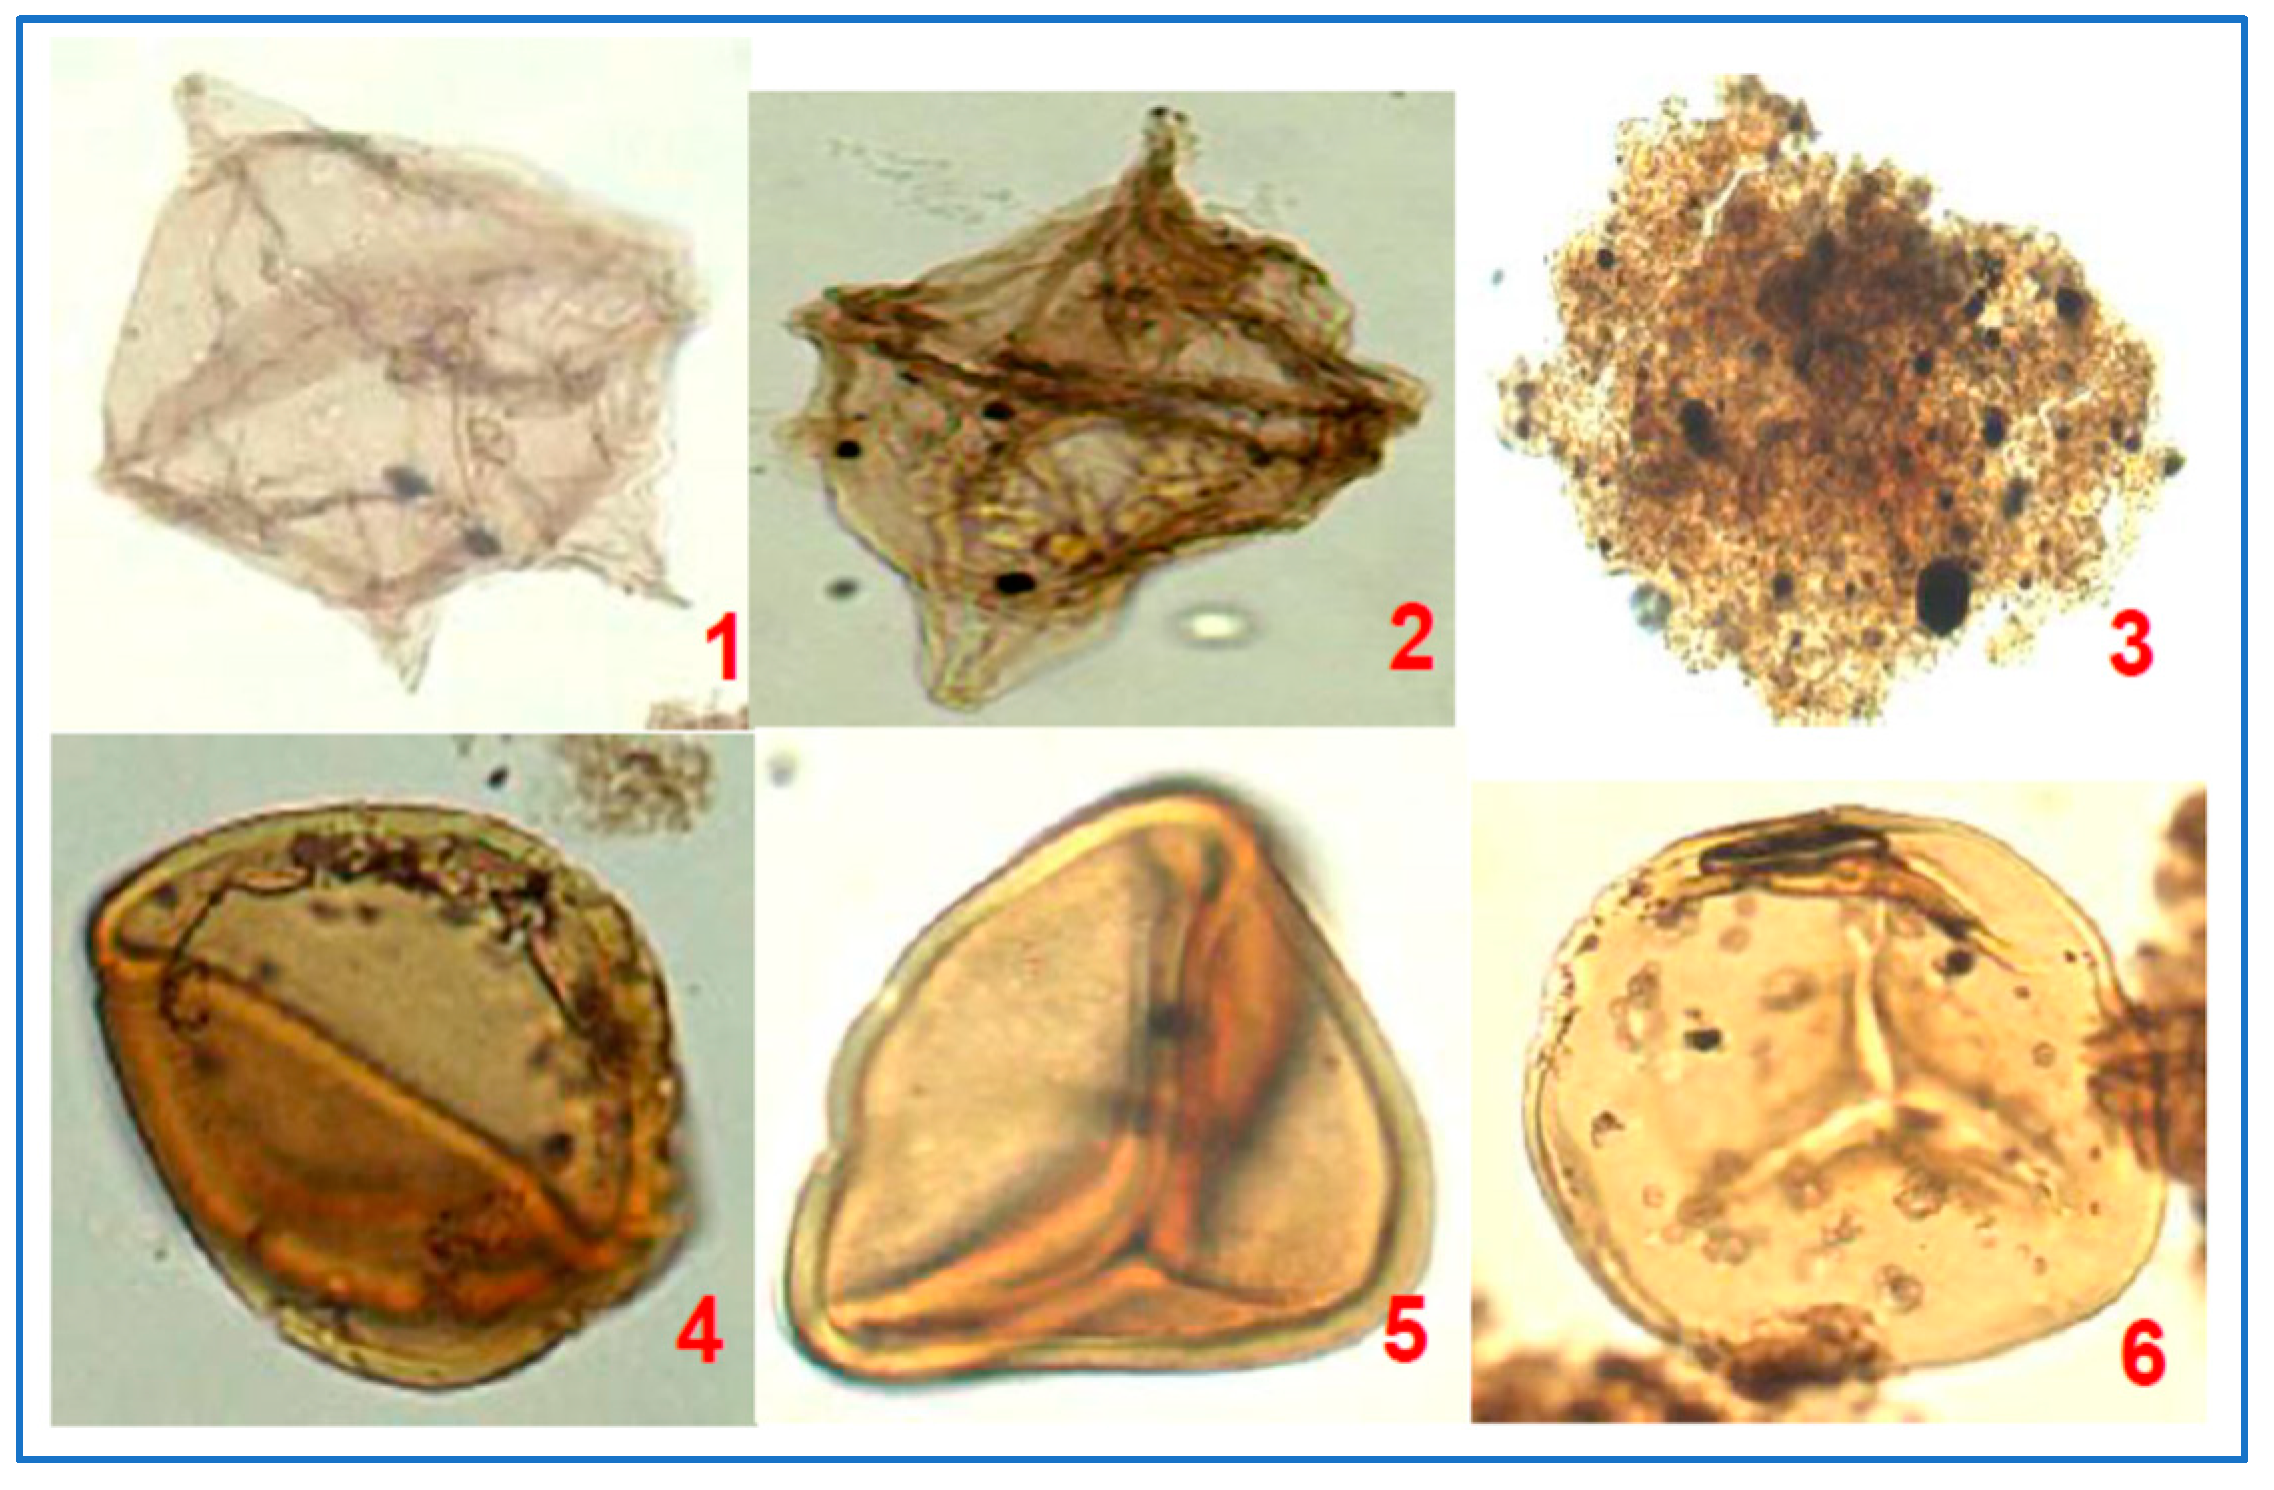
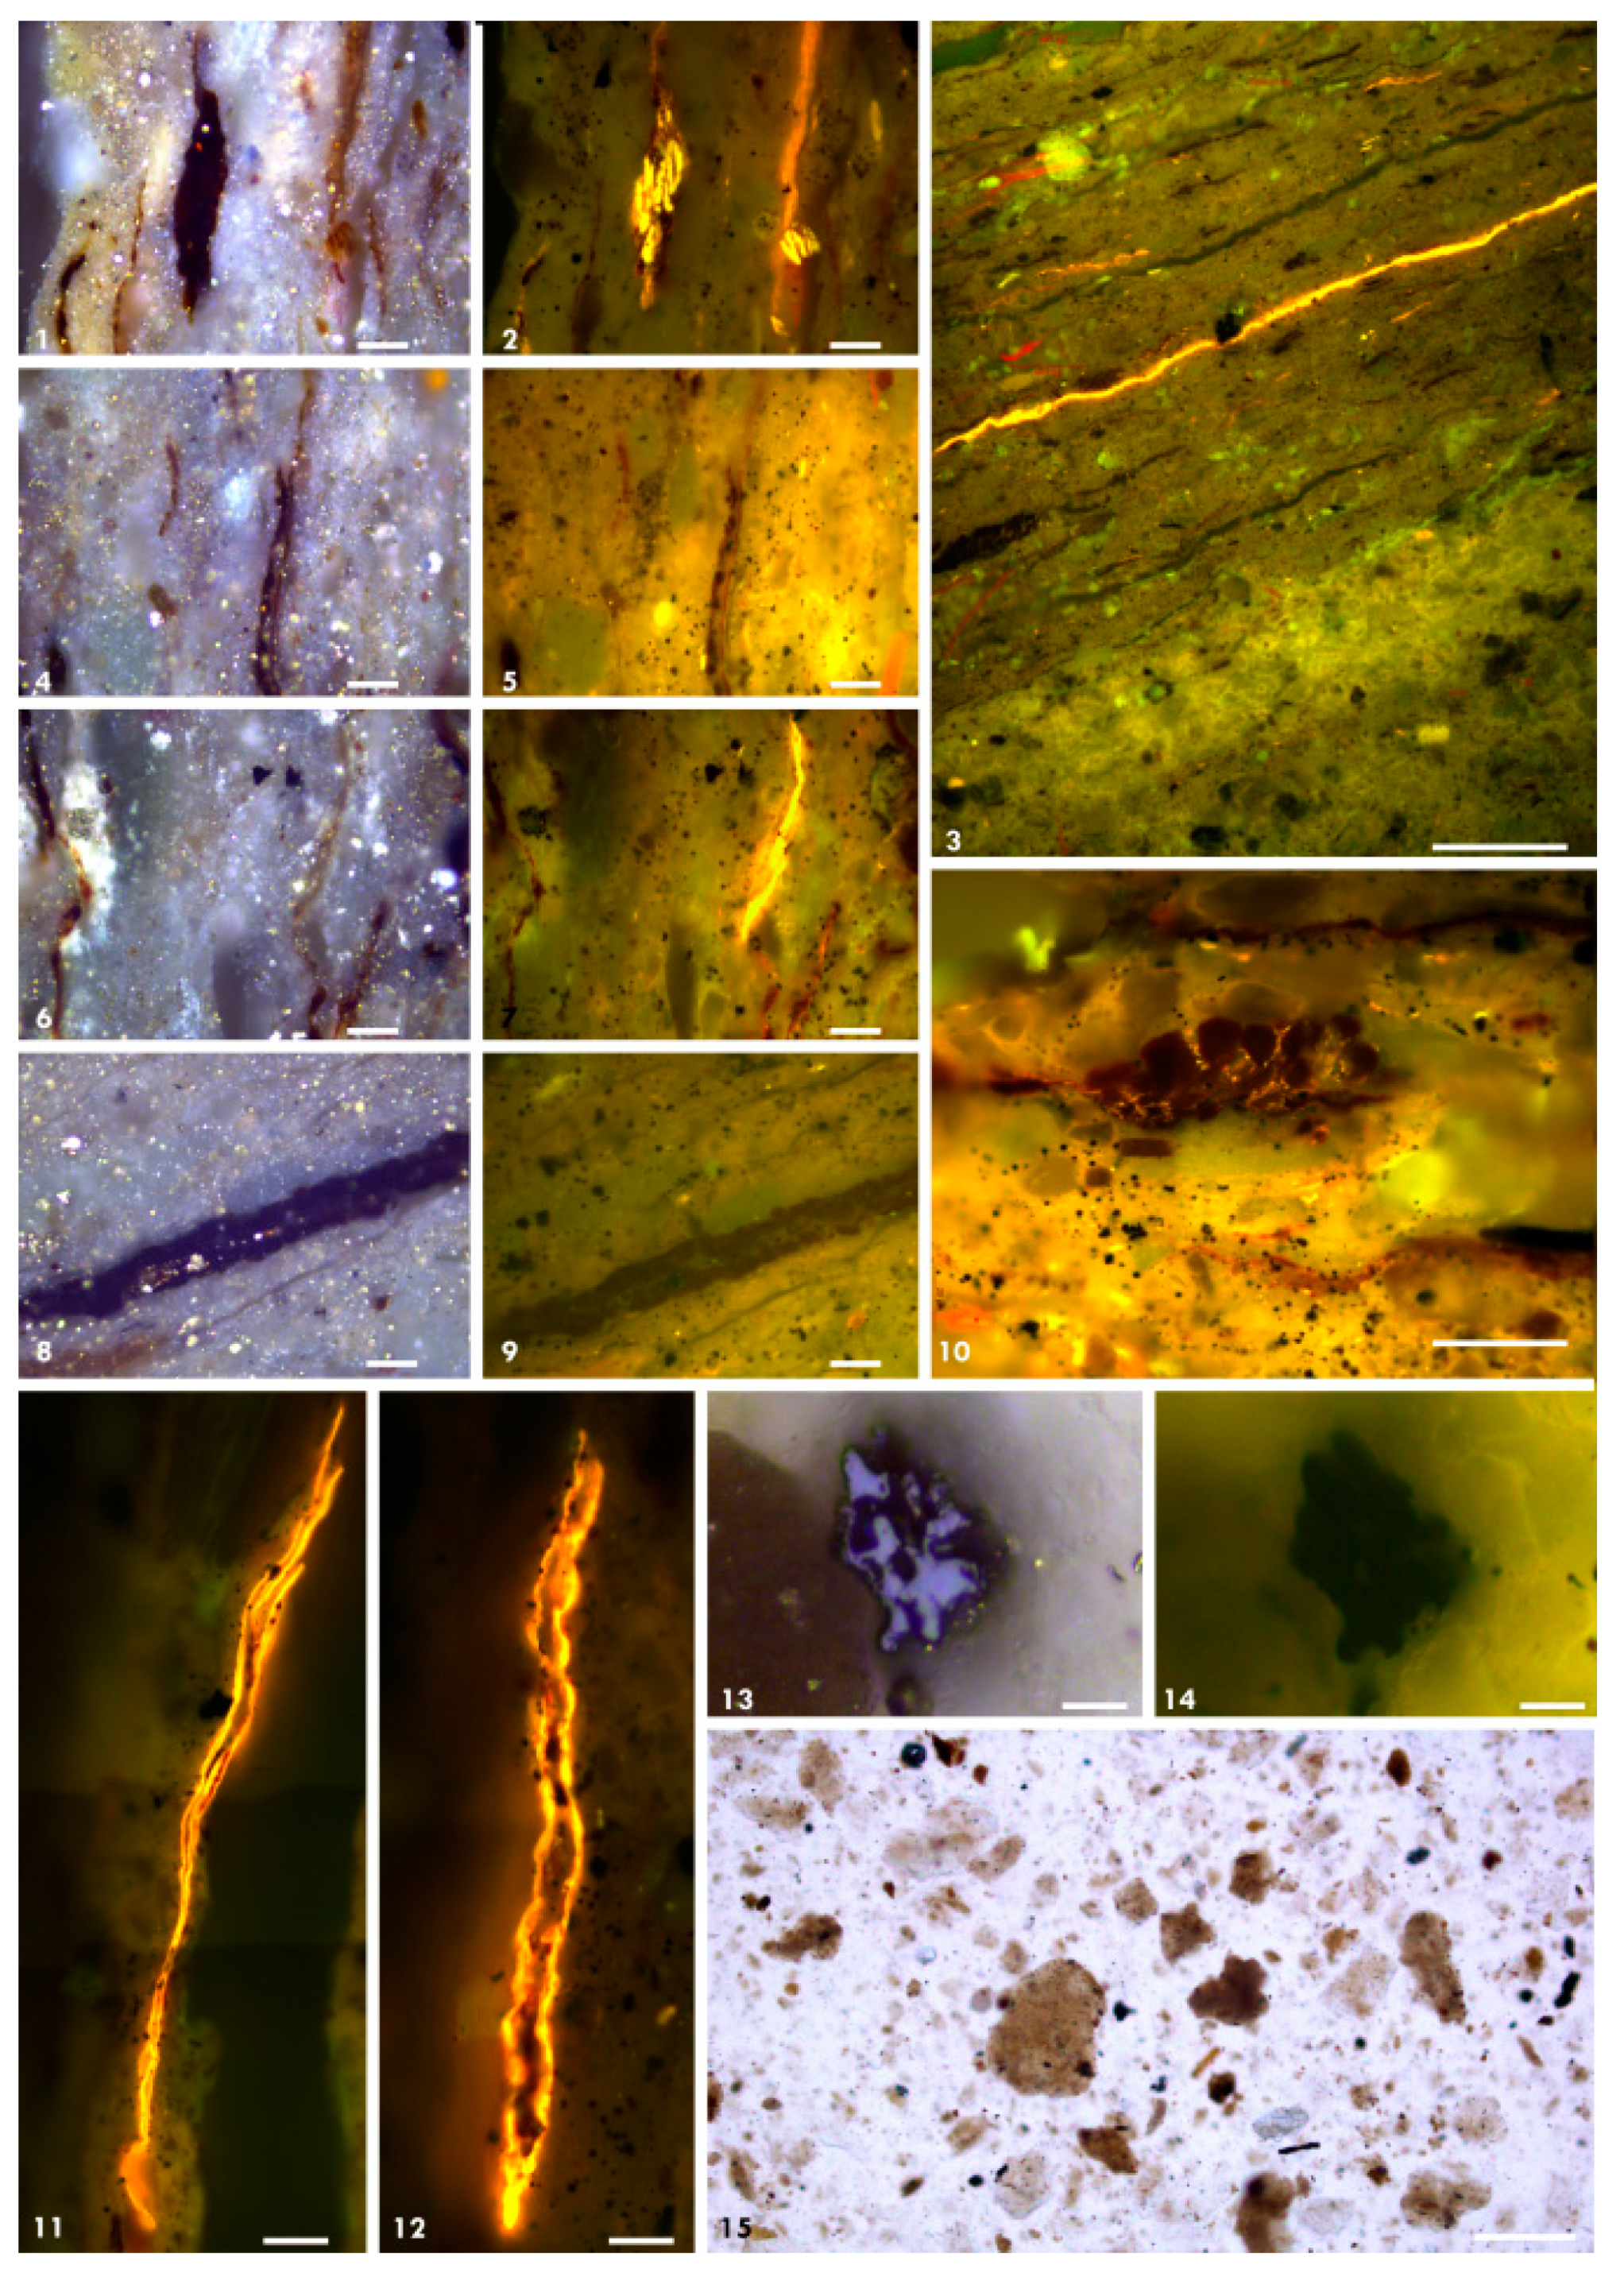
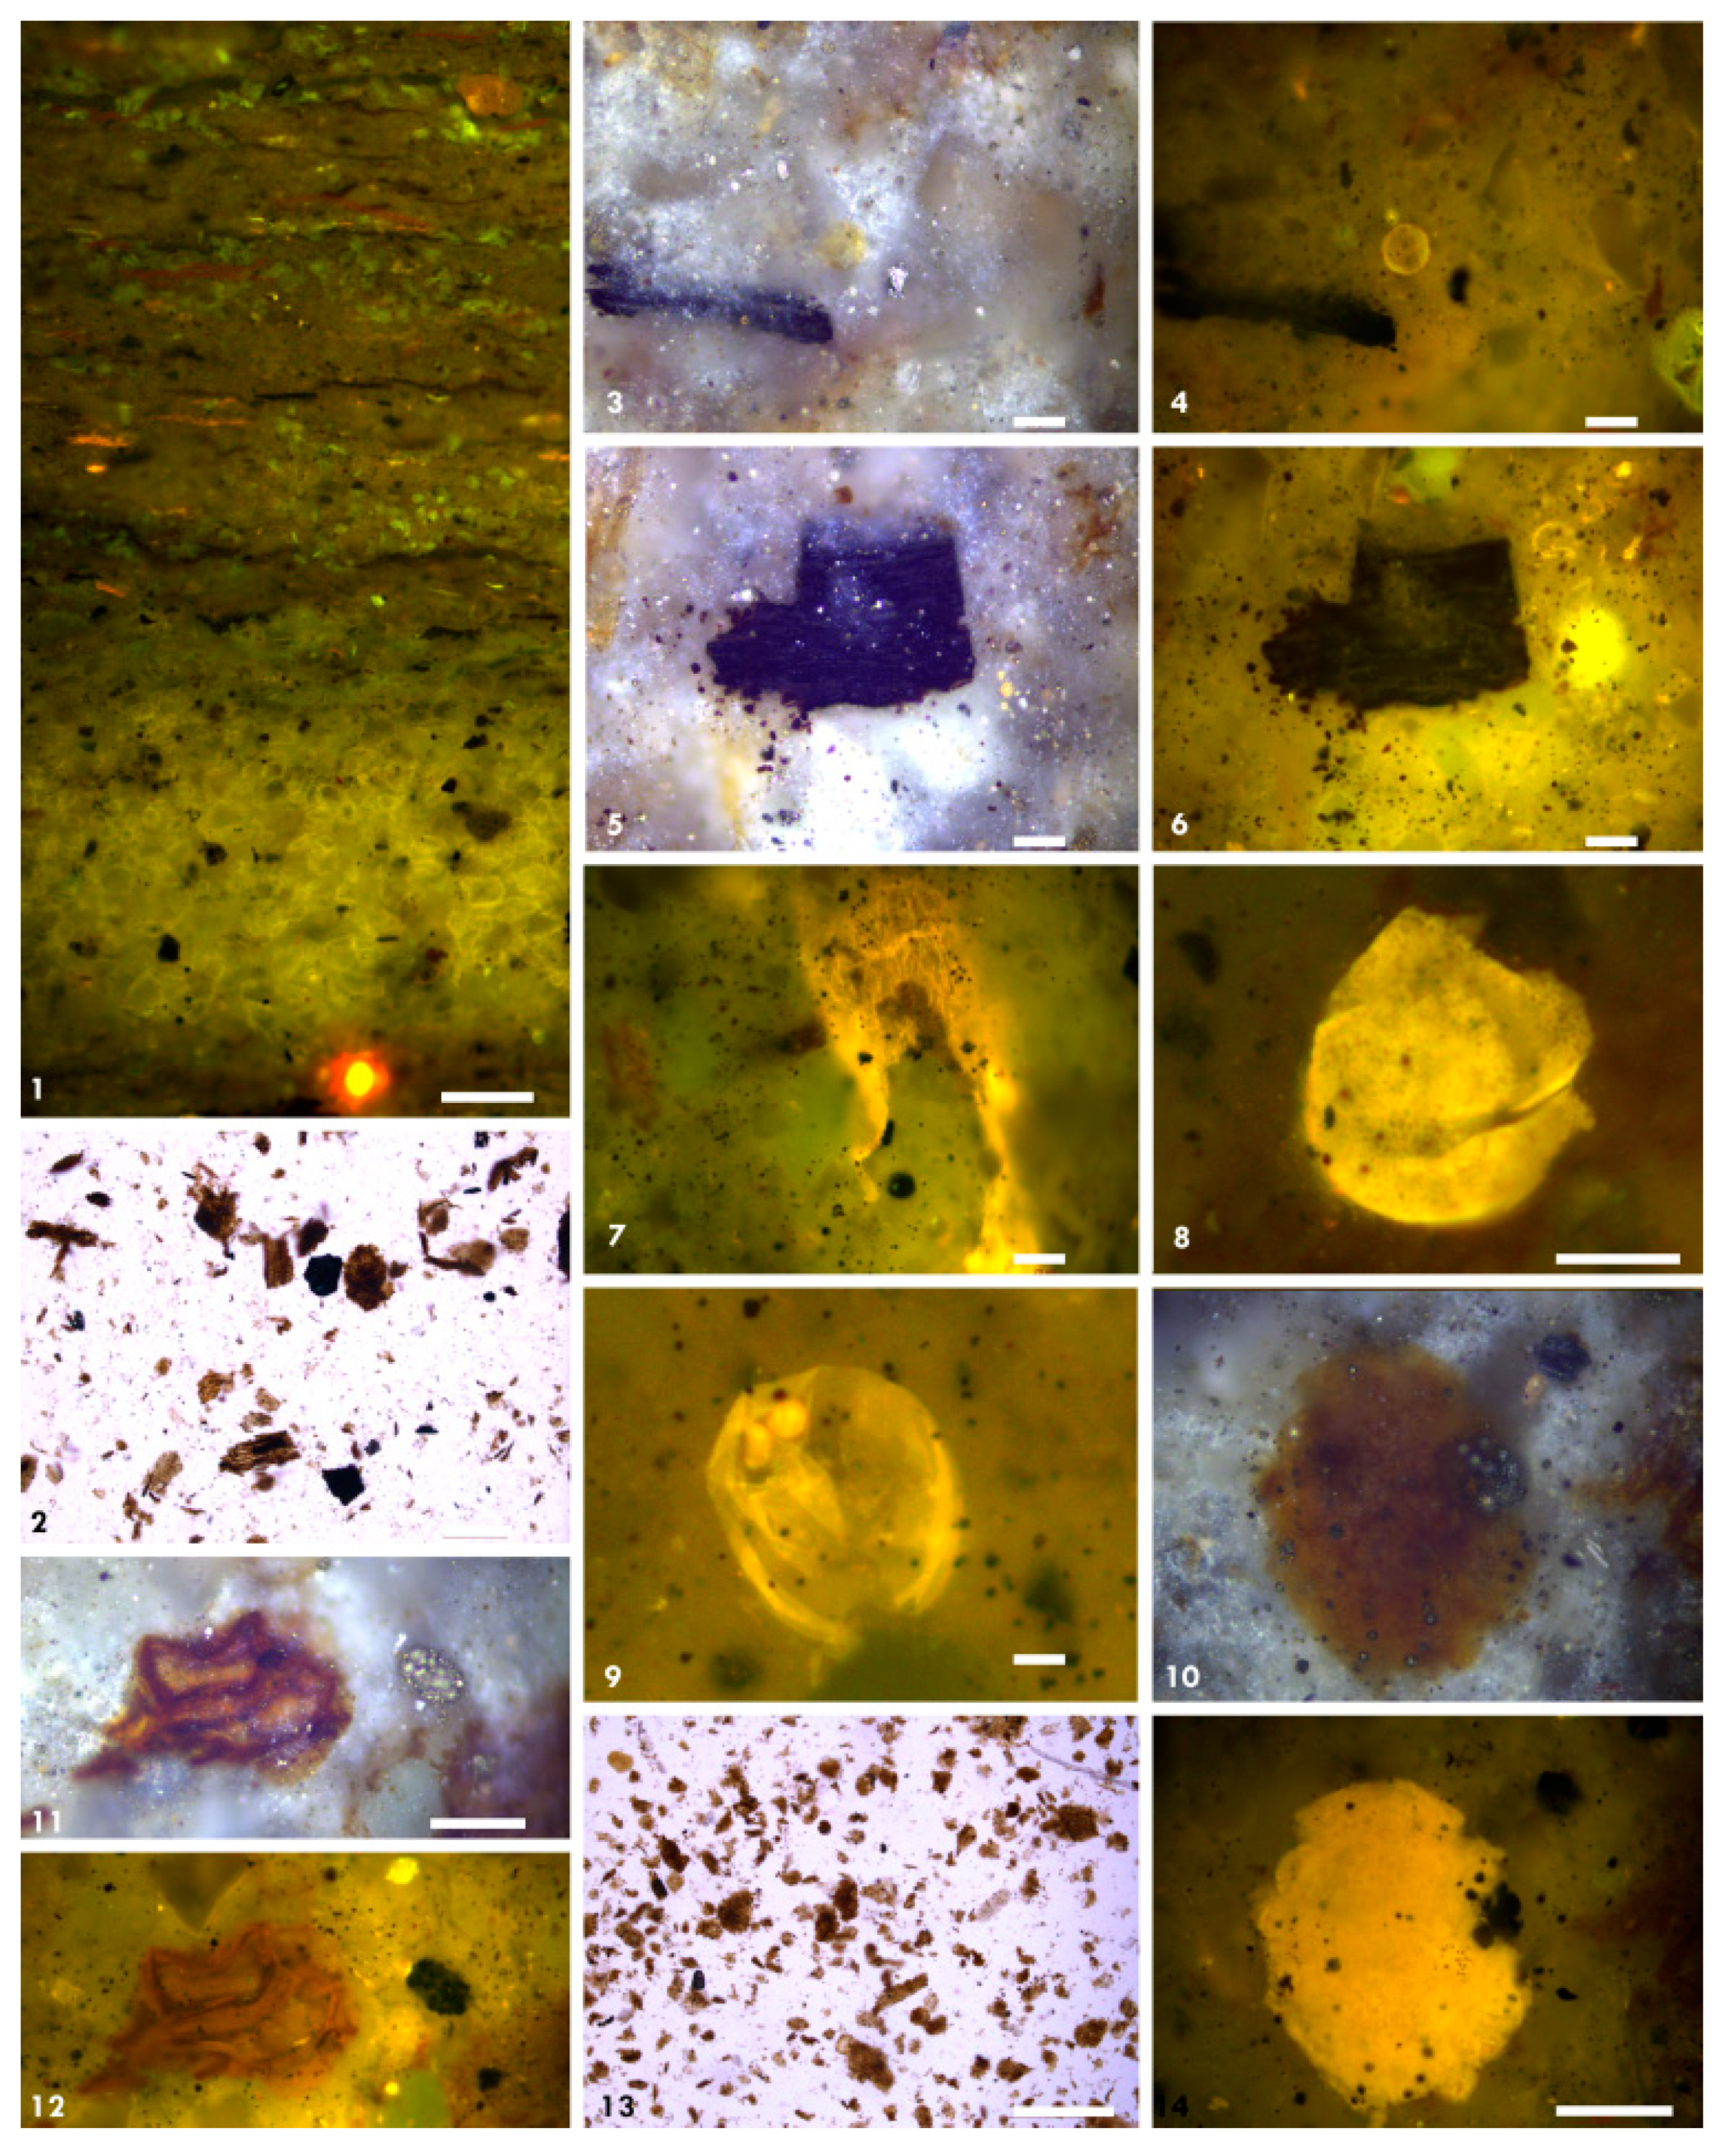
The organic matter consists of a variety of particles of different origin including Amorphous Organic Matter (AOM) spores and dinoflagellate (Figure 10). The organic geochemical analysis indicated that the samples contained kerogen type III and II based on the values of S2 and HI (Figure 8a,b). The microscopic composition of the organic matter, however, reveals the detailed composition of the organic matter, especially the diversity, abundances, thermal maturity, and intergranular distribution [65,66]. These aspects show large variations among the samples, indicating significant differences in the paleoenvironmental conditions. Samples no. 1 and 2 are composed mainly of thin laminae that vary between shale and fine silt with calcareous cement (Figure 11 (1–10) and Figure 12 (1,2). The organic matter is concentrated mainly in the shale laminae and is represented by alginite (41%) that is distinguished by its brown color in white light and bright yellow color in fluorescence mode (Figure 11 (1–3,6,7,11,12). The alginite extends in large sheets (<5 µm in thickness) parallel to the bedding plane (Figure 11 (1–3,6,7)). Some particles (10%) are similar to the observed alginite but lack the characteristic fluorescence. These particles have spherical lobes that could be relicts of algal cells (Figure 11 (8–10). Sheet-like particles lacking fluorescence but having cellular structure occurred in relatively large abundance (34%) (Figure 11 (4,5) and Figure 12 (13)). The sheets were observed in the kerogen extracts (Figure 12 (2)). Bituminite (9%) also occurred in significant amounts and was concentrated especially around alginite fragments (Figure 11 (4,5,10)). It showed light brown color in white light and yellow color in fluorescence mode. Vitrinite and inertinite (6%) particles concentrated only in the coarser silt laminae (Figure 11 (12,14). In the kerogen extracts, organic matter was dominated by flaky AOM of different densities and by transparent brown wood particles having a distinctive cellular tissue (Figure 11 (12,14) and Figure 12 (2)). The organic matter composition points to dysoxic conditions in the shale laminae. The density of the organic matter in the rock matrix is generally low and compares to the values of the TOC of samples no. 1 and no. 2 (Table 5). The kerogen type is mixed II/III, which is also in accordance with the organic geochemical analysis (Table 5).
Sample no. 3 witnessed significant changes in the nature of the organic matter and showed a higher enrichment of marine microphytoplankton (Figure 12 (3–14)). The microphytoplankton is represented by alginate, which includes dinoflagellate, acritarchs, and algal masses (53%) that are bright yellow in color when in fluorescence mode (Figure 12 (3,4,8–10,14)). The marine organic matter was infested with pyrite framboids (Figure 12 (10,14)). The terrigenous organic matter was represented by well-preserved vitrinite lumps (12%) and Sphagnum leaf cuticles (Figure 12 (3–6,11,12)). Cutinite (10%) was yellow in color in fluorescence mode and showed cellular structure (Figure 12 (7)). Bituminite and liptodetrinite (25%) existed in higher abundances and had a yellow fluorescence color (Figure 12 (3–6)). The examination of kerogen extract in transmitted light showed the dominance of flaky AOM and dinoflagellates (Figure 12 (13)). The oxygen conditions ranged from dysoxic to suboxic [67]. The kerogen is type II, which agrees well with the results of S2 and HI (Table 5).
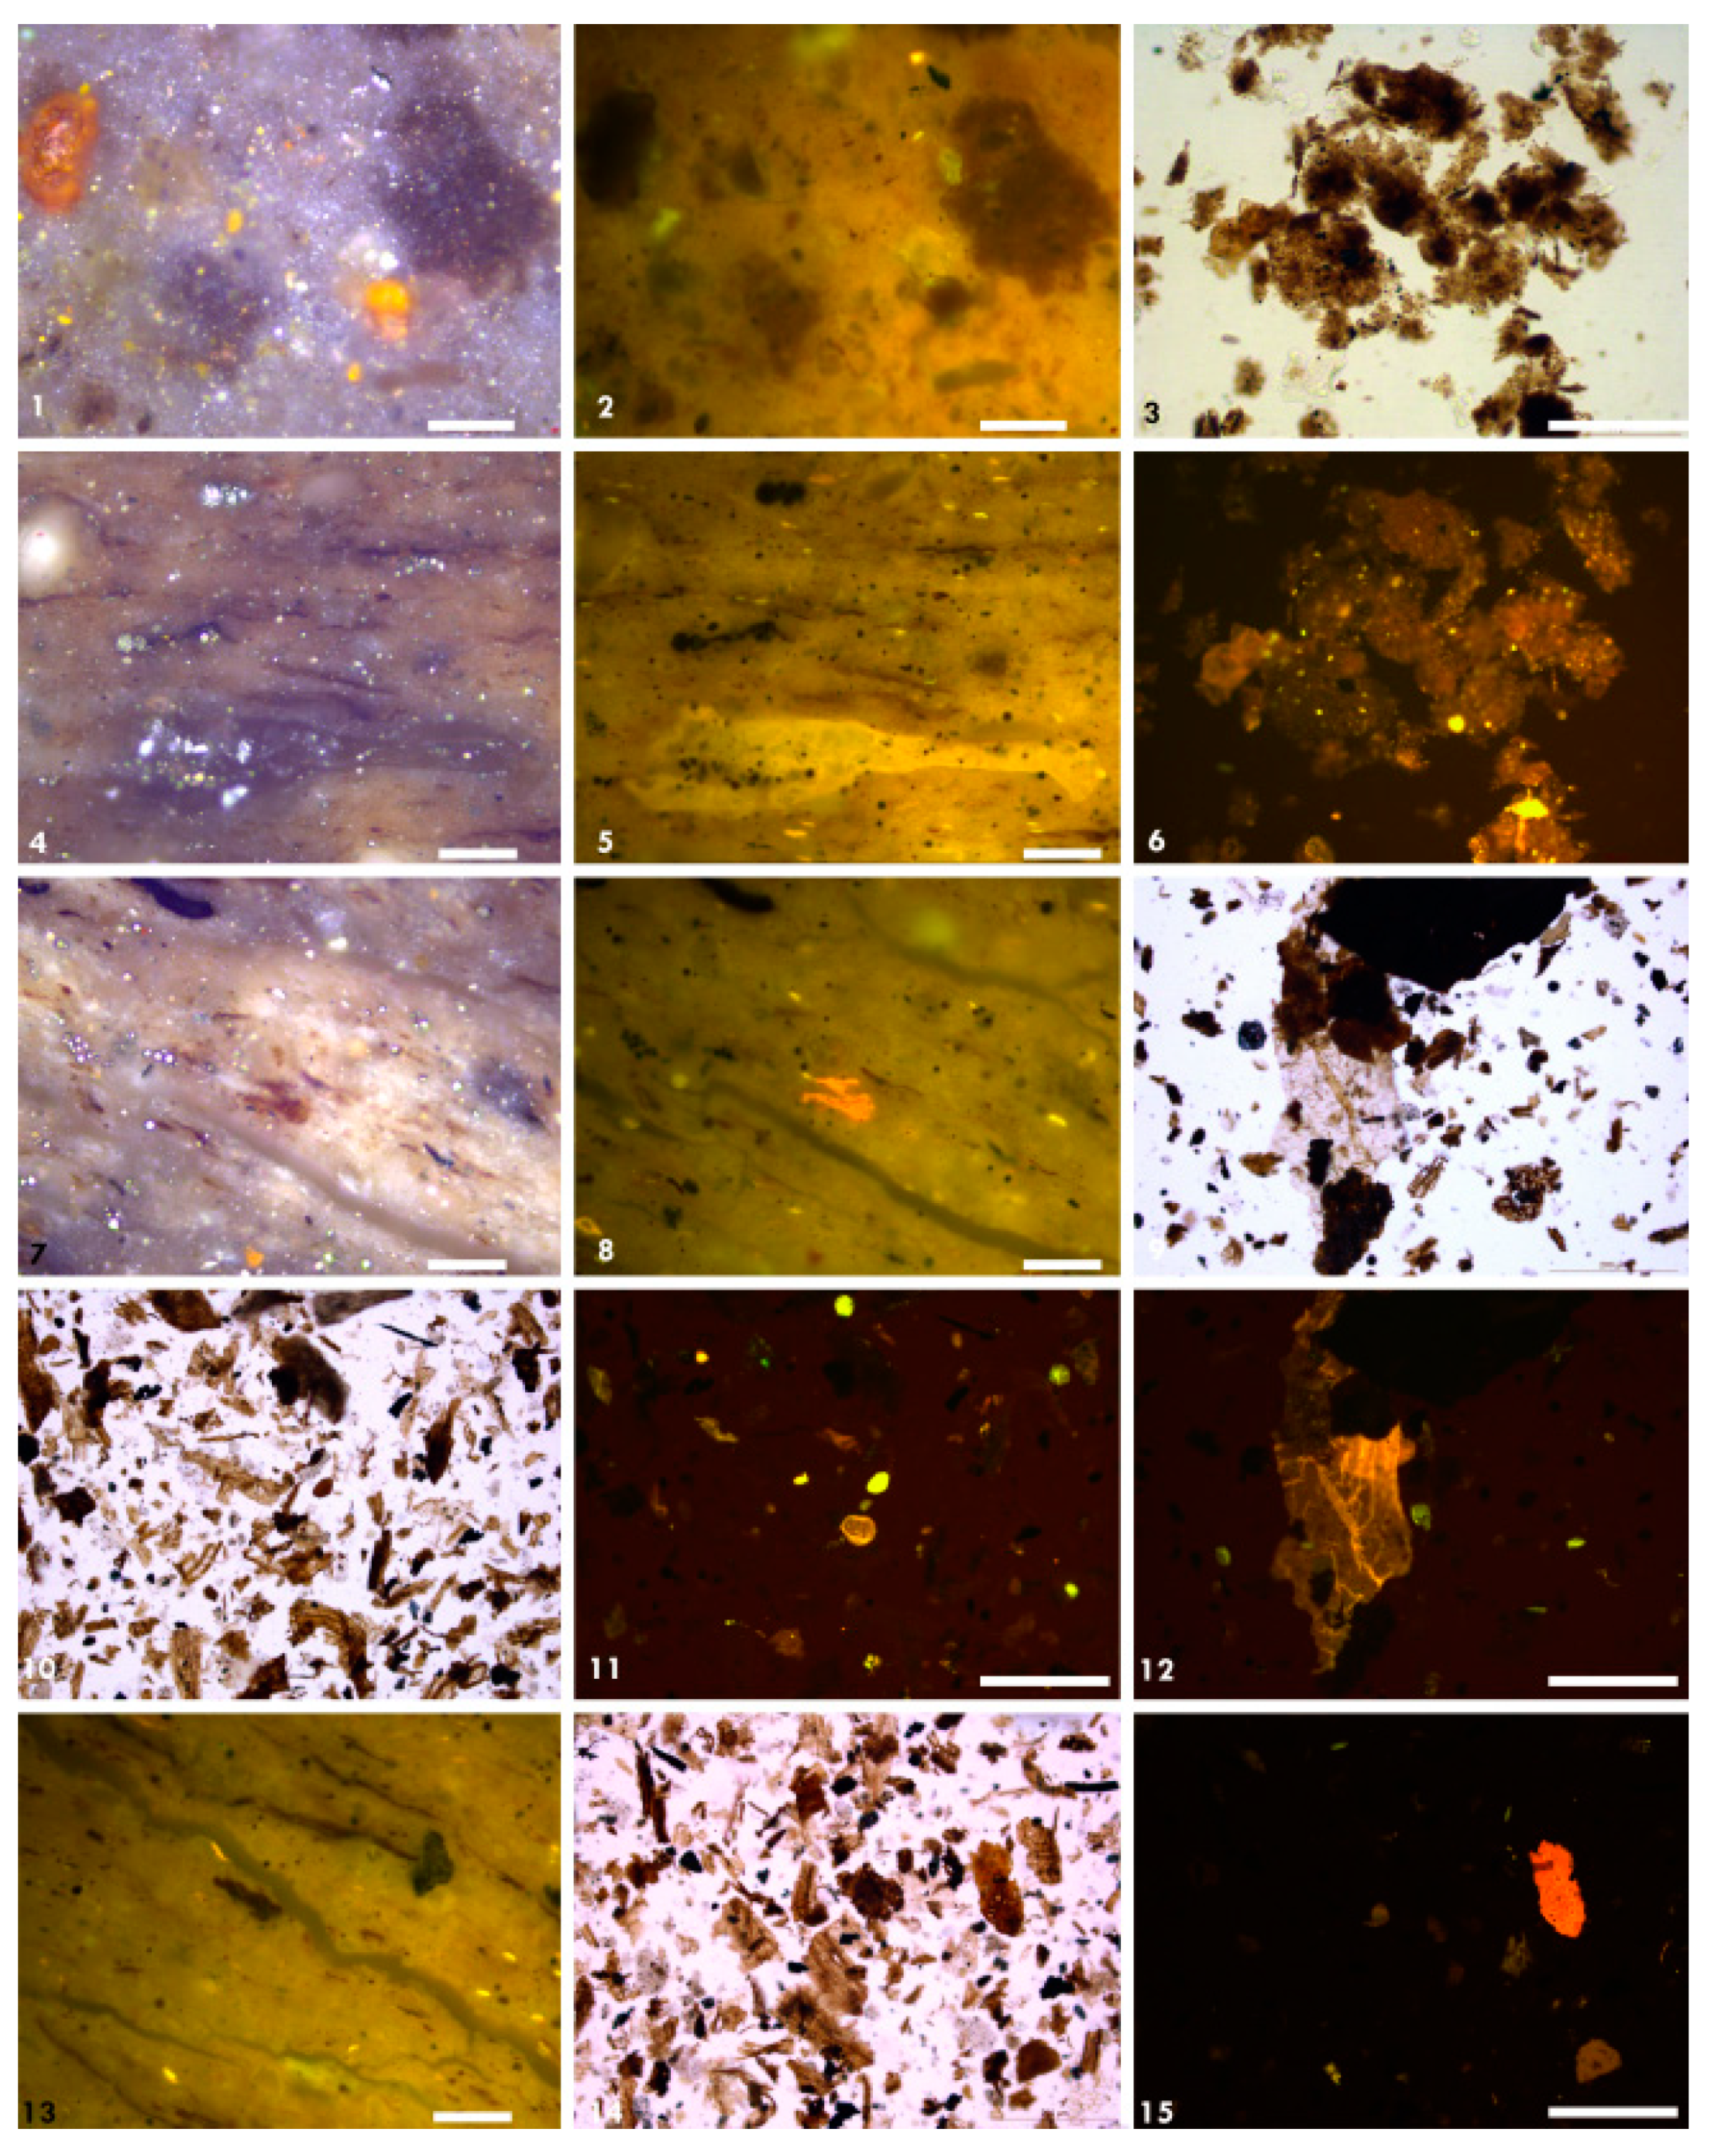
In sample no. 4, the alginite abundance was significantly lower (Figure 13 (1–3,6)). The main observation is the dominant occurrence of a bituminous groundmass. The bituminous groundmass had pale brownish shade in white light and strong yellow color in fluorescence mode (Figure 13 (1,2)). In transmitted light, the kerogen extract showed the dominance of the diffused edge AOM and low abundance of dinoflagellates that had a weak yellow fluorescence color (Figure 13 (3,4)). The AOM grains contained minute algal particles (1 µm) with yellow fluorescence. The dominance of bituminous groundmass in general indicates high level of paleoproductivity and anoxic conditions [68,69]. This is reflected in the high TOC and HI values of this sample (Table 5).
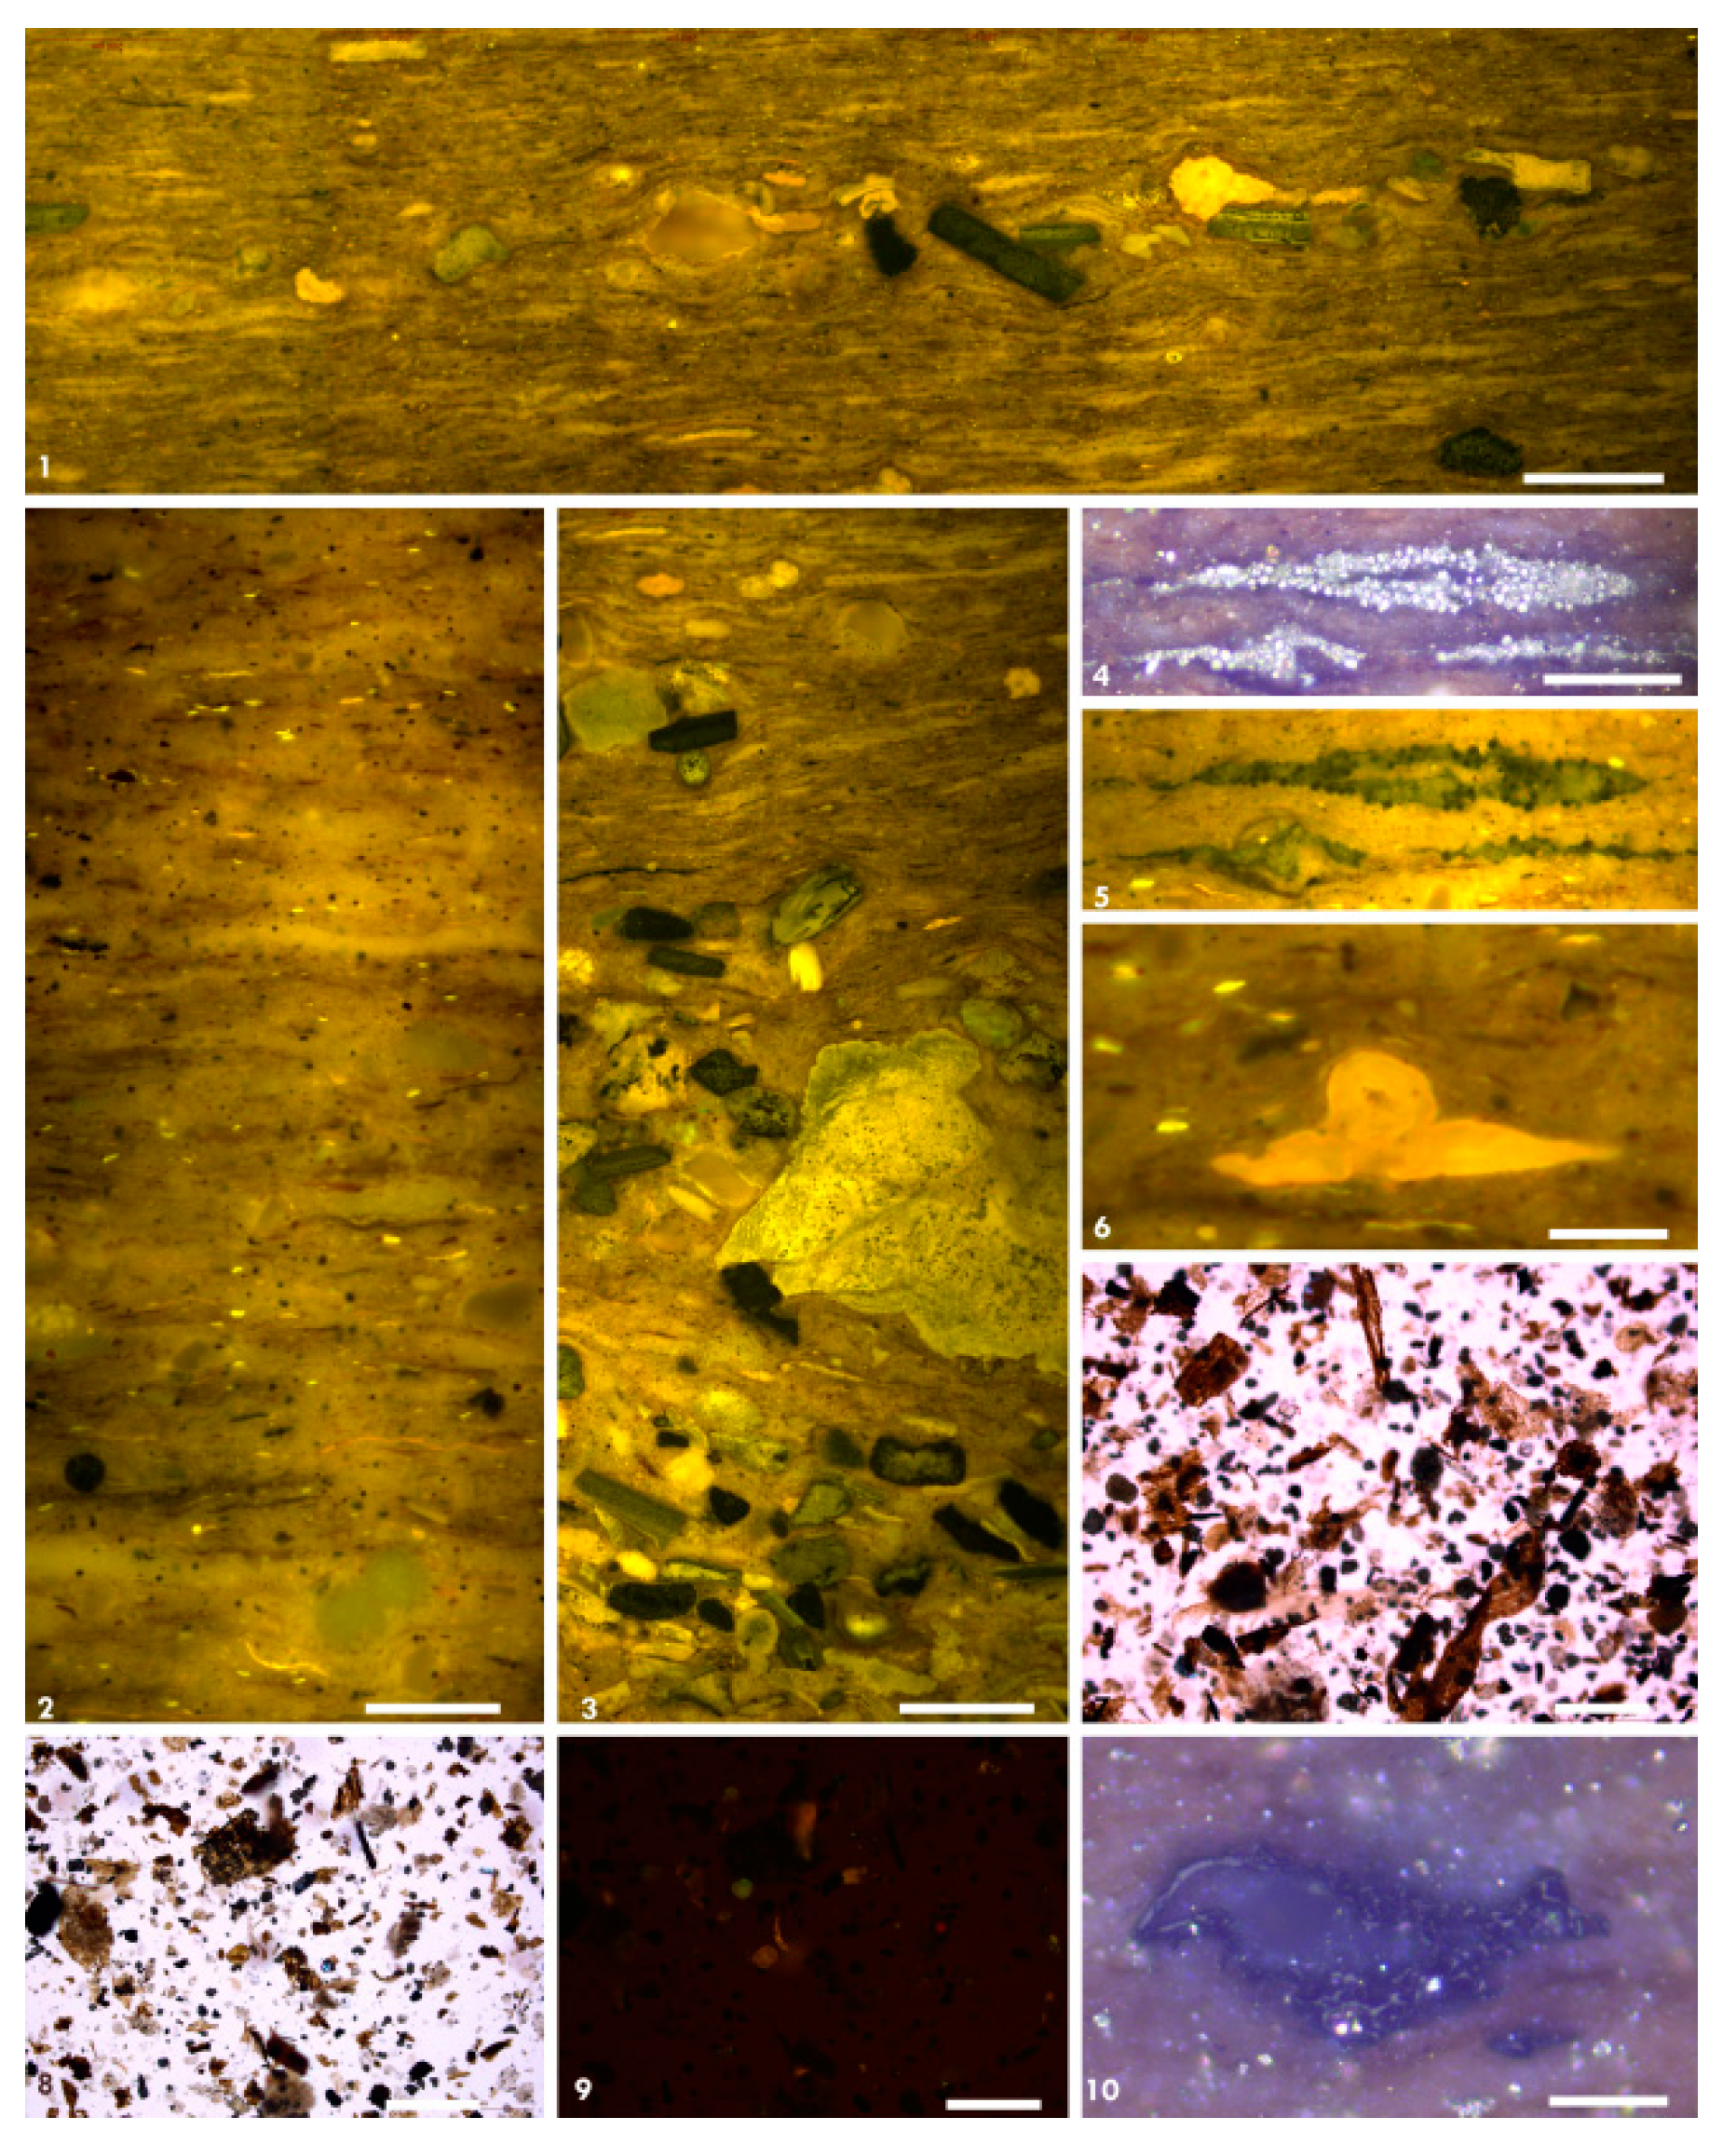
Samples nos. 5, 6 and 7 have the same lithological and organic composition that is characterized by higher abundance of terrigenous organic matter (Figure 13 (4,5) and Figure 14). The terrigenous organic matter is dominated by vitrinite and brown wood sheets that represent the secondary xylem tissues (range between 79%–87%) and wood rays and tracheids (3%–5%) and lesser amounts of sporinite and resinite (5%–8%) (Figure 14 (1–3,10)). This terrigenous matter was better observed in the kerogen extracts under transmitted light and lacked any fluorescence (Figure 13 (4,5) and Figure 14 (7–9)). Only membranous sheets of cutinite had fluorescence in the whole-rock and kerogen extracts (Figure 13 (4,5,7–9,12)). Sample no. 7 had gradational thin laminations of different grain sizes (Figure 14 (1–3)). The fine-grained undisturbed laminations indicate low energy environmental conditions that allowed the regular deposition of plant tissues, bituminite, and rich pyrite framboids grains parallel to bedding surfaces (Figure 14 (1–5)). This sample also contained the least amount of organic matter. The highly sorted and rounded shell fragments in the coarse-grained laminae point to long distance transportation (Figure 14 (3)). Dinoflagellates (2%–5%) occurred in lesser amounts and the organic composition in the general indicated proximity of the environmental settings to terrigenous vegetation sources in calm and dysoxic conditions [69]. The organic composition is of kerogen type III, which is in accordance with the S2 and HI values that are similar among the three samples (Table 5).

5. Conclusions

Samples of the Duwi Formation at El Sebaiya area (Mahamid Mine) consist of quartz, calcite, and clay minerals (montmorillonite and kaolinite). The shale is composed mainly of SiO2 (48.1%), Al2O3 (9.6%) and Fe2O3 (4.4%), which is also supported by SEM and EDX.
Heavy metals and La have a strong positive correlation with Al2O3, indicating that these trace elements are associated with clay minerals and were deposited under oxic conditions and have been subjected to strong chemical weathering.
The kerogen in the black shales from the Mahamid Mine has poor to very good organic richness. It consists of mixed types II/III and III. Type II (liptinite) is comprised of bituminite, cutinite, sporinite, and alginate, as well as prominent bituminous groundmass. Type III consist of terrigenous macerals such as vitrinite and other plant remains like tracheids. Based on Rock-Eval Tmax and measured vitrinite Ro values, the kerogen is immature to marginally mature. The expected hydrocarbons are both oil and gas.
The palynofacies and organic petrography analyses agreed in part with the geochemical analysis. Organic composition indicates the dominance of dysoxic to anoxic conditions in the paleoenvironment. These terrigenous sediments were of intermediate composition (between mafic and felsic) and contained trace amounts of K-feldspars. The abundance of organic matter reveals deposition in a marine proximal setting that was affected by active terrigenous transportation and humid conditions. Based on the Chemical Index Alteration (CIA) values, the rocks accumulated during a period of intense chemical weathering.
The aim of this study was to evaluate an unconventional source of energy using a combination of analytical methods. We hope that the data generated will be applied by the industry in the future for the exploration and exploitation of this important resource in Egypt.

Author Contributions

Conceptualization, E.A.E.-A., S.S., D.M. and W.M.; methodology, E.A.E.-A., S.S., S.A. and W.M.; investigation, E.A.E.-A., S.S., D.M. and W.M.; resources, E.A.E.-A., S.S. and S.A.; data curation, E.A.E.-A., S.S., D.M., W.M. and T.G.; writing—original draft preparation, E.A.E.-A., S.S., D.M., T.G. and W.M.; writing—review and editing, E.A.E.-A., D.M., W.M. and T.G.; visualization, E.A.E.-A., D.M. and W.M.; project administration, E.A.E.-A.; funding acquisition, E.A.E.-A. All authors have read and agreed to the published version of the manuscript.

Funding

This research was funded by STDF, grant number 26190.

Data Availability Statement

Data available on request due to restrictions, e.g., privacy or ethical.

Acknowledgments

This paper is based upon work supported by Science, Technology & Innovation Funding Authority (STDF) under grant (26190), and we express our gratitude to the STDF.

Conflicts of Interest

The authors declare no conflict of interest. The funders had no role in the design of the study; in the collection, analyses, or interpretation of data; in the writing of the manuscript, or in the decision to publish the results.

References

  1. Abu-Ali, R.; El-Kammar, A.; Kussb, J. Chemostratigraphy of the Upper Cretaceous-Paleogene organic-rich succession on the southern Tethys margin in Egypt. J. Afr. Earth Sci. 2020, 164, 103779. [Google Scholar] [CrossRef]
  2. Awan, R.S.; Liu, C.; Aadil, N.; Yasin, Q.; Salaam, A.; Hussain, A.; Yang, S.; Jadoon, A.K.; Wu, Y.; Gul, M.A. Organic geochemical evaluation of Cretaceous Talhar Shale for shale oil and gas potential from Lower Indus Basin, Pakistan. J. Petrol. Sci. Eng. 2021, 200, 108404. [Google Scholar] [CrossRef]
  3. Leckie, R.M.; Bralower, T.J.; Cashman, R. Oceanic anoxic events and plankton evolution: Biotic response to tectonic forcing during the mid-Cretaceous. Paleoceanography 2002, 17, 11–13. [Google Scholar] [CrossRef] [Green Version]
  4. Makled, W.A.; Mustafa, T.F.; Maky, A.F. Mechanism of Late Campanian–Early Maastrichtian oil shale deposition and its sequence stratigraphy implications inferred from the palynological and geochemical analysis. Egypt J. Petrol. 2014, 23, 427–444. [Google Scholar] [CrossRef] [Green Version]
  5. Baioumy, H.; Tada, R. Origin of Late Cretaceous phosphorites in Egypt. Cretac. Res. 2005, 26, 261–275. [Google Scholar] [CrossRef]
  6. Glenn, C.R.; Mansour, S.E.A. Reconstruction of the depositional and diagenetic history of phosphorites and associated rocks of the Duwi Formation (late Cretaceous) Eastern Desert, Egypt. Ann. Geol. Surv. Egypt 1979, IX, 388–407. [Google Scholar]
  7. Tröger, U. The oil shale potential of Egypt. Berl. Gewissen Schaftliche Abh. A 1984, 50, 375–380. [Google Scholar]
  8. Hassaan, M.M.; Sakr, S.M.; Abd El-Gawad, E.A.; El Naggar, I.M. Reconnaissance Lithological-Geochemical Exploration for Organic Matter and Total Organic Carbon in the Late Campanian-Paleocene black shale Belt, Upper Egypt. Int. J. Innov. Sci. Eng. Technol. 2016, 3, 699–709. [Google Scholar]
  9. El-Kammar, A.M. Oil shale resources in Egypt: The present status and future vision, Arab. Geo-Front 2014, 1, 1–34. [Google Scholar] [CrossRef]
  10. Philobbos, E.R. The phosphatic sediments of the Nile Valley and Eastern Desert of Egypt in view of the Upper Cretaceous-Lower Tertiary sedimentation tectonics. Geol. Soc. Egypt Spec. Publ. 1996, 2, 313–352. [Google Scholar]
  11. El Kammar, M.M. Organic and Inorganic Components of the Upper Cretaceous-Lower Tertiary Black Shales from Egypt and Their Hydrocarbon Potentialities. Ph.D. Thesis, Cairo University, Giza, Egypt, 1993. [Google Scholar]
  12. El-Azabi, M.H.; Farouk, S. High resolution sequence stratigraphy of the Maasstrichtian—Ypresian succession along the eastern scarp face of Kharga Oasis, Southern Western Desert, Egypt. Sedimentology 2010, 58, 579–617. [Google Scholar] [CrossRef]
  13. Issawi, B.; Maher, F.; El-Sayed, A.A.; Youssef; Rifaat, Y.; Osman, A. The Phanerozoic geology of Egypt A geodynamic approach. Egypt. Geol. Surv. 2009, 76, 166–200. [Google Scholar]
  14. Rudnick, R.L.; Gao, S. Composition of the continental crust. Treatise Geochem. 2014, 3, 1–64. [Google Scholar]
  15. Sutherland, R.A. Bed sediment-associated trace metals in an urban stream, Oahu, Hawaii. Environ. Geol. 2000, 39, 611–627. [Google Scholar] [CrossRef]
  16. Hakanson, L. An Ecological Risk Index for Aquatic Pollution Control: A Sedimentological Approach. Water Res. 1980, 14, 975–1001. [Google Scholar] [CrossRef]
  17. Blaser, P.; Zimmermann, S.; Luster, J.; Shotyk, W. Critical examination of trace element enrichments and depletions in soils: As, Cr, Cu, Ni, Pb and Zn in Swiss forest soils. Sci. Total Environ. 2000, 249, 257–280. [Google Scholar] [CrossRef]
  18. Bam, E.K.P.; Akiti, T.T.; Osea, S.D.; Ganyaglo, S.Y.; Gibrilla, A. Multivariate cluster analysis of some major andtrace elements distribution in an un- saturated zone profile, Densu river Basin, Ghana. Afr. J. Environ. Sci. Technol. 2011, 5, 155–167. [Google Scholar]
  19. Espitalié, J.; La Porte, J.L.; Madec, M.; Marquis, F.; Le Plat, P.; Paulet, J.; Bautefeu, A. Methodé rapide de caractérisation des roches mères de leur potential potential pétrolier et de leur degre d‘évolution. Rev. de L’institut Français du Pétrole 1977, 2, 23–42. [Google Scholar] [CrossRef]
  20. Peters, K.E.; Cassa, M.R. Applied source rock geochemistry, The Petroleum System-From Source to Trap: AAPG Memoir. Tulsa Okla. USA 1994, 60, 93–120. [Google Scholar]
  21. Behar, F.; Beaumont, V.; Penteado, H.D. Rock-Eval 6 Technology Performances and Developments. Oil Gas Sci. Technol. 2001, 56, 111–134. [Google Scholar] [CrossRef]
  22. Carvajal-Ortiz, H.; Gentzis, T. Critical considerations when assessing hydrocarbon plays using Rock-Eval pyrolysis and organic petrology data: Data quality revisited. Int. J. Coal Geol. 2015, 152, 113–122. [Google Scholar] [CrossRef]
  23. Riding, J.B. A guide to preparation protocols in Palynology. Palynology 2021, 45, 1–110. [Google Scholar] [CrossRef]
  24. ISO (International Organisation for Standardisation). Methods for the Petrographic Analysis of Coals—Part 2: Methods of Preparing Coal Samples; ISO 7404-2; The International Organization for Standardization: London, UK, 2009. [Google Scholar]
  25. ISO (International Organisation for Standardisation). Methods for the Petrographic Analysis of Coals; ISO 7404-5; The International Organization for Standardization: London, UK, 2009. [Google Scholar]
  26. ASTM. Standard Test Method for Microscopical Determination of the Reflectance of Vitrinite Dispersed in Sedimentary Rocks, Petroleum Products, Lubricants, and Fossil Fuels; Gaseous Fuels; Coal and Coke, sec. 5, v. 05.06 ASTM D7708; ASTM International: West Conshohocken, PA, USA, 2015. [Google Scholar]
  27. Abou El-Anwar, E.A.; Samy, Y. Clay Mineralogy and Geochemical characterization of Some Quaternary sediments on Giza-Fayium District, Western side of the Nile Valley, Egypt: Relationships to weathering and provenance. Aust. J. Appl. Sci. Res. 2013, 9, 4765–4780. [Google Scholar]
  28. Algeo, T.J.; Ingall, E.D. Sedimentary Corg:P ratios, paleocean ventilation, and Phanerozoic atmospheric pO2. Palaeogeogr. Palaeoclimatol. Palaeoecol. 2007, 256, 130–155. [Google Scholar] [CrossRef]
  29. Marynowski, L.; Pisarzowska, A.; Derkowski, A.; Rakociński, M.; Szaniawski, R.; Środoń, J.; Cohen, A.S. Influence of palaeoweathering on trace element concentrations and environmental proxies in black shales. Palaeogeo. Palaeoclim. Palaeoecol. 2017, 472, 177–191. [Google Scholar] [CrossRef] [Green Version]
  30. Taylor, S.R.; McLennan, S.M. The Continental Crust: Its Composition and Evolution; Blackwell: Oxford, UK, 1985; p. 312. [Google Scholar]
  31. Fedo, C.M.; Eriksson, K.; Krogstad, E.J. Geochemistry of shale from the Archean (~3.0 Ga) Buhwa greenstone belt, Zimbabwe: Implications for provenance and source area weathering. Geochem. Cosmoch. Acta 1996, 60, 1751–1763. [Google Scholar] [CrossRef]
  32. Abou El-Anwar, E.A. Mineralogical, petrographical, geochemical, diageneses and provenance of the Cretaceous black shale Duwi Formation at Quseir-Safaga, Red Sea, Egypt. Egypt J. Petrol. 2017, 26, 915–926. [Google Scholar] [CrossRef] [Green Version]
  33. Abou El-Anwar, E.A.; Mekky, H.S.; Abdel Wahab, W. Characterization and Depositional Environment of P2O5–F-U of Phosphatic Rocks for the Duwi Formation, Qussier-Safaga Region, Red Sea Coast, Egypt. Egypt J. Chem. 2019, 62, 2213–2228. [Google Scholar] [CrossRef]
  34. Abou El-Anwar, E.A.; Mekky, H.S.; Abdel Wahab, W. Geochemistry, mineralogy and depositional environment of black shales of the Duwi Formation, Qusseir area, Red Sea coast, Egypt. Carbonates Evaporites 2018, 34, 883–892. [Google Scholar] [CrossRef] [Green Version]
  35. Swanson, V. A Review Geology and Geochemistry of Uranium in Marine Black Shales; United States Government Printing Office: Washington, DC, USA, 1961; p. 112.
  36. Arning, E.T.; Lückge, A.; Breuer, C.; Gussone, N.; Birgel, D.; Peckmann, J. Genesis of phosphorite crusts off Peru. Mar. Geol. 2009, 262, 68–81. [Google Scholar] [CrossRef]
  37. Abou El-Anwar, E.A.; Mekky, H.S.; Abd El Rahim, S.H. Discovery of spherulitic dahllite associated with carbonates at Hamadat phosphorite mine, Qusseir, Central Eastern Desert, Egypt. Carbonates Evaporites 2020, 35, 106. [Google Scholar] [CrossRef]
  38. Venter, R.; Boylett, M. The evaluation of various oxidants used in acid leaching of uranium. In Hydrometallurgy Conference; The Southern African Institute of Mining and Metallurgy: Johannesburg, South Africa, 2009; pp. 445–456. [Google Scholar]
  39. Bots, P.; Behrends, T. Uranium mobility in subsurface aqueous systems: The influence of redox conditions. Miner. Mag. 2008, 72, 381–384. [Google Scholar] [CrossRef]
  40. Bata, T. Evidences of widespread Cretaceous deep weathering and its consequences: A review. Earth Sci. Res. 2016, 5, 69. [Google Scholar] [CrossRef] [Green Version]
  41. Kelly, K.D.; Taylor, C.D. Environmental geochemistry of shale- hosted Ag-Pb-Zn massive sulfide deposits in northwest Alaska: Natural background concentration of metals in water from mineralized areas. Appl. Geochem. 1997, 12, 397–409. [Google Scholar] [CrossRef]
  42. Goodfellow, W.D. Geology, genesis and exploration of SEDEX deposits with emphasis on the Selwyn Basin, Canada. In Sediment-Hosted Lead-Zinc Sulphide Deposits: Attributes and Models of Some Major Deposits of India, Australia and Canada; Deb, M., Goodfellow, W.D., Eds.; Narosa Publishing House: Delhi, India, 2004; pp. 24–99. [Google Scholar]
  43. Nicholson, K. Contrasting mineralogical-geochemical signatures of manganese oxides: Guides to metallogenesis. Econ. Geol. 1992, 87, 1253–1264. [Google Scholar] [CrossRef]
  44. Eric, B.E.; Fralick, P.; Emile, E.; Konfor, N.I.; Betrant, B.S.; Florent, A.D.; Zacharie, E.B.A. Geochemical characteristics of shales in the Mamfe Basin, South West Cameroon: Implication for depositional environments and oxidation conditions. J. Afr. Earth Sci. 2019, 149, 131–142. [Google Scholar] [CrossRef]
  45. Jones, B.; Manning, D.A. Comparison of geochemical indices used for the interpretation of palaeoredox conditions in ancient mudstones. Chem. Geol. 1994, 111, 111–129. [Google Scholar] [CrossRef]
  46. Galarraga, F.; Reategui, K.; Martïnez, A.; Martínez, M.; Llamas, J.F.; Márquez, G. V/Ni ratio as a parameter in palaeo-environmental characterization of non-mature medium-crude oils from several Latin American basins. J. Petrol. Sci. Eng. 2008, 61, 9–14. [Google Scholar] [CrossRef]
  47. Shi, C.; Cao, J.; Bao, J.; Zhu, C.; Jiang, X.; Wu, M. Source characterization of highly mature pyrobitumens using trace and rare earth element geochemistry: Sinian-Paleozoic paleo-oil reservoirs in south China. Org. Geochem. 2015, 83, 77–93. [Google Scholar] [CrossRef]
  48. Abou El-Anwar, E.A. Lithologic characterization of the phosphorite-bearing Duwi Formation (Campanian), South Esna West Nile Valley, Egypt. Carbonates Evaporites 2019, 34, 793–805. [Google Scholar] [CrossRef]
  49. Abou El-Anwar, E.A. Petrography, geochemistry and genesis of the Upper Eocene carbonate terraces (II and III), Qasr El-Sagha Formation, El-Faiyum Egypt. Sedimentol. Egypt 2005, 13, 243–260. [Google Scholar]
  50. Abou El-Anwar, E.A. Petrography, geochemistry and genesis of some Middle Eocene rocks at Qattamia area, Cairo-Suez Road Egypt. NRC Egypt 2006, 3, 519–543. [Google Scholar]
  51. Abou El-Anwar, E.A. Petrographical, geochemical and diagenetic studies of the middle Eocene carbonates, Mokattam Formation of Darb el-Fayium area. Int. Conf. Geol. Sci. Eng. Fr. Paris August 2011, 80, 1315–1325. [Google Scholar]
  52. Abou El-Anwar, E.A. Contribution to the composition and origin of the reef terraces in Ras Mohamed, Sharm El-Sheikh Coast, Southern Sinai, Egypt. Egypt J. Geol. 2012, 56, 33–48. [Google Scholar]
  53. Abou El-Anwar, E.A. Composition and origin of the dolostones of Um Bogma Formation, Lower Carboniferous, west central Sinai, Egypt. Carbonates Evaporates 2014, 29, 129–205. [Google Scholar] [CrossRef]
  54. Abou El-Anwar, E.A.; EL-Wekeil, S.S.; Gaafar, F.S. Contribution to the mineralogy, geochemistry, and provenance of the Lower Eocene Esna shale in the Farafra Oasis, Western Desert, Egypt. J. Appl. Sci. Res. 2013, 9, 5344–5369. [Google Scholar]
  55. Abou El-Anwar, E.A.; Mekky, H.S.; Samy, Y.M. Contribution to the mineralogical, geochemical and provenance of the Cretaceous black shales, Duwi Formation, Quseir-Safaga, Red Sea Coast Egypt. Egypt J. Geol. 2014, 58, 303–322. [Google Scholar]
  56. Abou El-Anwar, E.A.; Mekky, H.S.; Abd El Rahim, S.H.; Aita, S.K. Mineralogical, geochemical characteristics and origin of Late Cretaceous phosphorite in Duwi Formation (Geble Duwi Mine) Red Sea region, Egypt. Egypt J. Pet. 2017, 26, 157–169. [Google Scholar] [CrossRef] [Green Version]
  57. Roaldset, E. Mineralogical and Chemical Changes during Weathering, Transportation and Sedimentation in Different Environments with Particular References to the Distribution of Yttrium and Lanthanide Elements. Ph.D. Thesis, University of Oslo, Oslo, Norway, 1978. [Google Scholar]
  58. Hayashi, K.I.; Fujisawa, H.; Holland, H.D.; Ohmoto, H. Geochemistry of ~1.9 Ga sedimentary rocks from ortheastern Labrador, Canada. Geochim. Cosmochim. Acta 1997, 61, 4115–4137. [Google Scholar] [CrossRef]
  59. Cox, R.; Lower, D.R.; Cullers, R.L. The influence of sediment recycling and basement composition evolution of mudrock chemistry in the southwestern United States. Geochim. Cosmochim. Acta 1995, 59, 2919–2940. [Google Scholar] [CrossRef]
  60. Nesbitt, H.W.; Young, G.M. Early Proterozoic climates and plate motions inferred from major element chemistry of lutites. Nature 1982, 199, 715–717. [Google Scholar] [CrossRef]
  61. McLennan, S.M. Weathering and global denudation. J. Geol. 1993, 101, 295–303. [Google Scholar] [CrossRef]
  62. Hunt, J.M. Petroleum Geochemistry and Geology, 2nd ed.; Freeman and Company: New York, NY, USA, 1996; p. 743. [Google Scholar]
  63. Dembicki, H. Three common source rock evaluation errors made by geologists during prospect or play appraisals. AAPG Bull. 2009, 93, 341–356. [Google Scholar] [CrossRef]
  64. Jackson, K.S.; Hawkins, P.J.; Bennett, A.J.R. Regional facies and geochemical evaluation of southern Denison Trough. APEA J. 1985, 20, 143–158. [Google Scholar] [CrossRef]
  65. Dahl, B.; Bojesen-Koefoed, J.; Holm, A.; Justwan, H.; Rasmussen, E.; Thomsen, E. A new approach to interpreting Rock-Eval S2 and TOC data for kerogen quality assessment. Org. Geochem. 2004, 35, 1461–1477. [Google Scholar] [CrossRef]
  66. Espitalie, J.; Deroo, G.; Marquis, F. Rock-Eval pyrolysis and its application. Inst. Fr. Prepr. 1985, 33578, 72. [Google Scholar]
  67. Langford, F.F.; Blanc-Valleron, M.M. Interpreting Rock-Eval Pyrolysis Data Using Graphs of Pyrolizable Hydrocarbons vs. Total Organic Carbon. AAPG Bull. 1990, 74, 799–804. [Google Scholar]
  68. Taylor, G.H.; Teichmüller, D.A.; Diessel, C.F.K.; Littke, R.; Robert, P. Organic Petrology; Gerbrüder Borntraeger: Berlin, Germany, 1998; p. 704. [Google Scholar]
  69. Tyson, R.V. Sedimentary Organic Matter-Organic Facies and Palynofacies; Chapman & Hall: London, UK, 1995; p. 615. [Google Scholar]
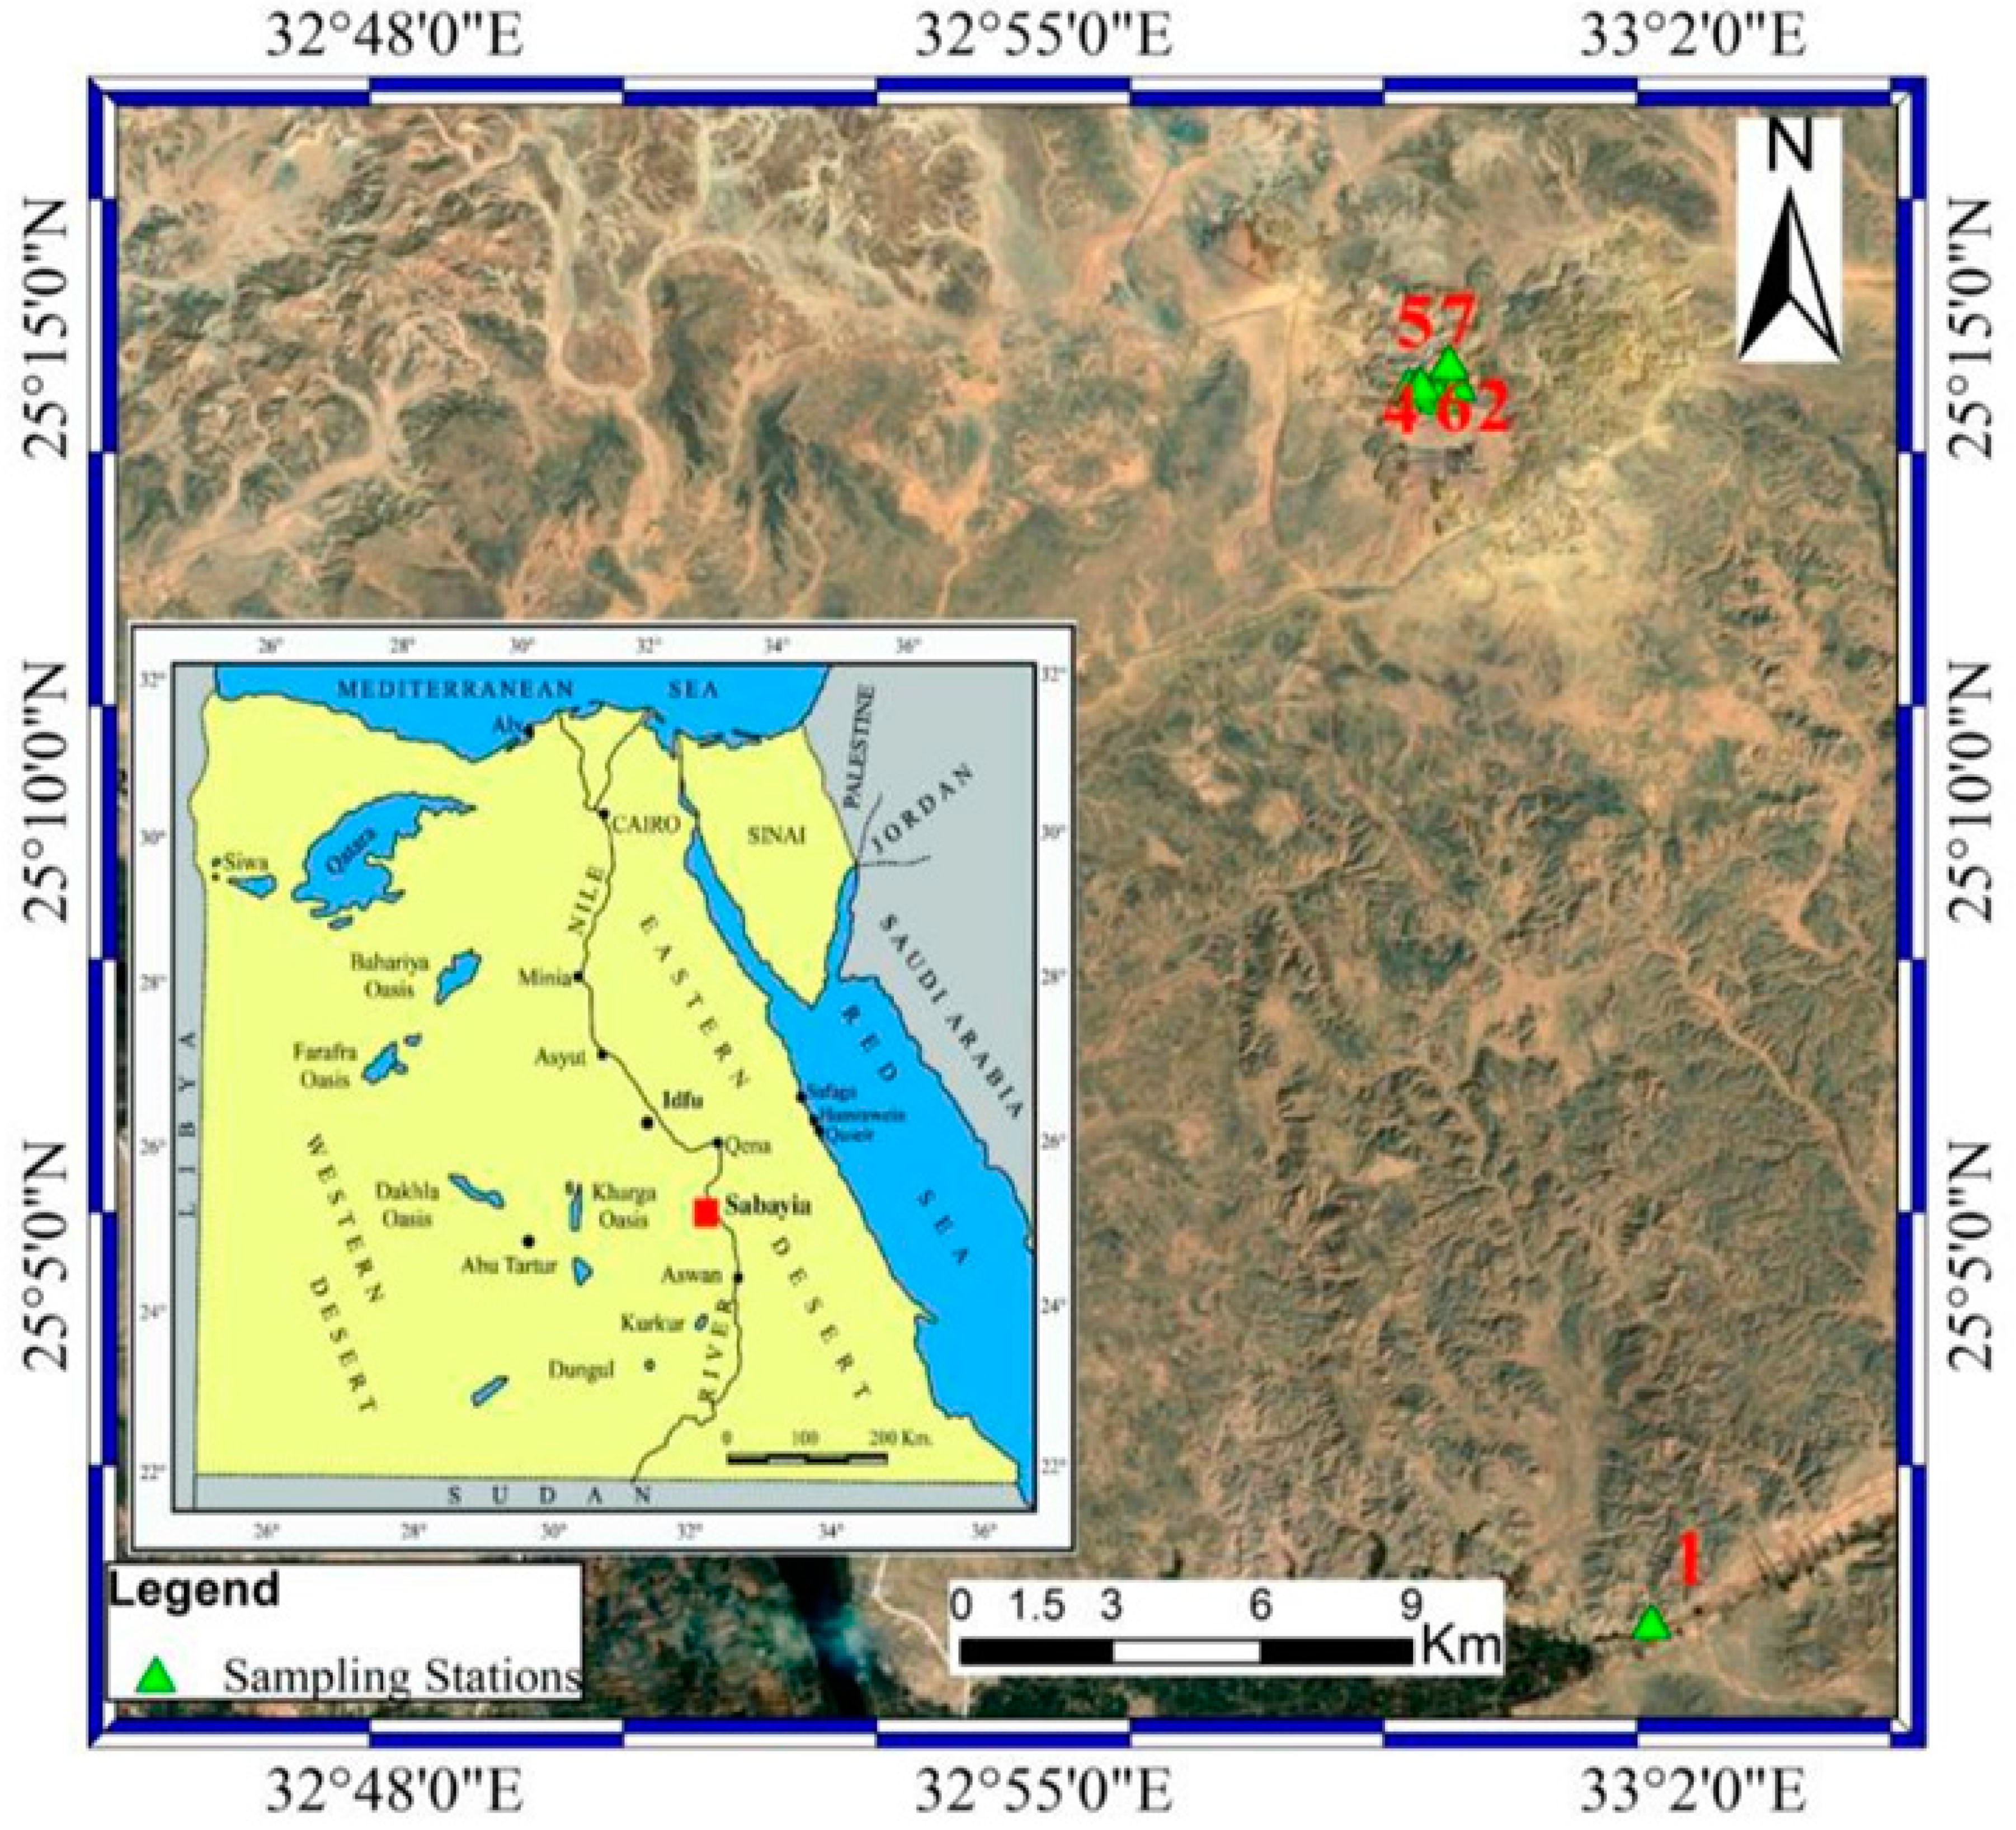
Figure 1. Map of Egypt showing the location of the El Sebaiya study area in the Nile Valley. The aerial photograph (right) shows the sampling location.
Minerals 11 01416 g001
Figure 2. Lithostratigraphic cross section of the study area. The mine cut wall showing the overburden rocks and mined phosphorite bed and sampled black shale bed are shown on the right side of the figure.
Minerals 11 01416 g002
Figure 3. X-ray diffractogram of the studied samples.
Minerals 11 01416 g003
Figure 4. SEM image of the studied samples.
Minerals 11 01416 g004
Figure 5. Plot showing the correlation between Zr, Cd, Zn, Pd, V and Mo with Upper Continental Crust (UCC) value [14] and Post Archaean Australian Shale (PAAS) [28].
Minerals 11 01416 g005
Figure 6. Plots of the studied sandstones on the diagram adopted by Roaldset [57].
Minerals 11 01416 g006
Figure 7. (a) Organic richness of the El Sebaiya samples, Nile Valley, Egypt [20]; (b) TOC vs. S1 of the El Sebaiya samples, Nile Valley, Egypt [63]; (c) and source potential rating of the El Sebaiya samples based on S1 + S2 vs. TOC [64].
Minerals 11 01416 g007
Figure 8. (a) Modified van Krevelen diagram of the El Sebaiya samples [19]; (b) TOC versus S2 cross plot for the El Sebaiya samples [65]; (c) and source rock characterization using plot of HI vs. TOC for the El Sebaiya samples [64].
Minerals 11 01416 g008
Figure 9. (a) Tmax values of the sample; (b) thermal maturation of the El Sebaiya samples, Nile Valley, Egypt [66]; (c) Tmax vs. production index (PI) values of the El Sebaiya samples, Nile Valley, Egypt (modified from [62]).
Minerals 11 01416 g009
Figure 10. Palynofacies images of the studied samples. (1,2) Senegalinium granulostriatum dinoflagellates. (3) AOM grain with granular texture and mineral inclusions. (4,5) Deltoidospora spp. The scale bar is 20 µm. (6) Todisporites spp.
Minerals 11 01416 g010
Figure 11. All pairs are for the same microscopic fields. Photomicrographs of organic facies of sample no. 1. Scale bar is 20 µm except no. 3 is 50 µm. 1, 4, 6, 8, 13 are in incident white light, 15 Palynofacies in transmitted light. Other photomicrographs are in fluorescence mode. The (1,2) Alginite grains appear brown in white incident light and yellow in fluorescence mode; (3) micro-laminae are parallel to the bedding surface with different organic composition; the lower coarse-grained micro-laminae have lower organic content; the fine-grained micro-laminae have thin sheets of alginate; (4,5) Brown tracheid grains are without any fluorescence along with bituminous groundmass and dispersed pyrite crystals; (6,7) Alginite have strong yellow fluorescence that merges with non-fluorescence grain; (810) have a thick organic sheet of brown organic matter without any fluorescence; these sheets are composed of lobes that can be attributed to algal cells; (11,12) Alginite sheet of different layers and structure; (13,14) vitrinite grain, and (15) Palynofacies rich in granular AOM.
Minerals 11 01416 g011
Figure 12. All pairs are for the same microscopic fields. Scale bar is 20 µm for photomicrographs except 1, 2 and 13 is 50 µm. 3, 5 and 12 are in incident white light; 2 and 1 Palynofacies in transmitted light. The other photomicrographs are in fluorescence mode; (1,2) organic-facies of sample no. 2; (314) organic facies of sample no. 3, 1 Micro-laminae, similar to sample no; 1. 2 palynofacies of sample no. 2 that are rich in terrigenous organic matters such as wood tracheid, cuticles, and AOM; 3–6 vitrinite particles, dinoflagellate, and acritarchs with bituminous groundmass; 7 cutinite particle with yellow fluorescence; 8 and 9 dinoflagellate with yellow fluorescence color. 10 and 14 Botryococcus grain with yellow fluorescence color; 11 and 12 Sphagnum leaf cuticle showing no fluorescence; 13 Palynofacies of sample no. 2 with abundant dinoflagellate, cuticles, and AOM.
Minerals 11 01416 g012
Figure 13. All pairs are for the same microscopic fields. Scale bar is 20 µm in all photomicrographs except 3, 6, 9–12, 14 and 15 is 50 µm; 1, 4, 7 are in incident white light, 2, 5, 6, 8, 11, 12, 13 and 15 are in florescence mode; 3, 9, 10 and 14 are in transmitted light; (13,6) sample no. 4; (4,5,712) sample no. 5; (1315) sample no. 6; 1 and 2 same field; large enrichment with bituminous groundmass that has yellow color fluorescence; 3 and 6 palynofacies that are enriched in granular AOM and diffused edge with pyrite specks and dinoflagellate inclusions; the AOM grains have weak yellow fluorescence; 4, 7 and 8 alginite grains with yellow color fluorescence; 9 and 12 palynofacies enriched in cuticles that are distinguished by yellow color fluorescence; 10 and 11 palynofacies enriched in tracheids and wood phytoclasts with yellow color fluorescence; 13 low alginite content with yellow fluorescence color; 14 and 15 palynofacies enriched in brown woods, tracheids, and resin having orange fluorescence color.
Minerals 11 01416 g013
Figure 14. Scale bar is of (13) is 50 µm; (46) is 20 µm; (79) is 50 µm; (10) is 20 µm 6. Sample no. 7 photomicrographs; 1–3, 5, 6 and 9 are in fluorescence mode; 7 and 8 are in transmitted light; 10 is in incident light; 1 Dense layered alginite and tracheids with thin laminae of coarse grains; 2 Low density sheets of alginite and tracheids; 3 Corse grains of shell fragments grading into dense layer of laminated alginite and tracheids; 4 and 5 pyrite framboids sheets; 6 unidentified organic matter structure; 7 and 8 Palynofacies with abundant tracheid sheets and brown phytoclasts and frequent dinoflagellate of yellow fluorescence color; 10 vitrinite grain.
Minerals 11 01416 g014
Table 1. Classes of EF and CF.
IndexIndex ValueSoil Quality
EFEF < 2depletion to minimal enrichment
2 ≤ EF < 5moderate enrichment
5 ≤ EF < 20significant enrichment
20 ≤ EF < 40very high enrichment
EF ≥ 40Extremely high enrichment.
CFCF < 1low CF
1 ≤ CF < 3moderate CF
3 ≤ CF < 6considerable CF
CF ≥ 6very high CF
Table 2. Major oxide (%) and trace element (ppm) content of the studied black shale of El Sebaiya and ratios.
SampleSiO2TiO2Al2O3Fe2O3MgOCaONa2OK2OP2O5SO3ClLOIVCrMnCoNiCuZnAsZrCdPb
%ppm
149.41.015.89.02.60.71.50.90.10.12.116.6104.081.2321.417.342.013.752.50.4249.62.210.9
259.70.59.64.41.84.00.60.72.22.30.113.881.594.196.69.246.39.7149.72.976.72.612.6
358.90.814.64.81.91.80.90.80.51.70.113.0106.885.363.014.538.610.881.92.1151.62.614.4
461.00.611.35.11.72.20.70.71.02.40.113.2120.190.761.97.337.60.567.72.763.92.511.4
553.41.117.06.11.41.31.11.30.74.40.111.777.177.7298.114.132.99.7105.26.0354.82.314.6
648.61.315.37.51.22.10.91.51.15.70.113.891.782.0322.016.235.710.448.60.8397.93.413.2
748.11.514.17.61.22.60.91.60.55.50.116.080.178.7222.117.133.911.461.80.0348.02.314.0
Min48.10.59.64.41.20.70.60.70.10.10.111.777.177.761.97.332.90.548.60.063.92.210.9
Max61.01.517.09.02.64.01.51.62.25.72.116.6120.194.1322.017.346.313.7149.76.0397.93.414.6
Mean54.21.014.06.31.72.10.91.10.93.20.414.094.584.2197.913.738.19.581.12.1234.62.613.0
SampleRbSrThMoLaUCIAU/ThV/CrTOC/PV/(V + Ni)Cr/NiNi/CoU/MoAl/SiV/NiK2O/Al2O3Al2O3/TiO2
ppm
124.6216.210.41.326.21.780.780.161.284.80.561.932.431.310.322.480.0515.84
221.5194.87.624.530.74.883.990.630.872.90.462.035.030.200.161.760.0819.59
332.6165.313.36.122.12.684.610.201.257.80.562.212.660.430.252.770.0617.83
425.1134.77.931.518.34.584.300.571.324.00.572.415.150.140.183.190.0619.45
536.115311.21.739.81.882.520.160.993.90.502.362.331.060.322.340.0815.27
638.1174.714.32.321.32.382.690.161.122.00.532.302.201.000.312.570.1011.76
740.6178.911.82.245.81.581.160.131.025.20.502.321.980.680.292.360.119.59
Min21.5134.77.61.318.31.580.780.130.872.00.461.934.511.150.202.340.079.59
Max40.6216.214.331.545.84.884.610.631.327.80.572.412.680.150.282.590.0919.59
Mean31.23173.9410.99.9429.172.7482.860.291.124.40.532.222.840.280.262.430.0815.39
Table 3. Correlation matrix between the studied major and trace elements.
SiO2TiO2Al2O3Fe2O3MgOCaONa2OK2OP2O5SO3ClLOIVCrMnCoNiCuZnAsZrCdPb
SiO21.00
TiO2−0.911.00
Al2O3−0.670.711.00
Fe2O3−0.910.720.621.00
MgO0.17−0.450.000.171.00
CaO0.41−0.38−0.85−0.58−0.361.00
Na2O−0.550.400.810.730.52−0.901.00
K2O−0.800.940.570.51−0.70−0.130.141.00
P2O50.48−0.52−0.76−0.62−0.300.88−0.81−0.221.00
SO3−0.450.670.200.11−0.950.21−0.310.870.161.00
Cl−0.380.050.310.690.82−0.560.78−0.23−0.52−0.631.00
LOI−0.560.330.010.700.39−0.070.330.10−0.34−0.210.681.00
V0.42−0.45−0.17−0.110.49−0.310.07−0.64−0.30−0.580.250.041.00
Cr0.81−0.89−0.92−0.700.210.68−0.69−0.780.73−0.42−0.22−0.180.371.00
Mn−0.890.730.750.85−0.07−0.550.680.67−0.390.340.450.29−0.43−0.771.00
Co−0.880.850.800.790.03−0.540.670.67−0.650.230.410.48−0.32−0.850.731.00
Ni0.43−0.72−0.62−0.250.660.43−0.19−0.740.49−0.700.360.260.180.74−0.37−0.371.00
Cu−0.640.510.520.550.25−0.230.520.39−0.29−0.020.450.46−0.52−0.530.570.830.101.00
Zn0.58−0.59−0.52−0.69−0.020.63−0.47−0.350.74−0.13−0.35−0.44−0.440.53−0.42−0.550.48−0.051.00
As0.48−0.360.04−0.55−0.18−0.02−0.08−0.160.260.03−0.39−0.85−0.230.08−0.13−0.46−0.15−0.330.621.00
Zr−0.900.940.790.69−0.45−0.430.460.93−0.410.680.050.14−0.55−0.890.870.81−0.690.53−0.46−0.141.00
Cd−0.080.11−0.06−0.08−0.420.23−0.390.240.400.45−0.39−0.250.020.160.090.01−0.05−0.07−0.17−0.190.211.00
Pb−0.100.420.36−0.26−0.610.07−0.150.57−0.010.59−0.64−0.48−0.57−0.430.020.30−0.560.270.220.340.440.111.00
Shadow: Correlation is significant at the 0.01 level. Bold: Correlation is significant at the 0.05 level.
Table 4. Calculated values of EF and CF for the studied shale trace elements.
IndexSNAsCdCoCrCuNiPbZnVThU
EF10.026.860.280.250.140.250.180.220.300.280.18
20.5526.370.490.930.320.900.682.040.770.661.62
30.2013.340.390.430.180.380.390.560.510.580.44
40.6230.430.461.080.020.880.731.111.360.821.83
50.255.040.160.170.070.140.170.310.160.210.13
60.036.650.160.160.070.130.140.130.170.240.15
70.005.140.200.170.080.150.170.190.170.230.11
mean0.2412.400.310.450.120.400.350.650.490.430.64
CF10.0824.441.000.880.490.890.640.781.070.990.63
20.6028.890.531.020.350.990.742.230.840.721.78
30.4428.890.840.930.390.820.851.221.101.270.96
40.5627.780.420.990.020.800.671.011.240.751.67
51.2525.560.820.840.350.700.861.570.791.070.67
60.1737.780.940.890.370.760.780.730.951.360.85
70.0025.560.990.860.410.720.820.920.831.120.56
mean0.4428.410.790.920.340.810.771.210.971.041.02
Table 5. Organic geochemical analysis data of the El Sebaiya samples, Nile Valley, Egypt.
Sample No.Sulfur wt.%TOC wt.%S1 mg/gS2 mg/gS3 mg/gTmaxHIOIPIS1 + S2S2/S3Ro
10.140.21NDNDNDNDNDNDNDNDNDND
22.482.770.1811.340.61426409220.0211.5218.59
31.961.710.042.560.34435150200.022.607.530.44
42.521.740.085.090.32429293180.025.1715.910.53
55.231.200.061.040.2743387230.051.103.85
65.140.980.050.770.2243179220.060.823.50
72.951.130.070.980.4743487420.071.052.09
Sulfur wt.% = Total Sulfur; TOC wt.% = Total organic carbon; S1: Free hydrocarbons content, mg HC/g rock; S2: Remaining hydrocarbon generative potential, mg HC/g rock; S3: Carbon dioxide yield, mg CO2/g rock; Tmax = Temperature at maximum of S2 peak (°C); HI: Hydrogen index = S2 × 100/TOC, mg HC/TOC; OI: Oxygen index = S3 × 100/TOC, mg CO2/g TOC; PI: Production index = S1/(S1 + S2); Ro = Reflectance (%).
Publisher’s Note: MDPI stays neutral with regard to jurisdictional claims in published maps and institutional affiliations.