Article

Microbial Diversity and P Content Changes after the Application of Sewage Sludge and Glyphosate to Soil

by
Urszula Wydro
1,*,
Elżbieta Wołejko
1,
Bożena Łozowicka
2 and
Agata Jabłońska-Trypuć
1
1
Department of Chemistry, Biology and Biotechnology, Faculty of Civil Engineering and Environmental Sciences, Bialystok University of Technology, 15-351 Białystok, Poland
2
Institute of Plant Protection–National Research Institute, 15-195 Białystok, Poland
*
Author to whom correspondence should be addressed.
Minerals 2021, 11(12), 1423; https://doi.org/10.3390/min11121423
Submission received: 10 November 2021 / Revised: 8 December 2021 / Accepted: 14 December 2021 / Published: 16 December 2021
(This article belongs to the Special Issue Application of Mineral-Based Amendments, Volume II)

Abstract

:
Pesticides, despite their side effects, are still being used in almost every agriculture, horticulture, maintaining municipal greenery in urban areas and even in home gardens. They influence human life and health and the functioning of entire ecosystems, including inanimate elements such as water and soil. The aim of the study was the evaluation of the suitability of sewage sludge in improving the quality of soil treated with a non-selective herbicide-glyphosate, applied as Roundup 360 SL. A pot experiment was conducted with the use of two arable soils (MS and OS), which were amended with sewage sludge (SS), glyphosate (GL) and sewage sludge with glyphosate (SS+GL). Soil samples were taken after 24 h, 144 h and 240 h and total phosphorus (TP) content (TP), total number of bacteria/fungi, activity of dehydrogenases (Dha), acidic phosphatase (Acp), alkaline phosphatase (Alp), genetic biodiversity of bacteria/fungi using the terminal restriction fragment length polymorphism method were determined. The application of SS and GL to OS caused an increase in Acp (approximately 35%) and a decrease in Alp activity (approximately 20%). Additionally, GL may influence on an increase in the number of fungi and the decrease in the number of bacteria. In soil with SS+GL increase in the fungal diversity in MS and OS was also observed. Moreover, a positive between TP and the number of bacteria and the activity of phosphatases correlation was reported. The obtained results indicate that analyzed sewage sludge could be potentially applied into soil in in situ scale and could constitute a valuable reclamation material.

1. Introduction

Every day the world of technology and the scientific sector are intensively developing and newer and newer solutions that significantly facilitate human life are being found. However, these facilities they may sometimes pose a threat to the environment. One of the greatest problems of the modern economy is ensuring that there is enough food for the rapidly growing human population [1]. The problem is particularly serious in fully or very poorly industrialized areas where, on the one hand, it is imperative to protect the natural environment, but on the other hand, there is a need to make better use of the already insufficient arable land [2]. As a result, actions are taken to increase the efficiency of crops and minimize their losses by eliminating weeds that threaten target crops, which consist food for people. One of the most effective concepts to achieve the intended goals is the use of herbicides in the agricultural sector [3].
Herbicides are the most commonly used type of pesticides in the world. One of the compounds belonging to the most popular representatives of this group is glyphosate (GL), which is extremely effective and has a wide spectrum of biological activity. This non-selective herbicide blocks the activity of the key plant enzyme EPSP (5-endolpyruvate shikimoyl-3-phosphate synthase), as a result of which the proper functioning of plant cells is disturbed [4]. Additionally, it is important that the herbicidal compounds are used in the form of preparations (e.g., Roundup). Apart from the main active substance, they contain many other auxiliary agents that significantly increase the effectiveness of eliminating segetal plants. Glyphosate has various application areas, i.e., agriculture, horticulture, plant cultivation, orchards, vineyards and forestry, as well as non-food crops in-volving weeding in uncultivated and aquatic areas, home gardens and for road maintenance [5].
According to Sang et al. [6] and Grube et al. [7], glyphosate is persistent in the environment and detectable in rainwater. Its environmental durability is defined as half-life (DT50) ranging between 0.8 and 151 days [4]. It also shows the possibility of accumulation in surface water, due to its affinity to the clay soil particles. Glyphosate is highly controversial [8]. This is mainly due to the belief that it is harmful to non-target organisms such as human and animal and that it has a negative impact on the natural environment [9]. Until recently, scientists presented numerous studies indicating a neutral, and in some cases even positive, health effects of glyphosate. Along with the progress of science, more and more evidence begins to appear refuting earlier beliefs [10].
While the use of herbicides, including glyphosate, has many advantages, it also has negative environmental effects. They mainly result from unskillfulness and inconsistent with good practice of use [11]. One of the parameters showing the state of the natural environment in detail is soil microbiological biodiversity and its activity [11]. The concept of biodiversity describes the variability of life forms at all levels of biological organization or the entirety of genes, species and natural ecosystems that can be found in a given geographical region [12]. Literature data indicate that soil biodiversity significantly helps to maintain soil health fertility and to mitigate changes caused by climatic conditions. It is also connected with processes of storing and purifying water, providing antibiotics and preventing the erosion process. Additionally, soil enables plants to grow, animals to feed, and humans-to obtain resources necessary for life [13].
Losing biodiversity is one of the world’s most pressing challenges [14,15]. The microflora in the soil plays a key role in the proper course of most of the processes taking place in it, including the circulation of matter, and the transformation of organic and inorganic substances. It breaks down not only pollutants and toxic substances, but also pesticides, which include, among others herbicides, e.g., glyphosate discussed in the present work [15]. Herbicides accumulated in the soil may disturb the proper functioning of the soil environment [16]. As a result, this may lead to quantitative and qualitative changes in the species composition of soil microorganisms, and even to their internal modification, which may ultimately result in a reduction in soil fertility and productivity [17]. Indicators that reflect the condition of the soil include activity of enzymes such as dehydrogenases (Dha) or phosphatase (Alp—alkaline phosphatase, Acp—acid phosphatase), the number of bacteria and fungi or the genetic structure of microorganisms [18]. These are parameters that react quickly to changes in environmental conditions [15,19]. Dehydrogenases are intracellular enzymes that are responsible for respiratory processes in microorganisms, whose intensity corresponds to the dynamics of organic matter decomposition [20]. In turn, phosphomonoesterases (Alp and Acp) cause the hydrolysis of organic phosphorus compounds derived from nucleic acids, phospholipids, and other ester phosphates to inorganic forms available to plants [21]. The analysis of soil enzymatic activity is a crucial factor indicating the optimal conditions for the crop productivity and development [17].
One of the most important plant nutrients is P [22]. It is responsible for the proper functioning and development of not only plant cells, but also entire structures such as roots, stem and leaves [23]. In addition, it participates in biochemical processes, including the activation and deactivation of intracellular enzymes and cell division. P is also a component of molecules involved in various processes in the plant cell (e.g., ATP adenosine triphosphate, CTP cytidine triphosphate, GTP—guanosine triphosphate) and nucleic acids [24]. Due to the fact that a large pool of P in the soil is inaccessible or difficult to access for plants, it is necessary to provide P in the form of mineral and/or organic fertilizers in order to obtain optimal yields [25].
In order to restore the health of the soil exposed to pollution, a variety of reclamation and remediation treatments can be used to improve the quality of the soil and to support the decomposition of pollutants. They include, i.e., application of organic substrates such as sewage sludge (SS) [26]. The use of sewage sludge for environmental purposes brings many benefits due to its fertilizing properties [27]. The condition for their use is compliance with the standards in force in the legal provisions regarding the content of heavy metals and sanitary pollutants, including pathogenic microorganisms-bacteria of the Salmonella spp., and the presence of parasites eggs [28,29]. Sewage sludge can be used as follows, in agriculture as a fertilizer, for the reclamation of degraded soils, for the reclamation and plant stabilization of soilless areas, e.g., excavations, dumps and landfills directly after processing or after composting [30]. The fertilizing value of sewage sludge consists of many physicochemical factors, including their structure, the content of organic matter, micro and macroelements constituting nutrients for plants and influencing the fertility of sewage-amended soil. In addition, sewage sludge applied to the soil may have a positive effect on the microbiological activity of the soil, which translates into the release of nutrients from organic and inorganic compounds and support the decomposition and removing of pollutants [17].
Most of the published work focuses on studying the effects of pesticide/glyphosate use on carbon, nitrogen and phosphorus mineralization [15,31,32]. On the other hand, there is little or no comprehensive research analyzing the effect of the combined use of sewage sludge and pesticides/glyphosate on soil phosphorus in relation to soil biological properties [31]. Moreover, most studies on the impact of SS and/or GL on soil quality conducted on a laboratory scale are based mainly on the analysis of mineral cultivated soils (sandy loam, sandy clay), while there are no reports on the analysis of soils with higher (>8–10%) organic carbon content.
The aim of the paper is to study if sewage sludge application is low cost/good/appropriate solution in improving the quality of soil exposed to glyphosate. In order to support this hypothesis, we determined the activity of enzymes (Dha, Alp, Acp), the number of bacteria/fungi and in the genetic structure of the bacterial and fungal community in two arable soils after the application of glyphosate and sewage sludge. The novelty of this study is mainly the analysis of microbiological biodiversity which allows for knowing changes tendency caused by glyphosate and SS application (both, as a single compound and a mixture of compounds). Moreover, the study focusses on the determination of changes in the phosphorus content in soil and its influence on the presented biological parameters which also was not under study yet.

2. Materials and Methods

2.1. Experimantal Design

2.1.1. Soil Characteristics

Two types of arable soils that did not show any history of glyphosate application were used for the pot experiment. The first type of soil was classified as loamy sand on the basis of its granulometric composition and USDA soil classification system (MS), The second soil was loamy sand soil with a higher amount of TOC (OS). Selected properties of the soils used in the experiment are presented in Table 1.
MS and OS for the experiment were taken from a depth of 0–20 cm. Thereafter, both MS and OS were air dried and sieved (<2.0 mm). The prepared soils were later used to setup the pot experiment

2.1.2. Sewage Sludge Characteristics

Sewage sludge from the Municipal Wastewater Treatment Plant in Wysokie Mazowieckie was used in the conducted research. The treatment plant accepts domestic and utility sewage from the entire urban agglomeration as well as sewage from the food industry. The average amount of municipal wastewater flowing into the facility is approximately 1247 m3/d, while the maximum capacity of the treatment plant is 11,200 PE (population equivalent). Sewage sludge samples were collected after the mechanical dewatering process. The physicochemical and biological properties of the sludge used in the experiment are presented in Table 1.

2.1.3. Pot Experiment

In vases 30 cm high and 30 cm in diameter, 4 kg of MS and OS soils were placed, depending on the research variant. Then, stabilized and drained sewage sludge was applied to the soils at a dose of 124 g dm (dry matter) per pot. Subsequently, glyphosate was added to selected vases as Roundup 360 SL in the form of a spray at a dose of 3.12 mg per 1 kg of dm of soil. The experiment was carried out under controlled conditions in a phytotron KK 1450 TCP+ (Pol-Eko, Wodzisław Śląski, Poland) at a temperature 20 °C. In addition, 60% WHC (water holding capacity) with ultrapure water was maintained throughout the experiment.
The following research variants were obtained for both MS and OS:
  • C—control
  • SS—soil with sewage sludge
  • GL—soil with glyphosate
  • SS+GL—soil with sewage sludge and glyphosate (as Roundup 360 SL)
Experiment was established in triplicate.

2.2. Soil Sampling

Soil samples (3) from individual research variants for biological tests were collected from a depth of up to 10 cm. Then, samples from the same test variants were mixed and 3 representative samples were taken. Samples were collected at 24 h, 144 h and 240 h after Roundup 360 SL application. Soil samples for physicochemical and enzymatic analyzes were dried to dry matter, then sieved (2 mm sieve) and stored in plastic containers for analysis. Samples for microbiological testing were transferred to sterile plastic bags and stored at −20 °C to further analysis.

2.3. Soil Analysis

2.3.1. Soil Total Phosphorus Content Analysis during Experiment

Total phosphorus content (TP) was estimated by using Agilent 8800 ICP–MS Triple Quad (ICP–QQQ) System (Agilent Technologies Inc., Santa Clara, CA, USA) after sample digestion in 65% HNO3 (7 mL) with 30% H2O2 (2 mL) using Advanced Microwave Digestion System Ethos Easy (Milestone, Sorisole, Italy).

2.3.2. Analysis of Soil Microbial Quantity and Soil Enzymes Activities

The total number of bacteria and fungi in the soil samples was analyzed by ten-fold dilution method on plate counting according to assays described by Kaczyński et al. [5].
Soil dehydrogenase (Dha) activity was estimated by colorimetric method described by Tabatabai [33] with 3% TTC (2,3,5-triphenyltetrazolium chloride) (Merck KGaA, Darmstadt, Germany) as a substrate and measured by Lambda Bio+ spectrophotometer (PerkinElmer, Boston, MA, USA).
Acid phosphatase (Acp) and alkaline phosphatase (Alp) were determined according to assay presented by Margesin [34] using disodium p-nitrophenyl phosphate hexahydrate (Acros Organics, Vernon Hills, IL, USA) as a substrate. The amount of p-nitrophenol (p-NP) (Merck KGaA, Darmstadt, Germany) was measured photometrically at 400 nm by a microplate reader GloMax®-Multi Microplate Multimode Reader (Promega Corporation, Madison, WI, USA).

2.3.3. Soil Microbial Diversity by Terminal Restriction Fragments Lengths Polymorphism (t-RFLP) Analysis

The genomic DNA was extracted from 0.25 g of the soil samples by using GeneMATRIX Soil DNA Purification Kit (EURx, Gdańsk, Poland) following manufacturer’s protocol. Quantity and purity of DNA was assessed by Lambda Bio+ spectrophotometer (PerkinElmer, Boston, MA, USA) connected with ultra-micro sample-volume spectrometer cell TrayCell (Hellma GmbH, Müllheim/Baden, Germany).
In order to estimate the biodiversity of bacteria and fungi in soil, primers for PCR were selected based on the research presented by Mattana et al. [35]. For bacterial communities, 16S rDNA from soil DNA was amplified using universal eubacterial primers 8F (labelled with fluorescent dye 6FAM, 6-carboxyfluorescein) and 1389R (Table 2). The fungi communities target region included the internal transcribed spacer (ITS) was tested. The ITS1-F primer was also labelled with fluorescent dye 6FAM). The specificity of used primers was depicted in Table 2.
PCR reaction was performed in 30 µL of final sample volume. The reaction mixture contained 15 µL OptiTaq PCR Master Mix (2×) (EURx, Gdańsk, Poland), 0.5 µM of each primer, and 10 ng of soil DNA template. The PCR conditions of eubacterial DNA were as follows: an initial denaturation at 95 °C for 3 min (one cycle); 95 °C for 30 s, 58 °C for 30 s, 72 °C for 1 min (35 cycles) and a final extension at 72 °C for 7 min. The thermocycling conditions of fungal DNA were as follows: an initial denaturation at 94 °C for 4 min (one cycle); 94 °C for 1 min, 55 °C for 1 min, 72 °C for 2 min (40 cycles), with a final extension at 72 °C for 7 min. After amplification, 5 µL of each product was visualized by electrophoresis on agarose gel (1.2%, 40 min, 100 V) containing Simply Safe (EURx, Gdańsk, Poland). The sizes of PCR amplicons were approximately 1300 bp for eubacteria and 700 bp for fungi.
Prior to the t-RFLP analysis, the amplified products were purified by using Exo-BAP Mix (EURx, Gdańsk, Poland) according to manufacturer’s instructions. The 7µL of purified product was digested with 0.6 µL of restriction enzyme Hae III (10 U/µL), (EURx, Gdańsk, Poland) with in the manufacturer’s buffer in the final volume of 10 µL at 37 °C for 2 h. After digestion, the samples were desalted by precipitating [34]. Desalted products (1 µL) were mixed with 10 µL of deionized formamide (Promega, WI, USA) and denatured at 94 °C for 4 min and were analyzed by automatic capillary electrophoresis system QIAxcel Advanced (QIAGEN, Hilden, Germany) equipped with a fluorescent detector. QIAxcel DNA High Resolution Kit (1200) (QIAGEN, Hilden, Germany) containing the QIAxcel DNA High Resolution Gel Cartridge was used for terminal restriction fragments (t-RFs) separation. QX Alignment Marker (15 bp–1 kb) and QX DNA Size Marker (50–800 bp) were included in every QIAxcel run. The obtained peaks were analyzed using QIAxcel ScreenGel software and were normalized by T-Align program [36]. The relative abundance of each t-RF was estimated as the ratio of the height of each peak and the sum of heights of all peaks in one sample. The peaks from 50 bp to 600 bp and with the relative abundance >1% were analyzed in this study.

2.4. Data Analysis

Differences between treatments for studied chemical, enzymatic and microbiological parameters were assessed by analysis of variance ANOVA. The Tukey post-hoc HSD test was used for comparison of the means at significance level of p < 0.05. Principal component analysis (PCA) was performed for comparison of relative abundance of t-RFs. The Pearson’s correlation coefficients were estimated in order to determine the effect of the applied treatments on the phosphorus content and microbiological indicators. The statistica 13.3 package and PAST 4.03 for calculation and graphical presentation of the data was used.
The Venn diagrams were constructed by using online program the Venny 2.1 (https://bioinfogp.cnb.csic.es/tools/venny/) [37] in order to compare tRFs in individual research treatment.
Based on the relative abundance of t-RFs, the Shannon diversity index (H) was calculated. The Jaccard similarity coefficient was estimated based on the presence/absence of peaks in studied profiles [38]. The difference between control and treatment soil was assessed by Dunnett post hoc test at p < 0.05, p < 0.01 and p < 0.001. The one-way PERMANOVA analysis based on the Bray–Curtis coefficient (9999 permutations) was used to assess shifts in the composition of the communities of bacteria and fungi depending on the studied treatments. The PAST 4.03 software (https://past.en.lo4d.com/windows) was applied to analyze the obtained data.

3. Results

3.1. Total Phosphorus Content in Soil

Figure 1 shows the content of TP in the tested soil types (MS and OS) depending on the test variant and sampling date. Regarding MS, own research showed that in soils from SS, GL and SS + GL collected after 24 h, it was significantly higher than in control (0.03%), with the highest content recorded in SS and SS + GL (0.05%). In the second period (144 h), the content of this component in SS and SS + GL was lower by approximately 10%, and in the case of GL-by approximately 2%. In the third period (240 h), the TP content in the SS was 0.04%, while in the other research variants it was at the same level and amounted to 0.03%.
In the OS soil samples, the content of TP was higher than in the MS in the entire research period. As in MS, the TP content in the first term was the highest in SS and SS + GL and amounted to 0.07%, while the lowest value was recorded in C (0.05%). In the second term (144 h) the TP content was lower by approximately 20% (SS) and 15% (GL, SS + GL), while in the third term (240 h) it was lower by approximately 30% (SS) and 20% (GL, SS + GL) than after 24 h.

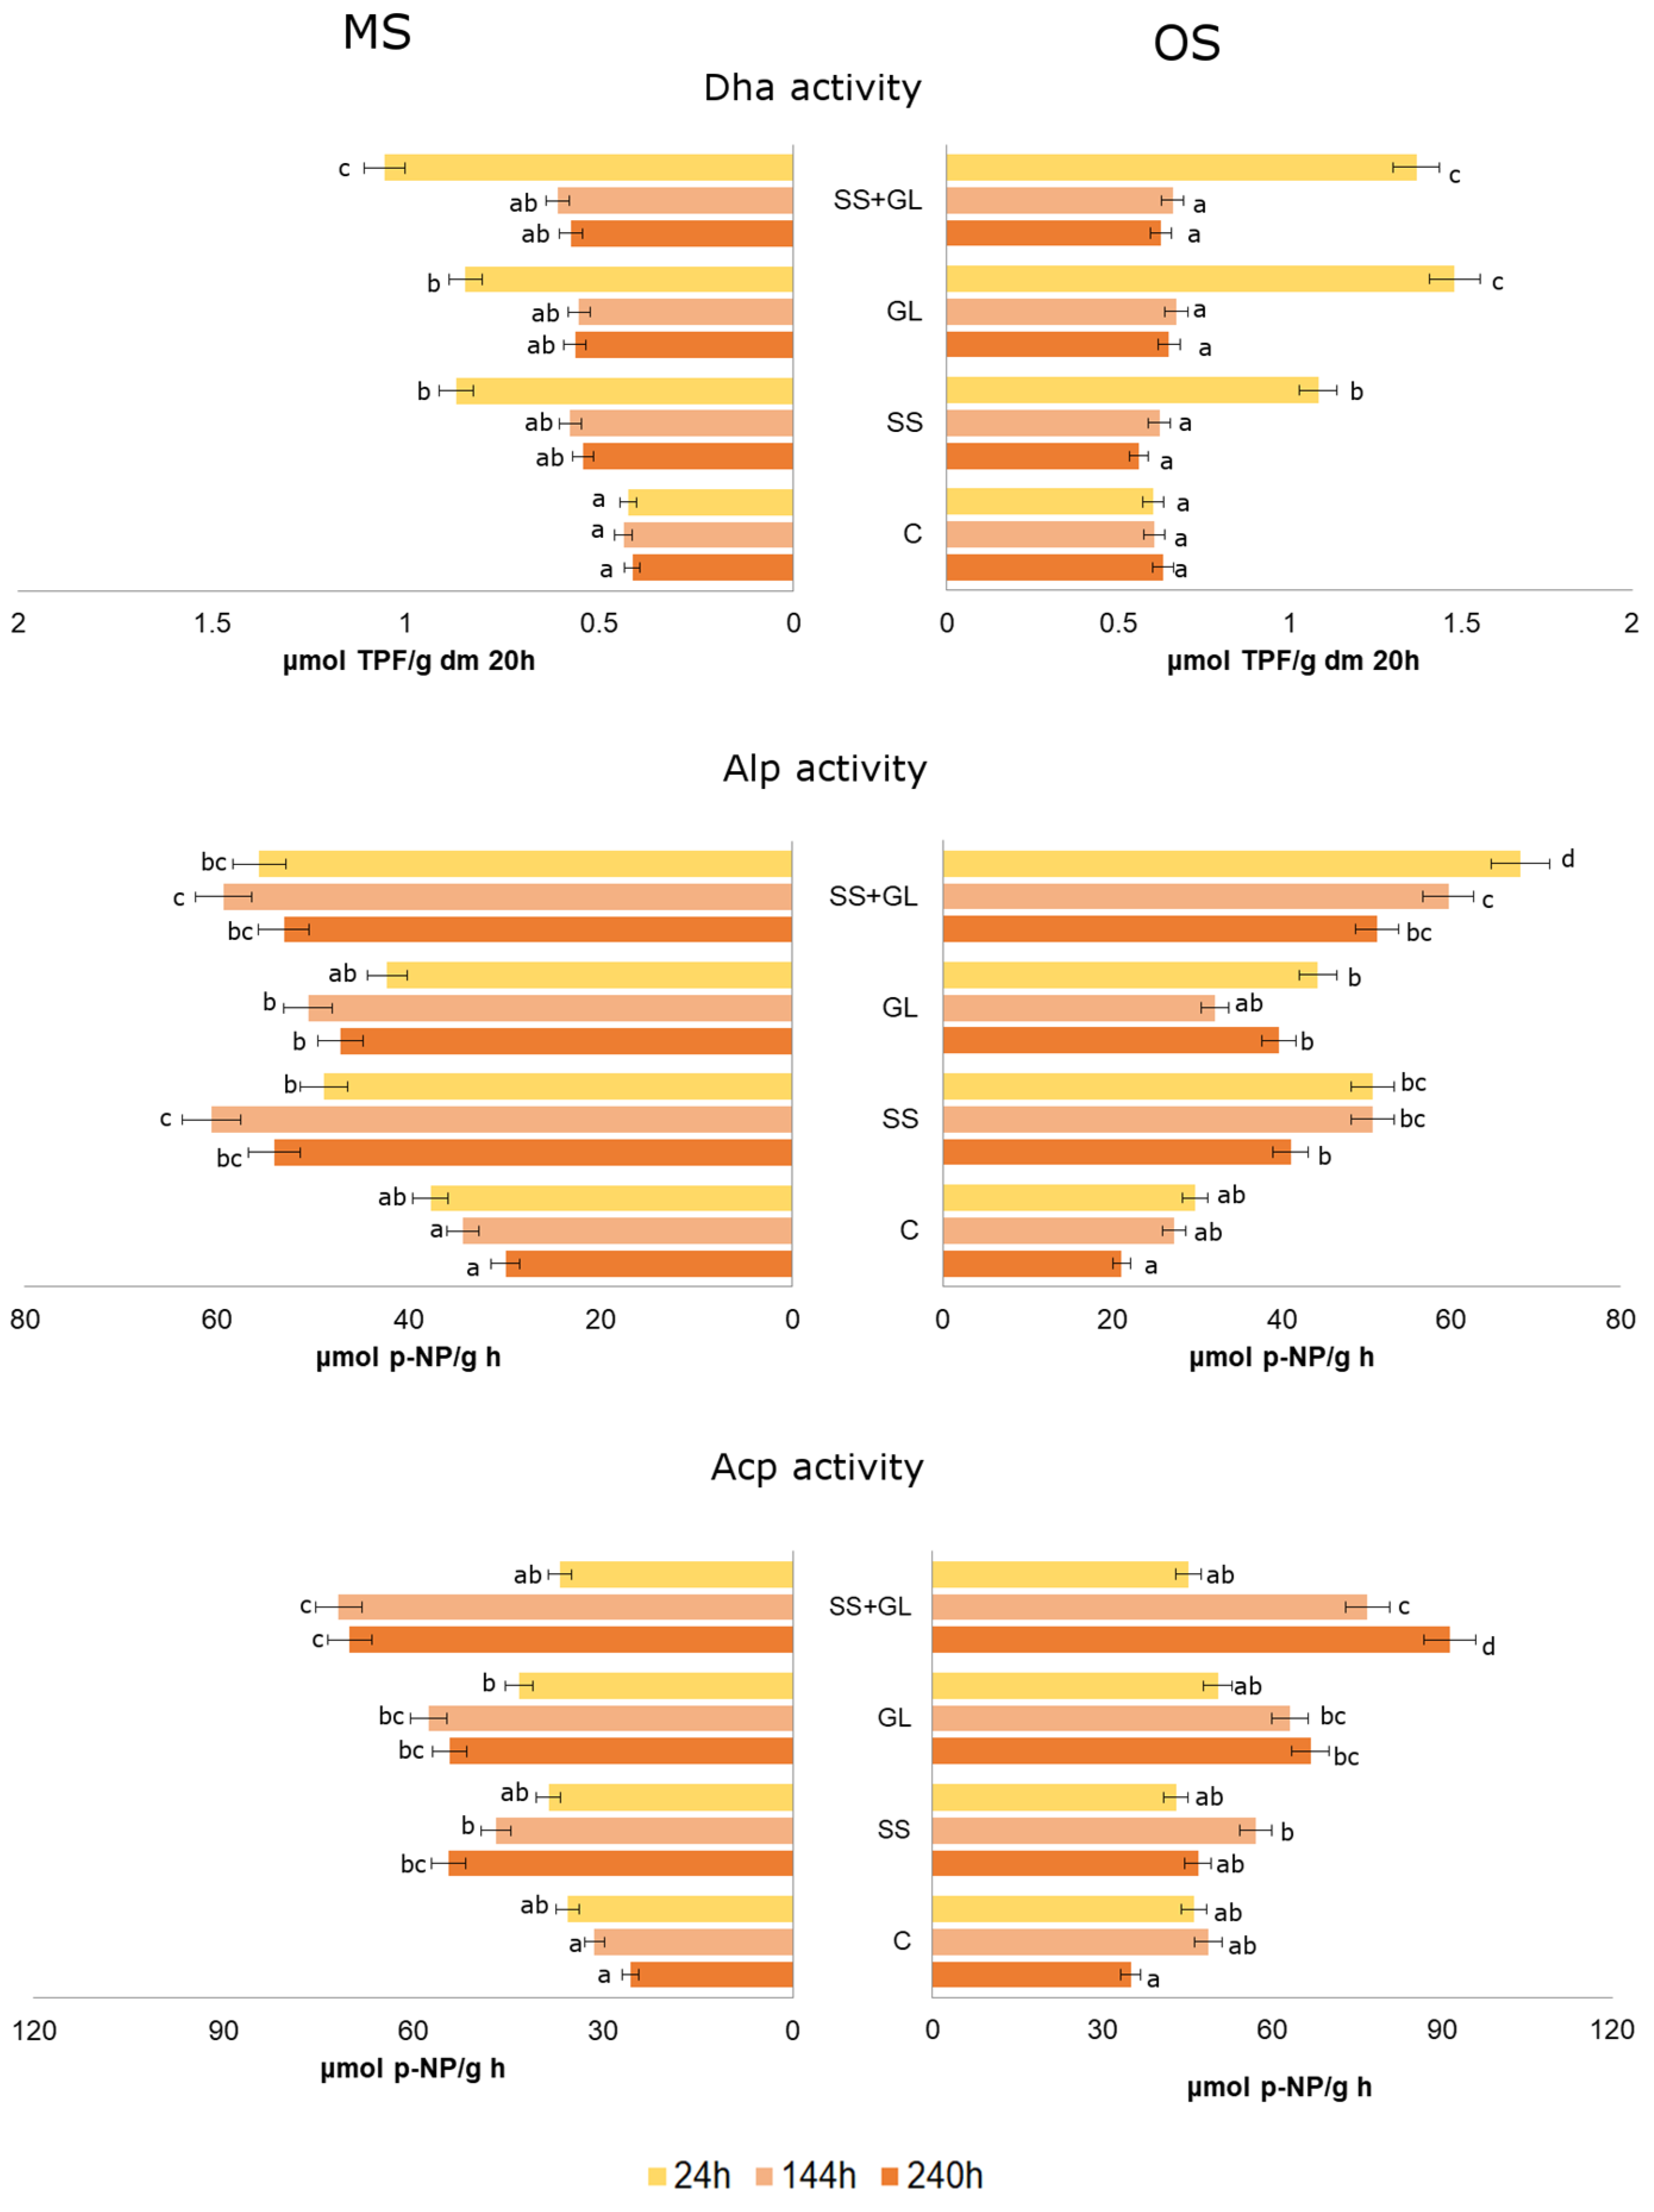
3.2. Soil Microbial Quantity and Soil Enzymes Activities

Figure 2 presents the soil microbial abundance (bacteria and fungi) and Dha, Apc and Alp activity after SS and GL application.
In our study in MS and OS, the total bacterial count after 24 h was 13.8 × 10⁵ CFU/g dm and 26.9 × 10⁵ CFU/g dm respectively, whereas after 240 h, a decrease in the total bacterial count by approximately 26% and 13% respectively was observed. The application of SS, GL and SS + GL in both analyzed soils increased the total bacterial count after 24 h. In MS, there was an increase of approximately 150%, 82% and 179% respectively, while in the OS an increase of 70%, 10% and 84% occurred as compared to the control samples. Each of the analyzed test variants showed a decrease of the total number of bacteria with time measurement.
The number of fungi in both analyzed soils changed significantly depending on the applied combination and sampling date (Figure 2). On average, in MS the number of fungi was approximately 46 CFU/g dm, while in OS approximately 97 CFU/g dm. The highest number of fungi was observed after 240 h in the combination OS + SS and MS + SS + GL and it amounted to 194 CFU/g dm and 183 CFU/g dm, respectively. The application of GL on OS significantly reduced the number of fungi by approximately 60% compared to the control samples. On the other hand, after the application of SS + GL on MS, there was a significant increase in the number of fungi by approximately 500% in comparison with the control.
As presented in Figure 3, Dha activity increased after SS and GL application on both MS and OS after 24 h, while after 240 h this activity was at the level of control samples. The highest increase in Dha activity was observed in the OS + GL combination after 24 h and was 1.48 μmol TPF/g dm 20 h, while the lowest in MS after 240 h was 0.41 μmol TPF/g dm 20 h. The average Dha activity was higher in the organic soil and was approximately 0.79 μmol TPF/g dm 20 h.
In the present study, Acp and Alp activity ranged respectively, from 25 μmol p-NP/g·h (MS after 240 h) to 91 μmol p-NP/g·h for the samples of OS + SS + GL after 240 h and from 21 μmol p-NP/g h (OS after 240 h) to 68 μmol p-NP/g·h for the samples of OS + SS + GL after 24 h (Figure 3). Higher average activity of Acp was for OS and amounted to approximately 56 μmol p-NP/g·h, whereas higher average activity of Alp for MS and it reached approximately 48 μmol p-NP/g·h. The application of SS, GL and SS + GL in MS after 144 h caused a significant increase in the activity of Alp, whereas in OS count after 24 h.

3.3. Soil Microbial Diversity by t-RFLP Analysis

Effect of SS and GL exposure on soil microbiological community structure was examined using t-RFLP analysis. Restriction profiles were obtained, which are characteristic for individual taxa of microorganisms and consist of a pattern of DNA fragments of various lengths. Based on the obtained research, it was found that the composition of microorganisms (bacteria and fungi) differed depending on the type of soil, the research variant and the duration of the experiment.
Figure 4 shows the relative abundance of bacteria in MS and OS types of soil. For bacteria in MS, 16 bacterial tRFs ranging in length from 75–543 bp were detected. The highest number of restriction fragments in the profiles from individual research objects during the entire research period (from 9 to 10) was recorded in the case of SS, while the lowest in GL (from 4 to 7). For the control, from 7 to 8 tRFs were recorded, while for SS + GL treatment, from 7 to 9 tRFs were noted. In samples obtained 24 h after application of GL, relatively the highest abundance was tRF of 467 bp characterized for C, GL and SS+GL (39–50%) and terminal restriction fragment of 284 bp for SS (54%). How it was pointed on Figure 5, tRF of 75 bp (6.3% of all tRFs) it occurred in all research variants, on the other hand in SS and SS+GL also had three common elements (160, 284 and 340 bp) what consisted 18.8% of all tRFs.
In MS samples obtained 144 h after GL application, the highest relative abundance in all treatments was tRF 467 bp and it amounted from 24% (SS + GL) to 45% (GL). Fragments of 235 bp in C, GL and SS + GL exhibited relatively high abundance, which amounted 15–16%. How it was shown in Venn diagram, two tRFs (15.4% of all tRFs) was common for all treatments (75 and 467 bp) and three (258, 284 and 503 bp) were characteristic for SS treatment. In soil samples from MS collected 240 h after GL application, the highest relative abundance was for tRFs 495 bp (75%, C) and of 340 bp (59%, both SS and SS + GL). Figure 5 indicated that 7.1% of all tRFs (222 bp) was common for all treatments, 21.4% of all tRFs (75, 258 and 467 bp) were typical for C, SS and SS + GL treatments. Four tRFs (98, 115, 340 and 503 bp) were common for soil samples from SS and SS + GL.
Regarding bacterial tRF profile in OS type of soil, in all research variants 14 tRFs with length from 76 to 540 bp was detected (Figure 4). The samples taken from the SS (from 6 to 7) were characterized by the highest amount of tRFs in the entire research period. The lowest number of tRFs was found in soil samples collected at 240 h (from 4 to 7). In soil samples collected after 24 h of GL exposure, the highest relative abundance was noticed for tRF of 309 bp (C, 38%), 281 bp (SS, 55%) and 468 bp (GL, 35%). Comparing the occurrence of tRFs in OS in first sampling time, 7.7% of all tRFs common in SS, GL and SS + GL (468 bp) and in C, SS and GL (236 bp) were found (Figure 5). Three of all tRFs (23.1%) were included exclusively in C (309, 496 and 540 bp). At the 144 h time of sampling, the relative abundance of tRF 309 bp in C was increased to 62%. However, the relative abundance of 281 bp tRF was decreased to 7% with increasing tRF of 236 bp (31%). In the case of GL, the relative abundance of tRF 468 bp was higher (46%) than in samples collected after 24 h GL exposure. According to Venny diagram, 7.1% of all tRFs were present in C, SS and SS + GL (82 bp) and in SS, GL and SS + GL (468 bp). Two tRFs were common in SS and SS + GL (203 and 281 bp). In samples of OS collected in the third period of the study (240 h), a reduction in the relative abundance of 309 bp tRF in C was found with an increase in tRF of 236 bp (42%), 82 bp (15%) and 152 bp (14%). In samples from SS, the relative abundance of 236 bp tRF increased to 53%, while in GL the presence of 367 bp tRF with the relative abundance of 39% was noted. As presented in Figure 5, tRF of 82 bp was common in all studied treatments, while tRF of 468 bp was characterized by SS, GL and SS + GL.
The data presented in Table 3 indicate that in both MS and OS, the significantly greatest changes in the bacterial structure of the community occurred in SS (MS and OS) and in SS + GL (OS). PCA analysis constructed for bacterial tRFs in MS and OS presented on biplot (Figure 6) explaining respectively 45% and 50% of total data variability. Moreover, the correlation analysis showed significant positive correlations between TP and the activity of Dha, Alp and Acp and the total number of bacteria (Figure 7). Moreover, a significant positive correlation was found between the content of TP in soil and the presence of tRF 284 bp (MS, r = 0.62) and tRF 281 bp (OS, r = 0.83) in the bacterial profile.
Figure 4 shows fungal community structure in MS and OS as a result of tRFLP analysis and presented as the relative abundance of tRFs. A total of 19 tRFs in MS ranging from 74 to 578 bp were obtained.
In our study, in MS the richness of tRFs during the whole study period was higher in samples collected from SS, GL and SS + GL (8–10) than in control (5–8). The highest amount of tRFs occurred in soil samples collected 240 h after GL application (8–10). The relative abundance of fungal community at first sampling (24 h) in MS was the highest in case of tRFs 296 bp and 323 bp (C, 38% and 31%, respectively), 504 bp (SS; 29%) and 578 bp (SS + GL, 38%). Moreover, two common tRFs (12.5%, 74 and 323 bp) were observed for C, SS and SS + GL and also three common tRFs (18.8%; 486, 541 and 578 bp) in GL and SS + GL (Figure 5). The tRF of 204 bp and tRF of 476 bp were included exclusively in SS and GL, respectively.
In samples collected at 144 h of experiment, in the control the relative abundance of tRFs 323 bp declined to 11%, but the participation of 166 bp tRF increased (z 17 do 30%) (Figure 4). In SS, the relative abundance of 504 bp tRF decreased to 18% along with the increase in tRF of 525 bp (35%). The relative abundance of 427 bp tRF in GL decreased to 3%, but the highest contribution was noticed for tRF of 367 bp (48%). According to Figure 5, 17.6% of all tRFs were common in SS, GL and SS + GL (367, 427 and 578 bp), and tRF 323 bp was common in C, SS and SS + GL. In the third term of samples collection in the control tRF of 339 bp dominated (30%), however in SS, GL and SS + GL tRF of 367 bp (61%, 44% and 48% respectively). As it was shown in Figure 5, 5.3% of all tRFs was common for all treatments (367 bp), but 10.5% of all tRFs was specific only for SS (204 and 541 bp) and 15.8% for SS + GL (276, 486 and 510 bp).
As indicated by the results of the fungal tRFs, in the OS type of soil throughout studied period and in all research variants, a total of 18 tRFs ranging from 96 to 595 bp were demonstrated. The highest richness of tRFs during the experiment occurred in SS + GL (10–11 tRFs), while the lowest in SS (from 5 to 7 tRFs). In the first test period (24 h), in the control the relative abundance was tRF 453 bp (26%), in SS tRF 243 bp (38%) dominated, while in GL and SS + GL, tRF 566 bp (33%) and tRF 297 bp (24%), respectively. According to Figure 5, 11.8% of all tRFs were common in all treatments (408 and 432 bp).
In the second period of the study (144 h) in SS, the relative abundance of tRF 243 bp decreased to 21%, while the highest share was shown by tRF 297 bp (43%). In GL, the highest relative abundance was recorded for tRF 408 bp, while the share of tRF 566 bp decreased to 12%. In the case of SS + GL, the highest relative abundance was for tRF 323 bp (48%). In Figure 5 it was observed that three tRFs (17.6% of all tRFs) were common for C, GL and SS + GL (353, 408 and 566 bp), while two tRFs (297 and 432 bp) were present in C, SS and SS + GL.
In the third period (240 h), in the control, the highest share was shown for tRF 432 bp (58%), and in SS for tRF 366 bp (58%). In GL, the relative abundance of tRF 96 bp increased and was 35%, while in SS + GL the highest relative abundance was observed for tRF 323 bp (38%). As shown in Figure 5, 18.8% of all tRFs are common in SS and SS + GL (243, 297 and 366 bp), while 6.3% of all tRFs were common in SS, GL and SS + GL (453 bp).
On the basis of Table 3, it was noticed that in SS (MS) and GL (OS) there were the greatest significant changes in the structure of fungi compared to the control soil. Moreover, the PCA analysis presented in the biplot (Figure 6) for MS and OS explains 44% and 45% of total data variability, respectively. In turn, the analysis of correlation in MS and OS presented in Figure 7 shows significant positive correlation between the amount of TP in soil and Dha and Alp activity and the presence of tRF 578 bp (MS, r = 0.63) and tRF 243 bp (OS, r = 0.69).
The Jaccard index was used to determine similarity of soil microbial composition between control and sol treatments (SS, GL and SS + GL). As presented in Figure 8, in soil MS the highest similarity in the structure of bacteria to the control was found in soil with GL (144 h, 1.00). Generally, the Jaccard index was significantly the lowest in the samples taken after 240 h from all treatments. Regarding the Shannon diversity index (Figure 8), tRFs bacterial diversity in MS decreased significantly in all studied treatments collected after 240 h and was from 1.01 (C) to 1.35 (GL). The highest H’ indices calculated for bacterial tRFs were observed in samples collected at 144 h of GL exposure (from 1.62 to 1.91).
Comparing the calculated coefficients for bacterial tRFs in OS type of soil, it was demonstrated that the Jaccard similarity index compared to the control was the lowest significantly in the first sampling (0.08; SS + GL) and increased in all treatments in the third sampling period (240 h) from 0.22 (SS + GL) to 0.33 (C). On the other hand, the Shannon diversity index calculated for bacteria in OS were higher than in MS type of soil. The highest diversity index (1.78) was recorded in the soil samples from SS collected after 144 h, compared to the other research dates. However, in the case of SS + GL, the significantly highest H ‘index was recorded in the third period (240 h, 1.62).
In the case of the Jaccard index calculated for the fungal tRFs in MS, the similarity with the control was found in the case of SS (24 h; 0.30) and GL (240 h; 0.42) (Figure 8). The lowest significant similarity was noted for SS + GL (24 h; 0.15) and SS (144 h; 0.08). A higher value of the Shannon diversity index calculated for fungi in MS compared to bacteria was also observed. The significantly highest H’ index was noticed in SS + GL (144 h, 2.15), and the lowest in C at 24 h (1.41). An increasing tendency of the H’ index was also observed with time in the case of GL (from 1.49 to 1.79). In OS, the Jaccard index calculated for fungal tRFs and denoting similarity to control was the lowest in SS (144 h; 0.17), while the highest similarity was observed for SS and GL at 24 h (0.29). Regarding Shannon diversity index, the highest value recorded for C after 24 h (2.09). In the case of SS and SS + GL, a decrease in the value of the H’ index was observed in the samples collected after 144 h and 240 h compared to samples taken after 24 h.

4. Discussion

4.1. TP Content in MS and OS Soils after Sewage Sludge and Glyphosate Application

Phosphorus is one of the most important minerals necessary for plant growth. It acts through the influencing on physiological processes in plants such as photosynthesis and respiration and promotion of root system developing [39]. From an agricultural point of view, calcium and aluminum phosphates are the most important compounds in plant nutrition [40]. Despite many beneficial properties of this component, its content in soil must be controlled due to the risk of eutrophication of water reservoirs [41].
In presented research, it was noted that the content of P in OS was higher than in MS, regardless of the research variant. As literature data indicate, P content and its behavior in soil depend on many factors, including: the type of soil, form of P occurrence, presence of plants, pH, organic matter content, soil management practices. In soils with a high content of organic matter, P may be retained due to sorption, while in soils with a higher content of P, desorption may occur due to competition for the site of sorption in the soil between humic and fulvic acids, the dissolved organic carbon and P [41]. This may explain the behavior of P in OS irrespective of the fertilization applied. In addition, OS amendment with sewage sludge influence on soil structure and improves the stability of soil aggregates which may also have an indirect effect on the mobility of phosphorus [28,42]. After enriching the soil with organic matter from sewage sludge, the phosphorus pool increases, and the form in which it occurs depends on the origin of the sludge and the technology of sludge processing. In sewage sludge, phosphorus occurs as a mixture of inorganic and organic phosphorus in various proportions and with different bioavailability. Organic P dominates, most often in the form of inositol hexakisphosphate and phytate [43,44].
In the presented research, both in MS and OS, after the application of SS and SS + GL, P content increased significantly, and its highest level was observed at the beginning of the experiment. An increase in the P content in sewage sludge-amended soil has been reported in many studies [28,31,44]. However, during the experiment its content in soil gradually decreased, which was confirmed by the study of Kończak and Oleszczuk [45]. According to authors, observed changes are the natural phenomenon and they are a result of soil processes such as mineralization of organic matter, leaching or uptake by microorganisms. This is an undesirable effect from the economic aspect in agricultural management, as it forces the multiple use of sludge to improve soil properties [46].
The conducted research showed that after adding glyphosate to soil, the phosphorus content in the soil increased as compared to the control, but the obtained results were not statistically significant. Moreover, in GL-treated MS, a similar level of phosphorus in the soil was found in three sampling times, while in OS, the highest level of TP in soil was recorded at the beginning of the experiment. According to de Jonge et al. [47] and Kaczyński et al. [5] in general, GL in soil is not mobile because it is strongly bound on clay minerals and hydrated oxides due to the presence of phosphonic acid in GL molecule. In soils rich in phosphorus, a lower sorption capacity of glyphosate is observed, and therefore its leaching as a result of competition for a sorption site with P. It is a factor that may reduce its toxicity in the topsoil, but this may, in turn, result in GL getting into the groundwater [48]. According to Sun et al. [32], as a result of GL degradation, inorganic forms of carbon, nitrogen and phosphorus are released, possibly enriching the soil with these components. Differences in P behavior in GL-treated MS and OS may also due to the soil texture. According to Meftaul et al. [9], glyphosate is leached out faster from sandy soils, while in clay soils it may bind with organic matter and colloid minerals. However, a similar tendency was not observed in our study.
Our research also determined the content of phosphorus in soil treated simultaneously with SS and GL. It was found that the level of this component in MS was similar to the treatment of MS with sediment only. In the case of OS, the content of P in the soil in the first term was similar to that in the SS variant, while in subsequent terms it was higher than in the SS. According to Kaczyński et al. [5] and Suhadolc et al. [31] due to the simultaneous treatment of soils with sewage sludge and glyphosate, the mineralization kinetics change, as a result of which the rate of glyphosate degradation may increase. This phenomenon may also result in enrichment of the soil with phosphorus, which may explain the results of own research for OS. The maintenance of the P content in the OS treated with SS + GL in the next test dates may be explained by the immobilization of phosphorus in soil by organic matter or a decrease in the mineralization intensity, however, these processes are complex and require further research.

4.2. Effect of Sewage Sludge and Glyphosate Application on Soil Microbial Quantity, Enzymes Activities and Microbial Diversity

Literature data [5,15,17,49,50] reported that the enzymatic activity is a biochemical indicator, which is a useful tool for studying the response of microorganisms to amendments or contaminants, because it is sensitive and quickly reacts to changes in habitat conditions. The most important soil enzymes determined as indicators of soil health are Dha and phosphomonoesterases (Alp and Acp). They are responsible for the proper biogeochemical reactions of the C and P cycle and reflect the intensity of organic matter mineralization. Presented results indicate that sewage sludge and glyphosate into soil application changed biological and biochemical properties of soil environment.
The obtained results indicate that Dha activity in MS and OS soils amendment with SS and GL was significantly higher than in control only in the first sampling time. However, the different tendency was observed in the case of Alp and Acp activity. In both MS and OS, the activities of Alp and Acp were varied. However, in the variants amended with sewage sludge and/or glyphosate, significantly higher activities of these enzymes were recorded throughout the study period compared to the control. In addition, the tendency of changes in Acp and Alp activity differed in MS and OS, with a decreasing (for Alp) or increasing (for Acp) trend in OS. The increase in Acp activity in OS soil may be related to the production of low molecular weight acids during decomposition of organic matter as reported by Singh and Agrawal [28]. Moreover, GL can also be used by some microorganisms as a source of C and P, which may result in an increase in the activity of some enzymes, as indicated by Grube et al. [7] and Zhan et al. 2018 [51]. However, as a result of GL biodegradation, aminomethylphosphonic acid (AMPA) may be formed, which may also adversely affect the enzymatic conditions of the soil by inhibiting biochemical reactions.
The response of enzymes to changes in soil is a consequence of combination of many biotic and abiotic factors such as the type of fertilization and/or contamination, as well as the type of soil and its physicochemical properties (i.e., pH, organic matter content, humidity, nutrient status), experiment condition (laboratory or field scale) or type of enzyme. When sewage sludge is being used, its origin, treatment technique and contaminant level are important factors influencing soil quality [28,50,52]. In the study conducted by Alvarenga et al. [53] no effect of sewage sludge application on Dha activity was demonstrated, which partly confirms our results. Similar results for Dha were also obtained by Gryta et al. [50] in soils after application of different doses of dairy sewage sludge. However, the authors also reported no effect of amending soil with sewage sludge on Alp activity which does not support our data. An increase in enzymes activity may be the result of enriching the soil with an additional pool of enzymes present in sediments, as well as providing organic matter as a source of carbon and nutrients stimulating the growth of soil microorganisms [54]. The rapid decrease in Dha activity observed in our study may be the result of an intensive mineralization of sewage sludge at the beginning of the experiment and it could be associated with reduction of readily available biodegradable components, which was also noted by Frąc et al. [55] and Marschner [56].
The abundance of microorganisms (bacteria and fungi) is a key indicator of soil health and fertility. Changes in biodiversity and the structure of microorganisms may determine the correctness of soil processes [57]. According to Gomes et al. [58] different microbial groups may dominate in soils from different locations and management practices. The type of soil is one of the main factors that determine the abundance and diversity of bacteria and fungi in soil [57].
Our results showed variable results for bacterial and fungal abundance determined by the culture-dependent method depending on soil amendments (SS and/or GL), and the type of soil and sampling time. It was shown that the number of bacteria in the soil treated with SS and SS + GL decreased significantly with the duration of the experiment, and then the number of fungi increased. Importantly, the number of bacteria in the final stage of the soil studies with GL was lower than in the control, but it was not synonymous with an increase in the number of fungi. Additionally, in the MS, significant differences in the number of fungi were found depending on the sampling date (mainly in SS and SS + GL). According to Arora and Sahni [20], GL may influence on an increase in the number of fungi and the decrease in the number of bacteria, which correspond to our results for both, MS and OS. On the other hand, the research of Vázquez et al. [2] showed a negative effect of GL on the number of fungi determined by the culture-depended method one week after the application of the herbicide.
In this research, the t-RFLP method was applied to evaluate changes in biodiversity of microbial community structure under the influence of sewage sludge and glyphosate. It is one of the fingerprint methods that allows for quick detection of trends in changes in the structure of soil microflora. Although it is an indirect biodiversity approach and not as detailed as the NGS method, it is still used by many scientists to rapidly analyze the dynamics of microbial structure changes in soils treated with pesticides and sewage sludge [15,27,50,59,60]. There are also limitations to this method, which include, i.e., selection of appropriate primers, the use of various restriction enzymes and low phylogenetic specificity [59]. The results obtained in the tRFLP analysis can be expressed using ecological indicators such as the Shannon diversity index.
We observed that soil amendments with sewage sludge and glyphosate led to the shift in the composition of bacterial and fungal community, which was indicated by PCA and PERMANOVA analyses, Jaccard similarity index calculation and Venn diagrams. According to earlier data, the introduction of various substances to soils changes the autochthonous microflora and modifies soil processes [23,50]. The tRFs molecular patterns obtained in our research confirm the hypothesis that the application of sewage sludge and glyphosate to soil may determine its unique genetic profile, both in terms of bacteria and fungi. Venn diagrams also confirm this hypothesis. This is also related to the obtained Jaccard similarity results, according to which the most similarity in the presence of bacterial tRFs to the control was in the GL-treated MS. Moreover, it was found that some restriction fragments of the same length occur in all research variants, which may indicate the resistance of some common bacteria and fungi to the changes applied. As reported in the literature, both sewage sludge and glyphosate can be a source of readily available carbon, nitrogen and phosphorus for soil microorganisms, which justifies the presence of the same bacterial and fungal tRFs in all treatments [23,55]. After analyzing the Shannon biodiversity index calculated for bacterial and fungal tRFs, it was found that the greatest changes in biodiversity occurred in the second sampling date and mainly concerned soils treated with SS and SS + GL. Depending on the type of soil, the H ‘index increased or decreased as compared to the control. The reduction in the Shannon index can be explained by the adaptive stress of microorganisms after the application of sludge and glyphosate and the death of less resistant species [5,7]. Additionally, as reported by Miguel et al. [30] the reduction of the diversity of microorganisms occurs faster in soil enriched with sewage sludge than in untreated soil. In turn, the increase in the diversity index may be related to the supply of a new pool of microorganisms to soil along with the sediment, as well as the promotion of native microflora as a result of supplying the soil with nutrients necessary for microorganisms (also after the introduction of GL), which can thus stimulate the growth of even more demanding species [7,61]. The high diversity index in SS + GL soils can be explained by the fact that consortia of microorganisms present in sewage sludge may have the ability to degrade herbicides due to acclimatization to organic pollutants available in sewage and sludge, which was also concluded by Wang et al. [62].
According to Frąc et al. [63] the appropriate mutual structure of the occurrence of fungi and bacteria determines the proper functionality of entire soil ecosystem. In our study it was found that in both tested soils in the GL and SS + GL after 144 h and 240 h variants, the Shannon diversity coefficients calculated for fungi were higher than for bacteria which was also noticed by Singh et al. [16].
In the current study, it was also noticed that exogenous compounds introduced into the soil in the form of SS influenced to a greater extent on the growth of the diversity of bacteria than of fungi. This is in line with the results obtained by Suhadolc et al. [31], which indicated significant changes in the bacterial community under the influence of organic amendments as opposed to fungi.
Differences in biodiversity and the structure of bacteria and fungi occurrence in the investigated MS and OS due to the applied amendments may result primarily from its origin and properties such as: pH, texture, organic matter amount, humidity, nutrient status. Sadet et al. [57] and Mącik et al. [23] reported that, the main drive determining the abundance and diversity of soil microorganisms, regardless of the treatments used, is the type of soil.
Geisser et al. [64] state that in short- term experiments, a significant impact of the application of organic components on the soil microbiome was not always observed. However, it should be emphasized that the response of microorganisms to changes in environmental properties differs depending on the conducted study, and one of the most important factors is the type of soil and the condition of the experiment (laboratory or field scale), as well as the period and research methods used. The consequence of this is the difficulty of comparing and discussing the obtained research results [15,31,57].
When analyzing the impact of glyphosate on soil quality, it is also important that its half-lives in soil vary from 0.8 to 151 days depending on the type of soil and its properties, which may increase the risk of long-term environmental pollution, including the impact on soil biological activity and soil microbiome [4].

4.3. Relation of TP Content in MS and OS with Biological Parameters

The introduction of phosphorus to the soil together with sewage sludge, on the one hand, increases the pool of this element in the soil, and on the other hand, it may affect the changes in biological properties of soils, improving the conditions for the growth of soil microorganisms and their activity [28,50]. Moreover, the literature data show that the application of glyphosate to soils also increases the amount of phosphorus in the soil, because this herbicide is a source of inorganic P as a product of pyrophosphate hydrolysis [32]. However, our research did not show a significant effect of the introduction of GL to the soil on the TP content. As presented by Sun et al. [32], the dynamics of the biological P cycle derived originally from soil and GL are similar, but the microorganisms are more efficient in terms of the use of glyphosate-derived phosphorus compounds.
In our research, both in MS and OS, positive correlations with the number of bacteria and fungi, as well as with the activity of Dha and Alp and TP content were obtained. According to Houben et al. [44] phosphorus released into the soil from sewage sludge as a result of dissolving non-organic forms and mineralization of organic P may modify soil properties, including increasing the activity of phosphatases. The positive correlations obtained in our study confirm this thesis. In general, phosphatases catalyze the hydrolysis of organic and it turns out that the organic P is the most important fraction regulating the activity of phosphatases in soil [65]. The transformation of organic P forms and the accompanying enzymatic reactions take place with the participation of microorganisms, and their intensity depends on the quantity and quality of microorganisms in the soil.
In our research, the correlation analysis showed a positive effect of the TP content on the number of bacteria, which at the same time may mean their beneficial effect on the phosphorus circulation in the soil. According to Lin et al. [66], the increase in phosphatase activity may also be associated with the stimulation of the growth of microbial biomass, which was not confirmed by our research. Moreover, as pointed out by Lang et al. [67] and Li et al. [68] the fungal population is more sensitive to changes in soil properties and the addition of P than bacteria. This is confirmed by the positive correlations of the TP content and the number of bacteria, while there was no significant correlation with the number of fungi and the TP content. Additionally, the application of SS as a phosphorus source resulted in an increase in the amount of bacterial tRFs patterns in the genetic profile, which may correspond to a greater number of bacterial species. A similar tendency was detected by Banerjee et al. [69]. Furthermore, phosphorus from organic materials may affect the diversity and structure of microorganisms (especially fungi), which was not shown by correlation analysis of the obtained results with the Shannon diversity index calculated for bacteria and fungi [69].
The results of our research also indicate that the content of TP in the soil positively influenced the presence of some bacterial or fungal patterns of tRFs (bacteria: tRF: 284 bp, 281 bp; fungi: tRF 243 bp), which could identify specific taxa involved in decomposition and recycling of phosphorus from sewage sludge and glyphosate. According to the literature data, among the population of bacteria actively involved in the transformation of phosphorus, among others, genera of Pseudomonas, Bacillus, Paenibacillus, Mortierella, Nitrosomonas and Thiobacillus, while fungi may represent species from genera of Penicillum, Aspergillus, Geastrum, Chaetomium, Fusarium and Mycobacterium [23,67,69,70].

5. Conclusions

In the presented studies, we showed that the application of GL to soils had a significant impact on the communities of soil microorganisms in terms of its community composition and modified the enzymatic activity of soils. The treatment of soils with GL modified the number of the studied groups of microorganisms in the soil and changed the activity of the tested enzymes. We found that GL can reduce the number of bacteria and at the same time increase the number of fungi. In addition, changes in the number of microorganisms and soil activity were accompanied by changes in the biodiversity of the bacterial community, which varied depending on the sampling time and studied soil.
Into soil application of sewage sludge as a material, which improves the quality of soil exposed to GL, increased the TP content and the Acp activity in soil with a higher TOC content. Moreover, the simultaneous treatment of soils with SS and GL increased the richness of bacterial tRFs as compared to GL. In MS soil with SS + GL, an increase in bacterial diversity was observed, while in MS and OS, the diversity of the fungal population increased as compared to soil with GL. In addition, it was shown that the content of TP, the source of which is SS in the soil, had a positive effect on the number of bacteria, Acp, Alp and Dha activity, which confirms the legitimacy of using sewage sludge as a valuable organic material that improves the quality of soils.
In the perspective of further research, it is necessary to explain the dynamics of changes in the microbial community after disturbances resulting from GL application. In addition, it is necessary to focus on answering the question of what are the long-term effects of the use of both, sewage sludge and glyphosate on the biological parameters discussed in this paper. It could be the result of future research conducted in the long-term and field scale. Moreover, the focus should remain on a deeper understanding of the above-mentioned issues in soil with a high content of TOC and considering the quality of organic matter present in the soil.

Author Contributions

Conceptualization, U.W., E.W. and B.Ł.; methodology, U.W. and E.W.; investigation, U.W. and E.W.; writing—original draft preparation, U.W.; writing—review and editing, E.W., A.J.-T. and B.Ł.; visualization, U.W. and E.W. All authors have read and agreed to the published version of the manuscript.

Funding

The research was carried out as part of the project No. WZ/WB-IIS/3/2019 at the Białystok University of Technology and financed from a research subsidy provided by the Minister of Education and Science.

Data Availability Statement

Not applicable.

Conflicts of Interest

The authors declare no conflict of interest.

Abbreviations

TPtotal phosphorus
Alpalkaline phosphatase
Acpacid phosphatase
Dhadehydrogenases
EPSP5-endolpyruvate shikimoyl-3-phosphate synthase
SSsewage sludge
GLglyphosate
DT50half-life persistent
t-RFLPterminal restriction fragment length polymorphism
TOCtotal organic carbon
OMorganic matter
ATPadenosine triphosphate
CTPcytidine triphosphate
GTPguanosine triphosphate
USDAThe U.S. Department of Agriculture
TTC2,3,5-triphenyltetrazolium chloride
p-NPp-nitrophenol
DNAdeoxyribonucleic acid
6FAM6-carboxyfluorescein
ITSthe internal transcribed spacer
ANOVAanalysis of variance
PCAPrincipal component analysis
tRFsterminal restriction fragments
PERMANOVAPermutational multivariate analysis of variance
CFUcolony forming unit
bpbase of pairs
H’Shannon diversity index
AMPAaminomethylphosphonic acid
MSloamy sand soil
OSloamy sand soil with a higher amount of TOC

References

  1. Gianessi, L.P. The Increasing Importance of Herbicides in Worldwide Crop Production. Pest Manag. Sci. 2013, 69, 1099–1105. [Google Scholar] [CrossRef]
  2. Vázquez, M.; Moreno, M.; Amodeo, M.; Bianchinotti, M. Effects of Glyphosate on Soil Fungal Communities: A Field Study. Rev. Argent. Microbiol. 2021, 1–10, in press. [Google Scholar] [CrossRef]
  3. Rajmohan, K.S.; Chandrasekaran, R.; Varjani, S. A Review on Occurrence of Pesticides in Environment and Current Technologies for Their Remediation and Management. Indian J. Microbiol. 2020, 60, 125–138. [Google Scholar] [CrossRef]
  4. Bai, S.H.; Ogbourne, S.M. Glyphosate: Environmental Contamination, Toxicity and Potential Risks to Human Health via Food Contamination. Environ. Sci. Pollut. Res. 2016, 23, 18988–19001. [Google Scholar] [CrossRef]
  5. Kaczynski, P.; Lozowicka, B.; Wolejko, E.; Iwaniuk, P.; Konecki, R.; Dragowski, W.; Lozowicki, J.; Amanbek, N.; Rusilowska, J.; Pietraszko, A. Complex Study of Glyphosate and Metabolites Influence on Enzymatic Activity and Microorganisms Association in Soil Enriched with Pseudomonas Fluorescens and Sewage Sludge. J. Hazard. Mater. 2020, 393, 122443. [Google Scholar] [CrossRef]
  6. Sang, Y.; Mejuto, J.-C.; Xiao, J.; Simal-Gandara, J. Assessment of Glyphosate Impact on the Agrofood Ecosystem. Plants 2021, 10, 405. [Google Scholar] [CrossRef] [PubMed]
  7. Grube, M.; Kalnenieks, U.; Muter, O. Metabolic Response of Bacteria to Elevated Concentrations of Glyphosate-Based Herbicide. Ecotoxicol. Environ. Saf. 2019, 173, 373–380. [Google Scholar] [CrossRef] [PubMed]
  8. EFSA Conclusion on the peer review of the pesticide risk assessment of the active substance glyphosate. EFSA J. 2015, 13, 4302.
  9. Md. Meftaul, I.; Venkateswarlu, K.; Dharmarajan, R.; Annamalai, P.; Asaduzzaman, M.; Parven, A.; Megharaj, M. Controversies over Human Health and Ecological Impacts of Glyphosate: Is It to Be Banned in Modern Agriculture? Environ. Pollut. 2020, 263, 114372. [Google Scholar] [CrossRef]
  10. Wolmarans, K.; Swart, W.J. Influence of Glyphosate, Other Herbicides and Genetically Modified Herbicide-Resistant Crops on Soil Microbiota: A Review. S. Afr. J. Plant Soil 2014, 31, 177–186. [Google Scholar] [CrossRef]
  11. Arora, S.; Arora, S.; Sahni, D.; Sehgal, M.; Srivastava, D.S.; Singh, A. Pesticides Use and Its Effect on Soil Bacteria and Fungal Populations, Microbial Biomass Carbon and Enzymatic Activity. Curr. Sci. 2019, 116, 643. [Google Scholar] [CrossRef]
  12. Khalid, S.; Shahid, M.; Murtaza, B.; Bibi, I.; Natasha; Asif Naeem, M.; Niazi, N.K. A Critical Review of Different Factors Governing the Fate of Pesticides in Soil under Biochar Application. Sci. Total Environ. 2020, 711, 134645. [Google Scholar] [CrossRef]
  13. Harrison, P.A.; Berry, P.M.; Simpson, G.; Haslett, J.R.; Blicharska, M.; Bucur, M.; Dunford, R.; Egoh, B.; Garcia-Llorente, M.; Geamănă, N.; et al. Linkages between Biodiversity Attributes and Ecosystem Services: A Systematic Review. Ecosyst. Serv. 2014, 9, 191–203. [Google Scholar] [CrossRef] [Green Version]
  14. Cornea, C.P.; Voaideş, C.; Ciuca, M.; Stan, V.; Gament, E.; Razec, I.; Duşa, M. Molecular Methods for Assessement the Bacterial Communities from Different Type of Soils in Romania. Not. Bot. Horti Agrobot. Cluj-Napoca 2011, 39, 64. [Google Scholar] [CrossRef] [Green Version]
  15. Du, Z.; Zhu, Y.; Zhu, L.; Zhang, J.; Li, B.; Wang, J.; Wang, J.; Zhang, C.; Cheng, C. Effects of the Herbicide Mesotrione on Soil Enzyme Activity and Microbial Communities. Ecotoxicol. Environ. Saf. 2018, 164, 571–578. [Google Scholar] [CrossRef]
  16. Singh, S.; Kumar, V.; Gill, J.P.K.; Datta, S.; Singh, S.; Dhaka, V.; Kapoor, D.; Wani, A.B.; Dhanjal, D.S.; Kumar, M.; et al. Herbicide Glyphosate: Toxicity and Microbial Degradation. Int. J. Environ. Res. Public Health 2020, 17, 7519. [Google Scholar] [CrossRef] [PubMed]
  17. Wołejko, E.; Jabłońska-Trypuć, A.; Wydro, U.; Butarewicz, A.; Łozowicka, B. Soil Biological Activity as an Indicator of Soil Pollution with Pesticides—A Review. Appl. Soil Ecol. 2020, 147, 103356. [Google Scholar] [CrossRef]
  18. Adetunji, A.T.; Lewu, F.B.; Mulidzi, R.; Ncube, B. The Biological Activities of β-Glucosidase, Phosphatase and Urease as Soil Quality Indicators: A Review. J. Soil Sci. Plant Nutr. 2017, 17, 794–807. [Google Scholar] [CrossRef] [Green Version]
  19. Łozowicka, B.; Wołejko, E.; Kaczyński, P.; Konecki, R.; Iwaniuk, P.; Drągowski, W.; Łozowicki, J.; Tujtebajeva, G.; Wydro, U.; Jablońska-Trypuć, A. Effect of Microorganism on Behaviour of Two Commonly Used Herbicides in Wheat/Soil System. Appl. Soil Ecol. 2021, 162, 103879. [Google Scholar] [CrossRef]
  20. Arora, S.; Sahni, D. Pesticides Effect on Soil Microbial Ecology and Enzyme Activity—An Overview. J. Appl. Nat. Sci. 2016, 8, 1126–1132. [Google Scholar] [CrossRef] [Green Version]
  21. Sun, Y.; Goll, D.S.; Ciais, P.; Peng, S.; Margalef, O.; Asensio, D.; Sardans, J.; Peñuelas, J. Spatial Pattern and Environmental Drivers of Acid Phosphatase Activity in Europe. Front. Big Data 2020, 2, 1–13. [Google Scholar] [CrossRef] [Green Version]
  22. Maroušek, J.; Maroušková, A.; Zoubek, T.; Bartoš, P. Economic Impacts of Soil Fertility Degradation by Traces of Iron from Drinking Water Treatment. Environ. Dev. Sustain. 2021, 1–10. [Google Scholar] [CrossRef]
  23. Mącik, M.; Gryta, A.; Sas-Paszt, L.; Frąc, M. The Status of Soil Microbiome as Affected by the Application of Phosphorus Biofertilizer: Fertilizer Enriched with Beneficial Bacterial Strains. Int. J. Mol. Sci. 2020, 21, 8003. [Google Scholar] [CrossRef] [PubMed]
  24. Malhotra, H.; Vandana; Sharma, S.; Pandey, R. Phosphorus nutrition: Plant growth in response to deficiency and excess. In Plant Nutrients and Abiotic Stress Tolerance; Hasanuzzaman, M., Fujita, M., Oku, H., Nahar, K., Hawrylak-Nowak, B., Eds.; Springer: Singapore, 2018; pp. 171–190. ISBN 9789811090448. [Google Scholar]
  25. Taliman, N.A.; Dong, Q.; Echigo, K.; Raboy, V.; Saneoka, H. Effect of Phosphorus Fertilization on the Growth, Photosynthesis, Nitrogen Fixation, Mineral Accumulation, Seed Yield, and Seed Quality of a Soybean Low-Phytate Line. Plants 2019, 8, 119. [Google Scholar] [CrossRef] [PubMed] [Green Version]
  26. Wydro, U.; Jabłońska-Trypuć, A.; Hawrylik, E.; Butarewicz, A.; Rodziewicz, J.; Janczukowicz, W.; Wołejko, E. Heavy Metals Behavior in Soil/Plant System after Sewage Sludge Application. Energies 2021, 14, 1584. [Google Scholar] [CrossRef]
  27. Ondreičková, K.; Gubišová, M.; Piliarová, M.; Horník, M.; Matušinský, P.; Gubiš, J.; Klčová, L.; Hudcovicová, M.; Kraic, J. Responses of Rhizosphere Fungal Communities to the Sewage Sludge Application into the Soil. Microorganisms 2019, 7, 505. [Google Scholar] [CrossRef] [Green Version]
  28. Singh, R.P.; Agrawal, M. Potential Benefits and Risks of Land Application of Sewage Sludge. Waste Manag. 2008, 28, 347–358. [Google Scholar] [CrossRef]
  29. Jezierska-Tys, S.; Frąc, M.; Tys, J. Microbiological Hazards Resulting from Application of Dairy Sewage Sludge: Effects on Occurrence of Pathogenic Microorganisms in Soil. J. Toxicol. Environ. Health Part A 2010, 73, 1194–1201. [Google Scholar] [CrossRef] [PubMed]
  30. Miguel, N.; Sarasa, J.; López, A.; Gómez, J.; Mosteo, R.; Ormad, M.P. Study of Evolution of Microbiological Properties in Sewage Sludge-Amended Soils: A Pilot Experience. Int. J. Environ. Res. Public Health 2020, 17, 6696. [Google Scholar] [CrossRef] [PubMed]
  31. Suhadolc, M.; Schroll, R.; Hagn, A.; Dörfler, U.; Schloter, M.; Lobnik, F. Single Application of Sewage Sludge–Impact on the Quality of an Alluvial Agricultural Soil. Chemosphere 2010, 81, 1536–1543. [Google Scholar] [CrossRef]
  32. Sun, M.; Li, H.; Jaisi, D.P. Degradation of Glyphosate and Bioavailability of Phosphorus Derived from Glyphosate in a Soil-Water System. Water Res. 2019, 163, 114840. [Google Scholar] [CrossRef]
  33. Tabatabai, M.A. Soil enzymes. In Methods of Soil Analysis: Microbiological and Biochemical Properties; Weaver, R.W., Angle, J.S., Botttomley, P.S., Eds.; Soil Science Society of America: Madison, WI, USA, 1994. [Google Scholar]
  34. Margesin, R. Acid and Alkaline Phosphomonoesterase Activity with the Substrate p-Nitrophenyl Phosphate. In Methods in Soil Biology; Schinner, F., Öhlinger, R., Kandeler, E., Margesin, R., Eds.; Springer: Berlin/Heidelberg, Germany, 1996. [Google Scholar]
  35. Mattana, S.; Chelinho, S.; Sousa, J.P.; Alcañiz, J.M.; Domene, X. Nonylphenol Causes Shifts in Microbial Communities and Nitrogen Mineralization in Soil Microcosms. Ecotoxicol. Environ. Saf. 2019, 181, 395–403. [Google Scholar] [CrossRef]
  36. Available online: http://inismor.ucd.ie/talign/ (accessed on 10 November 2021).
  37. Available online: https://bioinfogp.cnb.csic.es/tools/venny/ (accessed on 10 November 2021).
  38. Fredriksson, N.J.; Hermansson, M.; Wilén, B.-M. Tools for T-RFLP Data Analysis Using Excel. BMC Bioinform. 2014, 15, 361. [Google Scholar] [CrossRef] [Green Version]
  39. Wierzbowska, J.; Sienkiewicz, S.; Zalewska, M.; Żarczyński, P.; Krzebietke, S. Phosphorus Fractions in Soil Fertilised with Organic Waste. Environ. Monit. Assess. 2020, 192, 315. [Google Scholar] [CrossRef]
  40. Stávková, J.; Maroušek, J. Novel Sorbent Shows Promising Financial Results on P Recovery from Sludge Water. Chemosphere 2021, 276, 130097. [Google Scholar] [CrossRef] [PubMed]
  41. Kahiluoto, H.; Kuisma, M.; Ketoja, E.; Salo, T.; Heikkinen, J. Phosphorus in Manure and Sewage Sludge More Recyclable than in Soluble Inorganic Fertilizer. Environ. Sci. Technol. 2015, 49, 2115–2122. [Google Scholar] [CrossRef] [Green Version]
  42. Zuo, W.; Gu, C.; Zhang, W.; Xu, K.; Wang, Y.; Bai, Y.; Shan, Y.; Dai, Q. Sewage Sludge Amendment Improved Soil Properties and Sweet Sorghum Yield and Quality in a Newly Reclaimed Mudflat Land. Sci. Total Environ. 2019, 654, 541–549. [Google Scholar] [CrossRef]
  43. Nobile, C.; Houben, D.; Michel, E.; Firmin, S.; Lambers, H.; Kandeler, E.; Faucon, M.-P. Phosphorus-Acquisition Strategies of Canola, Wheat and Barley in Soil Amended with Sewage Sludges. Sci. Rep. 2019, 9, 14878. [Google Scholar]
  44. Houben, D.; Michel, E.; Nobile, C.; Lambers, H.; Kandeler, E.; Faucon, M.-P. Response of Phosphorus Dynamics to Sewage Sludge Application in an Agroecosystem in Northern France. Appl. Soil Ecol. 2019, 137, 178–186. [Google Scholar] [CrossRef]
  45. Kończak, M.; Oleszczuk, P. Application of Biochar to Sewage Sludge Reduces Toxicity and Improve Organisms Growth in Sewage Sludge-Amended Soil in Long Term Field Experiment. Sci. Total Environ. 2018, 625, 8–15. [Google Scholar] [CrossRef]
  46. Mohammad, M.J.; Athamneh, B.M. Changes in Soil Fertility and Plant Uptake of Nutrients and Heavy Metals in Response to Sewage Sludge Application to Calcareous Soils. J. Agron. 2004, 3, 229–236. [Google Scholar] [CrossRef]
  47. de Jonge, H.; de Jonge, L.W.; Jacobsen, O.H.; Yamaguchi, T.; Moldrup, P. Glyphosate Sorption in Soils of Different pH and Phosphorus Content. Soil Sci. 2001, 166, 230–238. [Google Scholar] [CrossRef]
  48. Haney, R.L.; Senseman, S.A.; Hons, F.M.; Zuberer, D.A. Effect of Glyphosate on Soil Microbial Activity and Biomass. Weed Sci. 2000, 48, 89–93. [Google Scholar] [CrossRef]
  49. Kacprzak, M.; Grobelak, A.; Grosser, A.; Napora, A. The Potential of Biosolid Application for the Phytostabilisation of Metals. Desalin. Water Treat. 2014, 52, 3955–3964. [Google Scholar] [CrossRef]
  50. Gryta, A.; Frąc, M.; Oszust, K. Community Shift in Structure and Functions across Soil Profile in Response to Organic Waste and Mineral Fertilization Strategies. Appl. Soil Ecol. 2019, 143, 55–60. [Google Scholar] [CrossRef]
  51. Zhan, H.; Feng, Y.; Fan, X.; Chen, S. Recent Advances in Glyphosate Biodegradation. Appl. Microbiol. Biotechnol. 2018, 102, 5033–5043. [Google Scholar] [CrossRef]
  52. Wołejko, E.; Kaczyński, P.; Łozowicka, B.; Wydro, U.; Borusiewicz, A.; Hrynko, I.; Konecki, R.; Snarska, K.; Dec, D.; Malinowski, P. Dissipation of S-Metolachlor in Plant and Soil and Effect on Enzymatic Activities. Environ. Monit. Assess. 2017, 189, 355. [Google Scholar] [CrossRef] [Green Version]
  53. Alvarenga, P.; Farto, M.; Mourinha, C.; Palma, P. Beneficial Use of Dewatered and Composted Sewage Sludge as Soil Amendments: Behaviour of Metals in Soils and Their Uptake by Plants. Waste Biomass Valorization 2016, 7, 1189–1201. [Google Scholar] [CrossRef]
  54. Picariello, E.; Pucci, L.; Carotenuto, M.; Libralato, G.; Lofrano, G.; Baldantoni, D. Compost and Sewage Sludge for the Improvement of Soil Chemical and Biological Quality of Mediterranean Agroecosystems. Sustainability 2020, 13, 26. [Google Scholar] [CrossRef]
  55. Frąc, M.; Jezierska-Tys, S.; Oszust, K.; Gryta, A.; Pastor, M. Assessment of Microbiological and Biochemical Properties of Dairy Sewage Sludge. Int. J. Environ. Sci. Technol. 2016, 14, 679–688. [Google Scholar] [CrossRef] [Green Version]
  56. Marschner, P. Structure and Function of the Soil Microbial Community in a Long-Term Fertilizer Experiment. Soil Biol. Biochem. 2003, 35, 453–461. [Google Scholar] [CrossRef]
  57. Sadet-Bourgeteau, S.; Houot, S.; Karimi, B.; Mathieu, O.; Mercier, V.; Montenach, D.; Morvan, T.; Sappin-Didier, V.; Watteau, F.; Nowak, V.; et al. Microbial Communities from Different Soil Types Respond Differently to Organic Waste Input. Appl. Soil Ecol. 2019, 143, 70–79. [Google Scholar] [CrossRef]
  58. Gomes, N.C.M.; Landi, L.; Smalla, K.; Nannipieri, P.; Brookes, P.C.; Renella, G. Effects of Cd- and Zn-Enriched Sewage Sludge on Soil Bacterial and Fungal Communities. Ecotoxicol. Environ. Saf. 2010, 73, 1255–1263. [Google Scholar] [CrossRef]
  59. Mossa, A.-W.; Dickinson, M.J.; West, H.M.; Young, S.D.; Crout, N.M.J. The Response of Soil Microbial Diversity and Abundance to Long-Term Application of Biosolids. Environ. Pollut. 2017, 224, 16–25. [Google Scholar] [CrossRef]
  60. Kanissery, R.G.; Welsh, A.; Gomez, A.; Connor, L.; Sims, G.K. Identification of Metolachlor Mineralizing Bacteria in Aerobic and Anaerobic Soils Using DNA-Stable Isotope Probing. Biodegradation 2017, 29, 117–128. [Google Scholar] [CrossRef]
  61. Tarrasón, D.; Ojeda, G.; Ortiz, O.; Alcañiz, J.M. Effects of Different Types of Sludge on Soil Microbial Properties: A Field Experiment on Degraded Mediterranean Soils. Pedosphere 2010, 20, 681–691. [Google Scholar] [CrossRef]
  62. Wang, C.; Zhou, Z.; Liu, H.; Li, J.; Wang, Y.; Xu, H. Application of Acclimated Sewage Sludge as a Bio-Augmentation/Bio-Stimulation Strategy for Remediating Chlorpyrifos Contamination in Soil With/without Cadmium. Sci. Total Environ. 2017, 579, 657–666. [Google Scholar] [CrossRef]
  63. Frąc, M.; Hannula, S.E.; Bełka, M.; Jędryczka, M. Fungal Biodiversity and Their Role in Soil Health. Front. Microbiol. 2018, 9, 707. [Google Scholar] [CrossRef] [Green Version]
  64. Geisseler, D.; Scow, K.M. Long-Term Effects of Mineral Fertilizers on Soil Microorganisms—A Review. Soil Biol. Biochem. 2014, 75, 54–63. [Google Scholar] [CrossRef]
  65. Margalef, O.; Sardans, J.; Fernández-Martínez, M.; Molowny-Horas, R.; Janssens, I.A.; Ciais, P.; Goll, D.; Richter, A.; Obersteiner, M.; Asensio, D.; et al. Global Patterns of Phosphatase Activity in Natural Soils. Sci. Rep. 2017, 7, 1337. [Google Scholar] [CrossRef] [Green Version]
  66. Lin, S.; Wang, S.; Si, Y.; Yang, W.; Zhu, S.; Ni, W. Variations in Eco-Enzymatic Stoichiometric and Microbial Characteristics in Paddy Soil as Affected by Long-Term Integrated Organic-Inorganic Fertilization. PLoS ONE 2017, 12, e0189908. [Google Scholar] [CrossRef]
  67. Lang, M.; Zou, W.; Chen, X.; Zou, C.; Zhang, W.; Deng, Y.; Zhu, F.; Yu, P.; Chen, X. Soil Microbial Composition and PhoD Gene Abundance Are Sensitive to Phosphorus Level in a Long-Term Wheat-Maize Crop System. Front. Microbiol. 2021, 11, 3547. [Google Scholar] [CrossRef] [PubMed]
  68. Li, J.; Li, Z.; Wang, F.; Zou, B.; Chen, Y.; Zhao, J.; Mo, Q.; Li, Y.; Li, X.; Xia, H. Effects of Nitrogen and Phosphorus Addition on Soil Microbial Community in a Secondary Tropical Forest of China. Biol. Fertil. Soils 2014, 51, 207–215. [Google Scholar] [CrossRef]
  69. Banerjee, S.; Kirkby, C.A.; Schmutter, D.; Bissett, A.; Kirkegaard, J.A.; Richardson, A.E. Network Analysis Reveals Functional Redundancy and Keystone Taxa amongst Bacterial and Fungal Communities during Organic Matter Decomposition in an Arable Soil. Soil Biol. Biochem. 2016, 97, 188–198. [Google Scholar] [CrossRef]
  70. Osorio, N.W. Effectiveness of Phosphate Solubilizing Microorganism in Increasing Plant Phosphate Uptake and Growth in Tropical Soils. In Bacteria in Agrobiology: Plant Nutrient Management; Maheshwari, D.K., Ed.; Springer: Berlin/Heidelberg, Germany, 2011; pp. 65–80. ISBN 9783642210617. [Google Scholar]
Figure 1. Effect of GL and SS application on the content of total phosphorus (TP) in studied soils (MS and OS) after 24 h, 144 h and 240 h glyphosate application; C—control, SS—soil with sewage sludge, GL—soil with glyphosate, SS + GL—soil with sewage sludge and glyphosate; error bars represent the standard deviation; the same letters mean non-significant differences between treatments at p < 0.05.
Minerals 11 01423 g001
Figure 2. Effect of GL and SS application on the abundance of soil bacteria and fungi in studied soils (MS and OS) after 24 h, 144 h and 240 h glyphosate application; C—control, SS—soil with sewage sludge, GL—soil with glyphosate, SS + GL—soil with sewage sludge and glyphosate, error bars represent the standard deviation; the same letters above bars mean non-significant differences between treatments estimated by Tukey post hoc test at p < 0.05.
Minerals 11 01423 g002
Figure 3. Effect of GL and SS application on the activity of dehydrogenase (Dha), alkaline phosphatase (Alp) and acid phosphatase (Acp) in studied soils (MS and OS) after 24 h, 144 h and 240 h glyphosate application; C—control, SS—soil with sewage sludge, GL—soil with glyphosate, SS + GL—soil with sewage sludge and glyphosate, error bars represent the standard deviation; the same letters mean non-significant differences between treatments estimated by Tukey post hoc test at p < 0.05.
Minerals 11 01423 g003
Figure 4. Effect of GL and SS application on the relative abundance (%) of terminal restriction fragments (tRFs) obtained after HaeIII digestion for the bacterial and fungal communities in studied soils (MS and OS) after 24 h, 144 h and 240 h glyphosate application; C—control, SS—soil with sewage sludge, GL—soil with glyphosate, SS + GL—soil with sewage sludge and glyphosate.
Minerals 11 01423 g004
Figure 5. The Venn diagrams showing relationships between the terminal restriction fragments (tRFs) obtained for the bacterial and fungal communities in studied soils (MS and OS) after 24 h, 144 h and 240 h glyphosate application; C—control, SS—soil with sewage sludge, GL—soil with glyphosate, SS + GL—soil with sewage sludge and glyphosate.
Minerals 11 01423 g005
Figure 6. The biplots showing relationships between the terminal restriction fragments (tRFs) obtained for the bacterial and fungal communities in studied soils (MS and OS) after 24 h, 144 h and 240 h glyphosate application and selected soil characteristics (number of bacteria/fungi, activity of dehydrogenase (Dha), alkaline phosphatase (Alp), acid phosphatase (Alc); soil total phosphorus content (TP), Shannon diversity index (H’); C—control, SS—soil with sewage sludge, GL—soil with glyphosate, SS + GL—soil with sewage sludge and glyphosate.
Minerals 11 01423 g006
Figure 7. The Pearson’s correlation coefficients between the terminal restriction fragments (tRFs) obtained for the bacterial and fungal communities in studied soils (MS and OS) and selected soil characteristics (number of bacteria/fungi, activity of dehydrogenase (Dha), alkaline phosphatase (Alp) and acid phosphatase (Alc); soil total phosphorus content (TP), Shannon diversity index (H’)); C—control, SS—soil with sewage sludge, GL—soil with glyphosate, SS + GL—soil with sewage sludge and glyphosate; the boxed points correspond with significance correlation at p < 0.05.
Minerals 11 01423 g007
Figure 8. The Jaccard’s and Shannon’s diversity indices based on the bacterial and fungal terminal restriction fragments (tRFs) in studied soils (MS and OS) after 24 h, 144 h and 240 h glyphosate application; C—control, SS—soil with sewage sludge, GL—soil with glyphosate, SS + GL—soil with sewage sludge and glyphosate; *, **, *** indicate significant differences between treatment soil and control estimated by Dunnett test at p < 0.05, p < 0.01 and p < 0.001, respectively; the same letters above bars indicate non-significant differences estimated by Tukey post hoc test at p < 0.05.
Minerals 11 01423 g008
Table 1. The selected properties of two soils (MS and OS) and sewage sludge (SS) used in pot experiment.
CharacteristicsMSOSSS 1
pH7.46.26.9
OM 2 (%)--57.8
TOC 3 (%)5.8410.78-
Sand77.171.3-
Silt20.725.1-
Clay2.23.6-
P (% d.m.)0.030.053.15
Cd, mg/kg d.m.0.130.050.52
Cr, mg/kg d.m.8.24.018.4
Cu, mg/kg d.m.6.73.335
Ni, mg/kg d.m.2.71.85.1
Pb, mg/kg d.m.8.62.310
Zn, mg/kg d.m.2411310
1 The presence of Ascaris sp., Trichuris sp. and Toxocara sp. and Salmonella spp. in sewage sludge was not detected; 2 OM—organic matter; 3 TOC—total organic carbon.
Table 2. Primers used for soil microbial diversity analysis.
PrimerSequencesLength
(Bases)
Tm
(°C)
GC
(%)
8FAGAGTTTGATCCTGGCTCAG2051.850
1389RACGGGCGGTGTGTACAAG1852.661
ITS1-FCTTGGTCATTTAGAGGAAGTAA2249.236
ITS4-RTCCTCCGCTTATTGATATGC2049.745
Table 3. F-values of the pairwise test of PERMANOVA analysis of the Bray–Curtis dissimilarities of bacteria and fungi tRFs in experimental treatments; p-values are based on 9999 permutations.
TreatmentsBacteriaFungi
MSOSMSOS
SS3.55 *6.03 *4.84 *2.71
GL0.593.973.254.71 *
SS + GL1.965.86 *3.934.13
Global F1.906.48 *2.234.33 *
* Correspond to p < 0.05.
Publisher’s Note: MDPI stays neutral with regard to jurisdictional claims in published maps and institutional affiliations.

